1. Introduction
Globally, noticeable progress is realized in the transition to new renewable energy sources. Installed capacity of about 176 GW of renewable energy is added to the global energy production in 2019 [
1], with providing more than 11% of the global electricity generation [
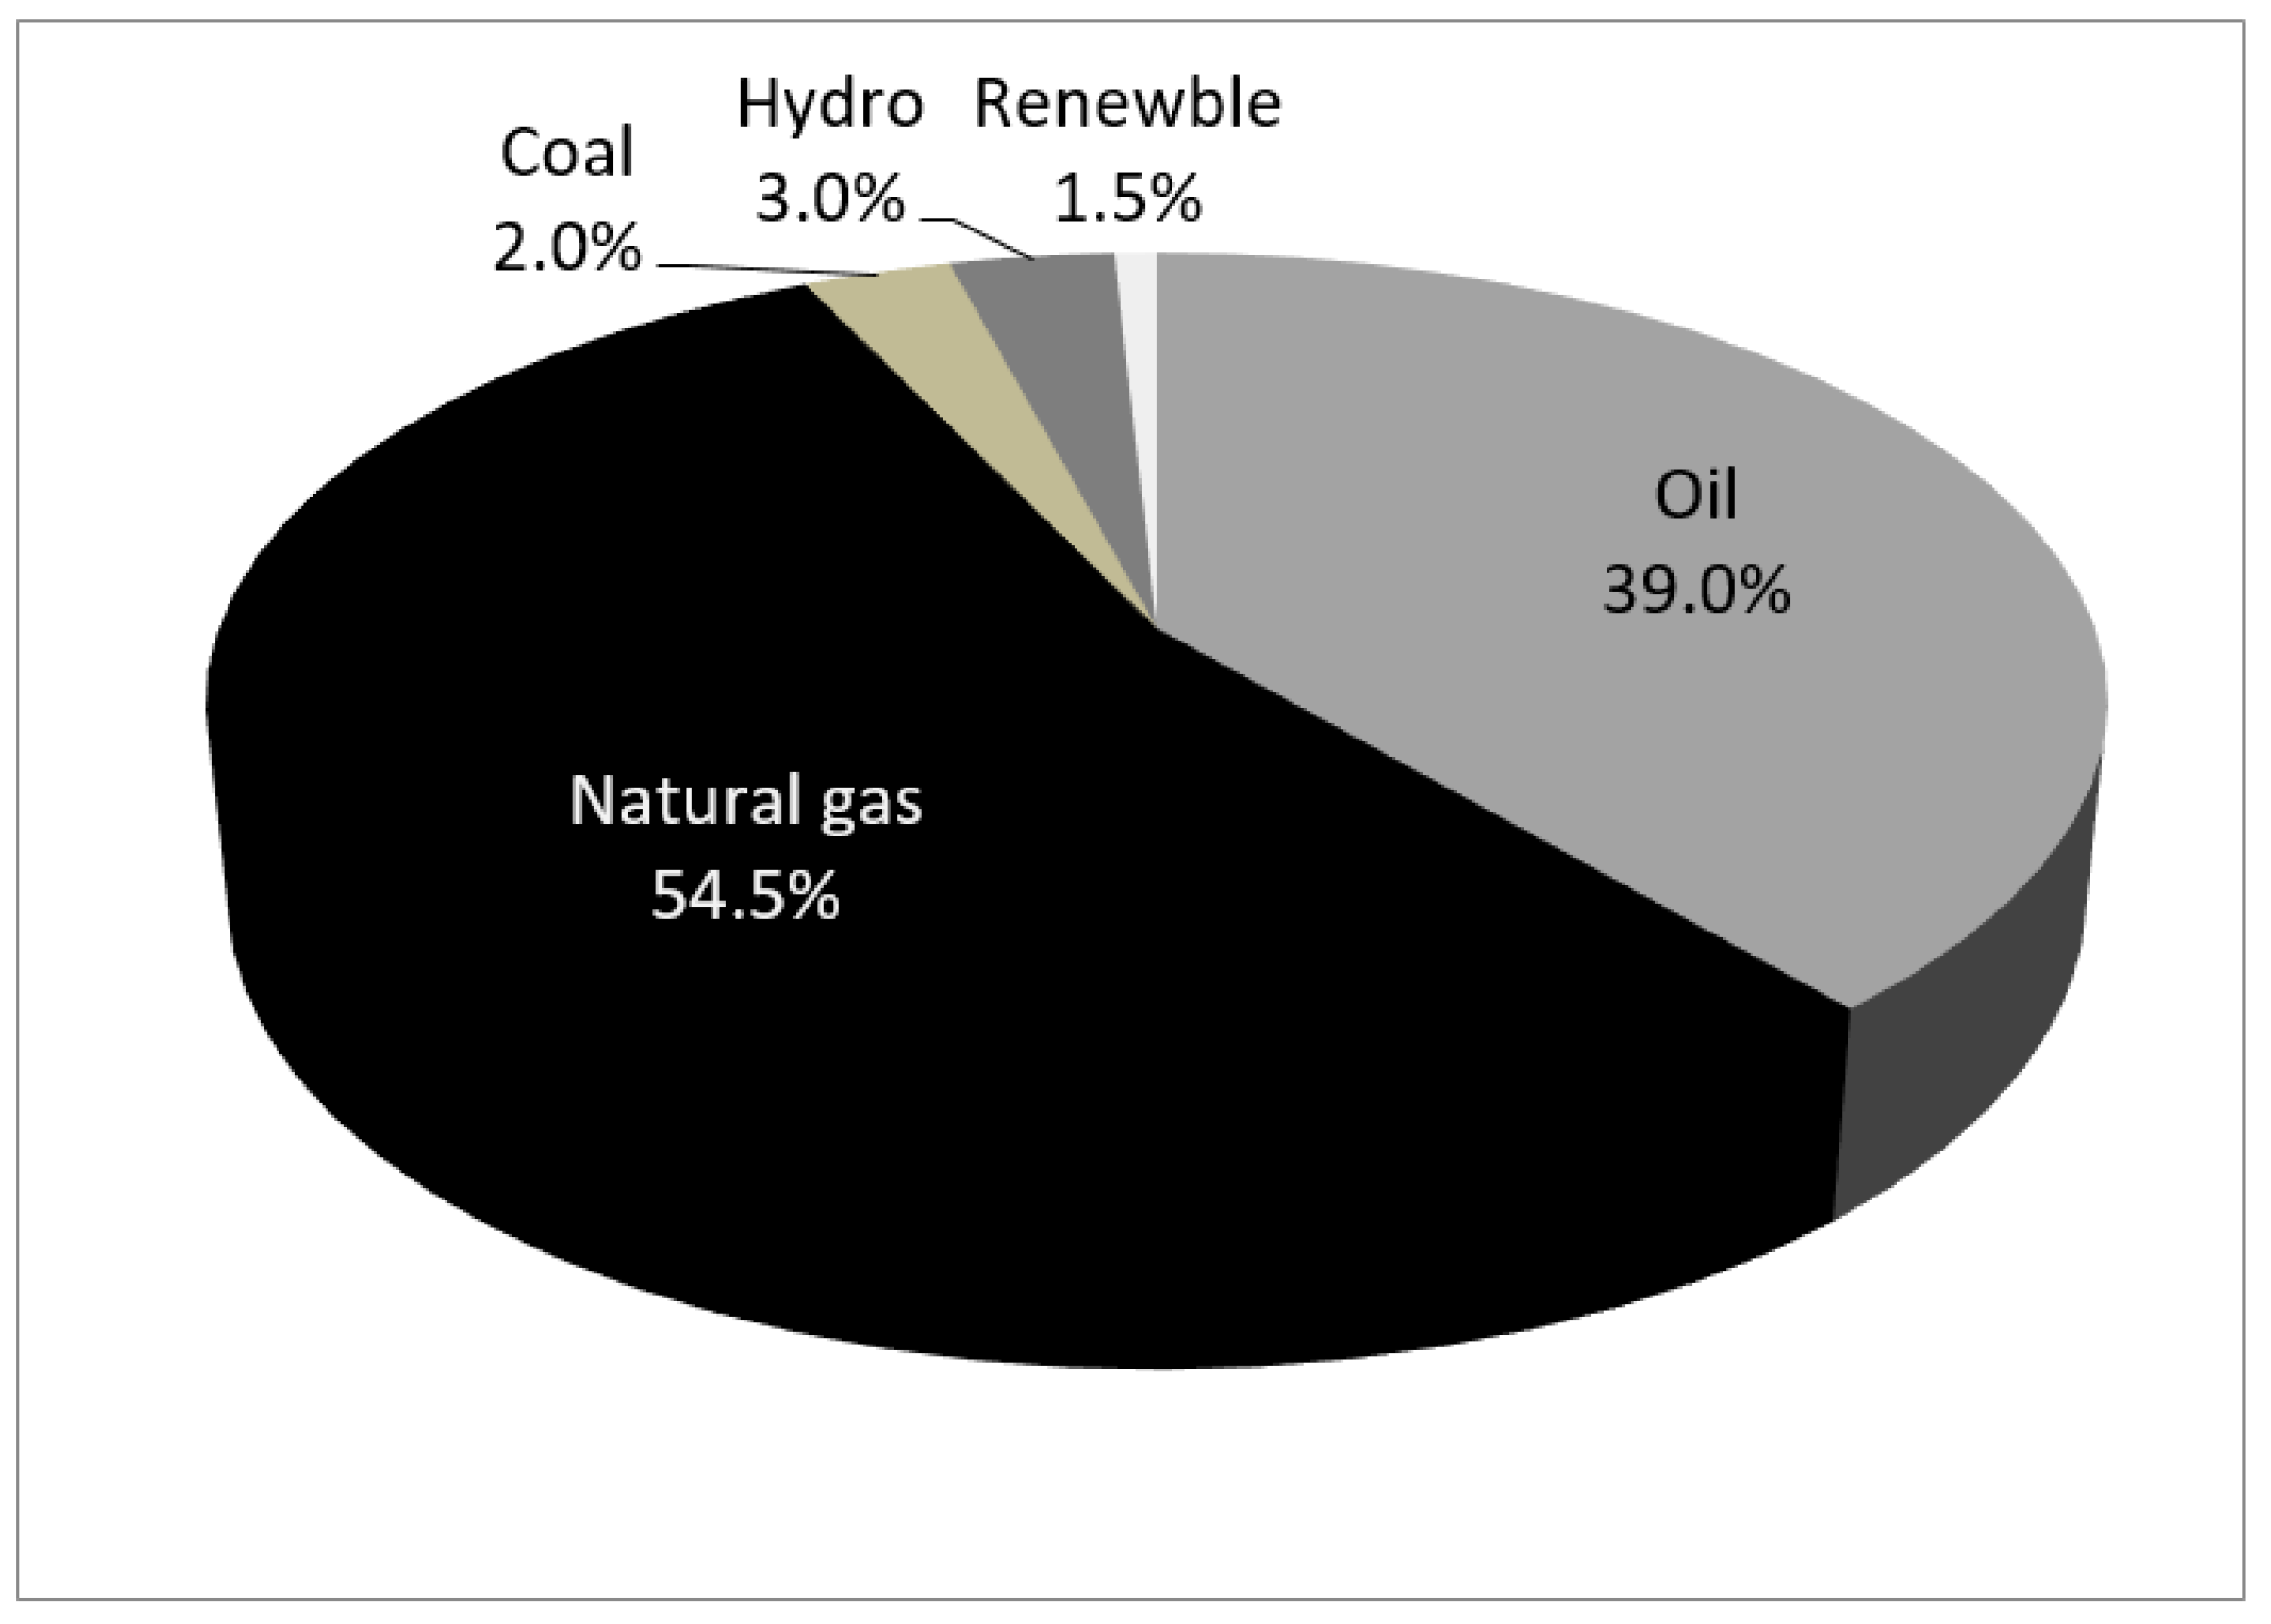
2]. However, the sustainability of energy resources and the use of clean energy is still a major challenge, especially for the developing countries. Therefore, most countries have developed strategic visions that aim to increase the renewable energy share. Egypt, like many developing countries, still relies heavily upon fossil fuels and they account for about 93% of its primary energy consumption in 2019. Renewable energy provided a small contribution of 1.5% in Egypt’s energy mix [
3] (
Figure 1).
Fossil fuel is an expensive imported commodity which has a significant impact on Egypt’s economic burden. Although Egypt is ranked fifth for oil production in Africa with about 600,000 barrels per day [
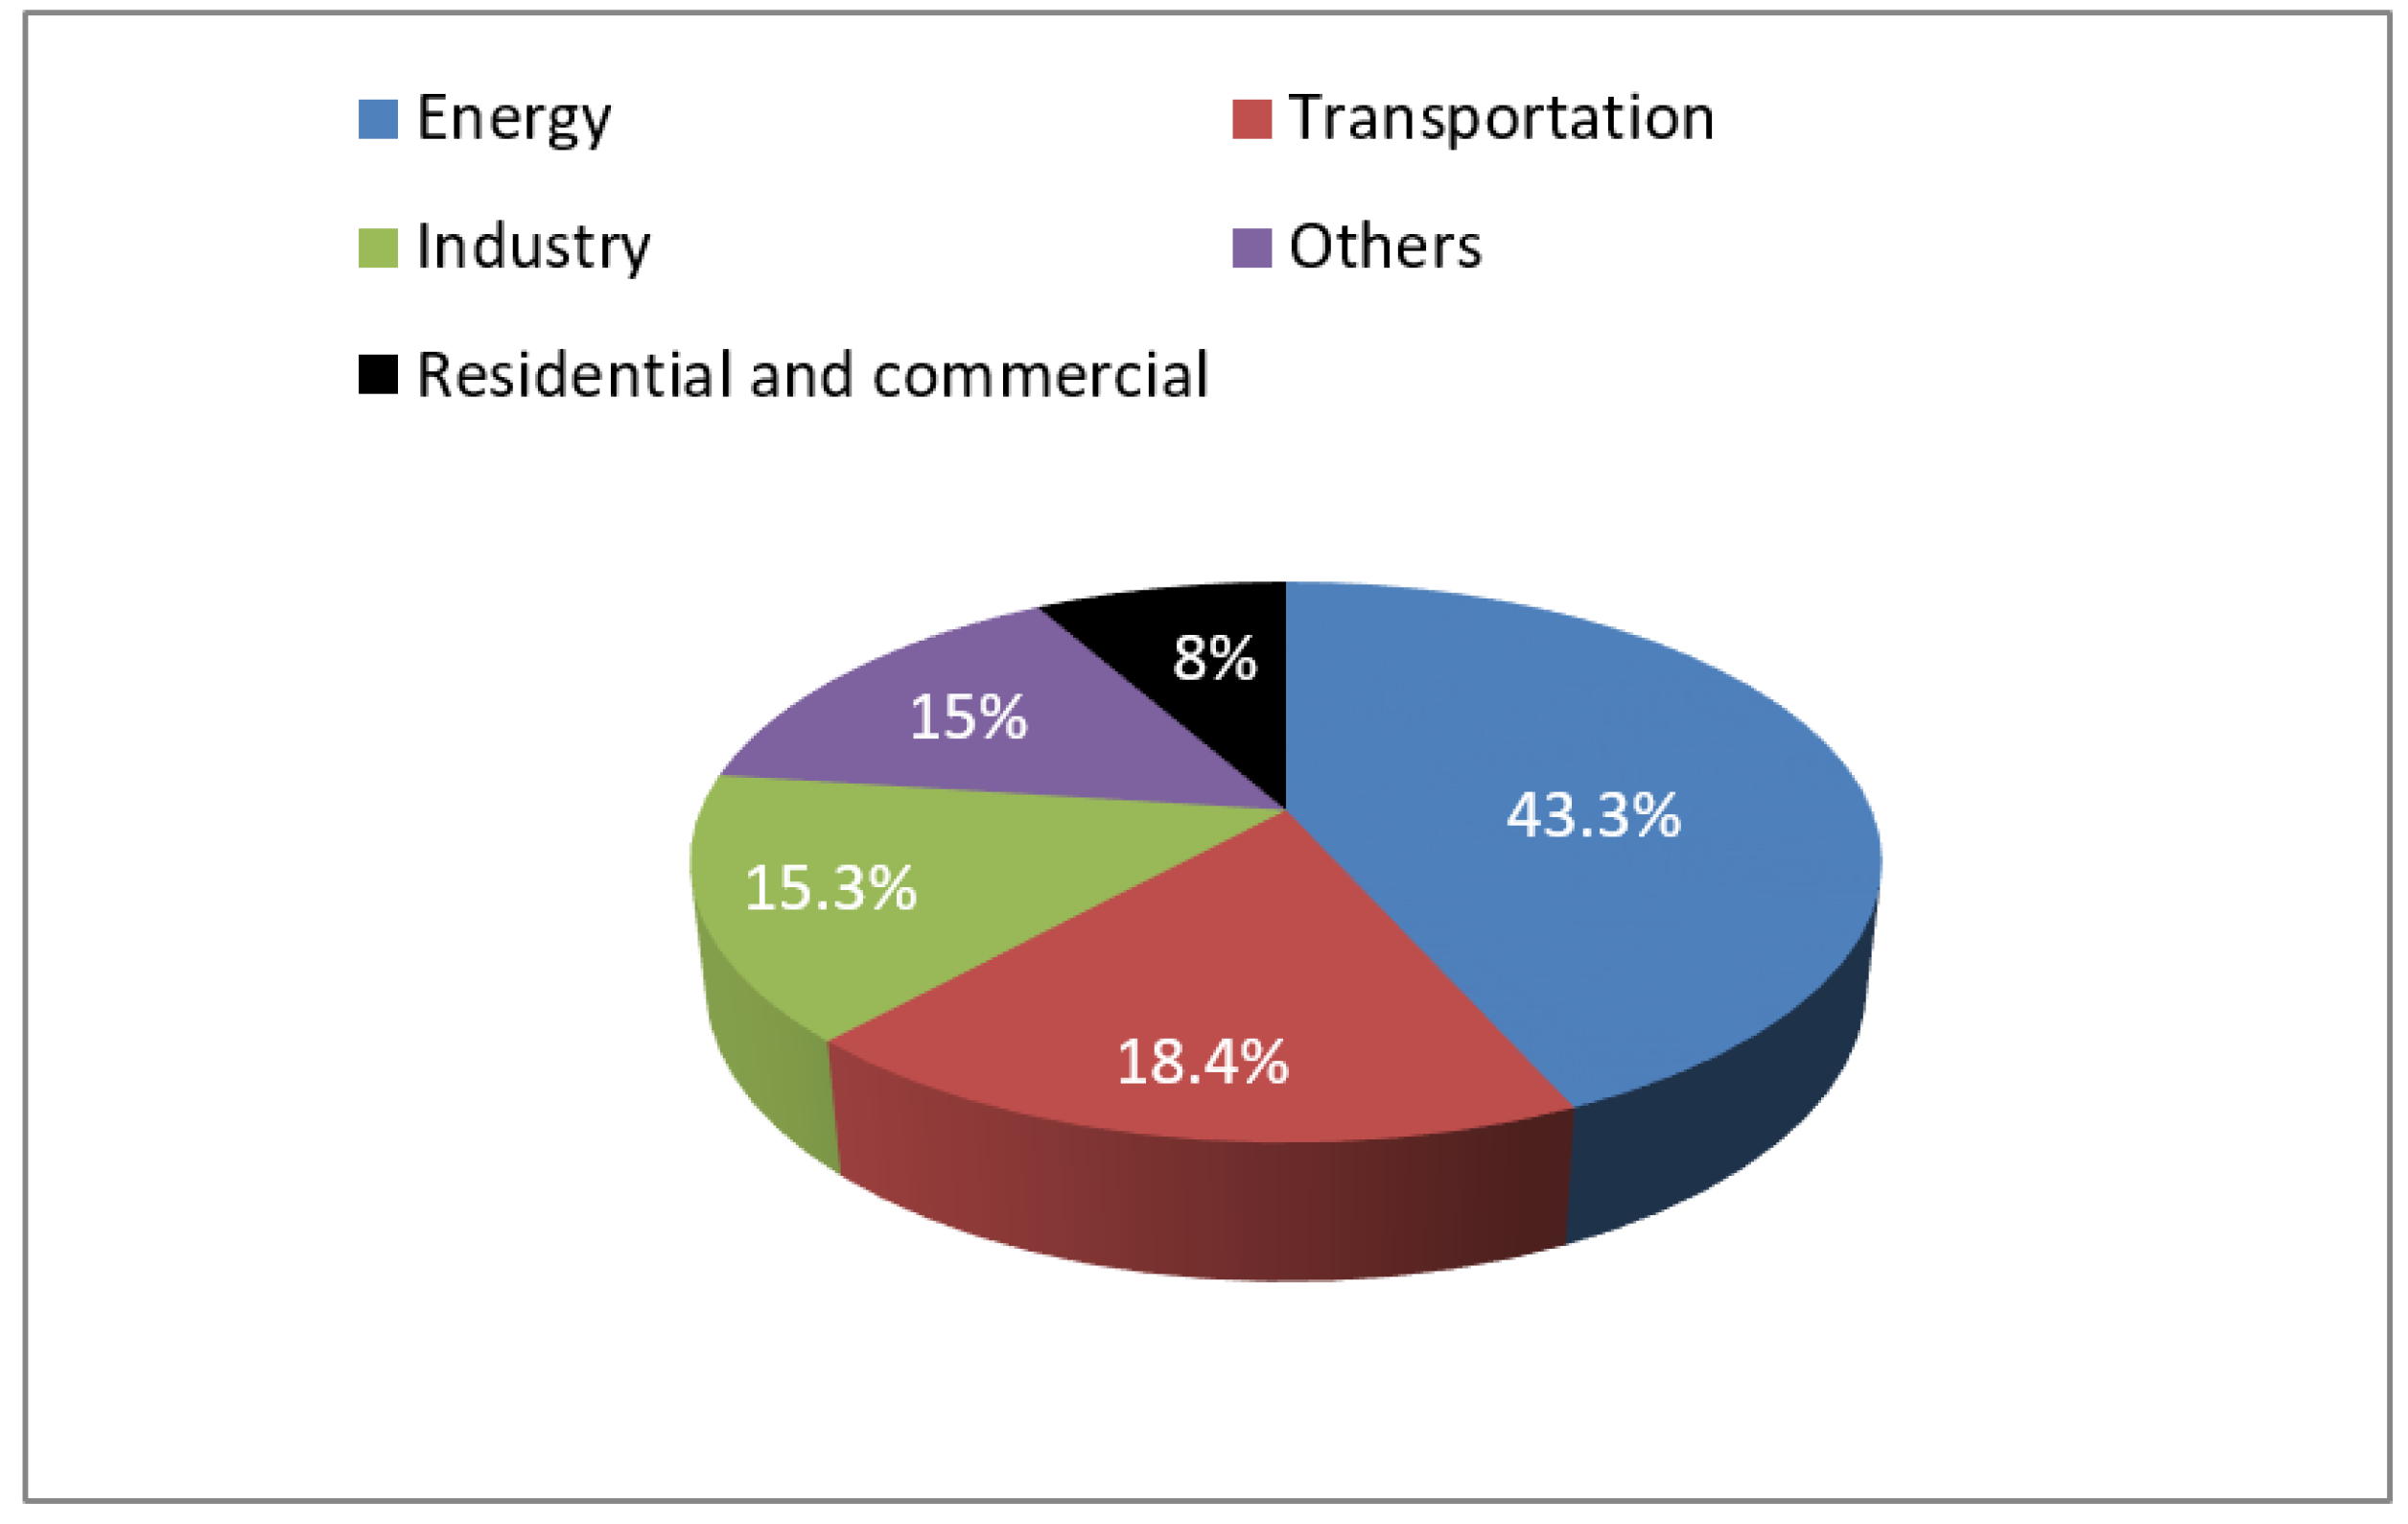
4], it is still the largest importer of fossil fuels in Africa. From an environmental perspective, fossil fuels increase the gas emissions and cause air pollution and global warming. The energy sector is the main source of greenhouse gas emissions, responsible for approximately 43.3% of the total national quantity [
5,
6] (
Figure 2).
Therefore, Egypt has formulated its “Vision 2030” to confront future energy challenges [
7]. In particular, the Integrated Sustainable Energy Strategy to 2035 (ISES 2035), that was released in 2015, targets an increase of renewable energy share to about of 42% in 2035 [
6]. This share includes 25% of solar energy, 14% of wind energy, and 2% of hydropower energy [
4].
Biomass is defined as “organic matter derived from plants or animals available on renewable basis” [
8]. It can be utilized for various energy applications that range from traditional heat generation for cooking and/or space heating to modern combined heat and power generation or biofuels production [
9]. Huge amounts of biomass crop residues are generated in Egypt every year and they are mostly unexploited and discharged [
10,
11]. Preliminary investigations indicate that the available crop residues in Egypt can contribute considerably to achieve the renewable energy targets of Egypt Vision 2030, however, very few studies have been conducted to quantify the biomass resources [
12,
13,
14]. In 2017, the total amount of agricultural residues was estimated as 40 million ton per year (Mt/year) on wet basis. Currently, only negligible amounts of these residues are utilized for household uses in rural communities. Most of the previous researches, although limited, attempted to estimate the potential of biomass energy in Egypt at large on the basis of the national amount of crop residues and without regard to their geographical distribution [
15,
16]. The studies focused on biomass power plant fed by specific crop residues such as rice straw [
12,
13]. Therefore, there is a definite need to classify and quantify the available amount of crop residues as based on their diversity, characteristics, and geographical locations for all the agro-resources in Egypt. Techno-economic feasibility studies are required to justify the reliance on the selected technology and capacities of the power plants.
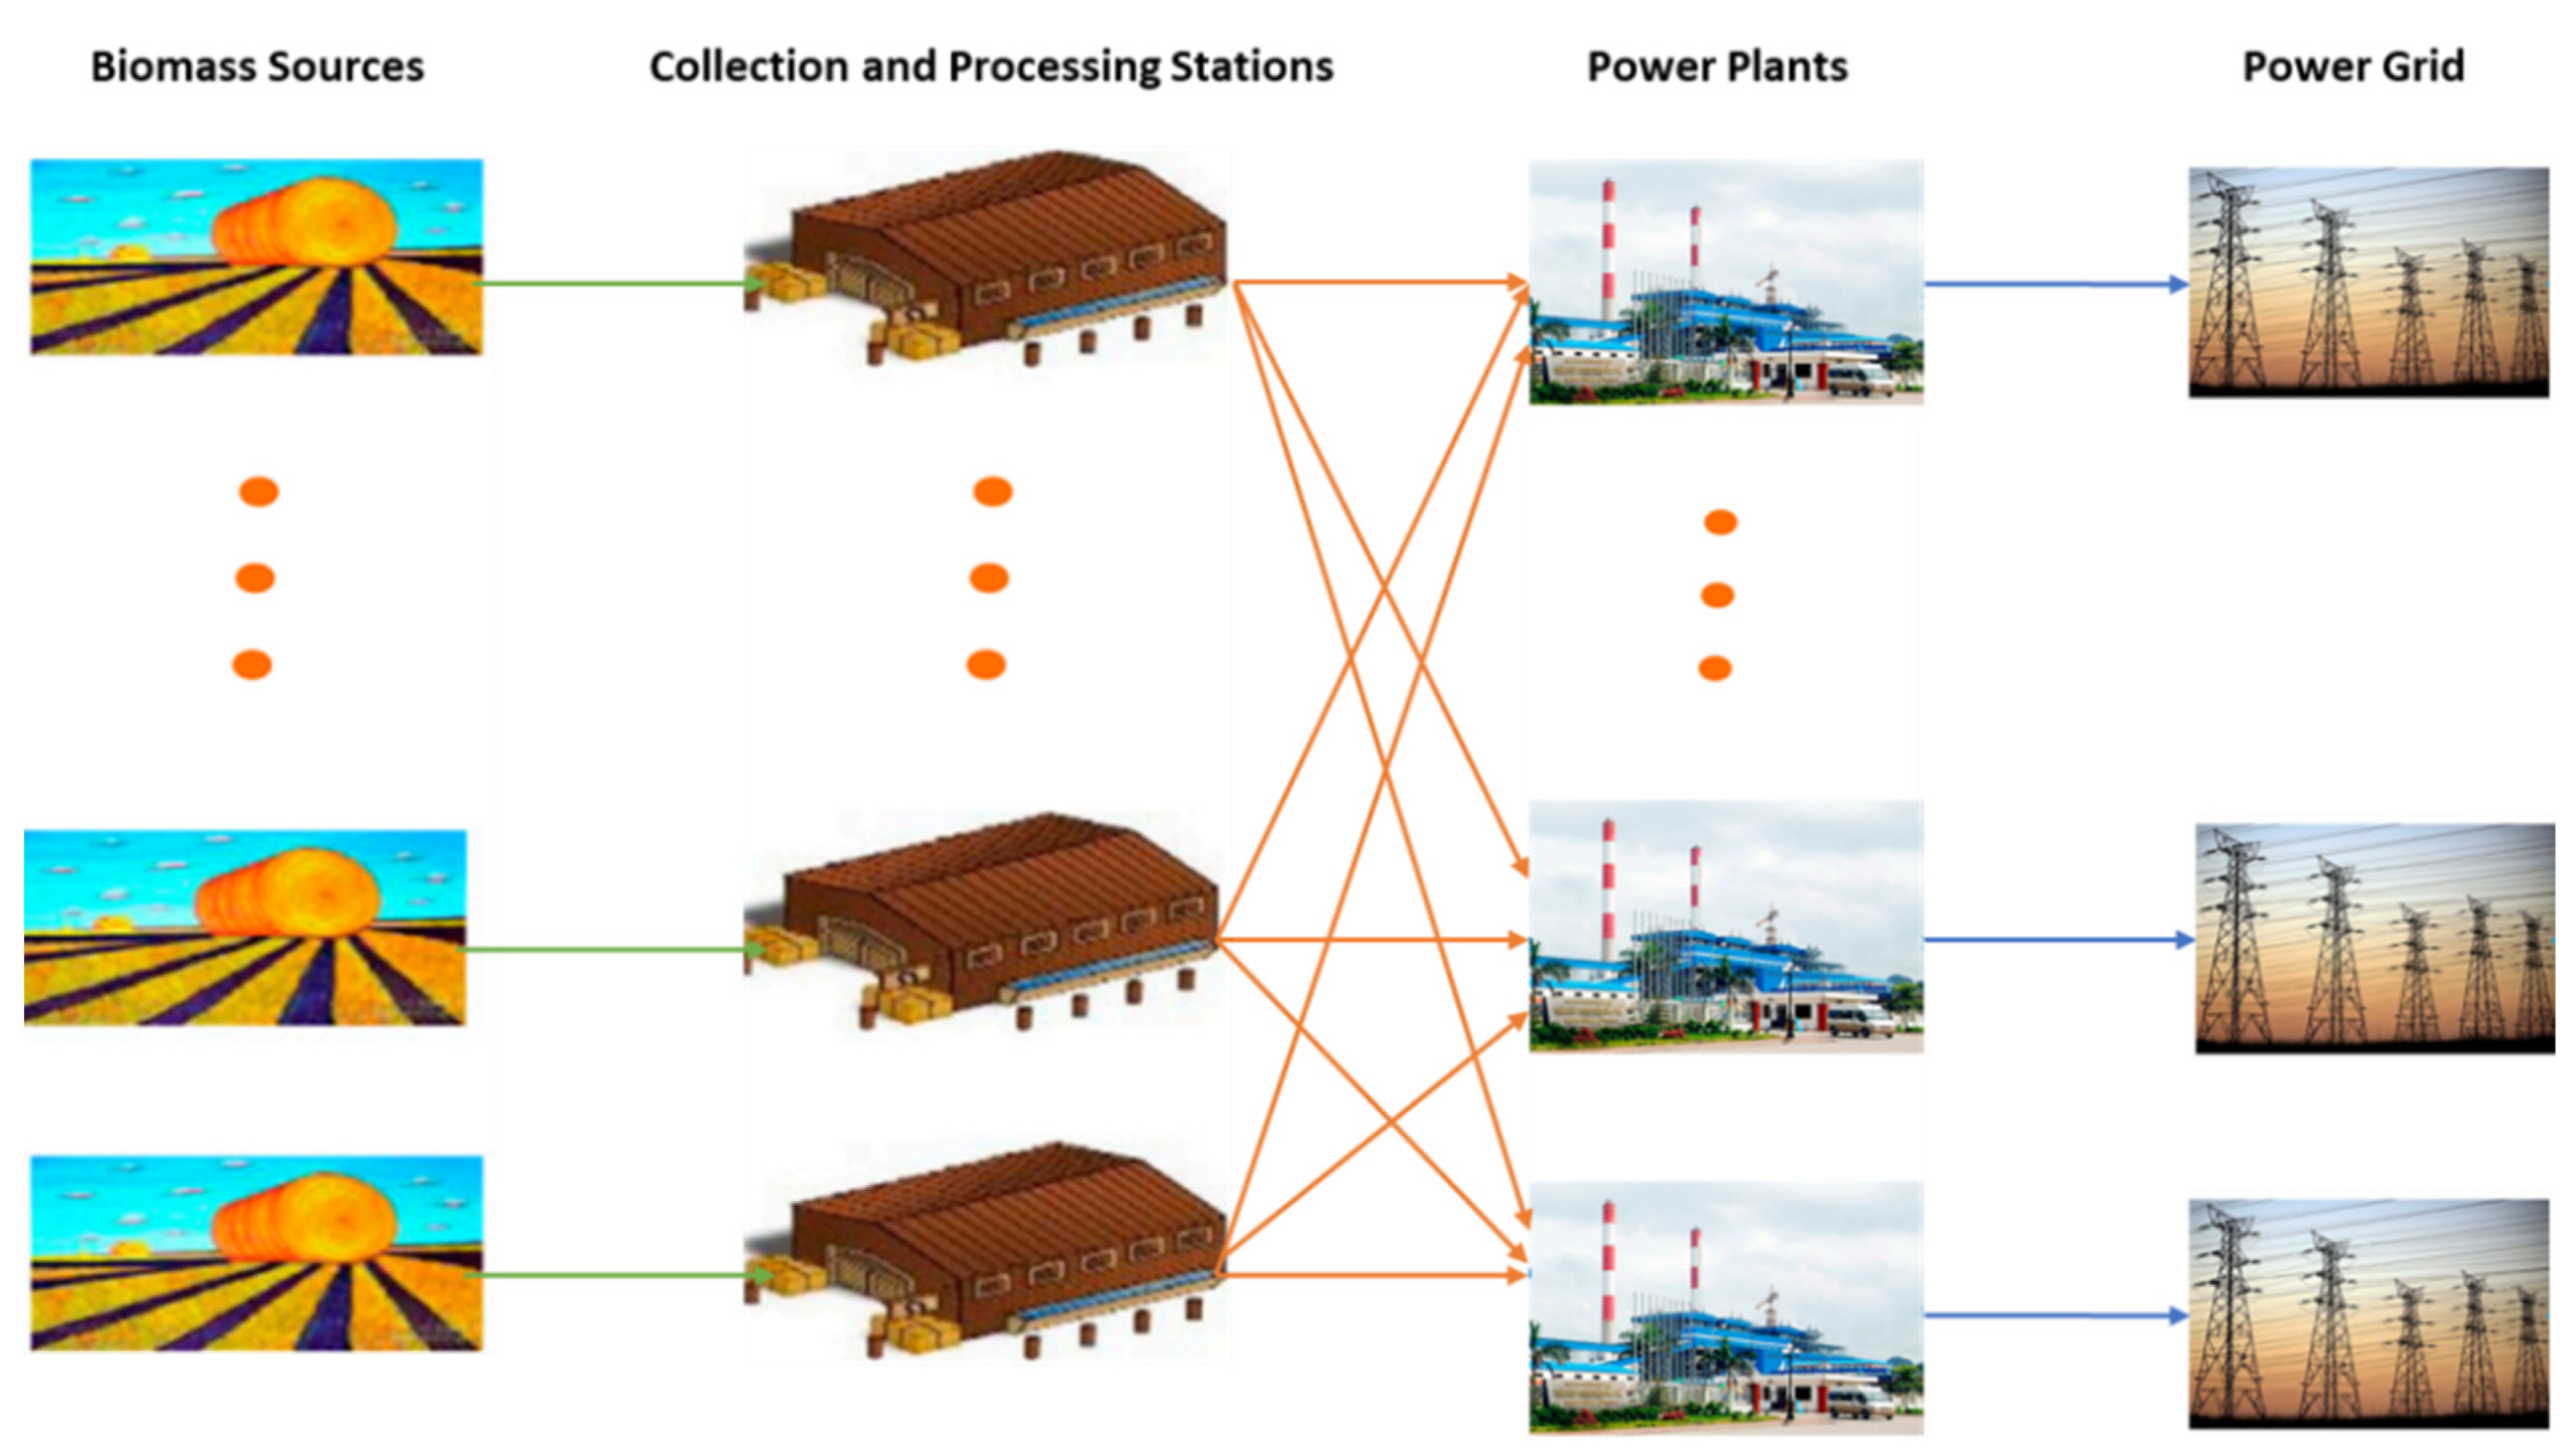
A network of biomass source areas, preprocessing and storage collection stations, and power plants calls for proposing the best design of a biomass energy supply chain. The design of a biomass supply chain network includes the determination of the best locations and capacities of the processing facilities and biomass power plants, and the suitable technologies for the different facilities in the network.
Figure 3 shows a sample biomass energy network. Other important tactical decisions include the amount of biomass resources to be collected and transported from these sources to the collection facilities, and then distributed to biomass power plants. The decisions should be made considering some criteria, such as profit maximization, cost minimization, or any other desired criteria [
17,
18]. These decisions are of strategic nature, and their effect shall extend over a long period and will have a significant impact on the overall gain. Most of the previous research has formulated mixed integer linear programming (MILP) models that are different in their objective functions (design criteria), and in their assumptions [
17,
19,
20]. However, there is no existing generic MILP model that can be adopted and applied directly for a general configuration of a biomass supply chain that can be instituted in reality.
The objectives of this research are two-fold. First, the potential of sustainable crop residues for bioenergy in Egypt, is assessed. In particular, the types of crop residues and their quantities in the 27 governorates of Egypt are estimated while considering several factors such as losses due to soil conservation, transportation losses, and moisture drying. A techno-economic feasibility of the energy production from the available crop residues is conducted. The research focuses on the generation of electric power using the technology of grate furnace combustion. The proposed power plants are modeled using SAM software developed by NREL. A simulation model is used to estimate the energy output in each governorate. Egypt’s policy is to encourage each governorate to establish its own electric power plants that are fueled with renewable and sustainable energy resources. The levelized cost of energy (LCOE) is estimated for each power plant considering all incurred costs including capital costs, logistics costs, and operating and maintenance. The CO2 emissions and energy balance are assessed based on life cycle assessment of energy use, and CO2 emissions of the proposed power plants. Accordingly, savings in the tons oil equivalent (toe) of primary energy and CO2 emissions are estimated.
The second objective of this research is to provide a strategic perspective for the design of a national network of biomass power plants in Egypt. A generic mixed integer linear programming (MILP) model is formulated to obtain the configuration of the biomass supply chain that maximizes the net profit. The model enables the determination of the optimal number, location, and capacity size of the power plants to be installed, and the determination of the amount of agriculture residues to be collected and transported from each source (collection station) to each installed power plant. The revenue is related to the sold electrical and thermal energy, and the supply chain costs includes the collection cost, preprocessing cost, capital cost of the installed power plants, operating and maintenance cost, and transportation cost. A case study is developed based on the available agriculture residues in Egypt and the MILP model is applied to determine the optimal network design.
The key contributions of this research can be summarized as follows. It presents an approach to investigate the technical and economic feasibility and impact of deploying a national network of agro-energy biomass power plants with an application to Egypt. The approach identifies the spatial distribution of the major biomass crop residues, employs SAM simulation software to perform the power transformation and energy calculations, and integrates a new generic MILP model to determine an optimal configuration of the biomass supply chain network. The MILP model is formulated to maximize the net profit of a biomass supply chain network that integrates residue collection stations, biomass power plants, and electric energy demand grid. Unlike the existing models in the literature, the model assumes variable capacity size, variable capital and O&M cost structures, variable plant efficiencies, while the number and locations of plants are also unknown. The overall approach (including the new MILP model) can be adopted to develop strategic plans regarding the deployment and promotion of biomass power plants in Egypt. The approach may also be applied to other developing countries where the agro areas are dense, residues are wasted and not being industrialized, and fossil fuels pose high economic burden. Moreover, the results affirm that the amount of electric energy that can be produced from the available amounts of residues in Egypt and the related LCOE are highly competitive to other energy alternatives. Additionally, a novel national network of biomass power plant for Egypt is proposed. The results may motivate the initiation of new biomass national projects in Egypt.
This paper is structured as follows. Initially, the potential assessment of crop residues for bioenergy is presented in
Section 2. Then, the techno-economic assessment of installing a direct combustion power plant at each Egyptian governorate is outlined in
Section 3. In
Section 4, a new generic MILP model for optimal design of a national network of biomass power plants is described. Finally, the model implementation to Egypt and conclusions as well as future work trends are provided in
Section 5 and
Section 6, respectively.
2. Biomass Energy Potentials Methodology
The methodology to estimate the amount of available agriculture residues for bioenergy in Egypt estimates the produced amounts of different crops and their related residues first. Then, it estimates the net amounts of agricultural residues available for energy production. It considers three different topologies of residues and deducts both the amounts of residues used for other purposes and the expected losses in the biomass logistics operations.
Egypt has a population of 100 million in 2019 with a total land area of 1.01 million km², and a total cultivated area of more than 4.0 million hectares (Mha) [
21]. The agriculture sector is an important sector of the national economy, and it employs about 21.6% of the total employed population, and contributes about 11.5% of the gross domestic product [
21]. Due to the extensive cultivation land area and diversity of the agriculture seasons, Egypt is featured with a wide typology of agricultural crops residues throughout the year. However, the amount of crop residues that can be collected from the fields is subject to reduction due to the losses during the collection, transport, and storage processes, and the quantity of biomass that should be left to the soil to keep the carbon stock [
22,
23].
Accordingly, the available amounts of crop residues for bioenergy production should be estimated while considering the quantities of crop residues that could be used for other purposes. The main alternative current uses for agricultural residues in Egypt can be summarized as follow:
In Egypt, several types of crop residues are used directly as animal feed. In particular, cereal residues of wheat, maize, and rice are the most used for animal feeding. For example, about 70–80% of wheat straw, 30–40% of maize stalk, and 10–20% of rice straw are used for this purpose.
Paper and cardboard industries are considered one of the competitive uses of agricultural crop residues in Egypt. About 10–15% of rice straw is used in paper industries, and trees pruning is also used in wood industries.
Crop residues especially tree pruning can be used directly as heat source, particularly, in rural communities but with a small contribution of 2–6%.
There are various other uses of the agricultural residues in Egypt such as animal bedding, preparing compost, and making red building bricks.
In addition to these losses, the available amount of crop residues for bioenergy production should also be estimated based on dry basis after considering the percentage of moisture content.
2.1. Typologies of Crop Residues
In Egypt, the agricultural residues can be categorized into three typologies based on the possible diversity of their by-products. The first typology (straw/stalk/pruning) represents the residues of wheat, maize, barley, sorghum, rice and other herbaceous crops. The second typology (wood) accounts for the residues related to the pulled-out tress of olive, orange, grapes, banana, pear, peach, citrus, hazel, etc. The third typology is related to palm residues which have some different characteristics and features from the other two typologies. Thus, the amounts of crop residues that can be allocated for a sustainable bioenergy production should be classified by each typology.
2.1.1. First Typology (Crops that Have Only One Byproduct (Straw/Stalk/Pruning))
The amount of residue that can be obtained from a specific agriculture crop from typology 1 (Straw, stalk, and pruning) can be calculated based on Equation (1):
where:
: the amount of Typology 1 residue available for bioenergy at dry basis in (ton/year).
: is the byproduct of the agricultural crop of Typology 1 in ton per hectare (t/ha).
: the total area of the main agricultural crop in hectare (ha).
: the residues amount that left in the field for soil conservation of Typology 1 in %.
: the amount of losses due to collection, transport, and storage processes in %.
: the moisture content in % of Typology 1.
: the amount of crop residues of typology 1 that could be used for other purposes in %.
Table 1 illustrates the parameters used for the evaluation of the agricultural residues’ availability for such crops (by-product 1). The table includes the available crops, their related by-products (residues), their other uses, and the expected losses due to storage and transportation. Finally, the table provides the available amounts of crop residues of Typology 1 that can be utilized for bioenergy in Egypt.
2.1.2. Second Typology (Crops that Have Two Byproducts (Pruning & Tree Pulled Out)
The residues amount that could be produced by the pulled-out trees can be calculated by Equation (2) taking into consideration the average age of the tree:
where:
: the amount of Typology 2 residue available for bioenergy at dry basis in (ton/year).
: the yield of the agricultural residues of Typology 2 in (ton/ha).
: the total area of the main agricultural crop in (ha).
: the residues amount that left in the field for soil conservation of typology 2 in %.
: the amount of losses due to collection, transport, and storage processes in %.
: the moisture content in % of Typology 2.
: the amount of crop residues that could be used for other purposes of typology 2 in %.
: the frequency of byproduct2 (year).
Table 2 provides the available amounts of crop residues of Typology 2 (including by-products 1 and 2) that can be utilized for bioenergy in Egypt.
2.1.3. Third Typology (Palm Tree Residues)
The residues available for bioenergy production from palm trees residues can be estimated using Equation (3):
where:
: the amount of palm trees residues available for bioenergy at dry basis in (ton/year).
: the number of palm trees per ha.
: the total cultivated area of palm tree in (ha).
: the byproduct of one palm tree in kg/tree.
: the residues amount that left in the field for soil conservation in %.
: the amount of losses due to collection, transport, and storage processes in %.
: the moisture content in %.
: the amount of crop residues that could be used for other purposes in %.
Table 3 provides the residues amount that can be obtained from palm trees. The byproduct 2 of pulled-out palm trees is not considered due to the longevity of the palm tree which ranges between 70 and 100 years.
3. Techno-Economic Assessment Methodology
This study aims to assess the potential of energy production from biomass power plants in Egypt. In this regard, this section provides the modeling methodology that will be followed to assess the technical and economic performances of the proposed power plants.
3.1. Technical Performance Evaluation
Most of the Egyptian governorates are endowed with high availability of agriculture biomass resources that can be utilized for sustainable energy production. First, the available amounts of agriculture residues and their typologies in the Egyptian governorates are quantified. A feasible solution is to establish a power plant in each governorate to minimize the transportation costs and to facilitate the collection and utilization of the available biomass resources in each governorate (
Appendix A Figure A1). Power plant capacities can be determined based on the available amount of biomass feedstock in each governorate. Therefore, a mathematical modeling methodology is employed (
Section 4) to determine the optimal design of the biomass supply chain that maximizes the overall profit.
The proposed power plant technology consists of a steam Rankine cycle integrated with a grate stoker furnace [
28]. The grate stoker furnace is the most suitable technology that can be used in developing countries, especially in the case of using crop residues as a fuel. This technology is relatively cheap, very robust, and more flexible when using feedstock in large sizes [
29]. Technical and economic performances of the proposed power plants are modeled using System Advisor Model (SAM) simulation software [
30]. SAM has been developed by National renewable energy laboratory (NREL) [
30]. It can be used to investigate the techno-economic feasibility of many types of renewable energy systems including solar, wind and biomass power system [
6,
12,
13,
31,
32,
33,
34,
35,
36,
37].
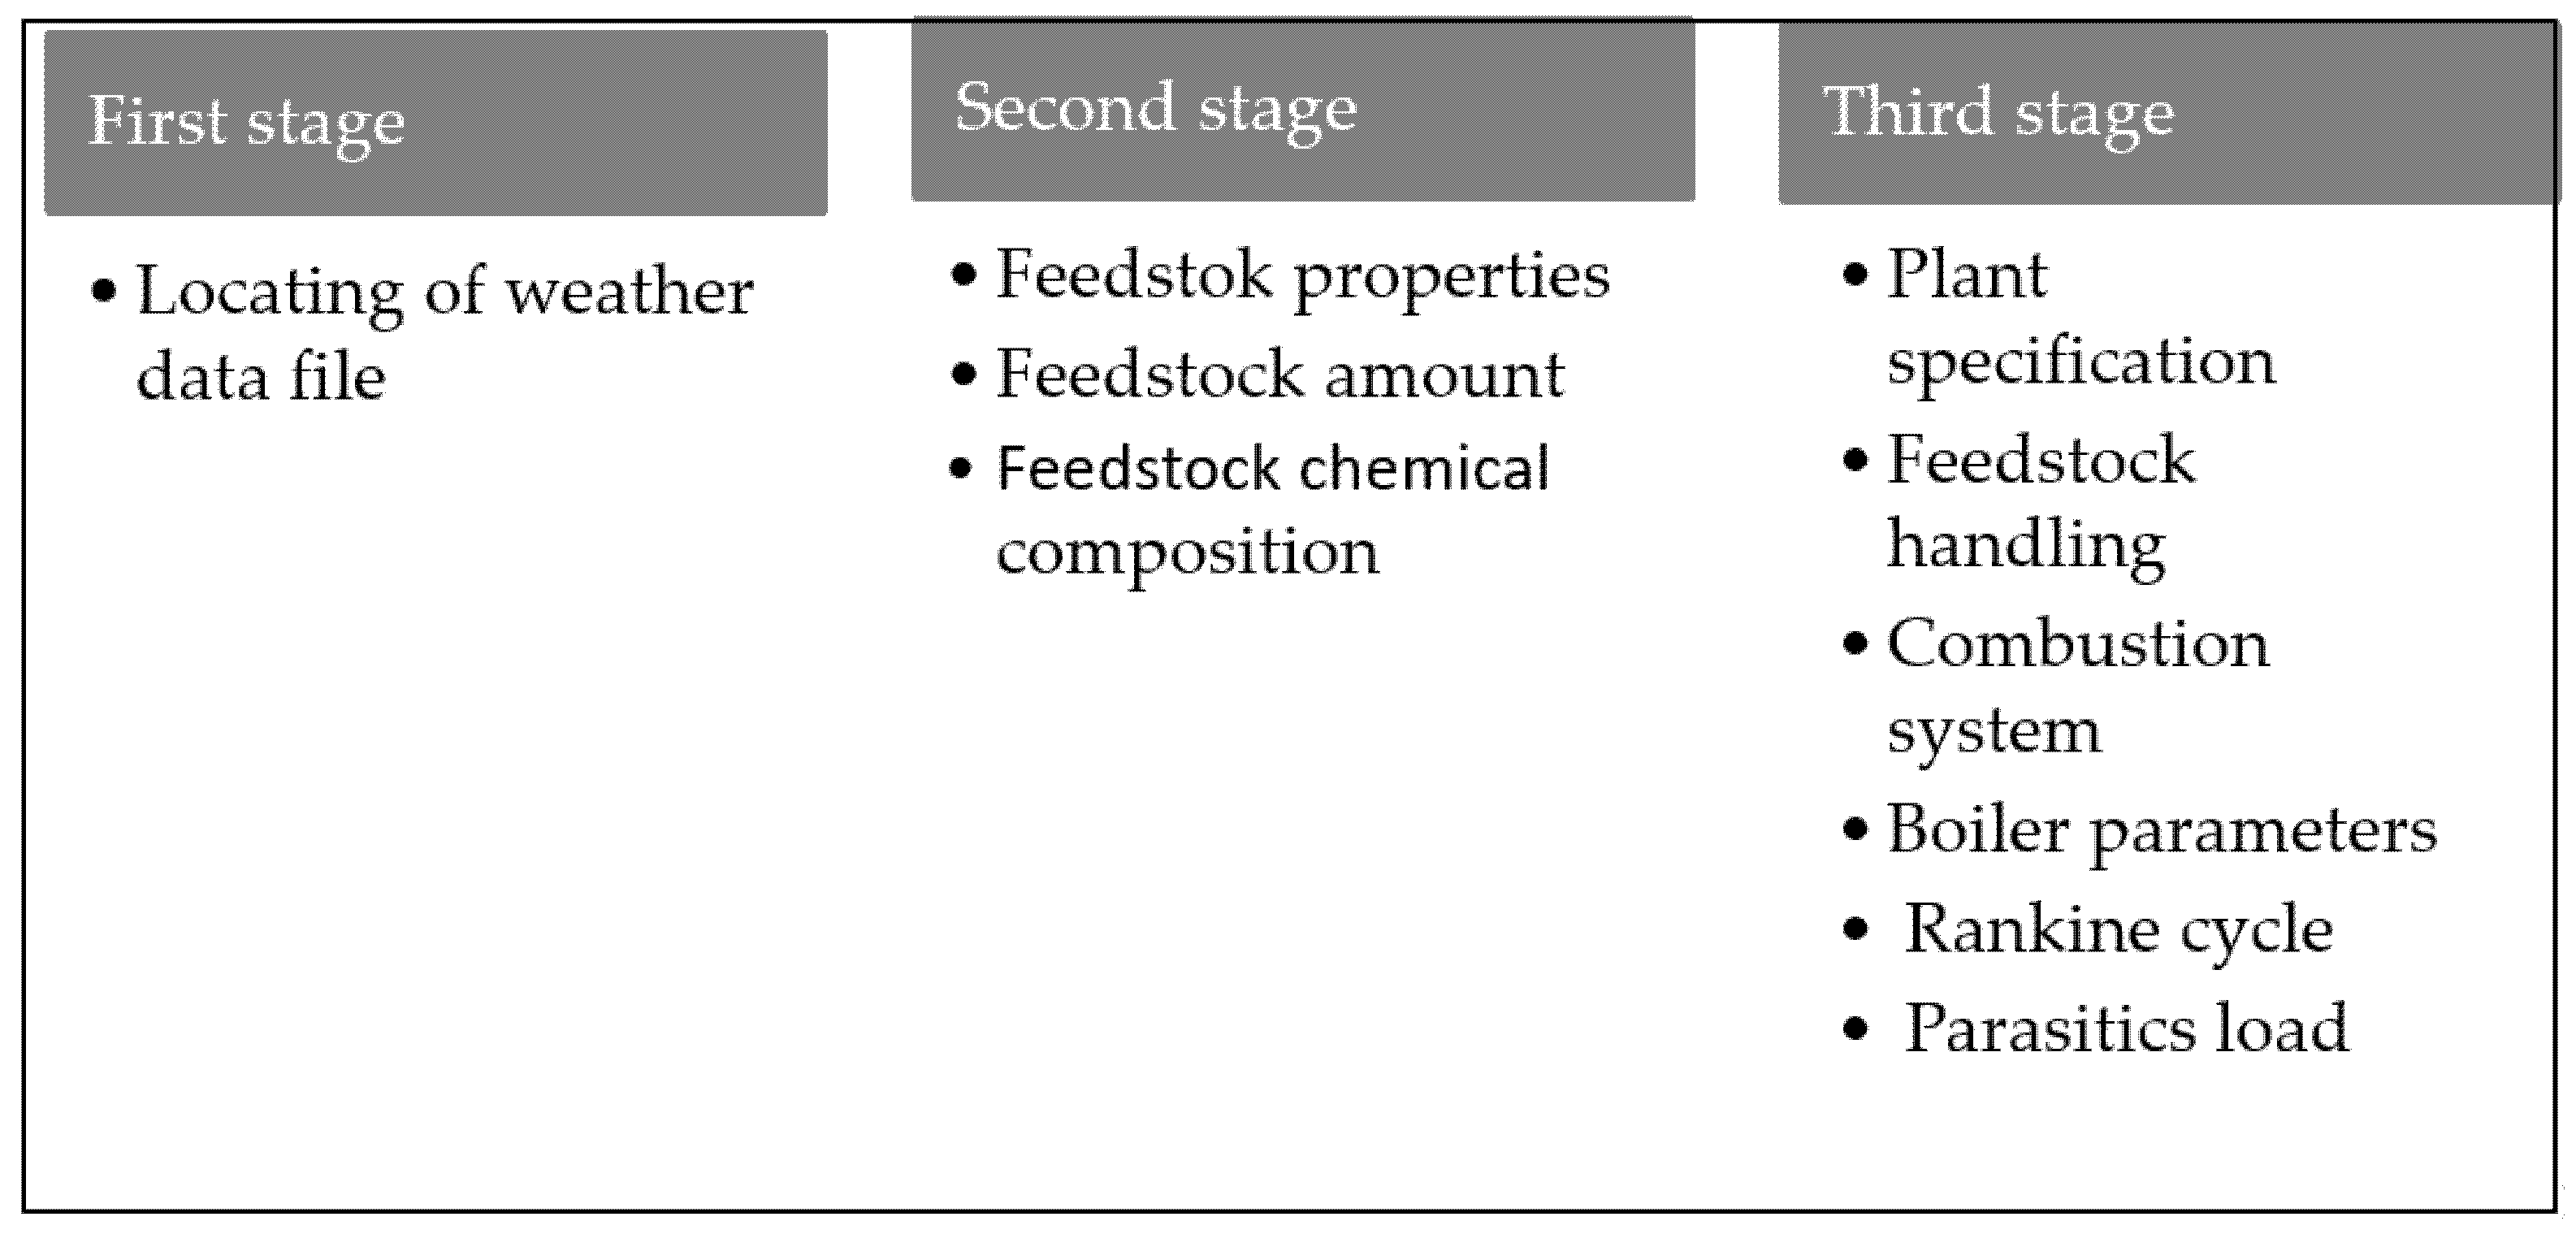
Modeling a biomass power plant in SAM consists of three main stages as shown in
Figure 4. First, the weather data at the biomass power plants locations are specified. Weather data file contains hourly information about the ambient dry bulb temperature, wind speed and relative humidity data that affect the performance of a biomass power plant. Next, the biomass resource amounts and their properties are specified. Last, the system entities and components are identified.
Table 4 shows the main input data for the modeled biomass power system.
3.2. Economic Performance Evaluation
To evaluate the economic feasibility of the biomass power plants, the levelized cost of energy (
LCOE) is estimated and compared with the
LCOE of fossil fuels and other renewable energy alternatives in Egypt. The
LCOE formula used in SAM can be represented by Equation (4) [
6,
13,
39,
40]:
where:
: investment cost in year
t; which is equal to the total investment cost (
TIC) divided by capital recovery factor (
CRF) and can be calculated by Equation (5) [
41]:
: operations and maintenance expenditures in year t;
: fuel (feedstock) expenditures in year t;
: electricity produced in the first year of the installation;
: discount rate (%);
: expected lifetime of the power plant;
: electricity generation in year
t and can be calculated be Equation (6) [
6,
13,
39,
40];
: degradation factor for the power plant, we assume an annual output drop of 0.2% [
13].
The main required data to perform the economic analysis are investment cost, operating and maintenance (O&M) costs, fuel cost (crop residues), transportation and logistics cost, and storage cost. The investment cost includes direct capital cost, and indirect capital cost. The direct capital cost expresses equipment purchases and installation expenditures. Indirect capital cost represents the cost of design and construction of the power plant, and land-related costs.
Table 6 presents basic economic data for calculating the investment cost. Operating and maintenance (O&M) costs involve annual expenditures for labor, equipment, and other costs associated with operating the power plant. The annual fixed O&M cost is considered to be 3.2% of the annual investment cost [
42]. The variable O&M cost is estimated at 5.24
$/MWh (
Table 6) [
42]. The
LCOE is computed based on a power plant lifetime of 20 years and a discount rate of 10% [
43].
The fuel cost represents the feedstock costs including feedstock purchase, preprocessing cost, collection cost, harvesting cost, and transportation cost. Feedstock purchase price is the fair price that will be paid to feedstock producers, and it is considered as 20
$/t [
13].
Feedstock preprocessing cost is the cost of feed stock size reduction and drying processes, and it is estimated as 8.21
$/t [
44]. The collection cost is estimated based on the expense of labor and machinery for collecting crop residues in the field. The collection costs excluding transportation, can be range from 4–6
$/t [
45]. In this study, an average collection cost of 5
$/t is considered. The harvesting cost is neglected since it is not attributed to energy production, but rather to the food cultivation process.
Transportation costs include both a fixed cost such as the cost of loading and unloading, and variable costs that depend on the transportation distance to the collection stations and then to the power plants. The transportation cost depends on the nature of the roads in Egypt and the fuel price, as well as the truck operators’ costs. According to these variables, the fixed and variable costs of transportation are considered to be 4
$/ton and 0.03
$/ton-km, respectively (
Table 6) [
13].
3.3. Results and Analysis of the Potential Biomass Performance in Egypt
3.3.1. Biomass Energy Potentials
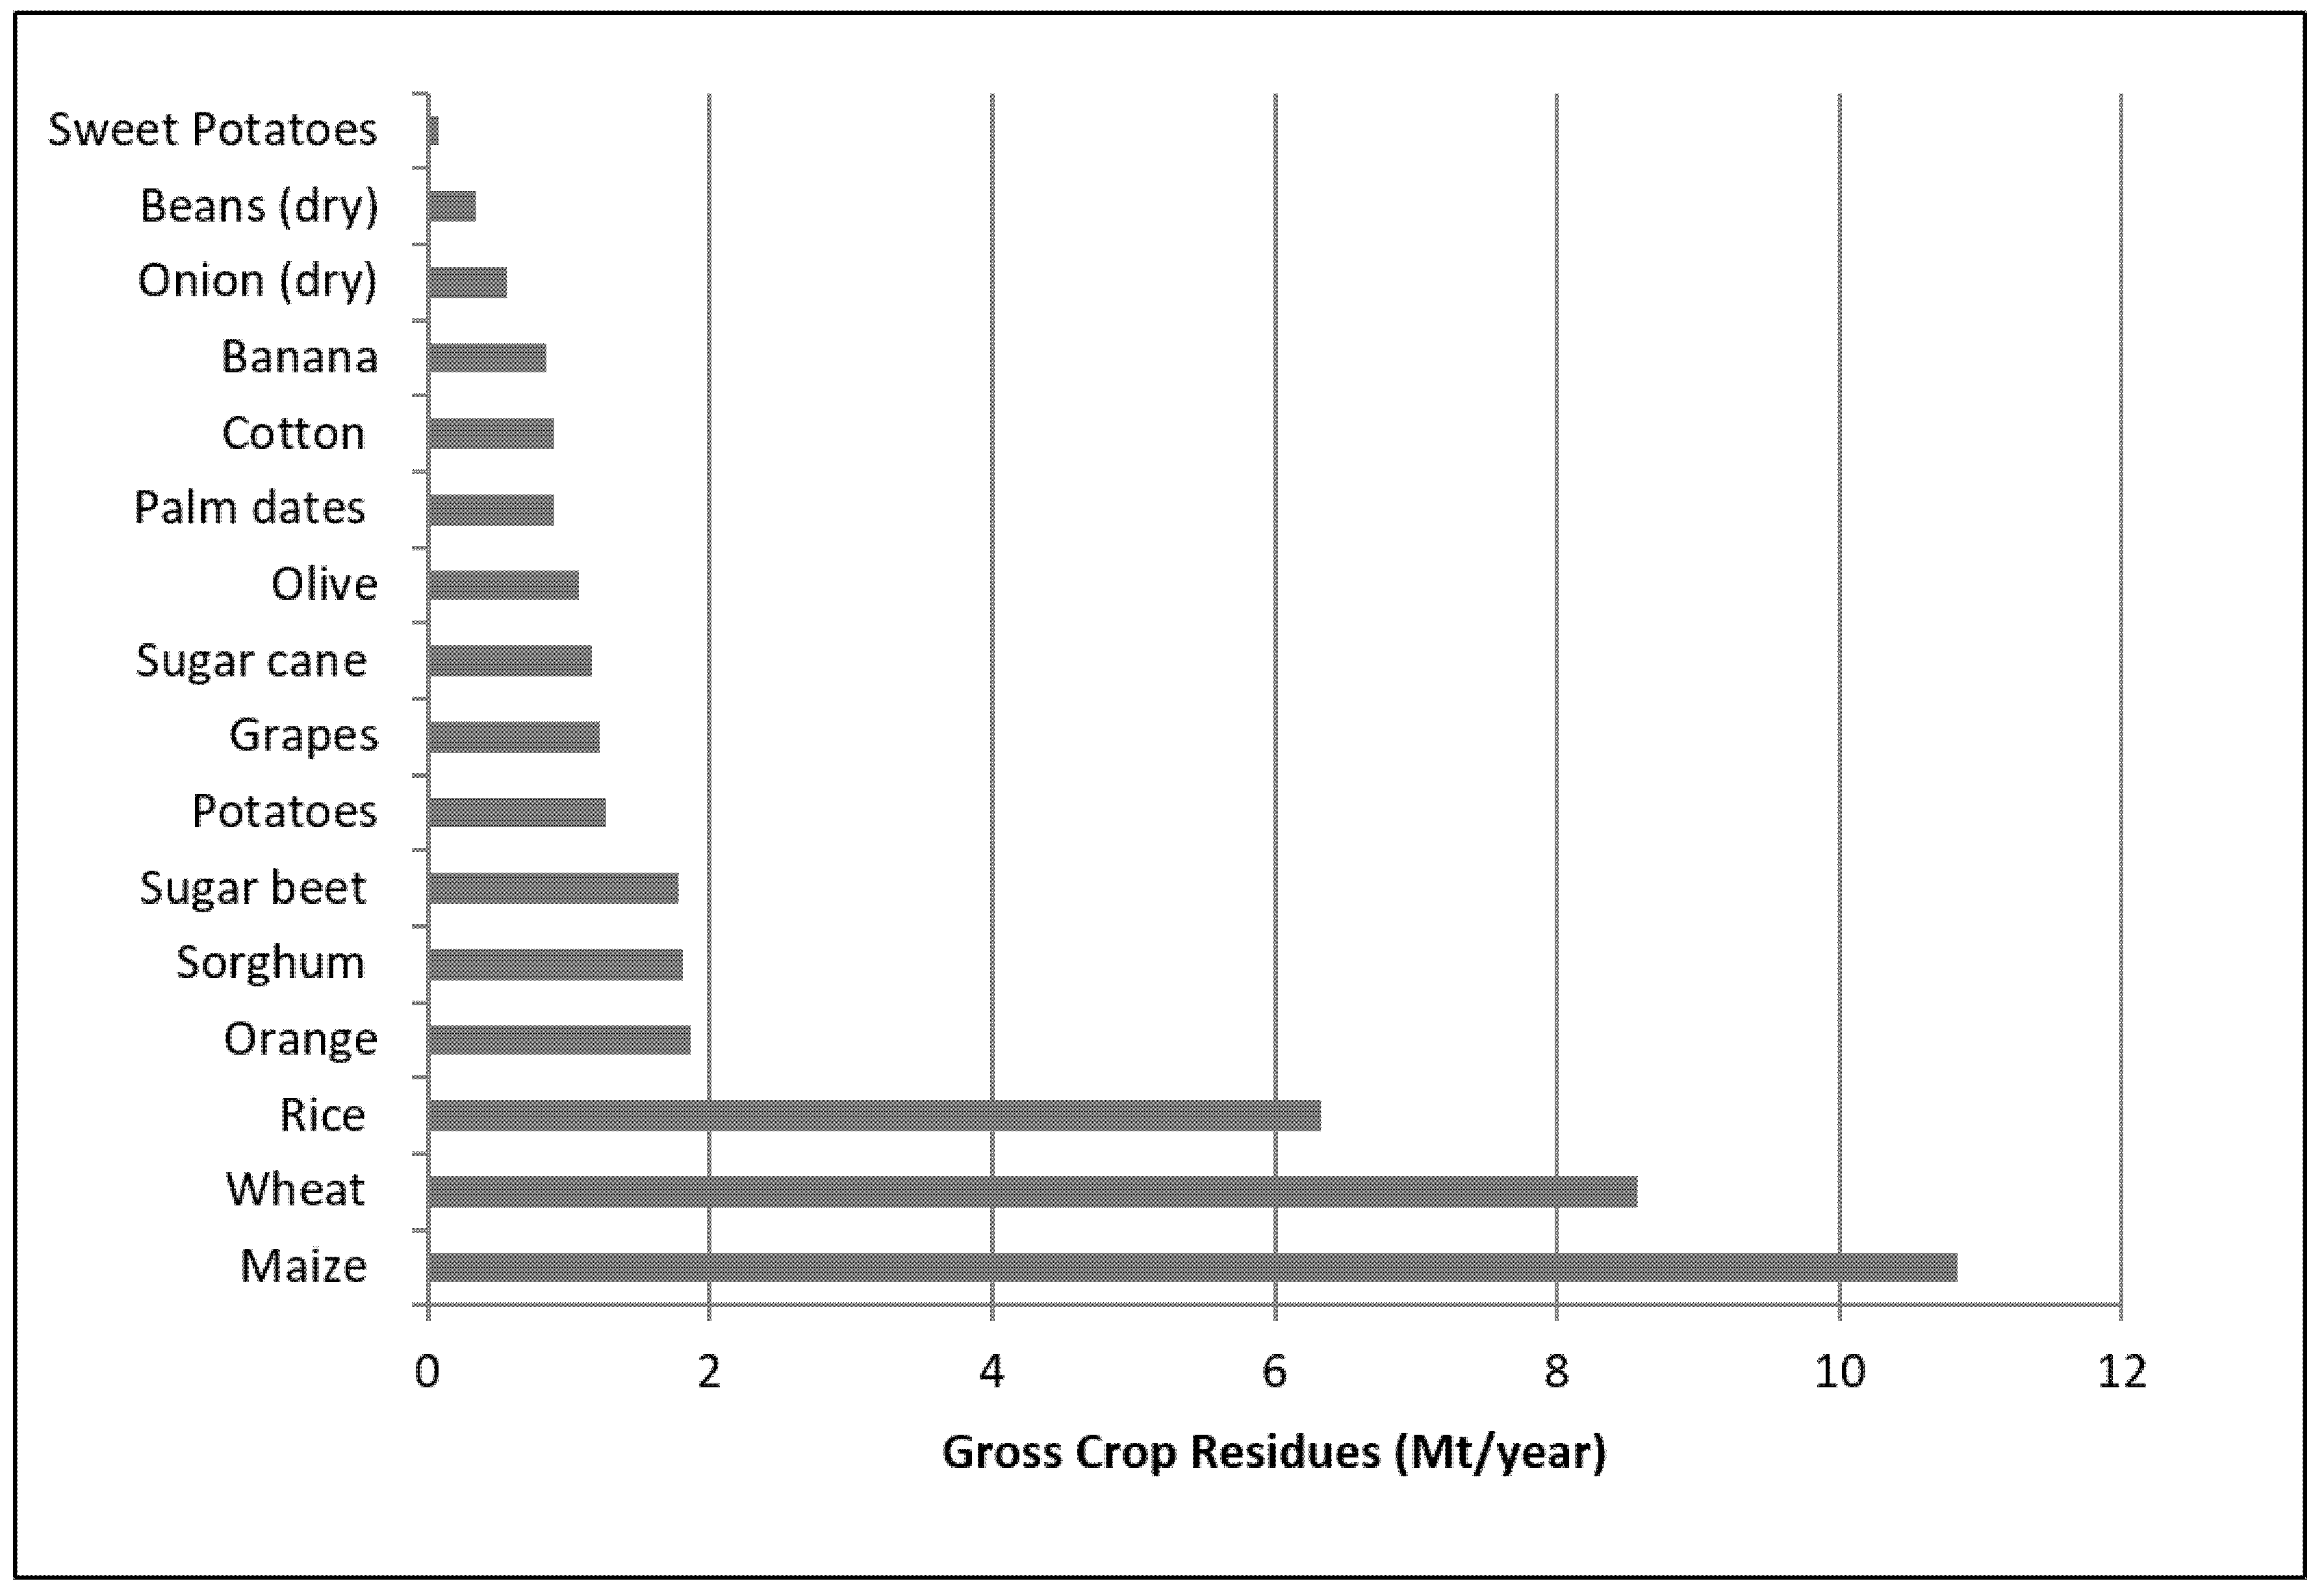
Biomass quantification of crop residues for 16 different crop residues in Egypt is analyzed. Results show that the total gross amount of crop residues is estimated to be 40 Million ton/year (Mt/year), and sustainable amount of crop residues available for bioenergy is estimated 10 (Mt/year) for the year 2017. Results indicate that the cereals residues (Maize stalk and rice straw) provide the largest amount of crop residues, and amounts to 50% of the annually produced crop residues in Egypt.
Figure 5 shows the annual gross amount of 16 major crops in Egypt. The contribution from Maize residues is the highest (10.8 Mt/year), followed by wheat straw (8.6 Mt/year) and rice straw (6.3 Mt/year).
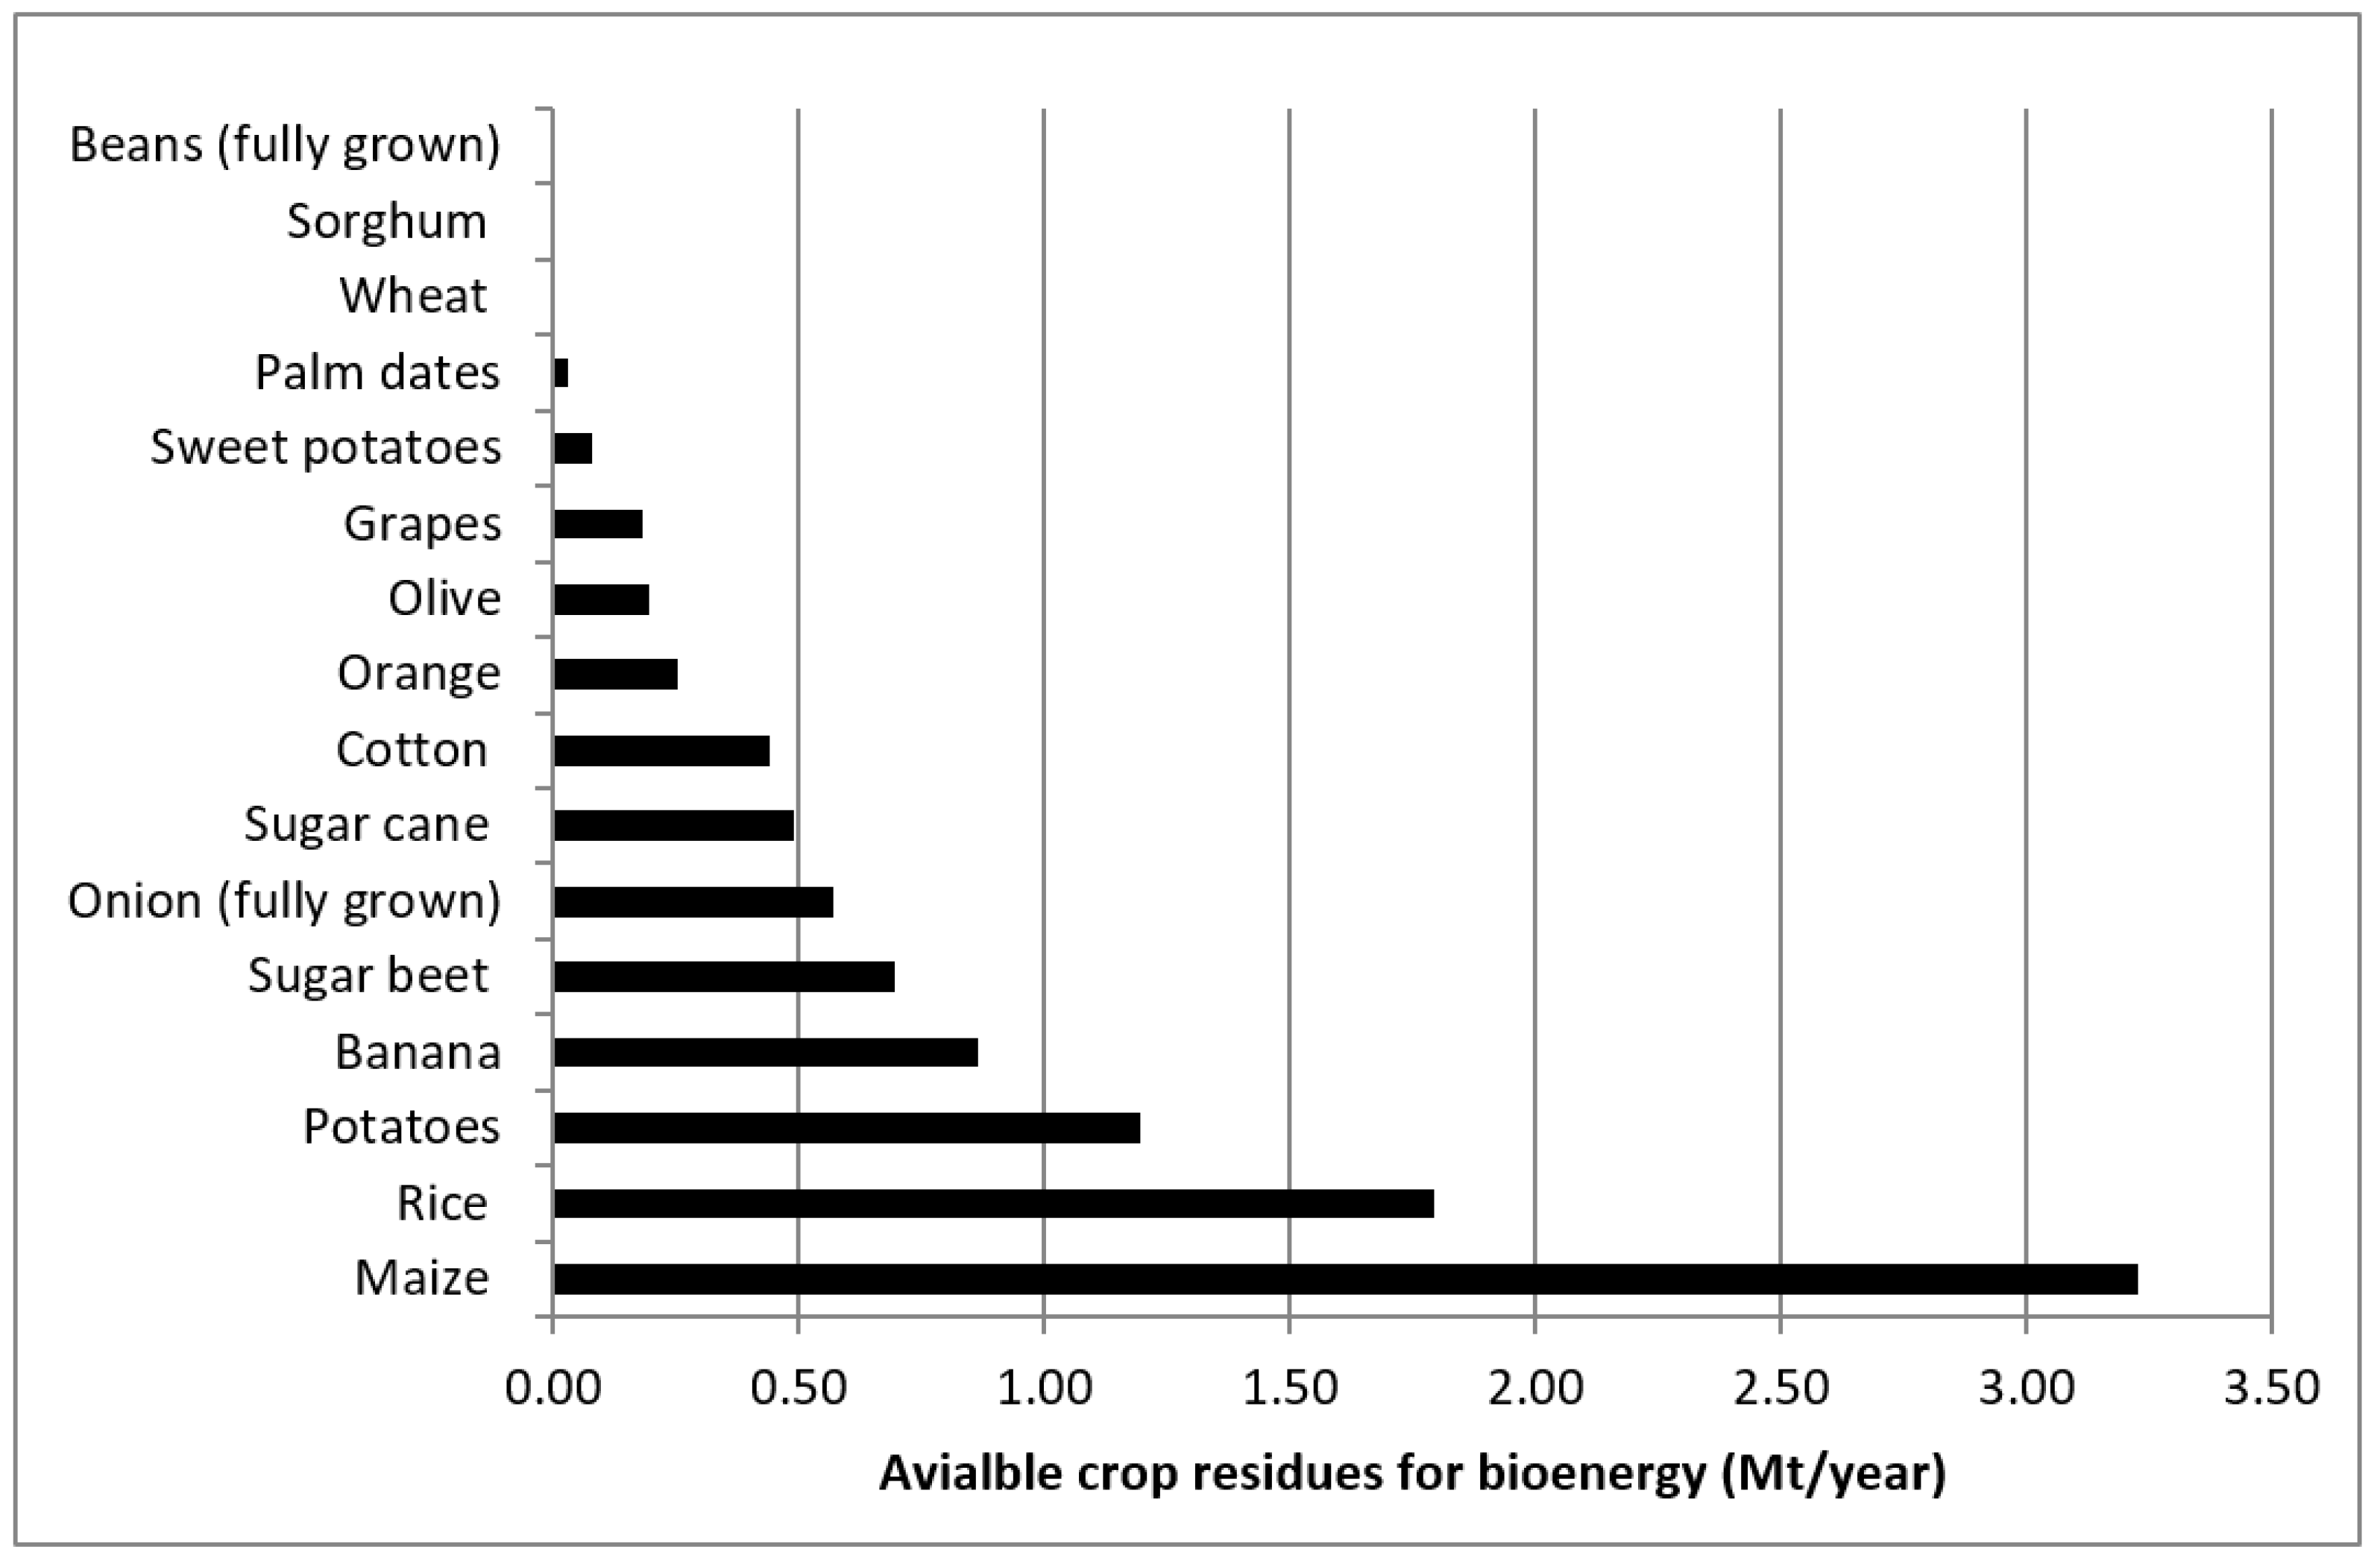
Figure 6 shows the annual available amount of crop residues for bioenergy. It is observed that the highest amount of crop residues available for bioenergy is shared with maize residues (3.2 Mt/year) followed by rice straw (1.8 Mt/year), and there is no amount shared with wheat straw. There are also other crops residues that have a negligible contribution for bioenergy, such as bean and sorghum residues. This is due to the use of these crop residues for other purposes.
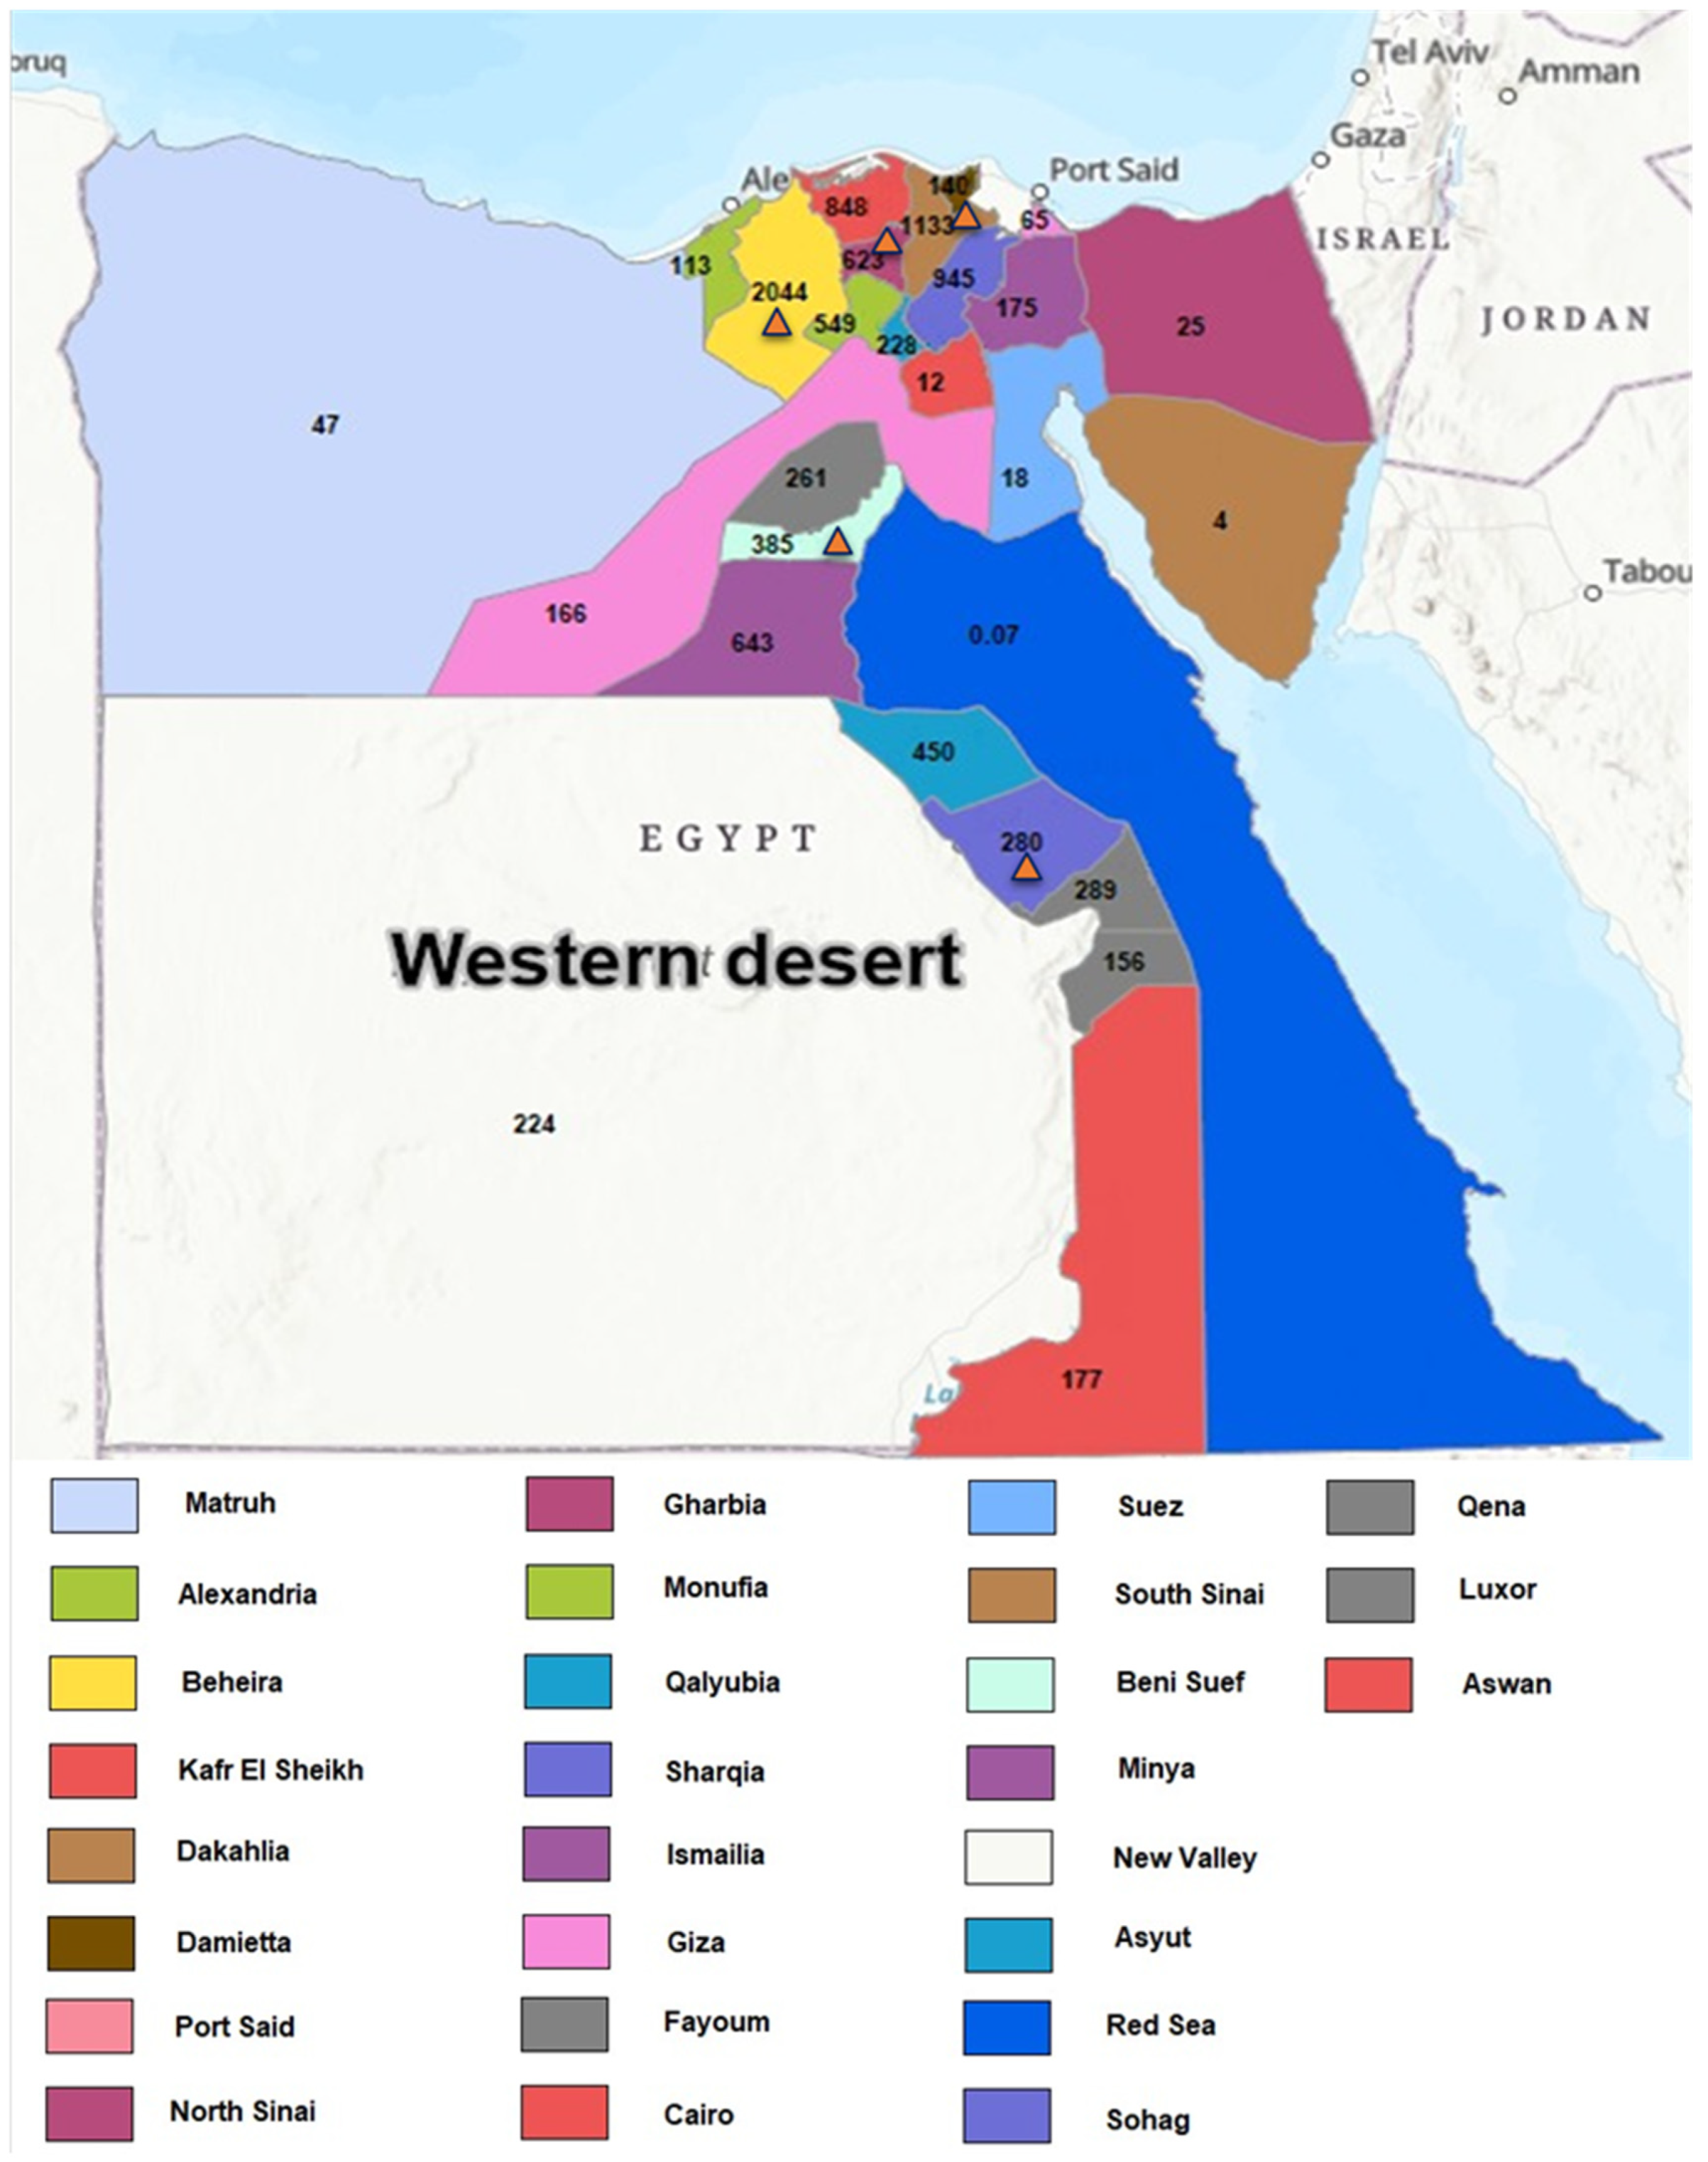
The biomass map that indicates the location of each governorate and the respective total amount of crop residues is depicted in
Appendix A (
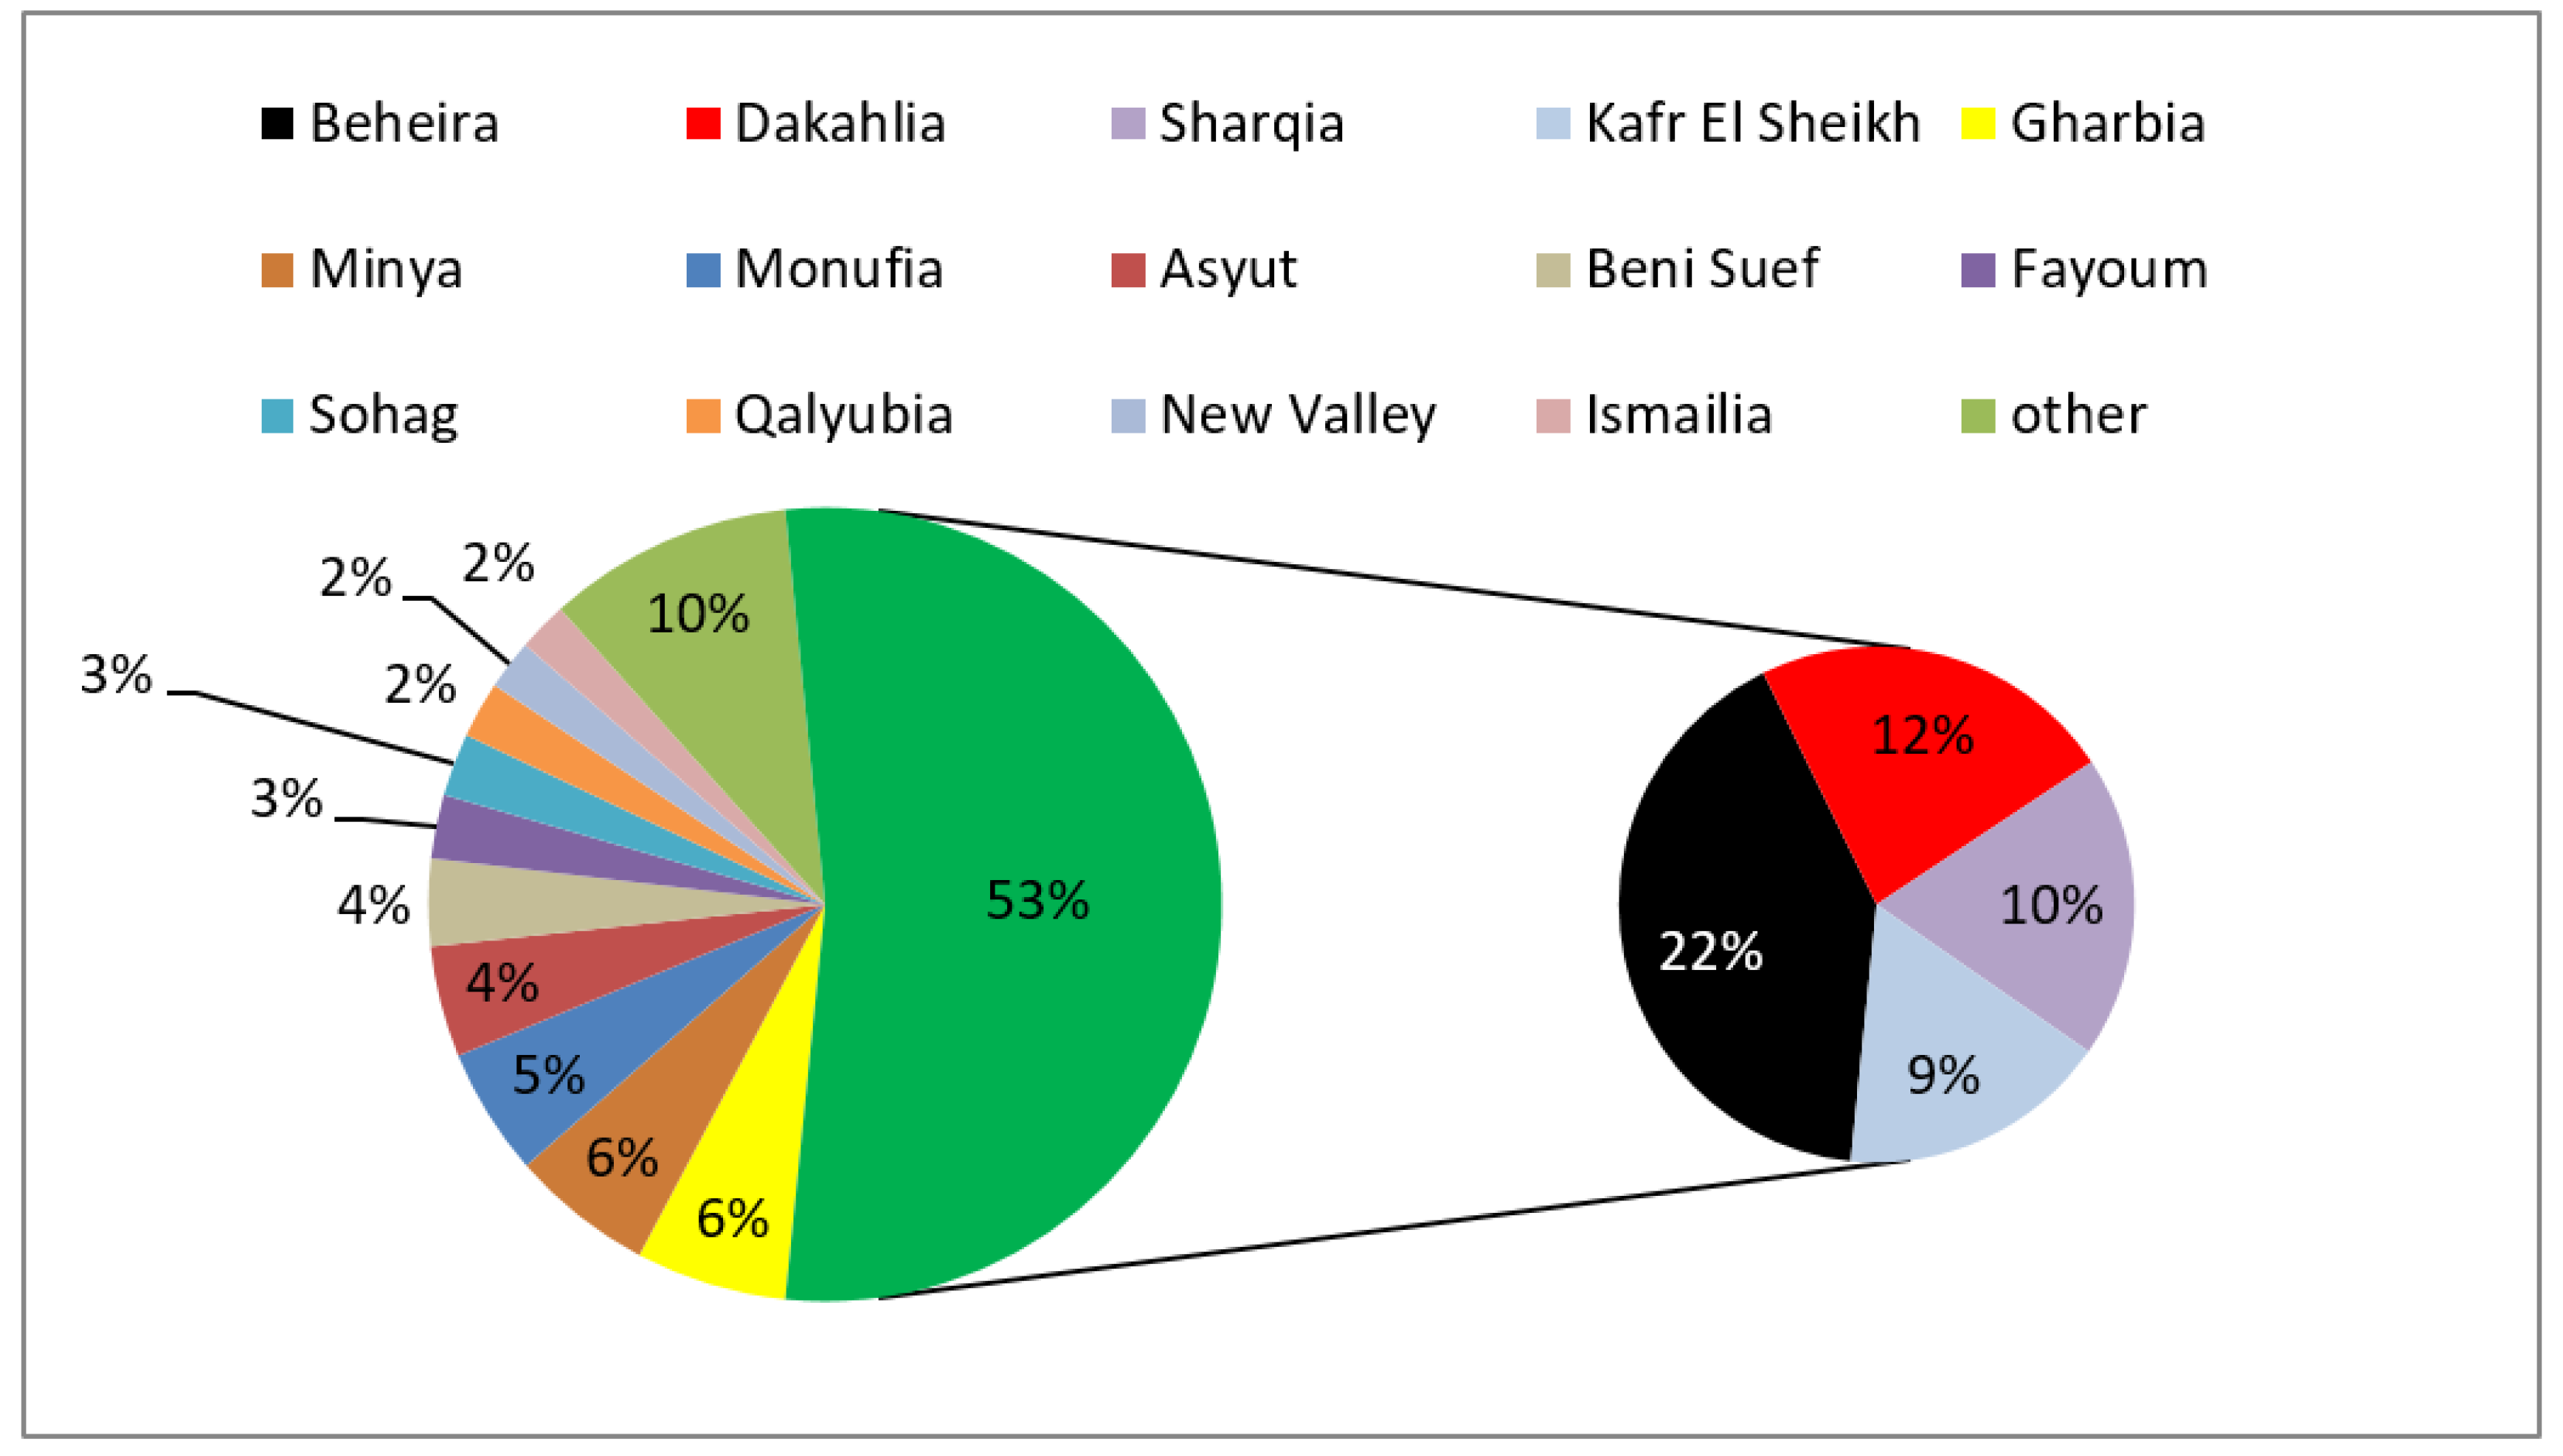
Appendix A Figure A1). The quantification of the available crop residues for bioenergy at governorate level reveals that the spatial distribution of residue production dominates in four governorates which cover 53% of the total crop residues production in Egypt (
Figure 7). The governorate of Beheira comes at the top with 22%, followed by Dakahlia with 12%, Sharqia with 10%, and then Kafr El-Sheikh with 9.0%.
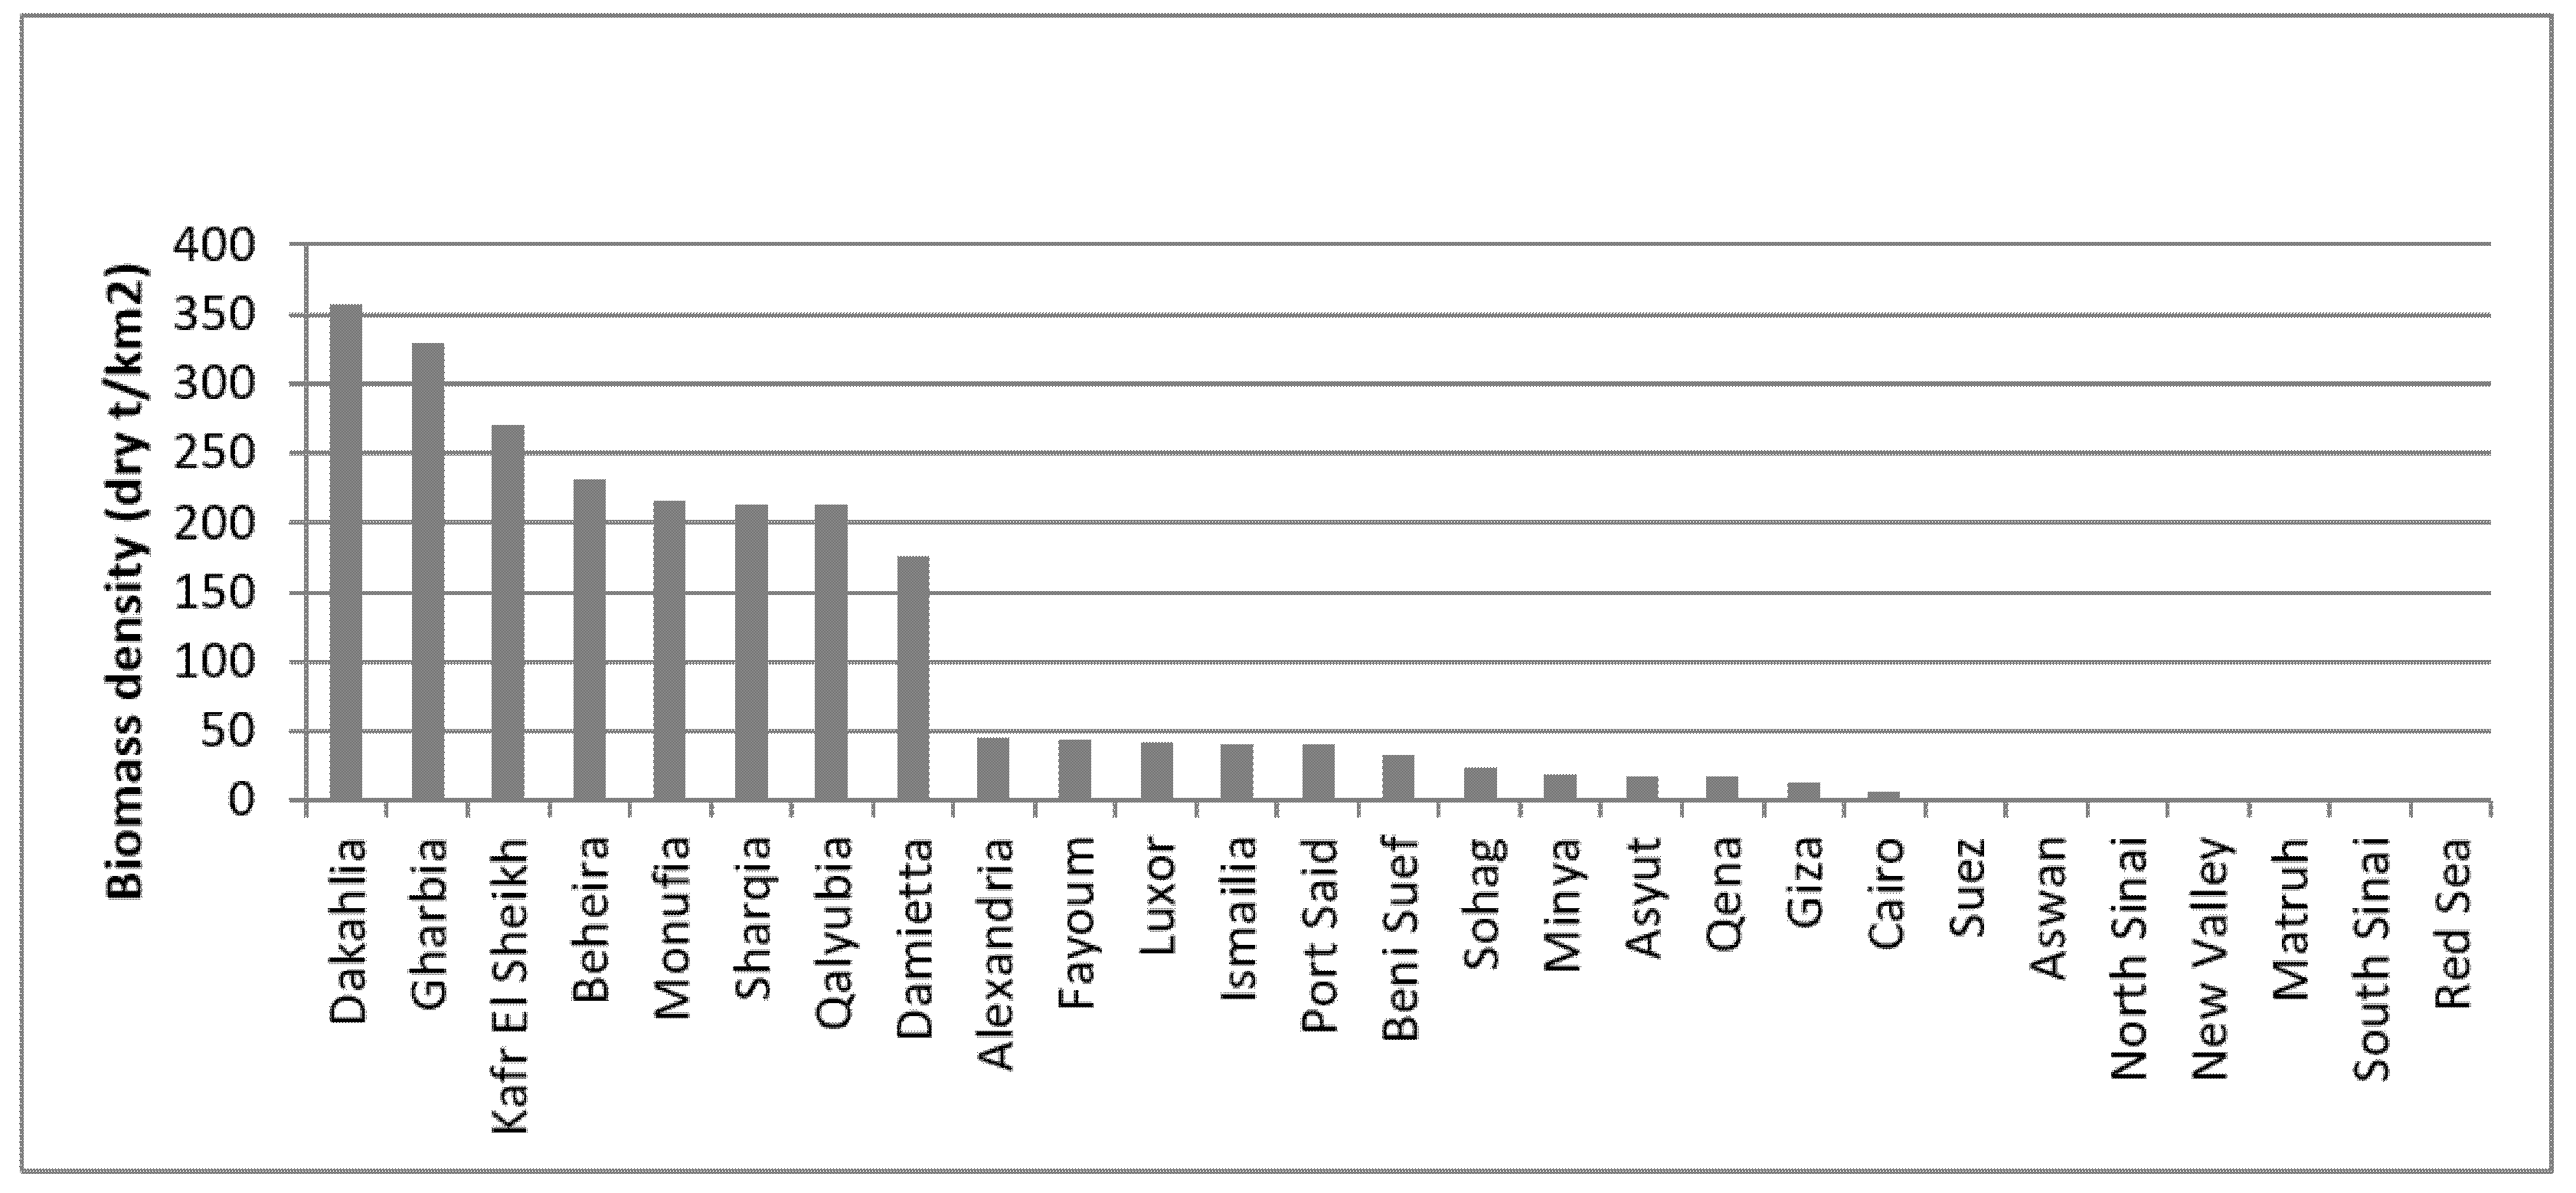
Figure 8 shows the biomass density in dry ton/km
2 for each governorate. It should be noted that Delta region governorates (Dakahlia, Gharbia, Kafr El Sheik, Beheira, Monufia, Sharqia, Qalyubia, and Damietta) have high densities, with 360, 330, 270, 230, 216, 213, 212, and 175 dry ton/km
2, respectively. The densities of other governorates are relatively lower and are less than 50 dry ton/km
2 (lowest value is observed in South Sinai and Red sea).
3.3.2. Energy Production Potential
The preliminary assessment assumes the installation of a biomass power plant of proper capacity at each governorate of Egypt. Accordingly, the total amount of crop residues available for energy production at each governorate is considered the main basis for determining the capacity of the power plant. After determining the size of the power plant, simulation models for the proposed power plants are implemented using the SAM simulation package to estimate the energy production potential for both the governorate and the national levels. Results show that the crop residues potential could fire 1.4 GWe installed capacity in Egypt, taking into account the possibility to use a mix of locally available resources to feed the plant in each governorate. The largest power plants could be installed in Beheira, Dakahlia, Sharqia, Kafr El Sheikh, and Minya with 325, 158, 132, 114, and 84 MW, respectively. The energy outputs of the simulation models are shown in
Figure 9. The energy output is estimated according to both the crop residues amount for each governorate and the technical parameters of
Table 4. The total electric energy that can be produced from all the proposed power plants is estimated to be 11 TWh/year, which represent about 5.5% of the total national electric generation in 2019, while at the moment the total electric generation from biomass residues in Egypt has zero contribution. In addition, the total thermal energy that can be produced from crop residues is estimated to be 24 TWh/year, and it can be useful for biomass drying, or supplying other local heat demand.
3.3.3. Cost of Energy Production
The preliminary economic assessment involves the estimation of the levelized cost of energy (
LCOE) for the energy production from the available crop residues in Egypt. This requires the collection of several cost data including investment cost, transportation cost, operations and maintenance cost, preprocessing cost, and feedstock cost as indicated in
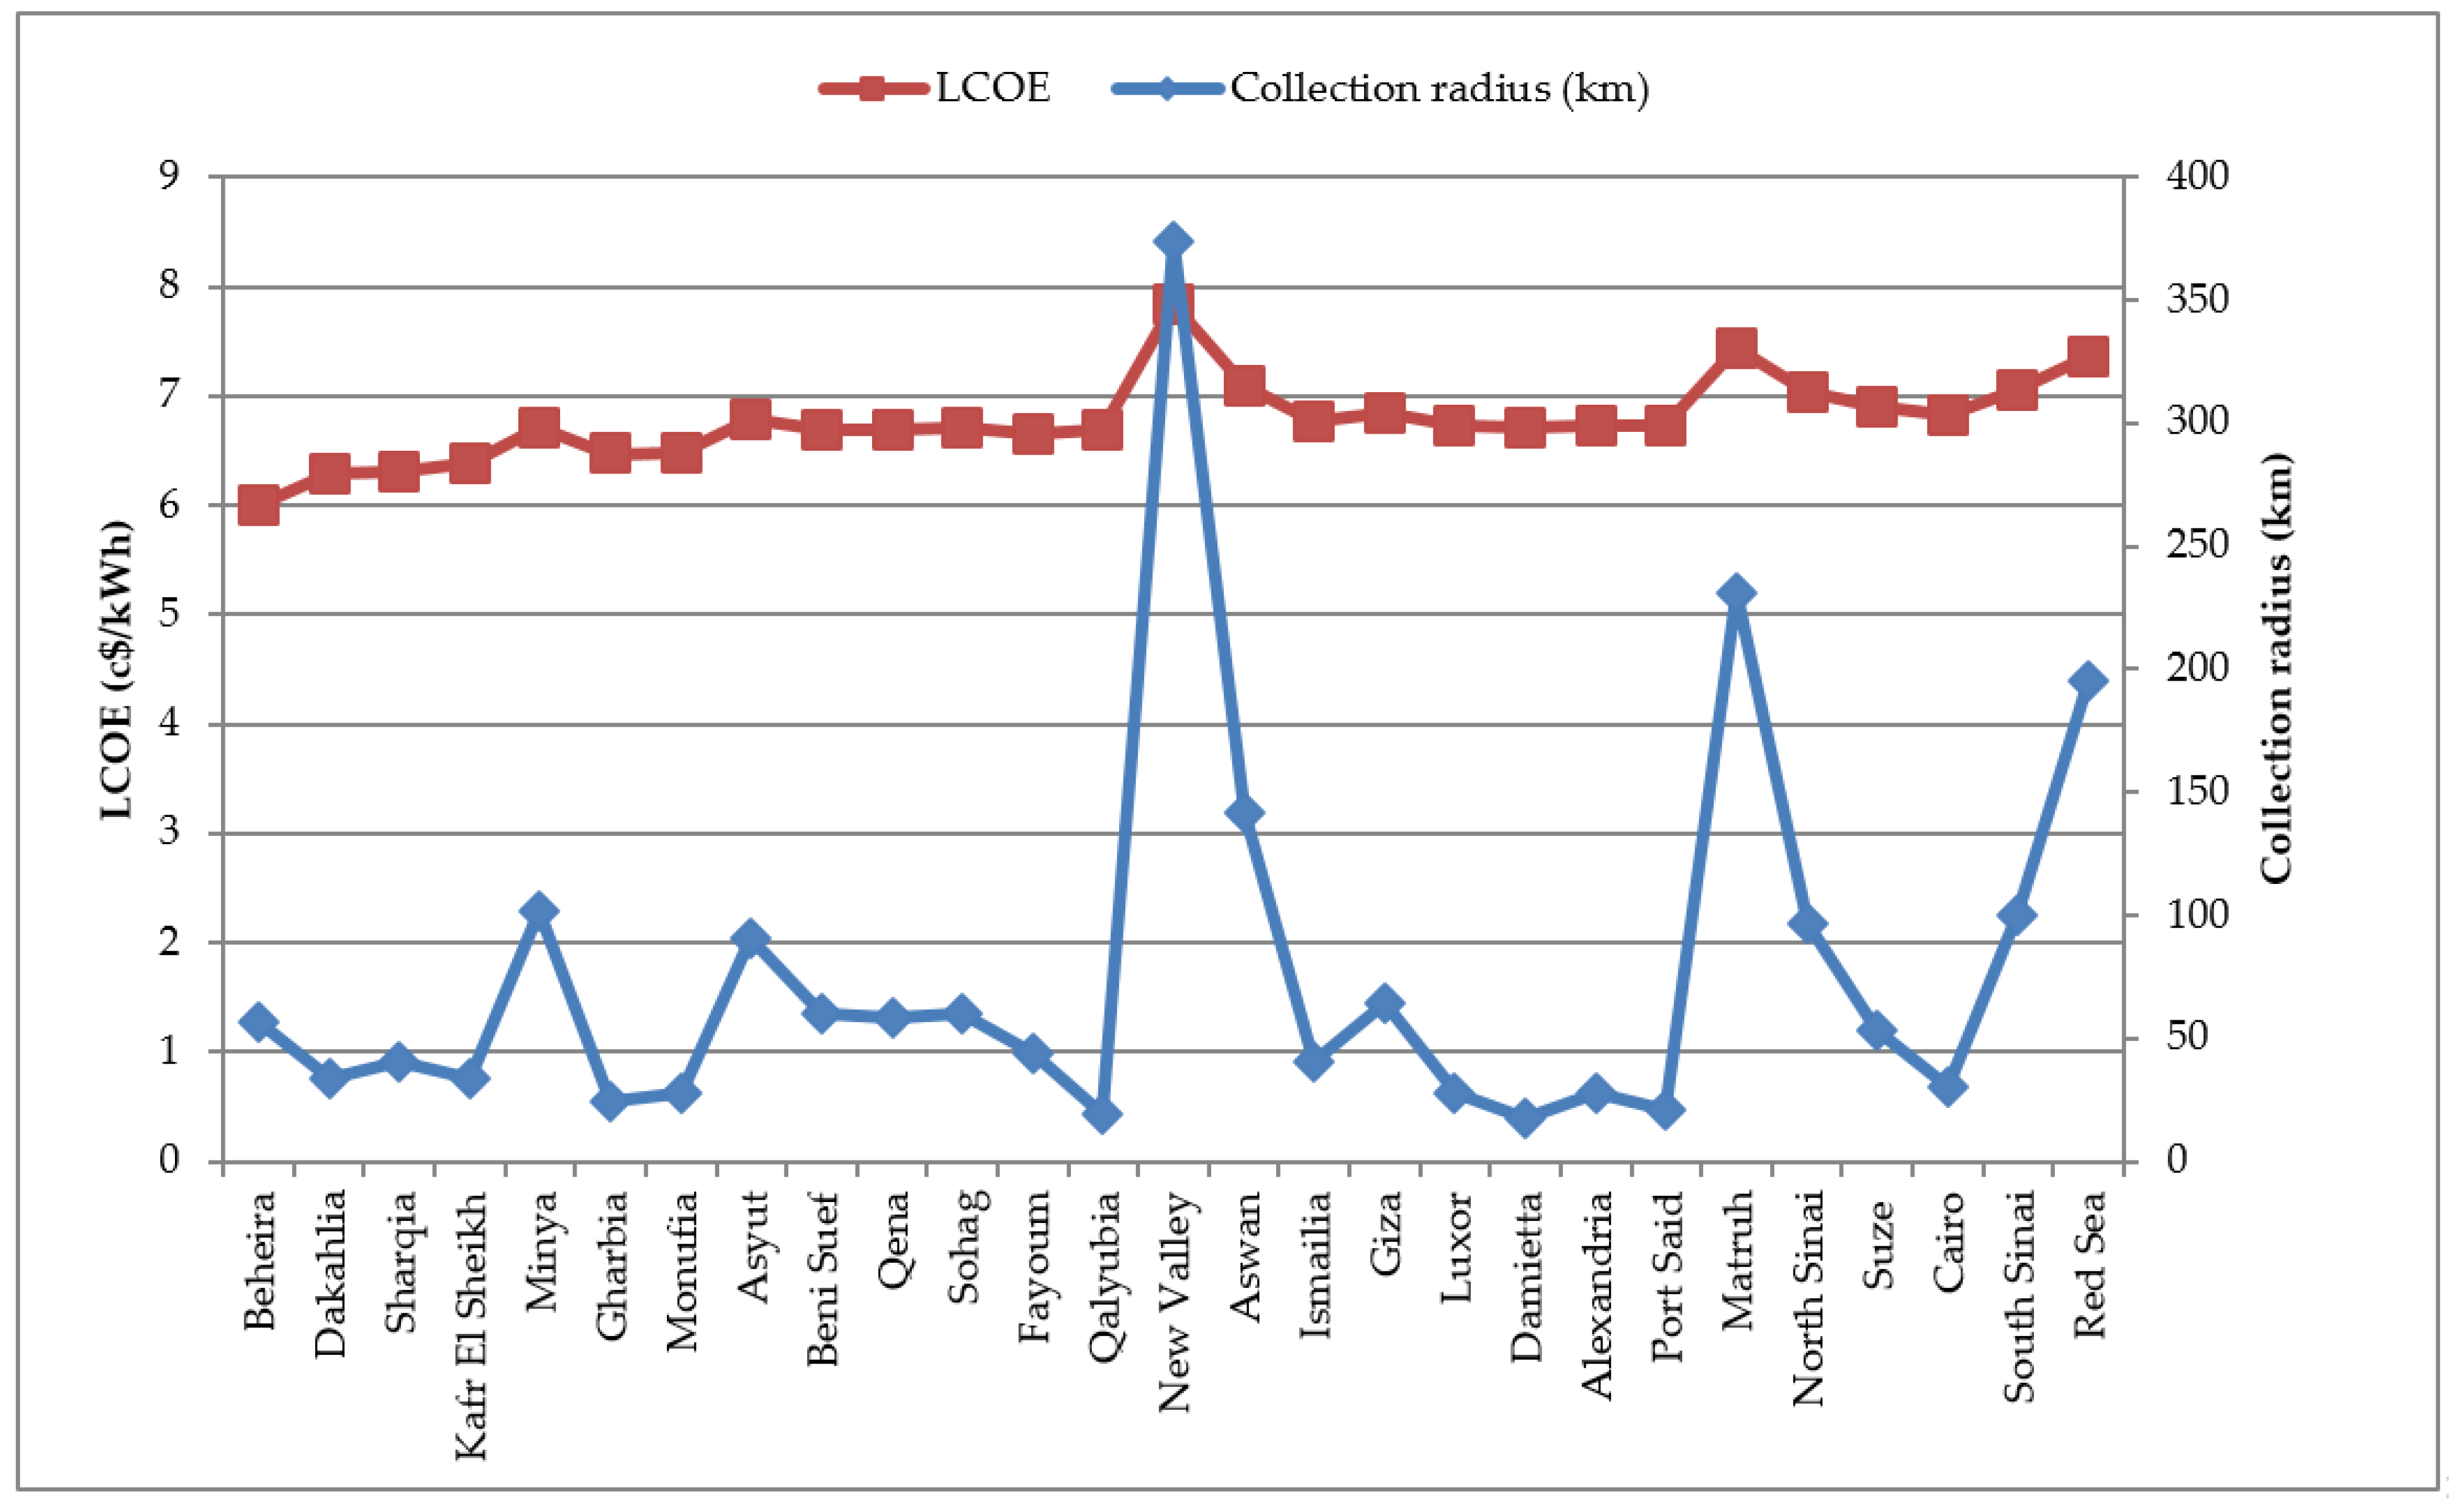
Table 6. It is important to mention that the variable transportation cost is calculated on the basis of the collection radius of crop residues of each governorate. It is assumed that a power plant will be installed at the centroid of the governorate, and that all the available crop residues are located around the power plant with a constant radius.
The results of the estimated
LCOE for the energy generation from the 27 power plants along with other benchmarking energy costs are reported in
Table 7. In addition,
Figure 10 shows the variation of
LCOE against the collection radius of each governorate. It can be noted that the
LCOE is almost proportional to the collection radius. The results indicate that the proposed power plants can produce electric energy at an average
LCOE of 6.77 ¢/kWh as compared to the
LCOE of 8.5 ¢/kWh for fossil fuels-based energy production is in 2020 [
46]. It is also highly comparable to the
LCOE of other renewable energy technologies, such as CSP, PV, and wind energy, which amount to 16 ¢/kWh, 8.3 ¢/kWh, and 5.5 ¢/kWh, respectively [
46]. The results of this assessment show that biomass power plants provide an economically feasible sustainable and renewable energy source that should be utilized to achieve the energy target of Egypt’s Vision for 2030.
3.3.4. Energy and CO2 Emissions Balance
In this study, life cycle assessment of energy use, and CO
2 emissions for the biomass power plants in all governorates are investigated based on country electricity specific factors of 431.08 g CO
2/kWh [
6], and fossil fuel consumption for electricity generation of 206.3 toe/GWh [
6]. On the basis of using the crop residues to generate power, the biomass cultivation and harvesting phases are neglected. In particular, the life cycle of energy input of biomass power plants is calculated based the total energy consumption for bioenergy production which includes energy consumption in crop residues collection, transportation, pre-processing. The energy saved balance represents the amount of energy saving due to the amount of energy generated by the proposed biomass power plants subtracted by total energy consumption. The life cycle CO
2 emissions of biomass power plant is based on the CO
2 emissions released throughout the electricity production supply chain which includes crop residues collection, transportation, pre-processing, combustion, and CO
2 re-uptake. CO
2 emission avoided represents the amount of CO
2 emission reduction due to the energy generated by biomass power plants and is calculated by multiplication of the total amount of energy production 11 TWh by the country electricity specific factors of 431.08 g CO
2/kWh. CO
2 emission avoided balance represents the amount of CO
2 emission reductions due to the amount of energy generated by the proposed biomass power plants subtracted by total CO
2 emission by the power plants.
The life cycle energy input, and CO
2 emissions of crop residues fired power plants are calculated and indicated in
Table 8. The estimated total life cycle energy input of the biomass power plants is 1.48 toe/GWh. The estimated total life cycle CO
2 is 109 g CO
2/kWh. Clearly, the major energy consumption and CO
2 emission is from crop residues transportation process. Moreover, the use of agricultural crop residues in electricity production can contribute to reducing the use of fossil fuel and the country environmental emissions by up to 2.25 Mtoe/year and 3.64 Mt of CO
2 per year, respectively.
4. Optimal Design of National Network of Biomass Power Plants
Recently, significant attention has been paid to the optimization of biomass supply chains at different decision making levels (strategic, tactical, and operational) [
17,
47,
48,
49]. In particular, a growing number of researches present mathematical models that can be employed to determine the optimal configuration of biomass supply chains [
50]. Most of the existing models are formulated as mixed integer linear programming models (MILP) that adopt single objective functions and several simplifying assumptions [
17], and the most common objective function in those models is the cost minimization [
51]. Other optimization criteria such as profit [
52] and net present value (NPV) maximization [
20], although limited, are also considered. In addition, most of the existing models consider the biofuels biomass supply chains that include biorefineries [
17,
53,
54], and much fewer supply chain models that consider power plants for electricity generation and co-generation [
50,
55]. This research proposes a mathematical model that can be applied to determine the optimal configuration of biomass supply chains that depends on agriculture residues for the production of electric and thermal energy.
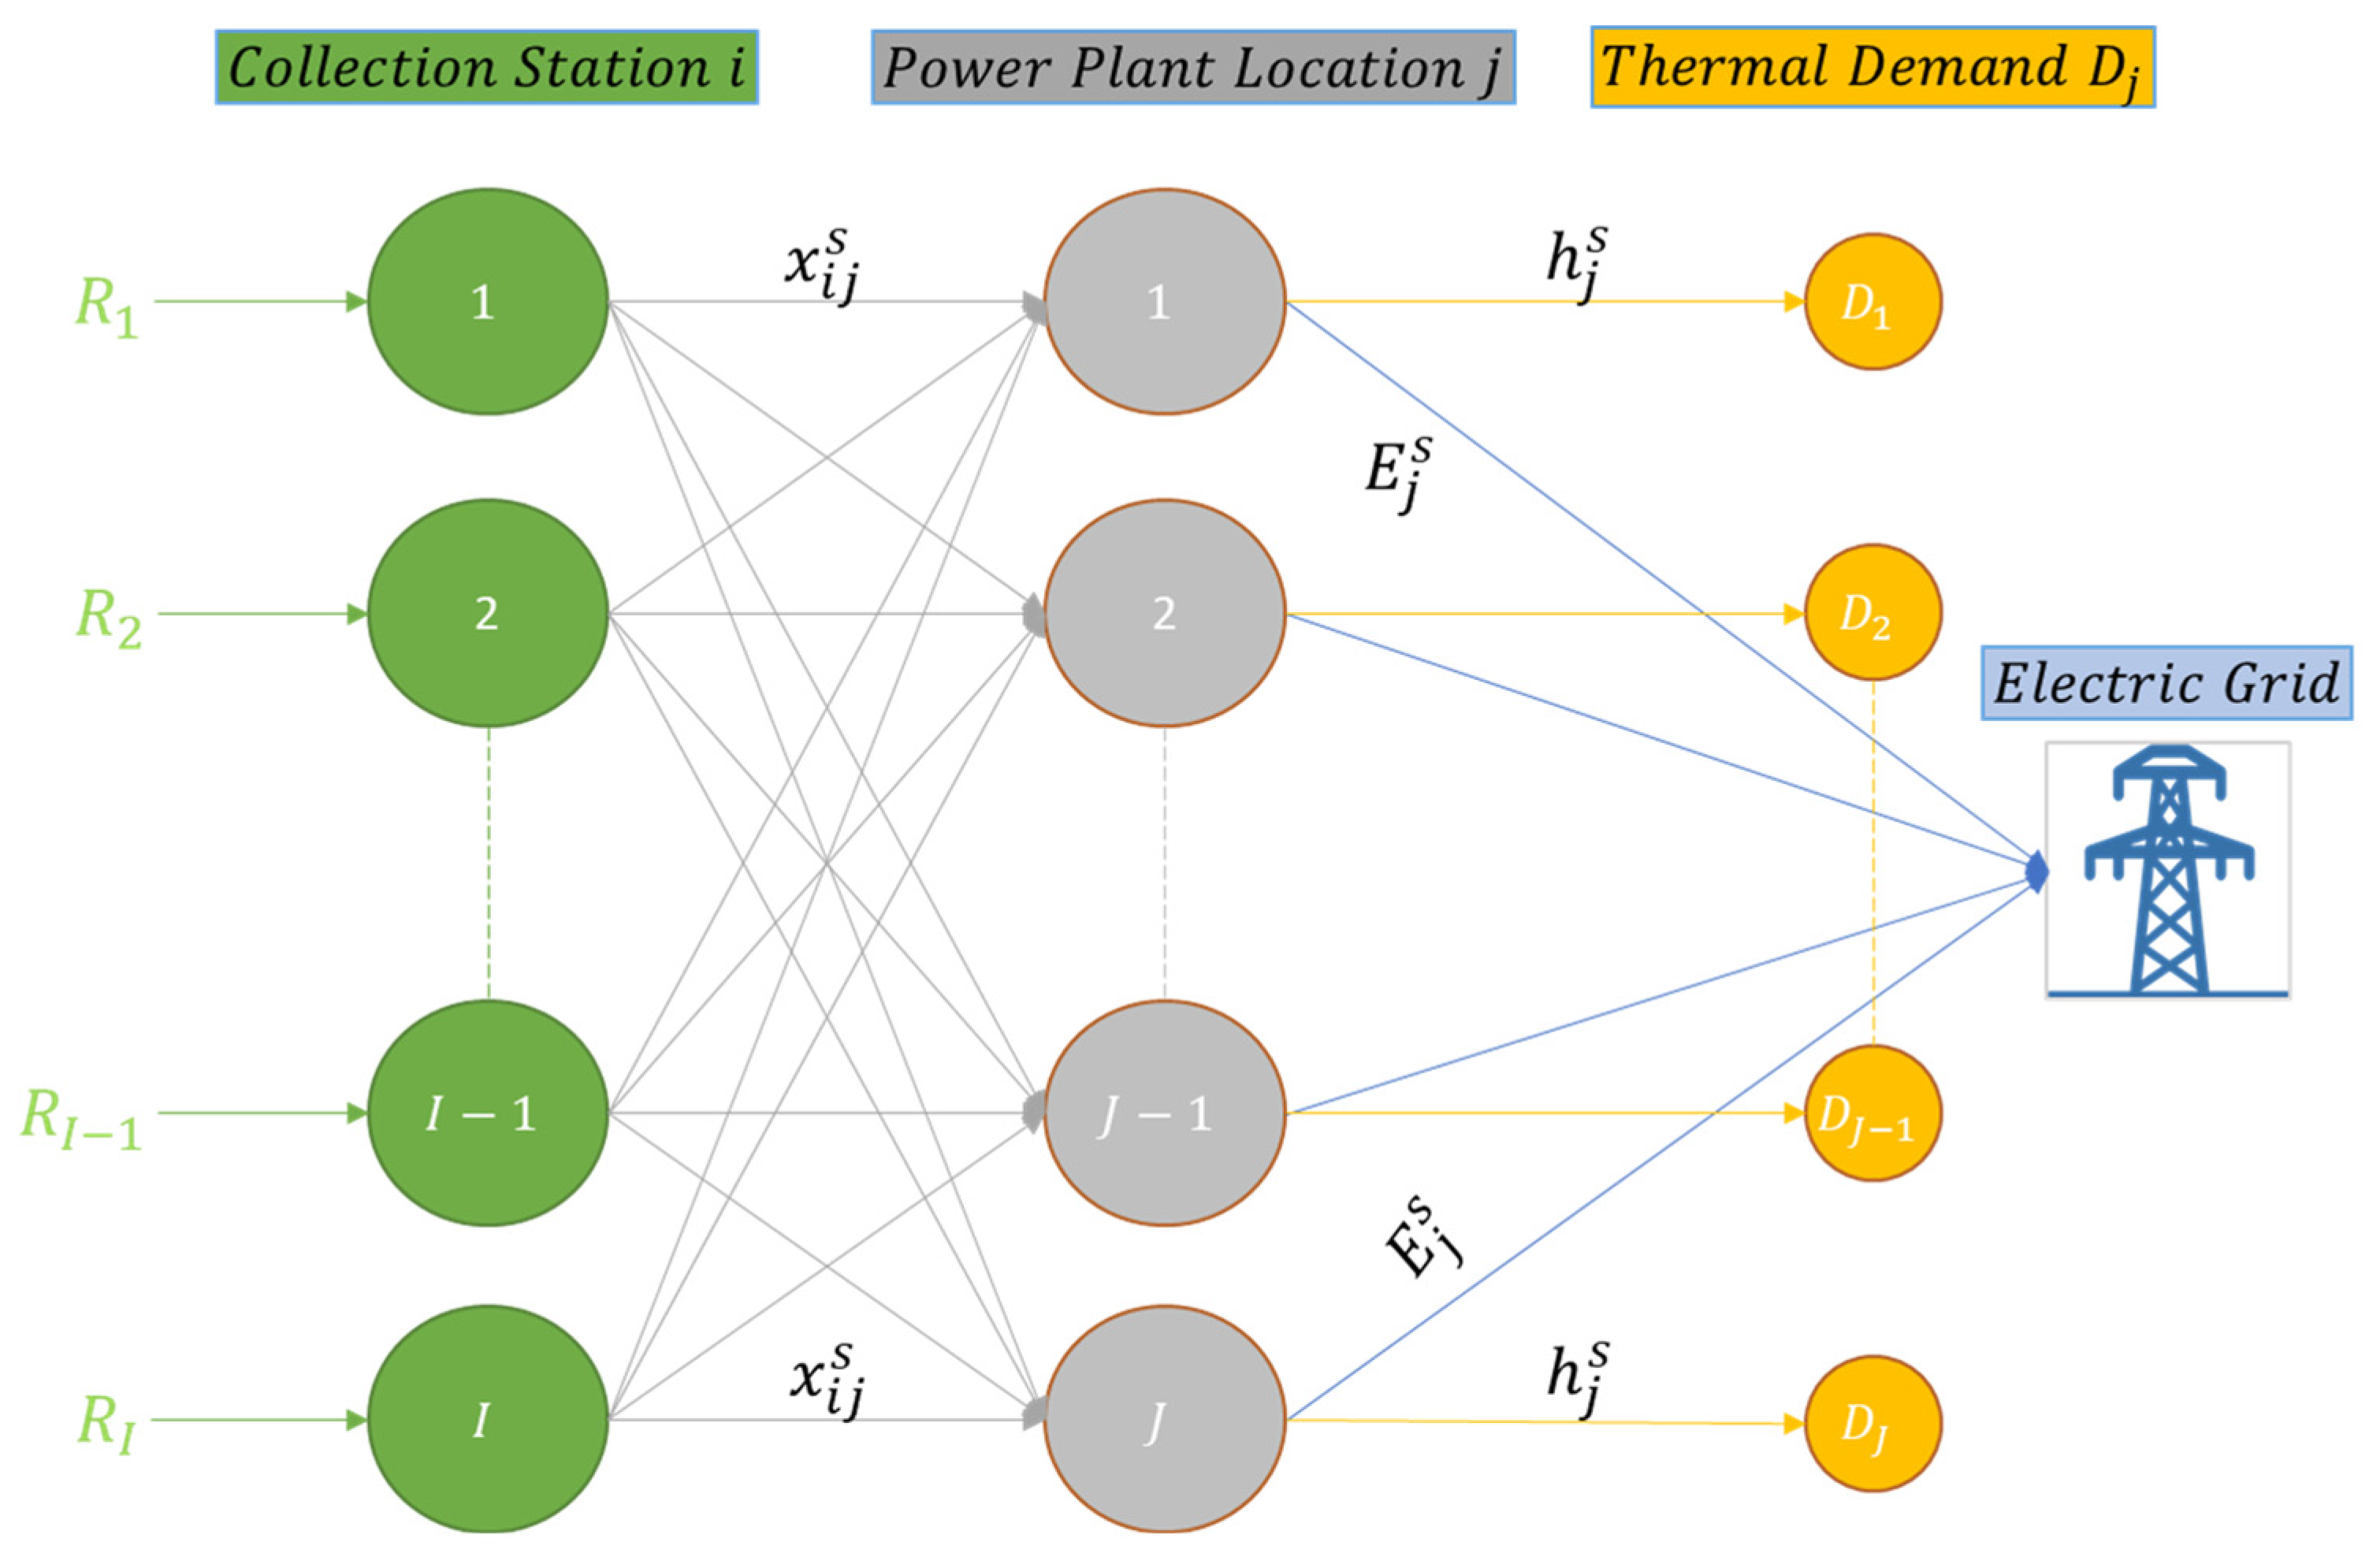
In general, the biomass supply chain related to the energy production from agricultural residues can be structured in three main stages, namely the collection stations, the power plants, and the thermal and electrical demand destinations (
Figure 11). In the first stage, a set of collection stations are distributed throughout the country to collect, store, and preprocess the spatially distributed biomass residues. A supply source
i of the agricultural residues (collection station
i) can supply up to a maximum amount
Ri. The second stage encompasses a set of conversion biomass power plants whose output is electric and thermal energies. The fired grate technology is the selected power plant technology as it is the most suitable technology for the agro-energy conversion in developing countries. Finally, the third stage consists of the demand destinations of the electrical and thermal energies.
The profit represents the difference between the total revenue and the total costs. The costs incurred in this supply chain include the collection costs, power plants’ fixed and variable (O&M) costs, and transportation costs. The total revenue is the revenue of the sold electric energy, and it is assumed that the generated electrical energy is directly injected into the national grid. Another possible source of revenue is attributed to the utilization of the produced thermal energy from the power plants at some potential locations that may have a thermal energy demand (
Figure 11). Accordingly, an optimal design for this supply chain should be determined such that the overall profit is maximized. Thus, the design of the biomass supply chain network addresses the strategic decisions related to the number of biomass power plants, and their locations and capacities, in addition to the optimal flow of distributing agriculture residues from collection stations to the power plants (
Figure 11).
These decisions should be made optimally as they affect the energy production cost considerably. This supply chain network design problem is modeled here as a mixed integer linear programming (MILP) model. Depending on the underlying assumptions, several simplified versions of this model are formulated in the literature. Traditionally, these models are of the Location-Allocation family of optimization problems. However, none of them considered the assumption of variable plant capacity levels, variable capital and O&M cost structures, variable plant efficiencies, while the number and plant locations are also unknowns. The MILP model can handle any number of capacity levels and number of locations, and its formulation is not confined to any specific case study. The indices, parameters, and decision variables of the proposed MILP model are defined as follows:
Indices:
| Source of biomass resources (collection station), where . |
| Potential power plant location, where . |
| Capacity size level, where . |
Model parameters:
| Electric energy price ($/kWh). |
| Thermal energy price ($/kWh). |
| Annual fixed cost of installing a power plant of capacity level at location ($/Year). |
| Collection and preprocessing cost of biomass resources at collection station ($/ton). |
| Operating and maintenance cost incurred for a power plant of capacity level at location ($/kWh). |
| Transportation cost from collection station to power plant at location ($/ton). |
| The amount of annually available biomass resources at collection station (ton/Year). |
| The capacity of a power plant with a capacity level (kW). |
| Electric energy efficiency of a power plant of capacity level . |
| Average lower heat value (kWh/ton). |
| Transportation efficiency. |
| Thermal energy efficiency of a power plant of capacity level . |
| The demand of thermal energy at location (kWh). |
Decision variables:
| A binary decision variable where , if a power plant of capacity level is installed at a location , and , otherwise, where , and . |
| The amount of biomass resources transported from a collection station to a power plant of capacity level and installed at a location (ton/Year). |
| The amount of electric energy produced by a power plant of capacity level and installed at a location (kWh). |
| The amount of thermal energy produced by a power plant of capacity level and installed at a location . (kWh). |
| The amount of thermal energy generated from a power plant of capacity level and utilized at a location (kWh). |
The complete MILP model can be formulated as follows:
The objective function (7) maximizes the total annual profit () which represents the difference between the total annual revenue from the sold energy and the total annual costs. The first two terms of the objective function are the revenues from the sold electrical and thermal energy, respectively. The last four terms accounts for the total annual costs that are the total annual fixed/capital cost, total annual collection cost, total annual operating and maintenance (O&M) cost, and total annual transportation cost.
Constraints (8) limit the total amount of agriculture residues that can be collected and transported from a collection station to all the installed power plants to be less or equal to the available amount at this source. Constraints (9) calculate the amount of electric energy that can be produced from a power plant of capacity level installed at potential location , where depends on the total annual amount of agriculture residues collected and transported from the different collection stations to the power plant. Constraints (10) ensure that can not exceed the maximum the capacity size of the power plant installed at this location. Constraints (11) limit the number of power plants that can be installed at potential location j to one. However, the power plant can be of any capacity level . Constraints (12) compute the total annual amount of thermal energy that can be produced from an installed power plant of capacity level s at potential location . Constraints (13) indicate that the annual amount of thermal energy that can be utilized to satisfy the thermal demand at a potential location cannot exceed , and constraints (14) ensure that cannot exceed the thermal demand at location . The remaining constraints (15)–(17) establish upper and lower bounds of some decision variables.
5. Model Implementation to Egypt
This mathematical model is applied to determine the optimal design of the proposed national network of biomass power plants that can be deployed in Egypt to utilize the widely available agricultural residues throughout the country.
Egypt encourages governorates to utilize their own resources including agro-residues, and therefore, the relevant data about the cultivated areas, crops, and residues are available at governorate levels. Accordingly, the administration of collection stations is assumed to be assigned to each governorate to collect the residues from the local farmers, and to simplify inbound and outbound logistics. In this case study, the collection stations are assumed to have fixed positions that should be as close as possible to the geometrical centroid of the governorate subject to closeness to the roads and accessibility networks.
Appendix A Table A1 represents the agricultural residues that are collected in 27 collection stations and can be distributed to source
. The collected residues at a collection station are preprocessed before transporting it to a power plant, and a collection station can supply more than one power plant.
Twenty-seven possible locations are assumed for the installation of biomass power plants, and these are assumed to be a negligible distance from the assumed locations of the collection stations. Data regarding the distances between the collection stations and potential power plant locations have been collected to estimate the transportation costs. The unit transportation cost of agricultural residues from a source to a potential location (, $/ton) are assumed as 4.03 $/ton-Km.
As indicated above, the total capital cost of a biomass power plant can be estimated by multiplying the power plant capacity in kilowatt by 1400
$/kW which can be considered as the base capital cost (
). As such, the annual fixed/capital cost (
) of a power plant of a specific capacity
can be calculated by dividing its estimated capital cost by its expected life-time which is considered to be 20 years. Moreover, the scaling effect is considered such that the fixed cost of a power plant with a capacity level
can be estimated as follows [
20,
56]:
where
is the base power plant capacity and
is the respective base capital cost that shall be considered for scaling the capital costs of other capacities, considering the scaling factor
. The scaling factor
is considered to be fixed for all the potential power plants locations and its value is considered as 0.8. In the above section, the variable operating and maintenance (O&M) cost has been estimated as 0.00525
$/kWh considering the values reported in the related literature. However, the variable O&M cost is considered to vary with the power plant capacity as it decreases as the power plant capacity increases. Moreover, the annual fixed cost (
) and variable O&M cost (
) are assumed to be the same for all potential locations available for installing biomass power plants throughout Egypt. The other required data includes the unit revenue of sold electrical and thermal energy. The price of electrical energy is considered to be equal to the estimated LCOE in the preliminary techno-economic assessment conducted in the above section. The revenue from the thermal energy is set to zero as there is no available data about the related thermal demand at the potential locations for installing the power plants. The other technical data are adapted from the literature as reported in
Table 4. The capacity size of each power plant can be selected from the considered 36 levels in
Table 9 in which the capacity size
ranges from 1 MW to 500 MW. Some preliminary experiments have been conducted to set this capacity range and it is also consistent with the capacity results obtained in the preliminary techno-economic presented above. Finally, the electrical efficiency
is considered to vary with the capacity size
[
8,
57]. The respective values of the efficiency for the different 36 capacity levels within the considered capacity range from 1 MW to 500 MW are collected from the related literature [
28].
The MILP model is solved using the MILP-Solver in MATLAB on a laptop with a processor of Intel(R) Core (TM) i7-8550U CPU @ 1.80 GHz, and 16 GB of RAM. The optimal solution of the model has been obtained in 2.12 hours. The optimization results reveal that a network of 5 biomass power plants should be established in Egypt, and the total annual profit is estimated as 525.70 Million $/Year (M$/year). Sensitivity analysis is performed to investigate the impact of increasing (or decreasing) the unit revenue on the optimal solution. Results reveal that although increasing the value will improve the overall profit, but the optimal network design will remain the same (locations, capacities, etc.). Considering the commercial price of electricity in Egypt ( = 0.079 $/kWh, ), the optimal solution indicates that the overall profit that can be gained in this case is 698.56 Million $/Year.
The detailed optimization results are provided in
Table 10 and
Table 11. The results show that five power plants with the same capacity of 460 MW should be installed at the following locations: Beheira, Gharbia, Beni Suef, and Sohag. The locations of these power plant are marked with triangles on the map in
Appendix A Figure A1. The results indicate that the total capacity of the power plants to be deployed throughout Egypt is 2300 MW and that the respective total electric energy and total thermal energy that can be obtained from this network are 15296.77 GWh and 35992.40 GWh, respectively. Moreover,
Table 11 presents the optimal distribution plan and allocation of the available amounts of agriculture residues to the different collection stations, and to the power plants to maximize revenue. For instance, the power plant installed at Location #19 (Beni Suef) will be allocated a total amount of residues of 1657.21 kiloton that will be supplied from 10 collection stations. Although the collection station #20 (Minya) can provide a larger amount of residues than the collection station #19 (Beni Suef), the model selected to open the power plant at Location #19 and allocates an amount from collection station #20 to this power plant. Similarly, instead of installing a power plant at Location #22 (Asyut), the model selected to install the power plant at Location #24 that will be supplied by seven collection stations (including the collection station at Location #22). Thus, the model has succeeded to optimally compromise the installation, operating, and distribution costs of the power plants and provided the optimal network design that achieves the highest possible overall profit.
6. Conclusions
This research presented an approach to study the technical and economic feasibility and impact of establishing a national network of agro-energy biomass power plants, with an application to Egypt. The approach rests on identifying the spatial distribution of the major agro residue source areas, locating collection and preprocessing stations, and then determining the optimal location and capacity of a set of biomass power plants. The approach classifies residues into three types that are different in their availabilities and technical characteristics. It incorporates the application of SAM simulation software to conduct the power transformation and energy calculations. It also applies a mixed integer programming model (MILP) to determine the optimal configuration of a national biomass supply chain network to maximize total profit.
The presented approach can be adopted to investigate the potential of bioenergy for other countries that have well-established agricultural sector in which mixtures of crops are cultivated in large dense areas. In particular, the approach is expected to be most suitable to the developing countries that lack renewable energy resources, currently waste their agro-residues, and depend mainly on imported fossil fuels to satisfy their energy demand. In most developing countries, the biomass supply chain logistics costs (collection, transportation, storage, and labor costs) are low. Thus, it is expected that deploying biomass power plants in an optimal manner would result in a highly competitive LCOE compared to other energy alternatives. The case study results of Egypt supports this competitiveness of the agro-based biomass energy costs.
A new generic MILP model is introduced to optimize the net profit of a supply chain network that consists of residue collection stations, biomass power plants, and electric energy demand grid. The model selects the best power plant locations among several potential locations, allows several levels of plant capacities for each plant, and permits different cost structures and efficiencies for each level. In addition, the model determines the optimal flow of the agriculture residues from the different collection stations to the power plants. The model is applied to obtain the best network design for Egypt. The optimal solution proposes a network of five power plants with capacities of 460 MW each. This network produces a total electric energy of 15296.77 GWh, a total thermal energy of 35992.40 GWh, and realizes an annual net profit of 698.56 million $/year at the commercial electricity price in Egypt.
Results indicate that Egypt has a promising biomass energy potential as it produces 10 Million tons/year (on dry basis) of sustainable crop residues. The total electric energy that can be produced from the residues is estimated as 11,000 GWh/year, which represent about 5.5% of the national electric generation in 2019. This considerably reduces the use of fossil fuel, the country environmental emissions by up to 2.25 Mtoe/year, and the CO2 by about 3.64 Mt/year. The LCOE of the biomass power plant show that CHP schemes are very competitive when compared with LCOE by conventional power plant and other renewable energy technologies. At present, there is no specific policy and economic support from the government of Egypt to facilitate the commercialization of biomass power generation. This study could be a comprehensive guide that may solicit the private sector to invest in biomass power generation.
The optimal network configuration with 5 major power plants is justified by the special spatial distribution of agro residues in Egypt. Analysis showed that about 53% of the total residue production in Egypt is attributed to four governorates only. Beheira comes at the top with 22%, followed by Dakahlia with 12%, Sharqia with 10%, and Kafr El Sheikh with 9%. Moreover, the Delta region governorates (Dakahlia, Gharbia, Kafr El Sheik, Beheira, Monufia, Sharqia, Qalyubia, and Damietta) have high biomass densities, with 360, 330, 270, 230, 216, 213, 212, and 175 dry ton/km2, respectively.
This research suggests several potentials for future extensions. For example, further studies may consider the techno-economic assessments of other biomass conversion technologies. More research may apply digital simulation modeling to analyze power plant performances while considering the stochastic nature and seasonality of residue production. Other optimization approaches (other than MILP) may be sought to accommodate much larger scale case studies while keeping a reasonable computational time. This may allow for relaxing several assumptions, and constructing models that are much closer to reality. Multi objective optimization methods are appealing in energy applications. They need to be devised for the design of energy supply chain networks to simultaneously express several key criteria, such as serviceability, reliability, in addition to net profit.


