Abstract
In this paper, we experimentally investigated two high temperature polymer electrolyte membrane fuel cell (HT-PEMFC) stacks for their response to the presence of reformate impurities in an anode gas stream. The investigation was aimed at characterizing the effects of reformate impurities at the stack level, including in humidified conditions and identifying fault features for diagnosis purposes. Two HT-PEMFC stacks of 37 cells each with active areas of 165 were used with one stack containing a pre-doped membrane with a woven gas diffusion layer (GDL) and the other containing a post-doped membrane with non-woven GDL. Polarization curves and galvanostatic electrochemical impedance spectroscopy (EIS) were used for characterization. We found that both N2 dilution and impurities in the anode feed affected mainly the charge transfer losses, especially on the anode side. We also found that humidification alleviated the poisoning effects of the impurities in the stack with pre-doped membrane electrode assemblies (MEA) and woven GDL but had detrimental effects on the stack with post-doped MEAs and non-woven GDL. We demonstrated that pure and dry hydrogen operation at the end of the tests resulted in significant recovery of the performance losses due to impurities for both stacks even after the humidified reformate operation. This implies that there was only limited acid loss during the test period of around 150 h for each stack.
1. Introduction
In recent years, proton exchange membrane fuel cells (PEMFC) have become one of the most researched and most mature fuel cell technologies [1]. However, despite the tremendous research efforts and the technological advancements thus far achieved, further optimization and improvements are still needed to reduce their cost, enhance their durability, and accelerate their commercialization [2,3].
PEMFC technology has evolved into two sub-types; one operating at low-temperature (LT-PEMFC) and the other at high-temperature (HT-PEMFC). In general, the two types consist of the same core components; bipolar plates with flow-field channels, a gas diffusion layer made of carbon fiber, a catalyst layer based on Pt particles and a carbon support, and a proton exchange membrane. The main difference between the two is the material used for the proton exchange membrane. In an LT-PEMFC the Perfluorosulfonic acid (PFSA) membranes, such as Nafion®, are used [4], which require liquid water to achieve good proton conductivity. Hence, their operation is limited to temperatures of up to 100 if no over-pressure is used. Therefore, liquid water is crucial for the proper operation of a Nafion®-based LT-PEMFC stack, and different techniques are being explored to enhance the humidification process [5,6].
On the other hand, an HT-PEMFC uses a polybenzimidazole (PBI) membrane impregnated with phosphoric acid (H3PO4) to facilitate the transfer of protons, which eliminates the need for liquid water, thereby, allowing for higher temperature operation—typically around 160 . This higher operating temperature comes with advantages, including easier cooling, more efficient utilization of excess heat, reduced or no water management issues, and a higher tolerance to impurities [7].
The latter also means that the HT-PEMFC systems can use (in addition to pure hydrogen) a variety of fuels, which can be converted into hydrogen-rich gas, without the need for purification. HT-PEMFC systems are commonly integrated with a reformer and use liquid methanol as a fuel, which is easier to transport and has a higher volumetric energy density compared to compressed hydrogen at 700 bar [8,9].
The advantage of using fuels that are more manageable than pure hydrogen when compared with LT-PEMFCs, especially liquid fuels, such as methanol, makes HT-PEMFCs ideal candidates to replace diesel generators for various applications, including as backups for telecom applications and auxiliary power units (APU). In addition, they are considered for combined heat and power (CHP) applications due to the efficient utilization of excess heat, while the infrastructure advantage of liquid fuels provides an edge over LT-PEMFCs for applications in heavy duty transportation both as a main power source and as range extenders [9].
However, there are still challenges that need to be addressed in order to optimize HT-PEMFCs. Durability and stability issues are some of the factors that hinder their wide spread commercialization and that are being studied to optimise fuel cell components and operating conditions [10,11]. For instance, in the steam reforming of hydrocarbons to hydrogen-rich syngas, the steam is supplied with over the stoichiometric ratios. Thus, in addition to hydrogen, CO2, and CO, there is always some water vapor present in the reformed gas. The presence of water can enhance the fuel cell performance by alleviating the CO poisoning effect [12].
On the other hand, Zhou et al. [13] proposed that the water content in the anode gas should be minimized to avoid the performance loss when the HT-PEMFC is operated at lower operating temperatures (i.e., 140–160 ), and researchers reported that this may also cause faster degradation due to increased acid loss [11]. According to Park et al. [14], the performance loss due to a humidified atmosphere can be reversed by precise acid-dosing of the degraded membrane electrode assemblies (MEA).
When the doping level of a PBI membrane exceeds two H3PO4 molecules per PBI repeat unit, free and mobile acid molecules are present in the membrane, as only two phosphoric acid molecules can bond with each PBI repeat unit [7]. This acid can leach out of the membrane by various mechanisms, such as diffusion, capillary transport, membrane compression, evaporation, and especially, can be washed out by condensed water during shutdowns and/or cold starts [15].
The phosphoric acid anions can adsorb on the Pt particles on the cathode side and occupy the electrochemical surface area (ECSA) of the catalyst for the already slow oxygen reduction reaction (ORR) [16,17]. The low permeability of oxygen in the phosphoric acid and phosphate anion adsorption on the Pt catalyst are considered as the main causes for the lower performance of HT-PEMFC compared to LT-PEMFC under pure hydrogen operation [7,18]. As the acid tends to leach out of the membrane, it can also block some of the pores for reactant gases in the catalyst and gas-diffusion layer (GDL) and, thus, may cause significant mass transport resistance [18].
To alleviate these issues several approaches are taken to optimise the MEA core components, such as improving the design of the PBI membrane by tweaking its structure, acid doping levels, and thickness [19]. There are typically two acid doping methods for PBI membranes. The first method is called pre-doped, in which PBI is dissolved in polyphosphoric acid and the solution is then cast into a membrane. Moisture from the surrounding environment is sufficient to induce a sol-gel transition by the hydrolysis of polyphosphoric acid to phosphoric acid resulting in phosphoric acid-doped PBI membranes.
The second method is called a post-doped membrane, where the PBI is first dissolved in an organic solvent and cast into a membrane, where the acid doping is then achieved by immersing the PBI membrane into highly concentrated phosphoric acid. The doping levels are usually higher for pre-doped membranes at up to 70 molecules of H3PO4 per PBI repeat unit [20], while the post-doped membranes have a doping level of around 9–12 molecules of H3PO4 per PBI repeat unit [21]. Due to swelling, higher doping levels in pre-doped membranes lead to these membranes being thicker compared to post-doped ones. To increase the membrane durability or acid uptake, various fillers (e.g., SiO2, TiO2, aluminium silicate, and graphene oxide) or different synthesis techniques (e.g., sulfonation, cross-linking, or the electrospinning of nanofibers) are used [19,22].
The preparation of the catalyst layer along with the pore sizes and tortuosity of the GDL are important factors when it comes to supplying reactants to the triple phase boundary (TPB) [23], which is the crucial contact point among the Pt catalyst, the PA/PBI electrolyte, and the reactants for the electrochemical reactions to take place. The amount of electrolyte (phosphoric acid) around the Pt particles is of paramount importance, where too little electrolyte will not create sufficient paths for proton transfer and will cause charge transfer issues, while too much electrolyte might cover the active sites for the reactants.
To optimize the catalyst layer, various binders (e.g., polytetrafluoroethylene (PTFE), and polyethylene oxide) can be added to make the layer more hydrophobic and/or better adhere to the membrane and the GDL [24]. Often a sub-layer, called a mesoporous layer (MPL), is used to create better contact between the catalyst layer and the GDL, which also improves the redistribution of acid in the catalyst layer, thus, also enhancing the electrochemical surface area and preventing the substantial intrusion of acid into the GDL [25,26].
Traditionally, the catalyst loading in HT-PEMFCs is higher compared to LT-PEMFCs, and current state-of-the art electrodes have loadings of around 1 [27]. Some recent studies have investigated MEAs with low platinum loading [28,29], where it was observed that the traditional MPL or catalyst layer compositions may have to be changed to allow increased Pt utilization. Martin et al. [28] showed that electrodes without any binder or ionomer in the catalyst layer and catalyst loading of only 0.1 yielded a maximum performance of 0.42 . Yao et al. [29] also investigated an HT-PEMFC without the MPL and with Pt loading of 0.2 and achieved a power density of 0.32 .
The GDL is a porous material that is traditionally made of carbon fibers and serves multiple purposes. It provides an electrically conductive pathway for current collection, passage for transport of reactants and removal of the produced heat and water, mechanical support to the MEA, and protection of the catalyst layer from corrosion or erosion caused by flows or other factors. Carbon fibers can either be woven in a so-called carbon cloth or non-woven in a form of carbon paper. The main difference between the two types is that non-woven carbon tend to be thinner, more brittle, and less compressible, compared to the woven forms.
Kannan et al. [30] compared four types of commercially available non-woven GDLs from Freudenberg that were assembled with the same type of a post-doped membrane into the MEAs. The main difference between the investigated GDLs is the composition of the MPL and surface treatment of the GDL. The lowest degradation rate was demonstrated with the GDL that most efficiently retained the phosphoric acid. Therefore, each type of GDL can be tailored to have different porosity, hydrophobicity, and conductivity characteristics.
As with all fuel cell types, the initial activation phase or break-in is crucial to allow the HT-PEMFC to reach its optimal performance and to avoid fast degradation [11]. The break-in period depends on the structure of the components comprising the MEA and on the acid doping method. In a study [21], researchers demonstrated that pre-doped MEAs required at least 30 h to achieve peak performance while post-doped MEAs underwent minor changes in the break-in period, which may indicate that this type of MEA can be used directly without the need for a break-in period. The changes in performance during the break-in can be ascribed to redistribution of the phosphoric acid within the membrane, catalyst layer, and the GDL [25].
In this work, we study two HT-PEMFC stacks assembled with the same components but with different types of MEAs. The first MEA type consists of a post-doped membrane and a non-woven GDL, while the second consists of a pre-doped membrane and a woven GDL. These two types of stacks were exposed to various operating conditions, namely, N2 dilution and CO and CO2 poisoning both with and without humidification. For the experimental characterization of the effect of the different operating conditions on the stacks, polarization curves and electrochemical impedance spectroscopy (EIS) were used. The data obtained by EIS were then analyzed by using two approaches: an equivalent circuit model (ECM) and distribution of relaxation times (DRT).
2. Methodology
2.1. Experimental Setup
A schematic of the test setup used for the experiments in the current work as well as a photo of one of the fuel cell stacks are shown in Figure 1. The experimental characterization was carried out using a GreenLight Innovation fuel cell test station. Two oil-cooled HT-PEMFC stacks of 37 cells, each with active area of 165 , were used. The first stack employed a post-doped Dapozol membrane by Danish Power systems (DPS), which utilized meta-PBI as polymer materials and a typical acid doping level of 8–10 phosphoric acid molecules per repeat unit of PBI. The second stack used pre-doped MEAs by Serenergy A/S that utilized a direct cast membrane of the para-polybenzimidazole type with an acid doping level of 30–40 phosphoric acid molecules per polymer repeat unit.
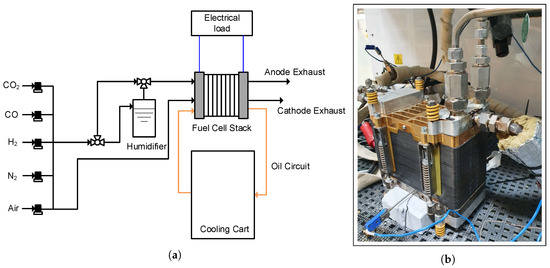
Figure 1.
Test setup (a) A schematic of the test setup. (b) One of the short stacks used in the current work.
While both membranes utilized phosphoric acid for proton conduction, the high acid content leads to less mechanical stability of the membranes resulting in differences in the chosen thicknesses of the membranes used, with the post-doped membranes being thinner than the pre-doped membranes. This thinner format of the post-doped membranes partially compensates for the lower acid doping level when it comes to the proton conductivity. Finally, the DPS MEAs employ a non-woven gas diffusion layer (GDL), whereas the Serenergy MEAs use a woven type GDL, and both MEAs have a Pt loading of the electrodes of ∼1 .
2.2. Test Procedures
The tests in the current work consisted of different gas compositions in the anode feed stream of two fuel cell stacks. At the beginning of each test (BOT), the stacks were operated under a pure and dry hydrogen feed on the anode side as a reference for the study. This was then followed by the main tests of the current work—namely, nitrogen dilution, simulated dry reformate and simulated wet reformate. Finally, pure and dry hydrogen in the anode feed was used at the end of the tests (EOT) to check the reversibility of the effects of the impurities on the fuel cell stacks. The test procedures along with the compositions of the anode feed stream for each test step are given in Table 1.

Table 1.
The test procedures.
Both stacks underwent a 50-h break-in procedure in the beginning of the test at 0.2 under pure hydrogen operation. Successively, the different fuel compositions were tested on the anode side of the stack, and each fuel composition was operated for 24 h. Polarization curves and EIS spectra were recorded 1 h after the start and at the end of each 24 h test period. Galvanostatic EIS sweeps were recorded between 4 kHz and 0.1 Hz at 20 points per decade using an in-house-built frequency analyzer.
For the EIS measurements, an AC amplitude of A was used for all set points, which corresponds to 7.5% of the operating current of 65 A. To minimize measurement errors, three impedance spectra were recorded at each test condition with 15 min of relaxation time before each measurement. The repeatability of the EIS measurements is shown in Figure 2, where it can be seen that the three EIS measurements on pure hydrogen lay on top of each other.
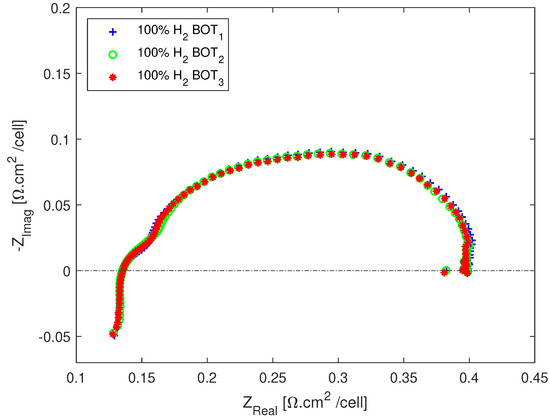
Figure 2.
Repeatability of the EIS measurements.
For the polarization curve measurements, the current was increased from 0 to 75 A, with a step increase of 2.5 to 10 A to capture the activation losses better and a wider step of 5 A for the remainder of the curve. A dwell time of 3 min was used at each current during the polarization measurements. An anode stoichiometric ratio of 1.3 and cathode stoichiometric ratio of 2.5 were used for all the tests.
An air-bleed step was used in order to recover the effects of CO before proceeding to the next step whenever a test step contained CO in the anode gas composition. The air-bleed step consisted of running the fuel cell at the anode fuel composition of 2% air and 98% H2 for five minutes at 65 A. The same test matrix was followed for both stacks to carry out the characterization study.
2.3. Data Analysis
In this work, a combination of polarization curves and EIS measurements were used to monitor the performance and investigate the effects of the different reformate compositions on two stacks. The EIS data was analyzed by means of equivalent circuit model (ECM) fits and DRT peaks in order to characterize both the post-doped and pre-doped stacks.
While ECM fits can provide a quick physical interpretation of the impedance measurements, there are still ambiguities surrounding their interpretation, and different ECMs can fit the same EIS data. Therefore, in the current work, the shapes of the impedance spectra in the Nyquist plots, the DRT peaks, and the understanding of the fuel cell stacks was used as a basis for the choice of ECM and analysis of the results. A typical ECM for a PBI-based HT-PEMFC [31,32], composed of a series connection of an inductor (L), a resistor (R), and three parallel resistors and constant phase elements (R‖CPE), was used to analyze the different losses of the fuel cell stacks.
A constant phase element is pseudo-capacitive element used to mimic the depressed EIS data of real systems for a better fit by accounting for interface inhomogeneities [33]. In the literature, CPE has been attributed to the DC conductivity and the capacity of an ion conductor [34] as well as to the surface roughness and electrode porosity [33]. However, there are still uncertainties regarding its physical meaning [33].
Therefore, in the current work, CPE was only used for better fits by keeping the exponential coefficient constant in the expression for the impedance of a CPE (, where is the pre-factor of the CPE and is the exponent). Only changes in the resistances due to the different operating conditions were monitored and analyzed. A more detailed discussion on the advantages and disadvantages of analyzing impedance measurements via ECM fitting along with the typical models for HT-PEMFCs and their physical interpretations is summarized in our previous work [7].
The ECM used in this work is shown in Figure 3. In the interpretation of fitted resistances, it is generally accepted that the ohmic resistance (R) represents all the contact resistances, including the proton conduction across the electrolyte and its changes reflect the changes in proton conductivity [35,36]. High frequency resistance (R) and intermediate frequency resistance (R) are associated to charge transfer losses, with the former dominated by the anode charge transfer losses and the latter by those in the cathode [37]. Finally, the low frequency resistance (R) is ascribed to the mass transport losses [38].
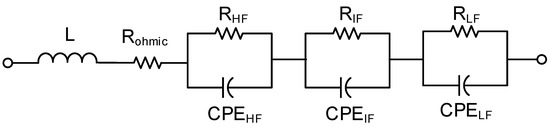
Figure 3.
The equivalent circuit model used in this work.
Distribution of relaxation times (DRT) analysis is another method of analyzing impedance data, in which the impedance spectra are represented by an infinite number of infinitesimal parallel R‖C-elements in series [39]. The impedance data is then resolved on the basis of the time constants and presented as a distribution of these time constants that represent the electrochemical processes in the fuel cell [40]. Further description of DRT analysis and its use in fuel cells can be found in the literature [39,41,42,43,44].
The DRT deconvolution of the impedance spectra was performed with a freely available MATLAB application (DRTtools). The deconvolution takes place by discretizing the complex impedance response given by Equation (1) into a finite number of time constants, which gives Equation (2) [39,41,42,43]:
where represents the ohmic resistance, represents the overall polarization resistance of the fuel cell, j is the imaginary number, is the frequency, = RC is the time constant of the single R‖C—element, and represents the distribution function. The term in Equation (1) represents the fraction of the overall polarization with relaxation times between and + and the term in Equation (2) represents the relative share of each on the overall polarization resistance. Therefore, in order to account for the absolute resistance distribution and compare the DRT analysis more easily with the information in the Nyquist plot, was scaled by multiplying it with the overall polarization resistance () [39].
Since Equation (2) cannot be solved numerically, a Tikhonov regularization can be used to stabilize the solution numerically, which, in this work, was set to 10, based on recommendations from the literature on fuel cells [39,43]. Even though the attribution of the different DRT peaks to the losses in the fuel cells is not straightforward, based on the literature and experience, in this work, peaks below 1 Hz were associated with mass transport losses, peaks between 10 and 50 Hz were attributed to oxygen reduction reaction (ORR) losses, and peaks above 100 Hz were considered to be due to hydrogen oxidation reaction (HOR) losses and proton conduction losses [44]. In a DRT plot, taller peaks indicate higher losses.
3. Results
3.1. Nitrogen Dilution
Nitrogen can be present in the anode feed stream of an HT-PEMFC in cases where the fuel cell is fed with reformed natural gas or decomposed ammonia. Nitrogen is known to have a dilution effect when fed into the anode of an HT-PEMFC along with hydrogen [45]. Therefore, nitrogen dilution in the current work was studied for two purposes.
First, given its presence in some reformate mixtures, it is important to investigate its effects at the stack level for the two types of MEAs. Secondly, as an easily available inert gas, nitrogen was used as a buffer gas to complete the anode gas mixtures to 100% when comparing the effects of dry and wet reformate gases on the two stacks. Therefore, nitrogen dilution analysis also has the purpose of distinguishing the effects of dilution from those of humidification. The gas recipes used for the different stages of the tests are shown in Table 1.
The results of the current work show that the performance decreased for both stacks with nitrogen dilution, Figure 4. The initial dilution effects remained unaltered for the 24 h of tests for the pre-doped stack; however, they continued to exacerbate for the post-doped stack. The initial performance of the post-doped stack was higher than that of the pre-doped stack under the same operating conditions, Figure 4a, while the polarization losses were higher for the post-doped stack as can be seen from the slopes of the polarization curves in Figure 4a and the impedance spectra in Figure 4b.
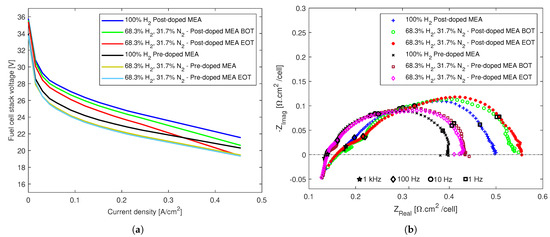
Figure 4.
The effects of N2 dilution on both stacks. (a) Polarization curves. (b) EIS spectra.
The two types of MEAs used in the two stacks had different properties as described in the Section 2, and therefore their performances cannot be compared directly with each other. Other than the MEA properties, the stack assembly can also influence the overall performance. Hence, the current analysis will focus on how the different operating condition affected each stack and what fault features can be identified.
All the high frequency real axis intercepts in the Nyquist plot lay on top of each other, implying that the ohmic resistance was not affected by dilution. However, there is a size increase of the impedance spectra in all frequency regions, which implies performance losses, perhaps due to reduced triple phase boundaries as a result of the acid redistribution and eventual loss of excess acid.
In Figure 5, the fitted equivalent circuit resistances and the DRT analyses of the two stacks are shown. The ohmic resistances remain almost unaltered in both cases, with a slight decrease for the pre-doped stack, whereas R is the resistance that is the most impacted by dilution in both cases, increasing both in the beginning and the end of the dilution tests for both stacks, Figure 5a,b.
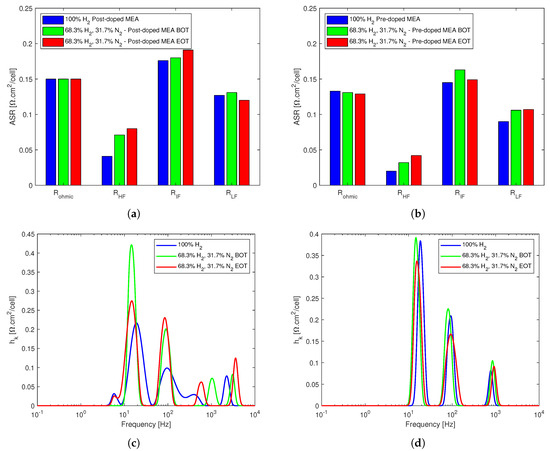
Figure 5.
EIS data analysis for the effects of N2 dilution on both stacks. (a) EC model fitted resistances for the post-doped MEA-based stack. (b) EC model fitted resistances for the pre-doped MEA-based stack. (c) DRT analysis of the post-doped MEA-based stack. (d) DRT analysis of the pre-doped MEA-based stack.
This can be ascribed to the fact that the dilution was done by reducing the hydrogen concentration of the anode feed and substituting it with nitrogen, which significantly reduced the amount of hydrogen available for the electrochemical reaction in the active sites. The cathode charge transfer loss that dominated R also increases for both stacks in the beginning of the dilution tests; however, while it continued to increase for the post-doped stack, it recovered for the pre-doped stack. The mass transport losses appeared unaffected for the post-doped stack, and an overall slight increase was observed for the pre-doped stack.
Figure 5c,d show the DRT analyses for the two stacks, where up to five peaks for the post-doped stack and three distinct peaks for the pre-doped stack can be seen. The additional peaks of the post-doped stack are a small one at low frequency right below 10 Hz and another at high frequency, between 1 and 10 kHz. However, none of the peaks are below 1 Hz, which highlights that the mass transport losses as result of nitrogen dilution were not significant in either stack. All the peaks were affected negatively in the beginning of the dilution tests with successive recovery for most of the peaks for both stacks, with an exception at the high frequency region for the post-doped stack, where the DRT peak size continue to increase.
3.2. Poisoning Effects of Dry and Wet Reformate Impurities
The effects of CO and CO2 on the performance and durability of an HT-PEMFC are fairly well investigated in the literature [7,27,46]. However, most of these studies were performed at the single cell level and often investigated only simulated dry reformate composition. In the current work, both dry and wet reformate impurities in the anode feed were studied at the stack level for two types of MEAs in order to understand not only the effect of impurities but also the effects of water vapor in the anode feed, which is an inevitable by-product of the methanol steam reforming process. Water has positive effects in low temperature PEM fuel cells, where it is used as a proton transport medium. Nonetheless, its effects on an HT-PEMFC are not fully understood, with some reporting advantages [47] and others recommending that it is avoided under certain operating conditions [13].
3.2.1. Poisoning Effects on an HT-PEMFC Stack with Post-Doped MEAs
The poisoning effects of both dry and wet reformate impurities on the fuel cell stack with a post-doped membrane and non-woven GDL-based MEAs are reported in Figure 6. From the polarization curves in Figure 6a, it can be seen that the performance decreased with the introduction of reformate impurities. The effects of both dry and wet reformate impurities are similar.
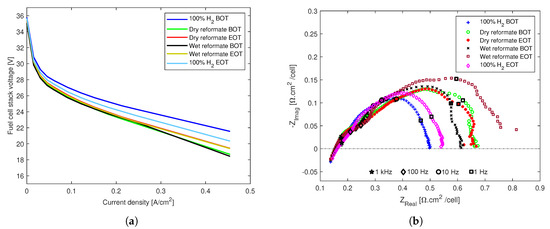
Figure 6.
The effects of dry and wet reformate impurities on an HT-PEMFC stack with an MEA composed of a post-doped PBI membrane and non-woven GDL. (a) Polarization curves. (b) EIS spectra.
The effects for both cases are the highest in the beginning of test and there is a slight recovery, especially at higher current densities at the end of the 24 h tests. This is inline with certain reports that, even though the net effect of N2 dilution on the thermodynamic, kinetic, and mass-transport driving forces is approximately independent of the relative humidity, both the relative humidity and N2 dilution affect the anode potential in the same way that water vapor also causes dilution effects [13,48,49].
Similar effects can be seen from the Nyquist polts in Figure 6b, which were recorded at the higher current density end of the polarization curves at 0.4 A/cm. The overall increase in the polarization resistance was clear for both dry and wet reformate impurities. While the dry reformate operation appeared to stabilize after the 24-h tests, the wet reformate operation resulted in a significant increase in polarization losses at the end of the tests, despite a slight recovery at the beginning of the tests.
The impedance data was fitted to an equivalent circuit model, and DRT analysis was performed to further analyze the effects of the impurities, Figure 7. As can already be noticed from the high frequency intercept of the Nyquist plots, the ohmic resistance remained almost unaltered throughout the test, with a slight decrease with the introduction of wet reformate, which, however, then increased to the initial values, R in Figure 7a. R and R, which are mainly associated with the charge transfer losses in the two electrodes increased significantly with the introduction of the dry reformate mixture and continued to increase slightly until the end of the tests.
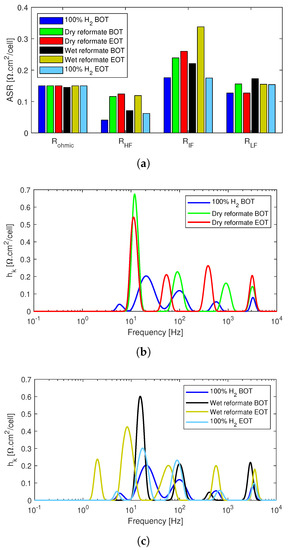
Figure 7.
EIS data analysis of the poisoning effects of reformate impurities in the anode feed of the post-doped MEA-based HT-PEMFC stack. (a) Equivalent circuit model fitted resistance data. (b) DRT analysis of dry reformate. (c) DRT analysis of wet reformate.
Wet reformate partly recovered both of the above mentioned resistances; however, they increased back again at the end of tests. In particular, a striking increase in R is seen at the end of the wet reformate operation, which also corresponds to what is seen in the Nyquist plots. This means that humidification exacerbated the charge transfer losses, especially those at the lower frequency region dominated by ORR. However, both R and R returned almost to the initial values under pure dry hydrogen operation at the end of test, which implies that the effects are reversible.
This performance recovery also means that the reason for the losses during the wet reformate operation was not related to acid loss but rather to the interaction between water vapor, CO, CO2, and phosphoric acid. Daletou et al. [47] studied the interaction of water vapor and phosphoric acid and found that water reacted with pyrophosphoric acid in order to maintain the equilibrium concentration of phosphoric acid at a high level, thereby, improving the proton conductivity and fuel cell performance. However, their work assessed only performances with pure hydrogen operation. The conductivity and performance improvement in this work was only observed in the initial period of operation after the introduction of water vapor into the stack.
Finally, the mass transport losses increased slightly for the dry reformate operation in the beginning of test but returned to the initial values at the end of the test. The increase in mass transport losses was more visible for the wet reformate operation; however, this too recovered slightly with time, and the overall losses can be considered mild.
The DRT analysis in Figure 7 shows that all the spectra had at least four distinct peaks at around 10 Hz, 100 Hz, 1 kHz, and 4 kHz. All the peaks increased in size with the introduction of dry CO and CO2 into the anode stream, Figure 7b. While the peaks below 10 Hz decreased slightly after 24 h, the peak above 100 Hz continued to increase. The peaks remained similar in size with the introduction of humidification instead of N2 in the anode stream along with CO and CO2, Figure 7c.
However, after the 24 h of testing under the wet reformate conditions, a fifth peak appeared around 2 Hz. This region is on the border between the ORR processes and mass transport; however, it is more likely due to cathode charge transfer losses as it is reflected in the increase in R in the fitted resistances in Figure 7a. Pure and dry hydrogen operation at the end of the test resulted in significant recovery as already shown from the polarization curves and Nyquist plots. While some residual losses are seen on the peak sizes between 10 Hz and 100 Hz, the high frequency peaks above 100 HZ recovered almost fully.
3.2.2. Poisoning Effects on an HT-PEMFC Stack with Pre-Doped MEAs
Similarly to the previous stack based on post-doped MEAs, the effects of CO and CO2 were clearly visible on the stack with the pre-doped MEAs, as can be seen from the polarization curves and Nyquist plots in Figure 8ab, respectively. The performance of the stack was slightly higher for the wet reformate operation, especially above 0.25 , Figure 8a.
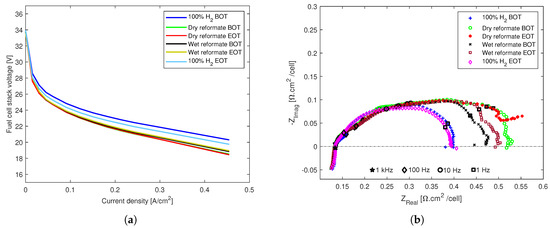
Figure 8.
The effects of dry and wet reformate impurities on an HT-PEMFC stack with an MEA composed of a pre-doped PBI membrane and woven GDL. (a) Polarization curves. (b) EIS spectra.
Considering that the reformate conditions were tested after the dry reformate conditions, this shows that the humidification alleviated the poisoning effects of CO and CO2 on the pre-doped MEAs, and it did so until the end of the tests. This is in clear contrast with what was observed for the post-doped MEAs, where humidification did not have performance enhancing effects, and the observed recovery was mainly due to stabilization with time in both the dry and wet reformate conditions. As with the post-doped stack, the recovery with pure hydrogen at the end of tests was significant in the case of the pre-doped stack as well.
The equivalent circuit model fitted resistances are shown in Figure 9a. It can be seen that, similarly to the post-doped stack, the ohmic resistances remain unaltered throughout the tests for the pre-doped stack as well. However, both R and R increase with the introduction of dry reformate and continue to increase until the end of tests. Therefore, in the case of the pre-doped stack, the recovery and stabilization seen during the dry reformate tests in the post-doped stack are not observed. The recovery happens during the wet reformate tests, where both R and R decrease and remain almost unaltered until the end of the wet reformate operation. The R for the wet reformate operation was lower than that of the pure hydrogen operation, and, for R, the values are similar to the resistance of the pure hydrogen operation. This implies that the water in this case limits the poisoning effects of CO on the stack.
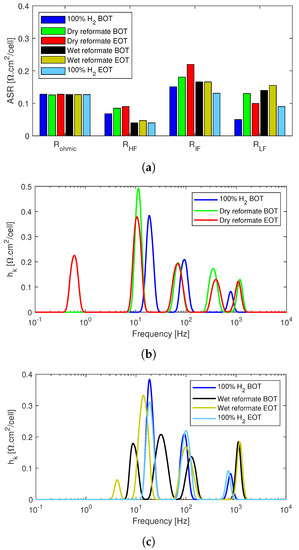
Figure 9.
EIS data analysis of the poisoning effects of reformate impurities in the anode feed of the pre-doped MEA-based HT-PEMFC stack. (a) Equivalent circuit model fitted resistance data. (b) DRT analysis of dry reformate. (c) DRT analysis of wet reformate.
Nonetheless, the effects of the dry reformate impurities on the mass transport losses were more significant in the case of pre-doped stack compared to the post-doped stack. An increase in mass transport losses was seen in the beginning of the test with dry reformate. At the end of dry reformate test, it appears, from Figure 9a, that the mass transport recovered slightly. However, this is due to the shape of the Nyquist plot of the “Dry reformate EOT” in Figure 8b, which is different from the other impedance spectra at the low frequency end and could not be fitted properly using the EC model used for the other spectra. Since changing the EC model for just one spectrum would not allow for proper comparison of the other circuit elements, it was preferred to underestimate R.
Nonetheless, when adding the information obtained from the DRT analysis in Figure 9b, one can see that the mass transport losses indeed increased at the end of the dry reformate operation. In fact, the dry reformate operation at the end of the 24 h of test was the only spectra in the current work that resulted in a peak below 1 Hz, which, as mentioned, is associated with mass transport losses.
Both the Nyquist plots in Figure 8b and the ECM fitted resistances in Figure 9a show that all the losses were recoverable when operating with pure hydrogen again. In fact, Nyquist plots under pure hydrogen operations before and after the tests almost overlapped each other, and, overall, the fitted resistances were similar. However, as shown in the polarization curves in Figure 8a, there was slight performance degradation at the end of the tests compared to the beginning of life. This is perhaps due to the fact that, unlike EIS, polarization curves are recorded over a range of current densities at conditions that are not completely steady state.
Unlike the post-doped stack, which had up to five DRT peaks, the pre-doped stack exhibited only three distinct peaks for pure hydrogen operation. An additional peak was then observed between 100 Hz and 1 kHz when CO and CO2 were added to the mix. Since the nitrogen dilution tests in Figure 5d also exhibited only three peak, this additional peak in the charge transfer loss region was attributable to the presence of poisoning agents in the anode feed. It is well documented that CO covers active electrode sites, while CO2 has dilution effects similar to those seen for N2 with possible small poisoning effects due to CO production via the reverse-water-gas-shift reaction of CO2 with H2 [7,45].
With the introduction of the dry reformate mixture into the anode feed, all the DRT peaks increased in size with the exception of the peak at around 100 Hz. Continued operation under dry reformate conditions then stabilized the stack, and it regained some of the losses. However, at the end of the 24 h of dry reformate tests, a fifth peak was observed below 1 Hz. As already mentioned, even though this was not captured in the EC model fit, it can be attributed to mass transport losses, considering the shape of the EIS spectrum and the DRT peak below 1 Hz.
This shows the advantage of adding DRT analysis and not relying solely on ECM fits for the EIS analysis. In Figure 9c, it can be seen that, in the presence of water, the DRT peak sizes decreased throughout the spectrum except at the highest frequency point. However, after the end of the 24 h, the peaks around 10 Hz increased back close to the initial values.
4. Discussion
Characterization of the effects of reformate impurities in an HT-PEMFC stack is crucial not only for understanding the poisoning and degradation mechanisms to optimize the fuel cell components but also to identify the fault features for diagnostics and fault mitigation purposes. The effects of the tested operating conditions on the different EIS parameters are summarized in Table 2.
Table 2.
The characteristic features of dry and wet reformate in HT-PEMFC stacks. The arrows indicate the overall trends of the parameters, where ↑ represents an increase and → represents no significant change.
N2 dilution negatively affected only the charge transfer losses for both stacks, especially R, which is mainly associated with the anode charge transfer losses. The proton conductivity and mass transport remained mostly unaltered by N2 dilution for the stack with post-doped MEAs, while an overall slight increase in the mass transport loss was seen for the pre-doped stack. It is reported in the literature that, with the addition of an inert gas, such as nitrogen, the diffusion resistance becomes more substantial because the effective diffusion coefficient of hydrogen in the gas mixture is reduced by the Maxwell–Stefan effect [48].
However, in the current work, the effects of N2 dilution were manifested predominantly on the reaction kinetics-dominated high and intermediate frequency resistances rather than the diffusion-dominated mass transport resistance. This could be because dilution reduces the amount of hydrogen on the reaction sites, and this effect appears to be more severe than the mass transport issue caused by N2 dilution. This is in contrast with what some researchers have observed in half-cell and single cell tests, where the nitrogen dilution effects were limited to mass transport losses [48,50].
Similarly, the effects of CO and CO2 poisoning on the charge transfer losses were more dominant for both stacks, particularly on the anode-dominated high frequency resistance losses, while the ohmic resistance remained unaltered during the poisoning with or without humidification. While the poisoning effects on the high frequency resistances were to be expected due to the adsorption of CO on the anode Pt particles and the consequent loss of ECSA, the effects on the intermediate frequency resistance were peculiar.
Bevilacqua et al. [50] reported similar effects on the cathode due to CO on the anode feed, which they attributed solely to the drop in voltage that caused an exponential drop in the exchange current density according to the Butler–Volmer equation and led to higher impedance. They excluded any CO cross-over from the anode to the cathode. This could explain the increase in the intermediate frequency resistances of both stacks during the poisoning tests.
The presence of water during CO poisoning, which is reported to alleviate the degrading effects of CO [12], was only observed for the stack with pre-doped MEAs. In fact, upon the introduction of humidification, both R and R recovered for the stack with post-doped MEAs, but then continued to increase significantly. This could be because the phosphate anions from the more mobile phosphoric acid in post-doped stacks adsorbed on the cathode [16,17] and could also impede mass transport by blocking some of the pores of the GDL while leaching out [18]. The latter could also be the reason for the mass transport loss observed during dry reformate tests on the stack with pre-doped MEAs, which has significantly higher doping levels compared with the post-doped MEAs.
Performance losses in the presence of water are usually associated with acid loss. However, the fact that there was a significant performance recovery with the pure H2 operation at the end of the tests indicates that the reason for the losses during the wet reformate operation were not related to acid loss. Acid loss is reported to mainly happen at lower operating temperatures and during shutdown/startup cycles due to the condensation of water that can wash out the acid [13,15]. This is not the case in the current work, as there were only a limited number of shutdown/startup procedures, and the operating temperature was kept constant at 160 .
Studies suggest both positive and negative effects of humidification in HT-PEMFCs, where some propose that the interaction of water with phosphoric acid improves the proton conductivity and fuel cell performance and others reported negative effects of water vapor, including dilution and acid loss, especially at lower temperatures [11,13,47]. Therefore, it can be said that water vapor in an HT-PEMFC has the dual opposite effects of dilution and that of maintaining the equilibrium concentration of phosphoric acid.
The positive effects of humidification compared to dry poisoning in this work were observed in the initial period of operation after the introduction of water vapor into the stack with post-doped MEAs. However, successively, the negative effects of humidification prevailed for this type of MEAs. On the other hand, humidification alleviated the effects of CO poisoning throughout almost the entire test period and across the frequency spectrum for the stack with pre-doped MEAs. Therefore, we conclude that humidification has a beneficial effect on a reformate operated stack with pre-doped MEAs but has detrimental effects on a stack with post-doped MEAs.
Finally, some of the characteristic features shown in Table 2 can be regarded as fault features, where sudden and continuous increases in the fitted resistances and DRT peaks can be a sign of the presence of impurities. For instance, the size and number of DRT peaks increase when dry CO and CO2 are introduced to either stack. The stack with pre-doped MEAs exhibited only three DRT peaks under pure H2 operation and under N2 dilution. However, when the impurities were introduced, an additional peak appeared in the charge transfer region, which can be used to identify the presence of poisoning agents in the anode feed for a stack with pre-doped MEAs.
5. Conclusions
In this paper, experimental characterization was performed for two 37-cell HT-PEMFC stacks with active areas of 165 . The effects of nitrogen dilution and reformate impurities were studied using polarization curves and EIS measurements. CO and CO2 were chosen as the reformate impurities, and their effect on the stacks were investigated both with and without humidification. The two stacks used in this work employed two different types of MEAs, one with a post-doped PBI membrane and non-woven GDL and the other with a pre-doped PBI membrane and woven GDL type.
We found that N2 had a reversible dilution effect, which was mainly manifested by the increase in the anode charge transfer losses for both stacks. This could be because dilution reduces the amount of hydrogen on the reaction sites, and this effect appeared to be more severe than the mass transport issue caused by N2 dilution. N2 dilution did not affect the ohmic resistance negatively in either stack. Generally, from the Nyquist plot and the DRT peaks analysis, the stack with pre-doped MEAs was less susceptible to dilution effects and had more stable operation over the dilution test period.
The effects of CO and CO2 poisoning were also mainly seen on the charge transfer losses for both stacks, while the ohmic resistance remained unaltered even during the poisoning tests irrespective of the presence of water vapor. We also found that humidification had a beneficial effect on a reformate-operated stack with pre-doped MEAs but had detrimental effects on the stack with post-doped MEAs. Nonetheless, there was significant performance recovery for both stacks with the pure hydrogen operation at the end of the tests, implying that the poisoning effects are reversible even in the presence of humidification.
A combination of the magnitude and trend of the changes in the various parameters (equivalent circuit elements and DRT peaks) due to the different operating conditions in the current work can be used for fault matrix creation and for diagnostics purposes. The increase in the size and number of DRT peaks when dry CO and CO2 were introduced to either stack can be considered as a CO poisoning fault feature. In particular, the stack with pre-doped MEAs exhibited only three DRT peaks under pure H2 operation and under N2 dilution. Therefore, the additional DRT peak in the charge transfer region during impurities operation can be used to identify the presence of poisoning agents in the anode feed for a stack with pre-doped MEAs.
Author Contributions
Conceptualization, S.S.A. and S.T.; methodology, S.S.A. and S.T.; software, S.S.A., S.T. and S.L.S.; validation, S.S.A. and S.T.; formal analysis, S.S.A.; investigation, S.S.A. and A.L.; resources, S.S.A.; data curation, S.S.A.; writing—original draft preparation, S.S.A. and A.L.; writing—review and editing, S.S.A., S.T., A.L., S.L.S., V.L. and S.J.A.; visualization, S.S.A.; supervision, S.S.A.; project administration, S.S.A. and S.J.A.; funding acquisition, S.S.A. All authors have read and agreed to the published version of the manuscript.
Funding
This research was funded by the Danish Energy Technology Development and Demonstration Program (EUDP) through the project COBRA Drive (grant number—64018-0118). Part of the research conducted for this article received funding from the European Union’s Horizon 2020 research and innovation programme under the Marie Sklodowska-Curie grant agreement No 893919.
Institutional Review Board Statement
Not applicable.
Informed Consent Statement
Not applicable.
Data Availability Statement
The data are contained within the article.
Conflicts of Interest
The authors declare no conflict of interest. The funders had no role in the design of the study; in the collection, analyses, or interpretation of data; in the writing of the manuscript, or in the decision to publish the results.
Abbreviations
The following abbreviations are used in this manuscript:
| BOT | Beginning of test |
| CPE | Constant phase element |
| DRT | Distribution of relaxation time |
| ECM | Equivalent circuit model |
| EIS | Electrochemical impedance spectroscopy |
| EOT | End of test |
| GDL | Gas diffusion layer |
| HOR | Hydrogen oxidation reaction |
| HT-PEMFC | High temperature polymer electrolyte membrane fuel cell |
| LT-PEMFC | Low temperature polymer electrolyte membrane fuel cell |
| MEA | Membrane electrode assembly |
| MPL | Mesoporous layer |
| ORR | Oxygen reduction reaction |
| PBI | Polybenzimidazole |
| PFSA | Perfluorosulfonic acid |
| PTFE | Polytetrafluoroethylene |
References
- Ho, J.C.; Saw, E.C.; Lu, L.Y.; Liu, J.S. Technological barriers and research trends in fuel cell technologies: A citation network analysis. Technol. Forecast. Soc. Chang. 2014, 82, 66–79. [Google Scholar] [CrossRef]
- Sharaf, O.Z.; Orhan, M.F. An overview of fuel cell technology: Fundamentals and applications. Renew. Sustain. Energy Rev. 2014, 32, 810–853. [Google Scholar] [CrossRef]
- Wang, Y.; Ruiz Diaz, D.F.; Chen, K.S.; Wang, Z.; Adroher, X.C. Materials, technological status, and fundamentals of PEM fuel cells—A review. Mater. Today 2020, 32, 178–203. [Google Scholar] [CrossRef]
- Feng, C.; Li, Y.; Qu, K.; Zhang, Z.; He, P. Mechanical behavior of a hydrated perfluorosulfonic acid membrane at meso and nano scales. RSC Adv. 2019, 9, 9594–9603. [Google Scholar] [CrossRef]
- Ferraris, A.; Messana, A.; Airale, A.G.; Sisca, L.; de Carvalho Pinheiro, H.; Zevola, F.; Carello, M. Nafionr tubing humidification system for polymer electrolyte membrane fuel cells. Energies 2019, 12, 1773. [Google Scholar] [CrossRef]
- Carello, M.; De Vita, A.; Ferraris, A. Method for Increasing the Humidity in Polymer Electrolyte Membrane Fuel Cell. Fuel Cells 2016, 16, 157–164. [Google Scholar] [CrossRef]
- Araya, S.S.; Zhou, F.; Liso, V.; Sahlin, S.L.; Vang, J.R.; Thomas, S.; Gao, X.; Jeppesen, C.; Kær, S.K. A comprehensive review of PBI-based high temperature PEM fuel cells. Int. J. Hydrog. Energy 2016, 41, 21310–21344. [Google Scholar] [CrossRef]
- Zhang, J.; Xiang, Y.; Lu, S.; Jiang, S.P. High Temperature Polymer Electrolyte Membrane Fuel Cells for Integrated Fuel Cell—Methanol Reformer Power Systems: A Critical Review. Adv. Sustain. Syst. 2018, 2, 1700184. [Google Scholar] [CrossRef]
- Simon Araya, S.; Liso, V.; Cui, X.; Li, N.; Zhu, J.; Sahlin, S.L.; Jensen, S.H.; Nielsen, M.P.; Kær, S.K. A Review of The Methanol Economy: The Fuel Cell Route. Energies 2020, 13, 596. [Google Scholar] [CrossRef]
- Büsselmann, J.; Rastedt, M.; Klicpera, T.; Reinwald, K.; Schmies, H.; Dyck, A.; Wagner, P. Analysis of HT-PEM MEAs’ Long-Term Stabilities. Energies 2020, 13, 567. [Google Scholar] [CrossRef]
- Søndergaard, T.; Cleemann, L.N.; Becker, H.; Steenberg, T.; Hjuler, H.A.; Seerup, L.; Li, Q.; Jensen, J.O. Long-Term Durability of PBI-Based HT-PEM Fuel Cells: Effect of Operating Parameters. J. Electrochem. Soc. 2018, 165, F3053–F3062. [Google Scholar] [CrossRef]
- Zhou, F.; Andreasen, S.J.; Kær, S.K.; Park, J.O. Experimental investigation of carbon monoxide poisoning effect on a PBI/H3PO4 high temperature polymer electrolyte membrane fuel cell: Influence of anode humidification and carbon dioxide. Int. J. Hydrog. Energy 2015, 40, 14932–14941. [Google Scholar] [CrossRef]
- Zhou, F.; Singdeo, D.; Kær, S.K. Investigation of the Effect of Humidity Level of H2 on Cell Performance of a HT-PEM Fuel Cell. Fuel Cells 2019, 19, 2–9. [Google Scholar] [CrossRef]
- Park, H.; Kim, H.; Kim, D.K.; Lee, W.J.; Choi, I.; Kim, H.J.; Kim, S.K. Performance deterioration and recovery in high-temperature polymer electrolyte membrane fuel cells: Effects of deliquescence of phosphoric acid. Int. J. Hydrog. Energy 2020, 45, 32844–32855. [Google Scholar] [CrossRef]
- Li, Q.; Jensen, J.O.; Savinell, R.F.; Bjerrum, N.J.; Oluf, J.; Savinell, R.F.; Bjerrum, N.J.; Jensen, J.O.; Savinell, R.F.; Bjerrum, N.J. High temperature proton exchange membranes based on polybenzimidazoles for fuel cells. Prog. Polym. Sci. 2009, 34, 449–477. [Google Scholar] [CrossRef]
- Liu, Z.; Wainright, J.S.; Litt, M.H.; Savinell, R.F. Study of the oxygen reduction reaction (ORR) at Pt interfaced with phosphoric acid doped polybenzimidazole at elevated temperature and low relative humidity. Electrochim. Acta 2006, 51, 3914–3923. [Google Scholar] [CrossRef]
- Strmcnik, D.; Escudero-Escribano, M.; Kodama, K.; Stamenkovic, V.R.; Cuesta, A.; Markovií, N.M. Enhanced electrocatalysis of the oxygen reduction reaction based on patterning of platinum surfaces with cyanide. Nat. Chem. 2010, 2, 880–885. [Google Scholar] [CrossRef]
- Myles, T.; Bonville, L.; Maric, R. Catalyst, Membrane, Free Electrolyte Challenges, and Pathways to Resolutions in High Temperature Polymer Electrolyte Membrane Fuel Cells. Catalysts 2017, 7, 16. [Google Scholar] [CrossRef]
- Tahrim, A.A.; Amin, I.N.H.M. Advancement in Phosphoric Acid Doped Polybenzimidazole Membrane for High Temperature PEM Fuel Cells: A Review. J. Appl. Membr. Sci. Technol. 2018, 23, 37–62. [Google Scholar] [CrossRef]
- Schmidt, T.J.; Baurmeister, J. Properties of high-temperature PEFC Celtec®-P 1000 MEAs in start/stop operation mode. J. Power Sources 2008, 176, 428–434. [Google Scholar] [CrossRef]
- Vang, J.R.; Andreasen, S.J.; Araya, S.S.; Kær, S.K. Comparative study of the break in process of post doped and sol–gel high temperature proton exchange membrane fuel cells. Int. J. Hydrog. Energy 2014, 39, 14959–14968. [Google Scholar] [CrossRef][Green Version]
- Zhou, Z.; Zholobko, O.; Wu, X.F.; Aulich, T.; Thakare, J.; Hurley, J. Polybenzimidazole-Based Polymer Electrolyte Membranes for High-Temperature Fuel Cells: Current Status and Prospects. Energies 2020, 14, 135. [Google Scholar] [CrossRef]
- Bevilacqua, N.; Asset, T.; Schmid, M.; Markötter, H.; Manke, I.; Atanassov, P.; Zeis, R. Impact of catalyst layer morphology on the operation of high temperature PEM fuel cells. J. Power Sources Adv. 2021, 7, 100042. [Google Scholar] [CrossRef]
- Kim, S.; Myles, T.D.; Kunz, H.; Kwak, D.; Wang, Y.; Maric, R. The effect of binder content on the performance of a high temperature polymer electrolyte membrane fuel cell produced with reactive spray deposition technology. Electrochim. Acta 2015, 177, 190–200. [Google Scholar] [CrossRef]
- Bevilacqua, N.; George, M.G.; Galbiati, S.; Bazylak, A.; Zeis, R. Phosphoric Acid Invasion in High Temperature PEM Fuel Cell Gas Diffusion Layers. Electrochim. Acta 2017, 257, 89–98. [Google Scholar] [CrossRef]
- Chevalier, S.; Fazeli, M.; Mack, F.; Galbiati, S.; Manke, I.; Bazylak, A.; Zeis, R. Role of the microporous layer in the redistribution of phosphoric acid in high temperature PEM fuel cell gas diffusion electrodes. Electrochim. Acta 2016, 212, 187–194. [Google Scholar] [CrossRef]
- Rosli, R.; Sulong, A.; Daud, W.; Zulkifley, M.; Husaini, T.; Rosli, M.; Majlan, E.; Haque, M. A review of high-temperature proton exchange membrane fuel cell (HT-PEMFC) system. Int. J. Hydrog. Energy 2017, 42, 9293–9314. [Google Scholar] [CrossRef]
- Martin, S.; Garcia-Ybarra, P.L.; Castillo, J.L. Ten-fold reduction from the state-of-the-art platinum loading of electrodes prepared by electrospraying for high temperature proton exchange membrane fuel cells. Electrochem. Commun. 2018, 93, 57–61. [Google Scholar] [CrossRef]
- Yao, D.; Zhang, W.; Ma, Q.; Xu, Q.; Pasupathi, S.; Su, H. Achieving high Pt utilization and superior performance of high temperature polymer electrolyte membrane fuel cell by employing low-Pt-content catalyst and microporous layer free electrode design. J. Power Sources 2019, 426, 124–133. [Google Scholar] [CrossRef]
- Kannan, A.; Li, Q.; Cleemann, L.N.; Jensen, J.O. Acid Distribution and Durability of HT-PEM Fuel Cells with Different Electrode Supports. Fuel Cells 2018, 18, 103–112. [Google Scholar] [CrossRef]
- de Beer, C.; Barendse, P.S.; Pillay, P.; Bullecks, B.; Rengaswamy, R. Electrical Circuit Analysis of CO Poisoning in High-Temperature PEM Fuel Cells for Fault Diagnostics and Mitigation. IEEE Trans. Ind. Appl. 2015, 51, 619–630. [Google Scholar] [CrossRef]
- Malinowski, M.; Iwan, A.; Pasciak, G.; Parafiniuk, K.; Gorecki, L.; Pa ciak, G.; Parafiniuk, K.; Gorecki, L. Synthesis and characterization of para- and meta-polybenzimidazoles for high-temperature proton exchange membrane fuel cells. High Perform. Polym. 2014, 26, 436–444. [Google Scholar] [CrossRef]
- Córdoba-Torres, P.; Mesquita, T.J.; Devos, O.; Tribollet, B.; Roche, V.; Nogueira, R.P. On the intrinsic coupling between constant-phase element parameters α and Q in electrochemical impedance spectroscopy. Electrochim. Acta 2012, 72, 172–178. [Google Scholar] [CrossRef]
- Shoar Abouzari, M.R.; Berkemeier, F.; Schmitz, G.; Wilmer, D. On the physical interpretation of constant phase elements. Solid State Ion. 2009, 180, 922–927. [Google Scholar] [CrossRef]
- Gomadam, P.M.; Weidner, J.W. Analysis of electrochemical impedance spectroscopy in proton exchange membrane fuel cells. Int. J. Energy Res. 2005, 29, 1133–1151. [Google Scholar] [CrossRef]
- Cooper, K.; Smith, M. Electrical test methods for on-line fuel cell ohmic resistance measurement. J. Power Sources 2006, 160, 1088–1095. [Google Scholar] [CrossRef]
- Jeppesen, C.; Araya, S.S.; Sahlin, S.L.; Thomas, S.; Andreasen, S.J.; Kær, S.K. Fault detection and isolation of high temperature proton exchange membrane fuel cell stack under the influence of degradation. J. Power Sources 2017, 359, 37–47. [Google Scholar] [CrossRef]
- Thomas, S.; Araya, S.S.; Frensch, S.H.; Steenberg, T.; Kær, S.K. Hydrogen mass transport resistance changes in a high temperature polymer membrane fuel cell as a function of current density and acid doping. Electrochim. Acta 2019, 317, 521–527. [Google Scholar] [CrossRef]
- Weiß, A.; Schindler, S.; Galbiati, S.; Danzer, M.A.; Zeis, R. Distribution of Relaxation Times Analysis of High-Temperature PEM Fuel Cell Impedance Spectra. Electrochim. Acta 2017, 230, 391–398. [Google Scholar] [CrossRef]
- Schenk, A.; Grimmer, C.; Perchthaler, M.; Weinberger, S.; Pichler, B.; Heinzl, C.; Scheu, C.; Mautner, F.A.; Bitschnau, B.; Hacker, V. Platinum-cobalt catalysts for the oxygen reduction reaction in high temperature proton exchange membrane fuel cells—Long term behavior under ex-situ and in-situ conditions. J. Power Sources 2014, 266, 313–322. [Google Scholar] [CrossRef]
- Schindler, S.; Weiss, A.; Galbiati, S.; Mack, F.; Danzer, M.A.; Zeis, R. Identification of Polarization Losses in High-Temperature PEM Fuel Cells by Distribution of Relaxation Times Analysis. ECS Trans. 2016, 75, 45–53. [Google Scholar] [CrossRef]
- Wan, T.H.; Saccoccio, M.; Chen, C.; Ciucci, F. Influence of the Discretization Methods on the Distribution of Relaxation Times Deconvolution: Implementing Radial Basis Functions with DRTtools. Electrochim. Acta 2015, 184, 483–499. [Google Scholar] [CrossRef]
- Heinzmann, M.; Weber, A.; Ivers-Tiffée, E. Advanced impedance study of polymer electrolyte membrane single cells by means of distribution of relaxation times. J. Power Sources 2018, 402, 24–33. [Google Scholar] [CrossRef]
- Simon Araya, S.; Zhou, F.; Lennart Sahlin, S.; Thomas, S.; Jeppesen, C.; Knudsen Kær, S. Fault Characterization of a Proton Exchange Membrane Fuel Cell Stack. Energies 2019, 12, 152. [Google Scholar] [CrossRef]
- Chen, C.Y.; Lai, W.H.; Chen, Y.K.; Su, S.S. Characteristic studies of a PBI/H3PO4 high temperature membrane PEMFC under simulated reformate gases. Int. J. Hydrog. Energy 2014, 39, 13757–13762. [Google Scholar] [CrossRef]
- Andreasen, S.J.; Vang, J.R.; Kær, S.K. High temperature PEM fuel cell performance characterisation with CO and CO2 using electrochemical impedance spectroscopy. Int. J. Hydrog. Energy 2011, 36, 9815–9830. [Google Scholar] [CrossRef]
- Daletou, M.K.; Kallitsis, J.K.; Voyiatzis, G.; Neophytides, S.G. The interaction of water vapors with H3PO4 imbibed electrolyte based on PBI/polysulfone copolymer blends. J. Membr. Sci. 2009, 326, 76–83. [Google Scholar] [CrossRef]
- Du, B.; Pollard, R.; Elter, J.F.; Ramani, M. Performance and Durability of a Polymer Electrolyte Fuel Cell Operating with Reformate: Effects of CO, CO2, and Other Trace Impurities. In Polymer Electrolyte Fuel Cell Durability; Springer: New York, NY, USA, 2009; pp. 341–366. [Google Scholar]
- Reimer, U.; Ehlert, J.; Janßen, H.; Lehnert, W. Water distribution in high temperature polymer electrolyte fuel cells. Int. J. Hydrog. Energy 2016, 41, 1837–1845. [Google Scholar] [CrossRef]
- Bevilacqua, N.; Schmid, M.; Zeis, R. Understanding the role of the anode on the polarization losses in high-temperature polymer electrolyte membrane fuel cells using the distribution of relaxation times analysis. J. Power Sources 2020, 471, 228469. [Google Scholar] [CrossRef]
Publisher’s Note: MDPI stays neutral with regard to jurisdictional claims in published maps and institutional affiliations. |
© 2021 by the authors. Licensee MDPI, Basel, Switzerland. This article is an open access article distributed under the terms and conditions of the Creative Commons Attribution (CC BY) license (https://creativecommons.org/licenses/by/4.0/).