Article

The Microclimate Design Process in Current African Development: The UEM Campus in Maputo, Mozambique

1
Dipartimento di Ingegneria Civile, Ambientale e Architettura (DICAAR), University of Cagliari, 09123 Cagliari, Italy
2
Faculty of Architecture and Physical Planning, University Eduardo Mondlane, Maputo 1102, Mozambique
*
Authors to whom correspondence should be addressed.
Energies 2020, 13(9), 2316; https://doi.org/10.3390/en13092316
Submission received: 3 March 2020 / Revised: 27 April 2020 / Accepted: 30 April 2020 / Published: 7 May 2020
(This article belongs to the Special Issue Urban Heat Island Mitigation Technologies)

Abstract

:
Even if current action towards sustainability in architecture mainly concerns single buildings, the responsibility of the urban shape on local microclimate has largely been ascertained. In fact, it heavily affects the energy performances of the buildings and their environmental behaviour. This produces the necessity to broaden the field of intervention toward the urban scale, involving in the process different disciplines, from architecture to fluid dynamics and physics. Following these ideas, the Masterplan for the Campus of the University Eduardo Mondlane in Maputo (Mozambique) develops a methodology that integrates microclimatic data and analyses from the initial design model. The already validated software ENVI-met (Version 4.4, ENVI_MET GmbH, Essen, Germany) acts as a useful ‘feedback’ tool that is able to assess the microclimatic behaviour of the design concept, also in terms of outdoor comfort. In particular, the analysis focused on the microclimatic performances of a ‘C’ block typology east oriented in relation to the existing buildings, in Maputo’s specific climatic characteristics. The initial urban proposal was gradually evaluated and modified in relation to the main critical aspects highlighted by the microclimatic analyses, in a sort of circular process that ended with a proposed solution ensuring better outdoor comfort than the existing buildings, and which provided an acceptable balance between spatial and climatic instances.

Graphical Abstract

1. Introduction

The centrality of the city with reference to energy efficiency has been confirmed by several scientific contributions and in various disciplines. Nevertheless, in current approaches, the majority of legislative guidelines and design activities are related to individual buildings. Interesting studies (De Pascali, 2008 [1]) have shown how the long-term benefits obtained by the application of energy saving policies to single buildings tend to reduce their effectiveness. Thus, it is strongly necessary to shift the focus from the city, conceived as a collection of single buildings, to the city as an organism with its own shape and its own climatic behaviour: “A significant share of energy is, in fact, linked to the physical and functional relationships which are established, or may be established, among the various elements of the settlement, and which determine the city’s shape and organization” [1]. The support of urban microclimate design in the reconfiguration and re-organization of the urban form could lead urban morphology towards more efficient configurations. Through this process, we will be able to reduce neg-entropic requirements, raising both the quality and liveability of the spaces of the cities.

Energy Balance in the Urban Microclimate Design

As stated by Balaras et al. (2019) [2], the employment of urban microclimate design can transform buildings and the built environment in cities from the cause of issues into one of the solutions to today’s economic, environmental and social challenges. From this point of view, the focus is usually more on the reduction of energy consumption, generated by artificial heating and cooling, and on the use of renewable energies (see, e.g., Susowake et al., 2019 [3], Sánchez Cordero et al., 2019 [4], Mancini and Lo Basso, 2020 [5]) rather than on the capability of urban environments to efficiently use energy. As a matter of fact, there is a relationship between the energy balance and the urban form that can be summarized in Equation (1), proposed, among others, by M. Santamouris (2001) [6] and De Pascali (2008) [1]:
Q R + Q T = Q E + Q L + Q S + Q A
where it is highlighted that the energy gain of the city Q R + Q T (where Q R is the net radiative flux, directly influenced by the urban surface radiation, and Q T is the anthropogenic heat flux, given by transportation, heating systems, etc.) contrasts with the heat flow that the system stores and the exchange inside Q E + Q L + Q S + Q A (where Q E is the sensible heat, Q L the latent heat, Q S the stored energy and Q A the energy transferred to/from the system through advection), clearly pointing out the roles of urban form in the energy performance of the settlement. Following, among the others, the seminal work of T.R. Oke (1982) [7], one of the key parameters in urban microclimate design is the space among buildings (urban canyons), which plays a significant role in the efficient functioning of urban environments (see, for instance, the studies of Chiri e Giovagnorio, 2015 [8] and Giovagnorio et al., 2017 [9]). In particular, the ratio of the building height (H) to the distance between building façades (W) affects the air flows (see, for instance, Badas et al., 2020 [10], Garau et al., 2019 [11], Badas et al., 2019 [12], Garau et al., 2018 [13], Badas et al., 2017 [14], Ferrari et al., 2017 [15]) and, consequently, the natural ventilation potential and the capability to disperse or accumulate pollutants, humidity and heat, both outside and inside the buildings (Costanzo et al., 2019 [16]). As a consequence, H/W plays a relevant role on the Urban Heat Island (UHI) phenomenon and, in turns, in the urban environment energy balance. For instance, as shown by NG (2010) [17], when the wind is perpendicular to the fabric orientation, a H/W ratio larger than 2 drastically reduces air penetration into the urban canyons, almost cancelling the natural ventilation at pedestrian level. Moreover, the H/W ratio bias the solar radiation penetration: Santamouris (2001) [6] suggests to designers, as a good construction technique, to increase/decrease the H/W ratio when the latitude decreases/increases, in order to reduce/enhance the light penetration and, as a consequence, the temperature, reducing the use of air conditioning or heating. In this way, the urban microclimate design contributes to the energy efficiency of the cities and to the reduction of the UHI phenomenon, as well as to the optimization of the outdoor human comfort. Moreover, the H/W ratio plays a relevant role in the control of outdoor human comfort and thermal stress. Outdoor human comfort is one of the key parameters for quantifying the results of an intervention based on urban microclimate design, but it is difficult to define in one single quantity, as both objective quantities (such as, for instance, humidity, temperature, air velocity, solar exposition, etc.) and subjective quantities (such as, for instance, human activities, heat sensitivity, clothing, etc.) contribute to its definition. An extensive classification can be found in the review of Coccolo et al., 2016 [18], where the outdoor human comfort indices have been classified into three main categories, namely the thermal indices, the empirical indices and the indices based on Linear Equations. Among the thermal indices, the Predicted Mean Vote (PMV), based on the energy balance of a human being, is an index representing the average temperature (and the related thermal stress) sensed by a group of people. PMV was firstly introduced by Fanger (1970) [19] for the quantification of indoor human comfort, but was then adapted to outdoor human comfort through the use of micrometeorological variables (such as wind speed, relative humidity, mean radiant temperature, solar irradiation and outdoor temperature) and adding, among other things, human activity and clothing factors (Coccolo et al., 2016 [18]). Even if those parameters can be measured at some points through sensors, only the adoption of microclimatic software makes it possible to study the performance of the built environment during the design phase over the entire investigation field. Among available microclimatic software, ENVI-met (Version 4.4, ENVI_MET GmbH, Essen, Germany) Bruse and Fleer, 1998 [20], https://www.envi-met.com/ [21]), employing the German VDI 3787 Standard, 2008, to compute the PMV, has often been used to simulate outdoor comfort in the recent past (e.g., Abdi et al., 2020 [22]; Ouali et al., 2020 [23]; Hassan et al., 2020 [24]; Limona et al., 2019 [25]; Shinzato et al., 2019 [26]; Karakounos et al., 2018 [27]; Nasrollahi et al., 2017 [28]; Ghaffarianhoseini et al., 2015 [29]). As reported by Fabbri and Costanzo, 2020 [30], ENVI-met is the most widely used software for simulating the urban outdoor microclimate; they reported a list of 59 recent (from 2013 to 2019) scientific papers where ENVI-met was employed to simulate the outdoor microclimate. Among these, 19 showed simulations that had not been validated with field-measured data, mainly with the target of comparing different planned solutions, similarly to what has been done in the present case (i.e., the comparison of the microclimatic performances of present building to the planned ones). This is because ENVI-met includes the main variables and processes involved in urban microclimate evolution, such as turbulence, heat, pollutant transport and dispersion, radiation fluxes within buildings and natural/artificial soils, influence of vegetation, etc., and, differently from most of the other computational tools, it is able to do this while at the same time reproducing the daily variations in sun position and its influence on shading/insulation. So ENVI-met includes in a single piece of software the numerical simulation of fluid dynamics, thermodynamics and radiation balance in complex urban domains. Therefore, despite some inherent limitations due to the discretization of the studied domain and to the approximations introduced by the numerical solution of complex equations typical of this kind of software, this tool has been demonstrated to produce valuable and useful feedback, through which a designer can direct urban design so as to improve its energy and microclimatic performance. In the present paper, the targets are:
  • to evaluate whether or not the planned solution can have better microclimatic performances, also in terms of outdoor comfort, than the existing buildings;
  • to test a recursive and multidisciplinary design process, where different disciplines such as Architecture and Fluid Dynamics are involved and together contribute to the proposed solutions;
  • to apply this process to a social and cultural context, the African city of Maputo (Mozambique), where the urban microclimate design is not usually applied.

2. The Case Study: History, Future Perspectives and Critical Issues

The case study is in the preliminary stages of the urban design process concerning the development of the Eduardo Mondlane University Campus in Maputo (Mozambique).
The Eduardo Mondlane University (Universidade Eduardo Mondlane in Portuguese; UEM) is the oldest and largest university in Mozambique and is located in the Sommerschield district (Figure 1), right in the interface between the formal city, served by urban infrastructure and services, and the spontaneous informal city, lacking almost any type of service. It occupies a peripheral position in relation to the formal colonial city, located to the south, and runs alongside one of its most important access routes, the Avenida Julius Nyerere, which favours the connection of the city to the north of the country. The whole area occupies around 147,000 square metres, and it hosts several faculties of the Universidade Eduardo Mondlane: one high school, some administrative pavilions, a library, a scientific research centre, a canteen and residences for students and professors. The Campus area is used not only by people attending the University, but also by the rest of the population. In fact, it houses several public functions, including a bank, restaurants and sports activities. UEM may be able to deal with the social, cultural and sports development of the society in general, addressing the whole community. In fact, there has been an increase in demand among the population for cultural spaces that could ease social inclusion and sharing. A possible integration of cultural spaces within the Campus in the educational and tourist circuit of Maputo is therefore a fundamental aspect with great potential which, accompanied by a good promotion strategy, would contribute to the promotion not only of the University but, above all, of the African cultural identity.
The Campus currently presents several problems related to a fragmented and chaotic structure, to the lack of infrastructure and internal order, which do not allow full liveability, orientation and movement. Moreover, this does not facilitate its opening towards the city, marking the break between the autochthonous informal city and the formal colonial one. The main current issues, emerging on the basis of the analysis of student reports, are mainly related to spatial organization, quality of learning spaces, quality of public external spaces, climatic comfort (both inside and outside the building), and connection with the city. These interviews highlight critical points of the Campus in its current condition, but also constitute a good starting point for identifying important topics for the design of infrastructure development. In terms of spatiality, the Campus layout, even in an attempt to recall the orthogonal "colonial" mesh, lacks an internal organization, and the various buildings appear disconnected from one another. The extension of the Campus and its organization require an increase in the equipment of public spaces and should be intended for pedestrian flow.
The 2018 UEM Rector report, taking up the 2018–2028 Strategic Plan, lists some possible transformation scenarios aimed in these directions, such as the construction of buildings for the School of Art, the increase in the number of dormitories for students, the creation of deposits for the historical archives of Mozambique, the recovery of spaces for sport, a project for a health centre, the expansion of the structures of some departments, the increase in services and multipurpose cultural spaces, which would also allow significant financial income for the Campus.
Concerning the microclimate, the situation is not optimal. The climate characteristics associated with a not fully sustainability-oriented design dramatically affect both the liveability of the internal spaces and the outdoor comfort. In fact, the interior spaces present serious difficulties in obtaining good thermal comfort without the use of air conditioning equipment, and the outdoor space is not enjoyable during the day.
The microclimate on the campus is tropical, with high temperatures associated with a high relative air humidity. This condition makes control of the local microclimate difficult to attain, especially if the architectural solutions do not consider the problem of orientation and protection of the rooms against the direct incidence of sunlight as the predominant design principle. On the other hand, in the dry season, temperatures can drop significantly, and the hydrometric degree can also be uncomfortably low.

The Process for the Design of the Campus

The Sommerschield district, in which the UEM is located, remained out of planning until 1965. The UEM Campus was initially organized in a project by PROFABRIL, a Portuguese company for industrial projects. This plan, on which the first buildings of the Campus were built, established general distribution rules for activities and functions through their zoning. It was only in the early 2000s that the increasing student population, largely determined by a strong economy growth, made it necessary to reconsider the general layout of the campus in order to provide better accommodation for both students and professors.
The first proposed Masterplan of the Campus dates to 2004. It was designed by a team of local architects lead by José Forjaz, an architect of Portuguese origins, who, since 1978, represented a prestigious figure in both political and cultural fields. Forjaz was director of the Faculty of Architecture of UEM and director of the DNH (Direcção Nacional de Habitação) of the Ministry of Public Works and Housing. Thanks to the efforts of his research group, even if not implemented, the 2004 plan still constitutes a point of reference for the university, and provides a useful key for the analysis and understanding of the context.
A critical reading of the plan in fact provides interesting support for the new project development. The situation in 2004, before the Forjaz’s Masterplan, shows a disordered structure in which some buildings follow the north-south Cartesian orientation, others are oriented according to the distribution axis of the formal city and others follow their own logic. The buildings are concentrated in different areas of the campus, taking up the concept of "subdivision by zones and functions" of the PROFABRIL plan.
Looking at Figure 2, the first panel (Figure 2a, phase 0), certifies that in 2004 the area for sport fields, student and professor dormitories, the university library, the faculties of Science, Economics, Letters, Agronomy, Biology, Laboratories, the botanical garden building, already existed. Technical rooms, a sports pavilion, an area for the historical archive and one occupied by TELEVISA, and a private radio and television group are also present. The distribution of the road system for vehicles and parking areas is also reported. The second panel (Figure 2b, phase 1), shows the interventions deemed immediate by Forjaz’s Plan. The third panel shows Forjaz’s plan in its whole (Figure 2c, final phase). The proposal includes the distribution of the buildings along the north-south axis and aims to cover the entire available area, concentrating in the eastern part. The idea is to adopt a rectangular module, intended to house the classrooms, which is repeated vertically along a narrower ‘slat’, or a corridor intended for connection. Each classroom is combined with a patio and, at a less dense rhythm, by three smaller square modules, intended for the auditorium, while the services are arranged in smaller modules, mirroring the classrooms.
The external connection is solved through a road that, starting from the one already present in the centre of the area, runs parallel to the Campus border from north-east to south, and then continues in the different areas, joining the Rua dos Presidentes, Avenida De França and Avenida Vladimir Lenine, roads that connect the Campus to the city. The ramifications towards the centre of the Campus are therefore eliminated, as well as the parking areas, which are instead distributed in various points along the road that surrounds the main area. The road connecting Avenida Julius Nyerere has been moved, almost cutting the Botanical Garden in half. The pedestrian traffic is thought through covered walkways, which constitute the corridors on which the classrooms are grafted.
Overlapping Forjaz’s Plan with the current state, it is easily concluded that the evolution of the conformation of the Campus did not follow the direction given by the 2004 Masterplan. The buildings built after 2004 that incorporate the plan are those that were highlighted in Phase 1 (Figure 2a) with the exception of the lake. The current Department of Mathematics and Computer Science (Figure 3) is the only building to resume the setting for "grafts" that characterizes the Plan. The structure is made up of two almost identical rectangular blocks that graft onto a covered corridor. However, this body is interrupted by a third rectangular block, as wide as the others but twice as long. The reasons for which Forjaz’s Plan was abandoned are unknown but, as can be seen from the current state of affairs, the Campus is still incomplete and lacking in the facilities and services that should have been provided for the various departments. In Figure 4, the current situation of the Campus is shown; among the issues of the present Campus, three important points have to be highlighted:
  • The central area is still occupied by Televisa. The telecommunications company established its headquarters inside the perimeter of the Campus from the time of the civil war, occupying an extremely strategic position. This area is scarcely exploited, since it is an area with few buildings and a lot of free space.
  • The south-west belt is occupied by the presence of a large construction site owned by the Chinese Government. There is currently a pavilion and a new entrance to the campus.
  • The southern part of the Campus is bordered by a vast area currently free of buildings whose ownership and intended use are unknown. This area could play an important role and contribute to the redevelopment of UEM.

3. Materials and Methods

3.1. Proposal

The case study presented herein can be described as an iterative and multidisciplinary process of design and verification of microclimatic performance in relation to the local conditions of the site. The work, therefore, aims at defining a repeatable procedure, which integrates the principles of architectural design with the urban microclimate design into a single process in order to optimize the energy performance of the new urban fabric, to improve its comfort levels and to reduce construction costs, all of which are necessary to achieve the highest standards. The project aims at establishing a permanent research board on the topic of sustainable urban design focused, in particular, on the development of UEM Campus. In terms of the architectural design approach, the new proposal does not differ significantly from the previous one except for the proportion of the blocks, whose typology has been slightly modified in order to fit with current spatial needs.
The desire to maintain the general layout of Forjaz’s proposal largely originates in reducing the urbanization costs, but also in the recognition of a rational urban design, the good balance between public and semi-public spaces, and the clear reference to the formal grid layout of the colonial city, which became an element of order in relation to the chaotic and informal development of spontaneous surrounding neighbourhoods. Some optimization has been adopted for the public spaces, roads, sidewalks and multipurpose public building. The comparison between Forjaz’s proposal of a modular building typology, the currently adopted one, and the one planned by the ‘País Project’ reveals the evolution of the global design. Even if the collected documentation does not provide information regarding the elevation envisaged in Forjaz’s Plan, it sounds reasonable to consider an elevation of two or three levels at least. The rectangular volumes are intended for the main functions and are inserted into the longitudinal connection element. The services, placed independently, are separated from the main volumes and are repeated at irregular intervals along the ‘slat’. In the current situation, the only building that appears to resume Forjaz’s Plan is located in the central part of the Campus. The structure follows the orientation and the proposed arrangement, but the model has undergone many changes. The rectangular volumes are wider and go directly into the ‘walkway batten’. The functional program of each block is distributed over three levels, two of which are intended to host classrooms. The complementary volumes for services remain, while the square volume in the centre of the patio becomes a loggia, covered on the top floor. The staircase runs parallel to the ‘slat’, and two staircases have been added on the side of each rectangular volume, supported by a septum, each one inconveniently serving a different floor. Each volume has a different height, and this is mainly at disadvantage of the connecting batten, now difficult to perceive because its shape appears fragmented, representing just a covered walkway. In the new proposal the type of the block is made up of three volumes that are grafted onto a narrower perpendicular volume. Even if the proposal maintains the position and the general setting of Forjaz’s Plan, the spaces and connections are optimized and based on the internal functional program. The project follows a specific hierarchy, in which the corridor acquires character, becoming a liveable and multifunctional space that allows distribution in the various branches, each with a specific function. The rectangular modules are arranged along the ‘slat’, marking a 1:2.7 ratio with the courtyard; the serving rooms are rethought and acquire meaning, the general design appears clearer and more orderly. Even if the ‘comb-shaped’ south-east oriented disposition is common to the three plans, they diverge in terms of proportion of the modular blocks (Figure 5). Forjaz’s ‘C-shaped’ block is the smallest in terms of both width and length; the courtyard is smaller even than the existing ones, and it seems to be insufficient for ensuring air circulation. The existing building has the same orientation, but different proportions, from the proposed one, which had a bigger courtyard with a similar ratio but 30% deeper. The comparison among the proposal for the typology of the modular building, the currently adopted one, and the one planned by the ‘País project’ reveals the evolution of the design. The proportions of Forjaz’s ‘C-shaped’ block, of the existing ‘C-shaped’ block, and of the proposed País’ ‘C-shaped’ block are listed in Table 1 and shown in Figure 5.
The depth of the País’ ‘C-shaped’ block (Figure 6) is largely derived from the need to ensure the correct insulation for classrooms and a better quality of the public space. In terms of urban design and orientation, the new Masterplan does not differ significantly from either the Forjaz one or from the existing buildings, except the proportions of the courtyard, which evolve 23.00 × 47.00 m (ratio 1:2) to 28.45 × 76.00 m (ratio 1:2.7). Even if this change seems minimal, its effects significantly affect the overall outdoor comfort performances. The ‘Project Pais’ Masterplan (2019) is shown in Figure 7; the new buildings have been split into two complexes, a northern complex and a southern complex, to improve human outdoor comfort, following the results of the simulation of the present situation (see Section 3).

3.2. From Standard Planning Methodologies for Urban Microclimate Design

Even if the general design proposed by the ‘Project Pais’ research group represents a significant update with respect to the existing plan, the main innovation of this case study is represented by the methodology behind the process of generating the urban shape. As stated in the previous paragraphs, the current urban design does not properly take into account the microclimate behaviour of urban shape. The standard approach interprets the topic of sustainability as if it were acceptable to leave the management of the issue of thermal outdoor comfort to building technology and/or artificial air conditioning alone. Even if, as stated previously, the scientific community currently accepts that the application of energy saving policies to single building tends to reduce their effectiveness (De Pascali, 2008 [1]), the majority of legislative guidelines and design activities concern individual buildings and exclude the adoption of particular policies for the urban shape. This produces the necessity to broaden the field of intervention toward the urban scale, involving in the process different disciplines: from Architecture to Fluid dynamics and Physics. On this topic, the Masterplan for the Campus of University Eduardo Mondlane in Maputo develops a methodology on the basis of which integrate both microclimatic data and analyses start from the initial design model. The already validated software ENVI-met (see Section 1.1) acts as a useful ‘feedback’ tool that is able to verify—even qualitatively—the microclimatic behaviour of the designed concept. In this case, the analysis is focused on microclimatic consequences of a ‘C’ block typology southeast oriented in the climatic Maputo’s specific climatic characteristics. As suggested by Blocken (2015) [31], since experimental data for the case under study were not available, the validation process can be achieved by performing generic sub-configurations contained in high-quality experimental datasets available online.
From the usual point of view of an architect (or of a planner), it is not acceptable to originate urban shape directly or automatically on the basis of microclimatic needs. It sounds reasonable, because the architecture of the city is actually the result of a complex relation between several constrains and factors, functional and even symbolic, that cannot be simplified in a sort of mechanical process of urban shape generation. Thus, this approach starts from an early layout that is gradually evaluated and modified in relation to the main critical issues highlighted by microclimatic analyses, in a sort of circular process which ends with a proposed solution that can be considered as an acceptable balance between spatial and microclimatic instances.
The proposed approach to urban microclimate design is structured through a three-step process:
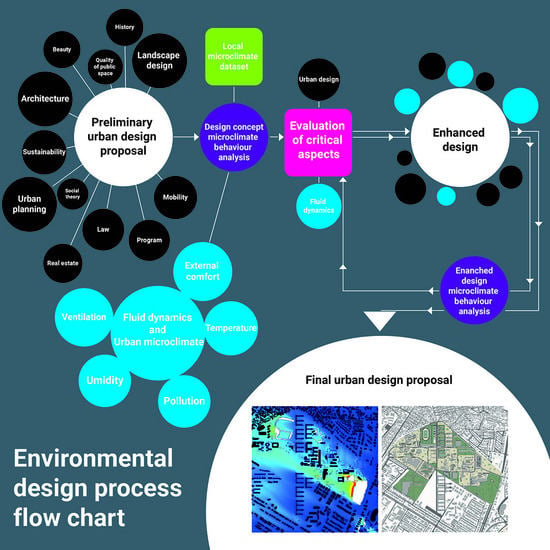
  • Phase 1. The present urban design is analysed from a microclimatic point of view, with the support of the already validated software ENVI-met, in order to identify primary critical situations, and test typo-morphological solutions of the project and the consequences that these choices produced on microclimatic behaviour.
  • Phase 2. The initial choices of the proposed urban design are modified with the intent of improving design performance and overcoming the critical situations previously identified. The proposed modifications are studied in order to comply with certain general settings of the original project.
  • Phase 3. The proposed urban design is analysed as in phase 1 to evaluate its microclimatic and outdoor comfort performances and, in case, modified and re-evaluated, until the urban design is considered satisfactory.
As mentioned in previous paragraphs, Forjaz’s Masterplan has not been implemented to date. Consequently, to verify the microclimatic performance of the Forjaz’s Masteplan makes no sense in terms of scientific results. Nevertheless, the current proposal largely derives from the general layout designed by the Mozambican-Portuguese architect. Even if some important improvement were set in terms of typology and spatial organization, the ‘comb-shaped’ layout of the new proposal is largely consistent with the previous one. In terms of macro-behaviour, the microclimatic performances of the two proposals may have a lot of similarities. While at a ‘micro-scale’, here intended as the scale of a single building, the two behaviours may differ significantly. Consequently, in terms of ‘qualitative analysis’ of the climatic performances of the Masterplan, in this case only two different configurations were evaluated: the current one and the ‘Project Pais’ design.

3.3. Input Data for the Simulations

As previously stated, the analyses presented in this paper were developed with the help of ENVI-met (version 4.4). ENVI-met allows the designer to evaluate the performance for specific periods of the day of many microclimatic parameters, through easy-to-understand thematic graphical maps; in particular, in this work, the focus is on wind, temperature, relative humidity and PMV.
The UEM Campus is in Maputo, which is located at around 25°58′ S, 32°35′ E directly facing the Indian Ocean, with a tropical savanna (or wet and dry) climate (Aw according to Köppen climate classification). Meteorological data regarding the town can be obtained from three meteorological stations: Maputo, Maputo MZ and Maputo/Benfica. Being in the southern hemisphere, monthly averaged air temperature usually varies from a minimum of 19.5 °C in July to a maximum of 26.9 °C in December and January, with a mean value of 23.7 °C. Relative humidity varies from a minimum of 67% in September to a maximum of 74% from December to March, with a mean value of 71%. Wind velocity varies from a maximum of 5.0 m/s on September and October to a minimum of 3.3 m/s in June, with an average of 4.3 m/s, and the prevailing (i.e., the most frequent) wind direction is south-east, that corresponds also to the dominant wind (i.e., the one with the highest velocities).
As in the tropical and subtropical climates, the most critical hours for the Urban Heat Island phenomenon are in the range 14:00–16:00 (Ferreira et al., 2012 [32]), the time chosen for the data extraction is 15:00 of the most critical day for the local situation December 21st, which is the summer solstice (in the southern hemisphere), with the simulation starting the day before. Data were saved every 30 minutes of simulated time, while the update timing was 600 s for plant processes, 30 s for surface data, 600 s for radiation/shadows and 900 s for the flow field. The input data were: a wind velocity of 4.3 m/s at an altitude of 10 m and coming from the south-east direction; a temperature of 27.0°; a relative humidity of 74%. The boundary conditions were: Simple Forcing for the meteorology; TKE (Turbulent Kinetic Energy) model (Mellor and Yamada 1982) for the turbulence model; Lateral Boundary Condition (LBC) for temperature and humidity: Forced; LBC for turbulence: Cyclic.
Regarding the spatial domain chosen for the simulations, on the left of Figure 8, the terrain elevation in metres above the mean sea level, employed in the ENVI-met simulations is shown. Moreover, we must consider that the Sommerschield district, in which the UEM Campus is located, is on the edge of the so-called ‘formal city’, the planned city built during the colonial age. The northern surroundings are fully covered by an ‘informal’ unplanned suburb built mainly of poor buildings with steel roofs. In the south-east corner there is a large botanical garden which provides humidity and shadow. The east border is close to the seafront even if some high building prevents the Campus to be full related with it. Those external parts may have a critical influence on the climatic performances of the Campus; thus, the considered domain is significantly larger than the UEM’s area. In fact, the domain, taking into account the terrain altitude, is: 1020 m long, 920 m wide and 250 m high for the current situation (on the left of Figure 9, Figure 10, Figure 11, Figure 12, Figure 13 and Figure 14), and 1525 m long, 1375 m wide and 250 m high for the planned situation (on the right of Figure 9, Figure 10, Figure 11, Figure 12, Figure 13 and Figure 14). In both cases, individual cells are cubes of 5 m, leading to a 204 × 191 × 50-cell domain for the current situation and to 305 × 275 × 50-cell domain for the planned situation. In particular, the DTM (Digital Terrain Model) is shown, for a better visualization, in two Figures, Figure 8 and Figure 9. In Figure 9, the soil, buildings (in black) and vegetation on the two domains (current and planned situations) are shown. The existing buildings of the Campus have a height of 11.00 m, the proposed ones 10.50 m, and the surrounding ones are between 4 and 7 m, with the relevant exception of two hotels close to the ocean, in the south-east direction, the highest building of which has a height of around 70 m. As shown by Fabbri et al. (2017) [33] and Duarte et al. (2015) [34], the vegetation plays a relevant role in the urban microclimate, so the present vegetation has been included in the simulated domain; in particular, dark green indicates very dense trees, 10m-high and with a leafless base (ID 0000T1 in the ENVI-met plant database), pale green indicates very dense trees, 15 m high, with a distinct crown layer (ID 0000SK in the ENVI-met plant database), while the buildings have the default wall parameters of ENVI-met. The terrain is “terre battue” (ID 0000TB in the ENVI-met surface database), which was chosen because, among the materials for the soil surface included in ENVI-met, it had the closest features to those of the natural soil of the Campus and its neighbourhood: very hard and dry. To improve the visualization and avoid any confusion with the data, in Figure 10, Figure 11, Figure 12, Figure 13, Figure 14, Figure 15, Figure 16, Figure 17 and Figure 18, the vegetation is plotted in white. A preliminary simulation, under the same weather conditions, was performed on a wider domain (on the right of Figure 8), 2500 m long, 2500 m wide, and 250 m high (500 × 500 × 50-cell), which included the ocean on the south-east boundary, to obtain the wind profile shape to provide input to the current situation and planned situation simulations, in order to take into account the high buildings upstream the campus and, at the same time, reduce the computational time.
In previous studies, (Chiri and Giovagnorio 2012 [35]; Giovagnorio and Chiri, 2016 [36]) we verified the index of insulation even in the early stage of the design process. Nevertheless, in this case, due to both the dimension of the considered domains and the low height of the buildings, we decided to verify this parameter only at a smaller scale in future investigations. Data were firstly extracted from the output files of ENVI-met with the tool Leonardo, and then converted into 3D matrices for visualization and analysis with Matlab (Version R2020a, The MathWorks, Inc., Natick, MA, USA).

4. Results

4.1. Analysis and Comparison of Current Situation and Planned Situation

In Figure 10, Figure 12, Figure 14, Figure 16 and Figure 17, the maps of the simulated relative humidity, wind speed, air temperature, PMV and PMV with saturated values, for the current situation (on the left) and for the planned situation (on the right), are shown in false colours: colours close to dark blue mean low values, close to dark red high values; to avoid any confusion with the data, the buildings are in black, the vegetation in white. The quantities are measured 1.50 m from the ground, i.e., at pedestrian level. To simplify the quantitative evaluation of the microclimatic performances of the new buildings when compared to the existing buildings’ ones, in Figure 11, Figure 13, Figure 15 and Figure 18, a zoom is shown of the proposed buildings in the northern complex (on the left) and in the southern complex (on the right), with counter lines for each quantity. Moreover, on the left plot of Figure 11, Figure 13, Figure 15 and Figure 18, the existing buildings are shown as well. As the new buildings are planned to be placed downstream of the existing Campus, here the target is not to improve the microclimatic performances of the existing Campus but to design new buildings that have better performances than the existing ones. For this reason, a comparison between the values (of humidity, wind velocity, air temperature and PMV) in the planned buildings and in the empty space they are planned to be placed is not shown.
A first critical issue of the current situation is the humidity (on the left of Figure 10), as the botanical garden (the large white stain on the south-east corner of the Figure) significantly influences the comfort performances of the Campus public space in terms of rise of humidity index. The humidity produced by plant transpiration increases the air humidity and the prevalent wind, coming from the sea in the south-east direction, it is transferred across the Campus, affecting all the downstream buildings and public spaces; this issue had to be taken into account in the planning of the distribution of the new buildings, as in a sub-tropical climate an increase in humidity can be very unpleasant. For this reason, the new buildings were split into two complexes, one south of and one north of the high humidity wake, in order to avoid an overlap with the humidity wake. Consequently, the new buildings have lower humidity values than the existing ones. As a matter of fact, the humidity values in the courtyards of the proposed southern complex (on the right of Figure 11) are between around 52.00% and 53.00%, in the proposed northern complex (on the left of Figure 11) between around 52.50% and 52.75%, while in the courtyards of the existing Campus (on the left of Figure 11) the values are almost everywhere higher than 53.00%, with peaks of 55.00%.
A second critical issue of the current situation is the ventilation in the courtyards of the existing Campus (plot on the left of Figure 12: colours represent the absolute values, arrows both the direction and the absolute values). The wind velocity is damped from the trees of the botanical garden and from the downstream buildings such that, even if the existing ‘C’-shaped block are correctly east oriented, most of the courtyards experience velocities lower than around 1.5–2 m/s. The worst cases are in the courtyards downstream of the north-south oriented building on the right of the Campus, which, together with the trees present there, reduce the wind velocity to less than 1 m/s. To overcome this issue, two strategies have been pursued: the already-mentioned split into two complexes and the employment of larger courtyards to enhance the air circulation and, in turn, improve the courtyards’ overall comfort. The plot on the right of Figure 12 confirms that this result has been achieved, as the wind velocities inside the new buildings courtyards are higher almost everywhere than in the existing ones. In particular, the contour plots in Figure 13 show that the wind velocity in the courtyards of the proposed southern complex (on the right of Figure 13) are between around 2.0 m/s and 4.0 m/s (somewhere higher than 4.0 m/s), in the proposed northern complex (on the left of Figure 13) mainly between around 1.5 m/s and 3.0 m/s, while in the courtyards of the existing Campus (on the left in Figure 13), the values are almost everywhere lower than around 1.5 m/s.
The left of Figure 14 shows that temperature is not a relevant issue: the average temperature range is not very wide (around 24.0 °C in almost all the existing Campus area) and does not exceed typical tropical conditions. In the new buildings, temperature (on the right of Figure 14) does not get better, and it tends to remain on the average of tropical climate. Figure 15 shows that the air temperature is higher in the courtyards of the proposed southern complex (on the right of Figure 15), between around 24.15 °C and 24.00 °C, and slightly lower in the proposed northern complex between and in the existing Campus (on the left of Figure 15), around 24.00 °C and 23.95 °C.
The value of the PMV index is very relevant in microclimate design, because, as mentioned above, PMV summarizes the external thermal comfort conditions in a single number. The left plot of Figure 16 highlights that, in the current situation, a non-optimal situation is found, as in the public spaces are almost everywhere around 2.0, meaning that users will tend to feel warm and to perceive moderate heat stress. The right-hand side of Figure 16 shows that bigger courtyards improve overall comfort: the PMV index is now better distributed compared with the current situation, and it is dramatically improved in some local situations (e.g., inside almost all the new courtyards). To better highlight this point, in Figure 17, the colour map is saturated at 1.55 and 2.00: in this way, it is possible to see how the PMV values in most of the new courtyards have now dropped to values lower than 1.55, and all of them demonstrate better outdoor comfort performances than the current situation ones. To be more precise, Figure 18 shows the contour plots of PMV: a user will feel more comfortable in the courtyards of the proposed southern complex (PMV drops under 1.50 in some points, corresponding to a thermal perception of slightly warm and to a slight heat stress) and of the proposed northern complex (with slightly higher values) than in the existing Campus ones (where almost everywhere PMV is 1.90). This is mainly due to two aspects: the better ventilation and the lower humidity of the ‘C’-shaped block east oriented (in particular for the ones not downstream of the current buildings).

4.2. Process Advantages and Limitations

The positive results obtained following the analysis confirmed not only the validity of the project interventions, but the effectiveness of the design procedure. The integration of a continuous check system, placed side-by-side with the design process, assisted the designer in selecting and editing the typo-morphological solutions to allow definition of a more efficient urban form even in the early stages of the project. The advantages of this method allowed the technician to act upstream of the design process rather than downstream, to define more energy-saving and environmentally aware solutions. The software used reveals to be an extraordinary tool through which it is possible to qualitatively assess the trends stemming from the initial choices, directing the design towards the overall improvement of its performance. The accuracy of the results is still related to the size of the area, and is reduced in direct ratio to the extension of the surface. Specifically, the numerical precision of the result is reduced to a qualitative trend, especially on the edges, while in the centre the data have better accuracy. If, on the one hand, the procedure applied to the case study demonstrates still to be in an experimental stage, on the other hand, it certifies its effectiveness if applied from the preliminary stages of the project to understand design behaviour resulting from initial choices. To build according to principles of sustainability does not mean sacrificing quality of spaces. Architects and technicians do not necessarily give up their own responsibilities by delegating architectural issues to computer and informatics technology. In this process, the software assists the designer as a technical instrument, but it cannot mechanically replace him with respect to design choices aimed at quality and at the spatial configuration of city. However, the results, confirmed by the experiment as expected, demonstrate the method’s validity and its applicability in diffuse forms.

5. Discussion. The Results of Planning Intervention

As mentioned in the previous paragraph, even if some important improvement were set in terms of typology and spatial organization, the ‘comb-shaped’ layout of the new proposal is largely consistent with the previous one. In terms of macro-behaviour, the climatic performances of the two proposals have a lot of similarities. In fact, the overall ‘qualitative analysis’ of climatic performances of the two evaluated configuration (the current one and the ‘Project Pais’ design) reports a lot of similarities, except for a clear prevalence for the newest one with regards with the air-flow in the courtyards. This enhancement is largely derived from the H/W ratio adopted for the new project, which is closer to that of the Forjaz block even if the general dimension of the court is bigger. In fact, the existing building has a H/W ratio of 2.09 due to the fact that it has the same courtyard as the Forjaz one, but with higher buildings. The planned block has an H/W ratio of 2.70, which is slightly more than the existing one, even if it is less than 3.36 H/W of the Forjaz’s block. The shape of the urban blocks affects the settlement’s ability to use natural lighting and ventilation for indoor and outdoor spaces and, moreover, the urban design orientation with respect to the prevailing wind direction flow is dramatically important. Consequently, the confirmation of Forzjaz’s ‘comb-shaped’ design is correct, both for general spatial arguments and for climatic comfort consideration. The modification applied to the original block shows its validity in optimizing overall performances of the courtyards and also their liveability as public spaces. The results of this work contribute to confirm the validity of an integrated approach to urban design. Nevertheless, the project should be supported by a deeper analysis of the relation between the quality of outer spaces (in terms of vegetation, water pools, etc.) and the micro-climate. Finally, as mentioned in previous paragraphs, this work does not consider insulation because of the width of the dominion; nevertheless, it is crucial in a closer investigation. Furthermore, the characteristics of materials can play a crucial role in determining a good comfort performance and in reducing thermal control and surface reflection. In summary, the future perspectives of this work may be summarized as follows:
  • A more specific work on the shape of the buildings that compose the blocks in order to verify the opportunity to introduce some interruption in the blocks to provide better air flow;
  • A focus on design intermediate scale, which may highlight the relation between the shape and the solar radiation;
  • A sort of ‘close-up’ on a group of buildings, testing different façade designs in order to prevent bad insulation of inner space or, conversely, too much radiation on exposed walls.
  • A deeper test on the influence of vegetation and pools in outer spaces in microclimate performances.
  • Research on the influence of the albedo of local materials on the climatic building’ behaviour.

6. Conclusions

The Masterplan for the Campus of the University Eduardo Mondlane in Maputo (Mozambique) has been employed as a case study to test a recursive and multidisciplinary methodology that integrates architectural design with fluid dynamics, in an approach where the shape and distribution of buildings are planned following both the optimization of urban microclimate and the principles of architectural design. To the best of the authors’ knowledge, this is the first time that this kind of architectural urban microclimate design process has been applied in the social and cultural context of the African city of Maputo (Mozambique).
The proposed planned intervention envisages C-shaped blocks, east-oriented, in harmony with those of Forjaz’s Masterplan, but optimized in shape, proportions and distribution according to the results of the microclimate simulations on the present situation. The software ENVI-met (version 4.4), widely adopted and validated in recent years, was employed for the microclimatic simulations and the PMV index was used to compare the outdoor comfort performance of the planned intervention to the ones of the present situation.
The results show that the planned C-shaped blocks, east-oriented and with higher H/W ratio and courtyard ratio than the existing buildings, allow better natural ventilation without increasing the temperature. The splitting of the Campus into a northern and a southern complex avoids the planned buildings being affected by the high-humidity wake generated when the prevailing wind passes through the botanical garden. PMV fields confirm the good performance, in term of outdoor comfort, of the planned buildings, as the PMV value in their courtyards is always better than the one in the existing Campus. As a consequence, we can state that the planned solution has better microclimatic performances, also in terms of outdoor comfort, than the existing one.
These results were reached thanks to the above-mentioned recursive and multidisciplinary process, where urban planning is not only guided by architectural decisions (with the risk to have an interesting but inefficient urban environments), but also, conversely, not only guided by the “mechanical” answers given by a software (with the risk to have an efficient but unpleasant urban environments).

Author Contributions

Conceptualization, G.M.C. and S.F.; methodology, G.M.C., S.F. and L.T.; software, S.F. and L.T.; formal analysis investigation, G.M.C., A.C. and L.N.; resources, L.N.; data curation, L.T.; writing—original draft preparation, G.M.C., S.F. and A.C.; writing—review and editing, M.A.; visualization, L.T. and L.N.; supervision, G.M.C.; project administration, M.A.; funding acquisition, M.A. and G.M.C. All authors have read and agreed to the published version of the manuscript.

Funding

This work is funded by the Autonomous Region of Sardinia within the program of international cooperation ex L.19/96- “Project Paìs” 2019.

Acknowledgments

This project was developed by a joint group of Cagliari Faculty of Engineering and Architecture—Department of Civil and Environmental Engineering and Architecture and the University of Maputo Eduardo Mondlane, Faculdade de Arquitectura y Planeamento Fisico within the “Project País” financed in 2019 by the Autonomous Region of Sardinia within the program of international cooperation ex L.19/96. We would like to mention: Sara Spiga for her thesis project whose work largely contributed to the general Masterplan; Marta Pilleri who spent a lot of time in Maputo during her PhD in order to collect data; Vania Armando who enthusiastically contributed on public spaces design; all the colleagues and students of both Faculties for supporting us in the development of the project.

Conflicts of Interest

The authors declare no conflict of interest. The funders had no role in the design of the study; in the collection, analyses, or interpretation of data; in the writing of the manuscript, or in the decision to publish the results.

References

  1. De Pascali, P. Città ed Energia. La Valenza Energetica dell’Organizzazione Insediativa; Franco Angeli: Milano, Italy, 2008. [Google Scholar]
  2. Balaras, C.; Droutsa, K.G.; Dascalaki, E.; Kontoyiannidis, S.; Moro, A.; Bazzan, E. Urban Sustainability Audits and Ratings of the Built Environment. Energies 2019, 12, 4243. [Google Scholar] [CrossRef] [Green Version]
  3. Susowake, Y.; Masrur, H.; Yabiku, T.; Senjyu, T.; Howlader, A.M.; Abdel-Akher, M.; Hemeida, A.M. A Multi-Objective Optimization Approach towards a Proposed Smart Apartment with Demand-Response in Japan. Energies 2019, 13, 127. [Google Scholar] [CrossRef] [Green Version]
  4. Cordero, A.S.; Melgar, S.G.; Andújar, J.M. Green Building Rating Systems and the New Framework Level(s): A Critical Review of Sustainability Certification within Europe. Energies 2019, 13, 66. [Google Scholar] [CrossRef] [Green Version]
  5. Mancini, F.; Basso, G.L. How Climate Change Affects the Building Energy Consumptions Due to Cooling, Heating, and Electricity Demands of Italian Residential Sector. Energies 2020, 13, 410. [Google Scholar] [CrossRef] [Green Version]
  6. Santamouris, M. Energy and Climate in the Urban Built Environment; Informa UK Limited: London, UK, 2013. [Google Scholar]
  7. Oke, T.R. The energetic basis of the urban heat island. Q. J. R. Meteorol. Soc. 1982, 108, 1–24. [Google Scholar] [CrossRef]
  8. Chiri, G.; Giovagnorio, I. Gaetano Vinaccia’s (1881–1971) Theoretical Work on the Relationship between Microclimate and Urban Design. Sustainability 2015, 7, 4448–4473. [Google Scholar] [CrossRef] [Green Version]
  9. Giovagnorio, I.; Usai, D.; Palmas, A.; Chiri, G. The environmental elements of foundations in Roman cities: A theory of the architect Gaetano Vinaccia. Sustain. Cities Soc. 2017, 32, 42–55. [Google Scholar] [CrossRef]
  10. Badas, M.G.; Ferrari, S.; Garau, M.; Seoni, A.; Querzoli, G. On the Flow Past an Array of Two-Dimensional Street Canyons Between Slender Buildings. Boundary-Layer Meteorol. 2020, 174, 251–273. [Google Scholar] [CrossRef] [Green Version]
  11. Garau, M.; Badas, M.G.; Ferrari, S.; Seoni, A.; Querzoli, G. Air exchange in urban canyons with variable building width: A numerical LES approach. Int. J. Environ. Pollut. 2019, 65, 103. [Google Scholar] [CrossRef] [Green Version]
  12. Badas, M.G.; Salvadori, L.; Garau, M.; Querzoli, G.; Ferrari, S. Urban areas parameterisation for CFD simulation and cities air quality analysis. Int. J. Environ. Pollut. 2019, 66, 14. [Google Scholar] [CrossRef]
  13. Garau, M.; Badas, M.G.; Ferrari, S.; Seoni, A.; Querzoli, G. Turbulence and Air Exchange in a Two-Dimensional Urban Street Canyon Between Gable Roof Buildings. Boundary-Layer Meteorol. 2018, 167, 123–143. [Google Scholar] [CrossRef]
  14. Badas, M.G.; Ferrari, S.; Garau, M.; Querzoli, G. On the effect of gable roof on natural ventilation in two-dimensional urban canyons. J. Wind. Eng. Ind. Aerodyn. 2017, 162, 24–34. [Google Scholar] [CrossRef]
  15. Ferrari, S.; Badas, M.G.; Garau, M.; Seoni, A.; Querzoli, G. The air quality in narrow two-dimensional urban canyons with pitched and flat roof buildings. Int. J. Environ. Pollut. 2017, 62, 22. [Google Scholar] [CrossRef]
  16. Costanzo, V.; Yao, R.; Xu, T.; Xiong, J.; Zhang, Q.; Li, B. Natural ventilation potential for residential buildings in a densely built-up and highly polluted environment. A case study. Renew. Energy 2019, 138, 340–353. [Google Scholar] [CrossRef]
  17. Ng, E. (Ed.) Designing High-Density Cities for Social and Environmental Sustainability; Earthscan: London, UK, 2010. [Google Scholar]
  18. Coccolo, S.; Kämpf, J.; Scartezzini, J.-L.; Pearlmutter, D. Outdoor human comfort and thermal stress: A comprehensive review on models and standards. Urban Clim. 2016, 18, 33–57. [Google Scholar] [CrossRef]
  19. Fanger, P.O. Thermal Comfort, Analysis and Applications in Environmental Engineering; McGraw-Hill Book Company: New York, NY, USA, 1970. [Google Scholar]
  20. Bruse, M.; Fleer, H. Simulating surface–plant–air interactions inside urban environments with a three dimensional numerical model. Environ. Model. Softw. 1998, 13, 373–384. [Google Scholar] [CrossRef]
  21. ENVI-met Homepage. Available online: http://www.envi-met.com (accessed on 15 July 2011).
  22. Abdi, B.; Hami, A.; Zarehaghi, D. Impact of small-scale tree planting patterns on outdoor cooling and thermal comfort. Sustain. Cities Soc. 2020, 56, 102085. [Google Scholar] [CrossRef]
  23. Ouali, K.; El Harrouni, K.; Abidi, M.L.; Diab, Y. Analysis of Open Urban Design as a tool for pedestrian thermal comfort enhancement in Moroccan climate. J. Build. Eng. 2020, 28, 101042. [Google Scholar] [CrossRef]
  24. Hassan, S.A.; Abrahem, S.A.; Husian, M.S. Comparative Analysis of Housing Cluster Formation on Outdoor Thermal Comfort in Hot-arid Climate. J. Adv. Res. Mech. Therm. Sci. 2019, 63, 10. [Google Scholar]
  25. Limona, S.S.; Al-Hagla, K.S.; El-Sayad, Z.T. Using simulation methods to investigate the impact of urban form on human comfort. Case study: Coast of Baltim, North Coast, Egypt. Alex. Eng. J. 2019, 58, 273–282. [Google Scholar] [CrossRef]
  26. Shinzato, P.; Simon, H.; Duarte, D.H.S.; Bruse, M. Calibration process and parametrization of tropical plants using ENVI-met V4—Sao Paulo case study. Arch. Sci. Rev. 2019, 62, 112–125. [Google Scholar] [CrossRef]
  27. Karakounos, I.; Dimoudi, A.; Zoras, S. The influence of bioclimatic urban redevelopment on outdoor thermal comfort. Energy Build. 2018, 158, 1266–1274. [Google Scholar] [CrossRef]
  28. Nasrollahi, N.; Hatami, M.; Khastar, S.R.; Taleghani, M. Numerical evaluation of thermal comfort in traditional courtyards to develop new microclimate design in a hot and dry climate. Sustain. Cities Soc. 2017, 35, 449–467. [Google Scholar] [CrossRef]
  29. GhaffarianHoseini, A.; Berardi, U.; GhaffarianHoseini, A. Thermal performance characteristics of unshaded courtyards in hot and humid climates. Build. Environ. 2015, 87, 154–168. [Google Scholar] [CrossRef]
  30. Fabbri, K.; Costanzo, V. Drone-assisted infrared thermography for calibration of outdoor microclimate simulation models. Sustain. Cities Soc. 2020, 52, 101855. [Google Scholar] [CrossRef]
  31. Blocken, B. Computational Fluid Dynamics for urban physics: Importance, scales, possibilities, limitations and ten tips and tricks towards accurate and reliable simulations. Build. Environ. 2015, 91, 219–245. [Google Scholar] [CrossRef] [Green Version]
  32. Ferreira, M.J.; Oliveira, A.; Soares, J.; Codato, G.; Barbaro, E.; Escobedo, J.F. Radiation balance at the surface in the city of São Paulo, Brazil: Diurnal and seasonal variations. Theor. Appl. Clim. 2011, 107, 229–246. [Google Scholar] [CrossRef]
  33. Fabbri, K.; Canuti, G.; Ugolini, A. A methodology to evaluate outdoor microclimate of the archaeological site and vegetation role: A case study of the Roman Villa in Russi (Italy). Sustain. Cities Soc. 2017, 35, 107–133. [Google Scholar] [CrossRef]
  34. Duarte, D.H.S.; Shinzato, P.; Gusson, C.D.S.; Alves, C.A. The impact of vegetation on urban microclimate to counterbalance built density in a subtropical changing climate. Urban Clim. 2015, 14, 224–239. [Google Scholar] [CrossRef]
  35. Chiri, G.M.; Giovagnorio, I. The Role of the City’s Shape in Urban Sustainability. Int. Trans. J. Eng. Manag. Appl. Sci. Technol. 2012, 3, 14. [Google Scholar]
  36. Giovagnorio, I.; Chiri, G. The Environmental Dimension of Urban Design: A Point of View. In Sustainable Urbanization; IntechOpen: London, UK, 2016. [Google Scholar]
Figure 1. The Sommerschield district in 2017. The UEM Campus is highlighted in the centre of the area. Behind the north boundary there is the informal development.
Energies 13 02316 g001
Figure 2. The Campus in 2004. (a) starting situation (phase 0): the Campus in 2004, (b) the interventions deemed immediate by the Forjaz’s Plan (phase 1), (c) Forjaz’s Masterplan for 2006–2020 (final phase).
Energies 13 02316 g002
Figure 3. Existing modular blocks. The Department of Mathematics and Computer Science is the only building to resume the setting for “grafts” that characterizes the Plan.
Energies 13 02316 g003
Figure 4. Current situation of the Campus. The four main entrances are signed with an arrow. In the north, the informal district with the typical steel-covered roof. On the right the coast with the line of recent skyscrapers. The green area is the botanical garden.
Energies 13 02316 g004
Figure 5. Different settings for the modular blocks. From left to right: Forjaz’s ‘C-shaped’ block, existing ‘C-shaped’ block, and proposed País’ ‘C-shaped’ block (measures in metres).
Energies 13 02316 g005
Figure 6. Typical internal distribution of modular block in 2019 proposal.
Energies 13 02316 g006
Figure 7. The Sommerschield district in ‘Project Pais’ Masterplan (2019); the new buildings are split into two complexes, a northern complex and a southern complex.
Energies 13 02316 g007
Figure 8. On the left: terrain elevation (m above the mean sea level) employed in the ENVI-met simulations; on the right: a view of the 3D model employed for the preliminary simulation on a larger scale.
Energies 13 02316 g008
Figure 9. The domain employed in the ENVI-met simulations, with buildings (in black) and vegetation (pale green and dark green): on the left, the current situation (1020 m/204 cells in the X-direction, 920 m/191 cells in the Y-direction), on the right, the planned situation (1525 m/305 cells in the X-direction, 1375 m/275 cells in the Y-direction).
Energies 13 02316 g009
Figure 10. Relative humidity [%] at pedestrian level: on the left, in the current situation; on the right, in the planned situation.
Energies 13 02316 g010
Figure 11. Comparison of the relative humidity [%] at pedestrian level in the new buildings and in the existing ones: on the left, the northern complex of proposed buildings with the old Campus; on the right, the southern complex of proposed buildings.
Energies 13 02316 g011
Figure 12. Wind velocity [m/s] at pedestrian level: on the left, in the current situation; on the right, in the planned situation.
Energies 13 02316 g012
Figure 13. Comparison of wind velocity [m/s] at pedestrian level in the new buildings and in the existing ones: on the left, the northern complex of proposed buildings with the old Campus; on the right, the southern complex of proposed buildings.
Energies 13 02316 g013
Figure 14. Air temperature [°C] at pedestrian level: on the left, in the current situation; on the right, in the planned situation.
Energies 13 02316 g014
Figure 15. Comparison of the air temperature [°C] at pedestrian level in the new buildings and in the existing ones: on the left, the northern complex of proposed buildings with the old Campus; on the right, the southern complex of proposed buildings.
Energies 13 02316 g015
Figure 16. PMV [-]at pedestrian level: on the left, in the current situation; on the right, in the planned situation.
Energies 13 02316 g016
Figure 17. PMV (1.55 < PMV < 2.00) at pedestrian level: on the left, in the current situation; on the right, in the planned situation.
Energies 13 02316 g017
Figure 18. Comparison of the PMV [-] at pedestrian level in the new buildings and in the existing ones: on the left, the northern complex of proposed buildings with the old Campus; on the right, the southern complex of proposed buildings.
Energies 13 02316 g018
Table 1. Proportions of Forjaz’s ‘C-shaped’ block, of the existing ‘C-shaped’ block, and of the proposed País’ ‘C-shaped’ block.
Proportions of C-Shaped BlockBuilding Length [m]Building Width [m]Block Length (Including the Courtyard) [m]Block Width [m]Height [m]Courtyard Length [m]Courtyard Width [m]Courtyard Ratio [-]H/W Ratio [-]
Forjaz47.0012.5084.5053.607.0047.0023.501:23.36
Existing47.2017.6094.5057.7011.0047.2023.001:22.09
País71.7518.50118.8091.4010.5076.0028.451:2.72.70

