Environmental Assessment of a Coal Power Plant with Carbon Dioxide Capture System Based on the Activated Carbon Adsorption Process: A Case Study of the Czech Republic


Abstract
:1. Introduction
- An extensive literature survey of current LCA studies on various carbon capture technologies;
- Performance of a holistic environmental LCA case study on the unique technology of activated carbon adsorption of CO2 in Czech energy conditions;
- An LCA case study based on operational data of an operating 250 MW power unit from a national-scale project;
- Performance of robust LCA analyses for the adsorption capture process conducted at four decision making levels (characterization, normalization, Pareto analysis, and input-output analysis);
- An economical calculation of commercial CCU unit with payback period;
- The identification of areas within a carbon capture technological process that can be improved to enhance environmental and economic performance.
2. Methods
2.1. Environmental Assessment: The Life Cycle Assessment Method
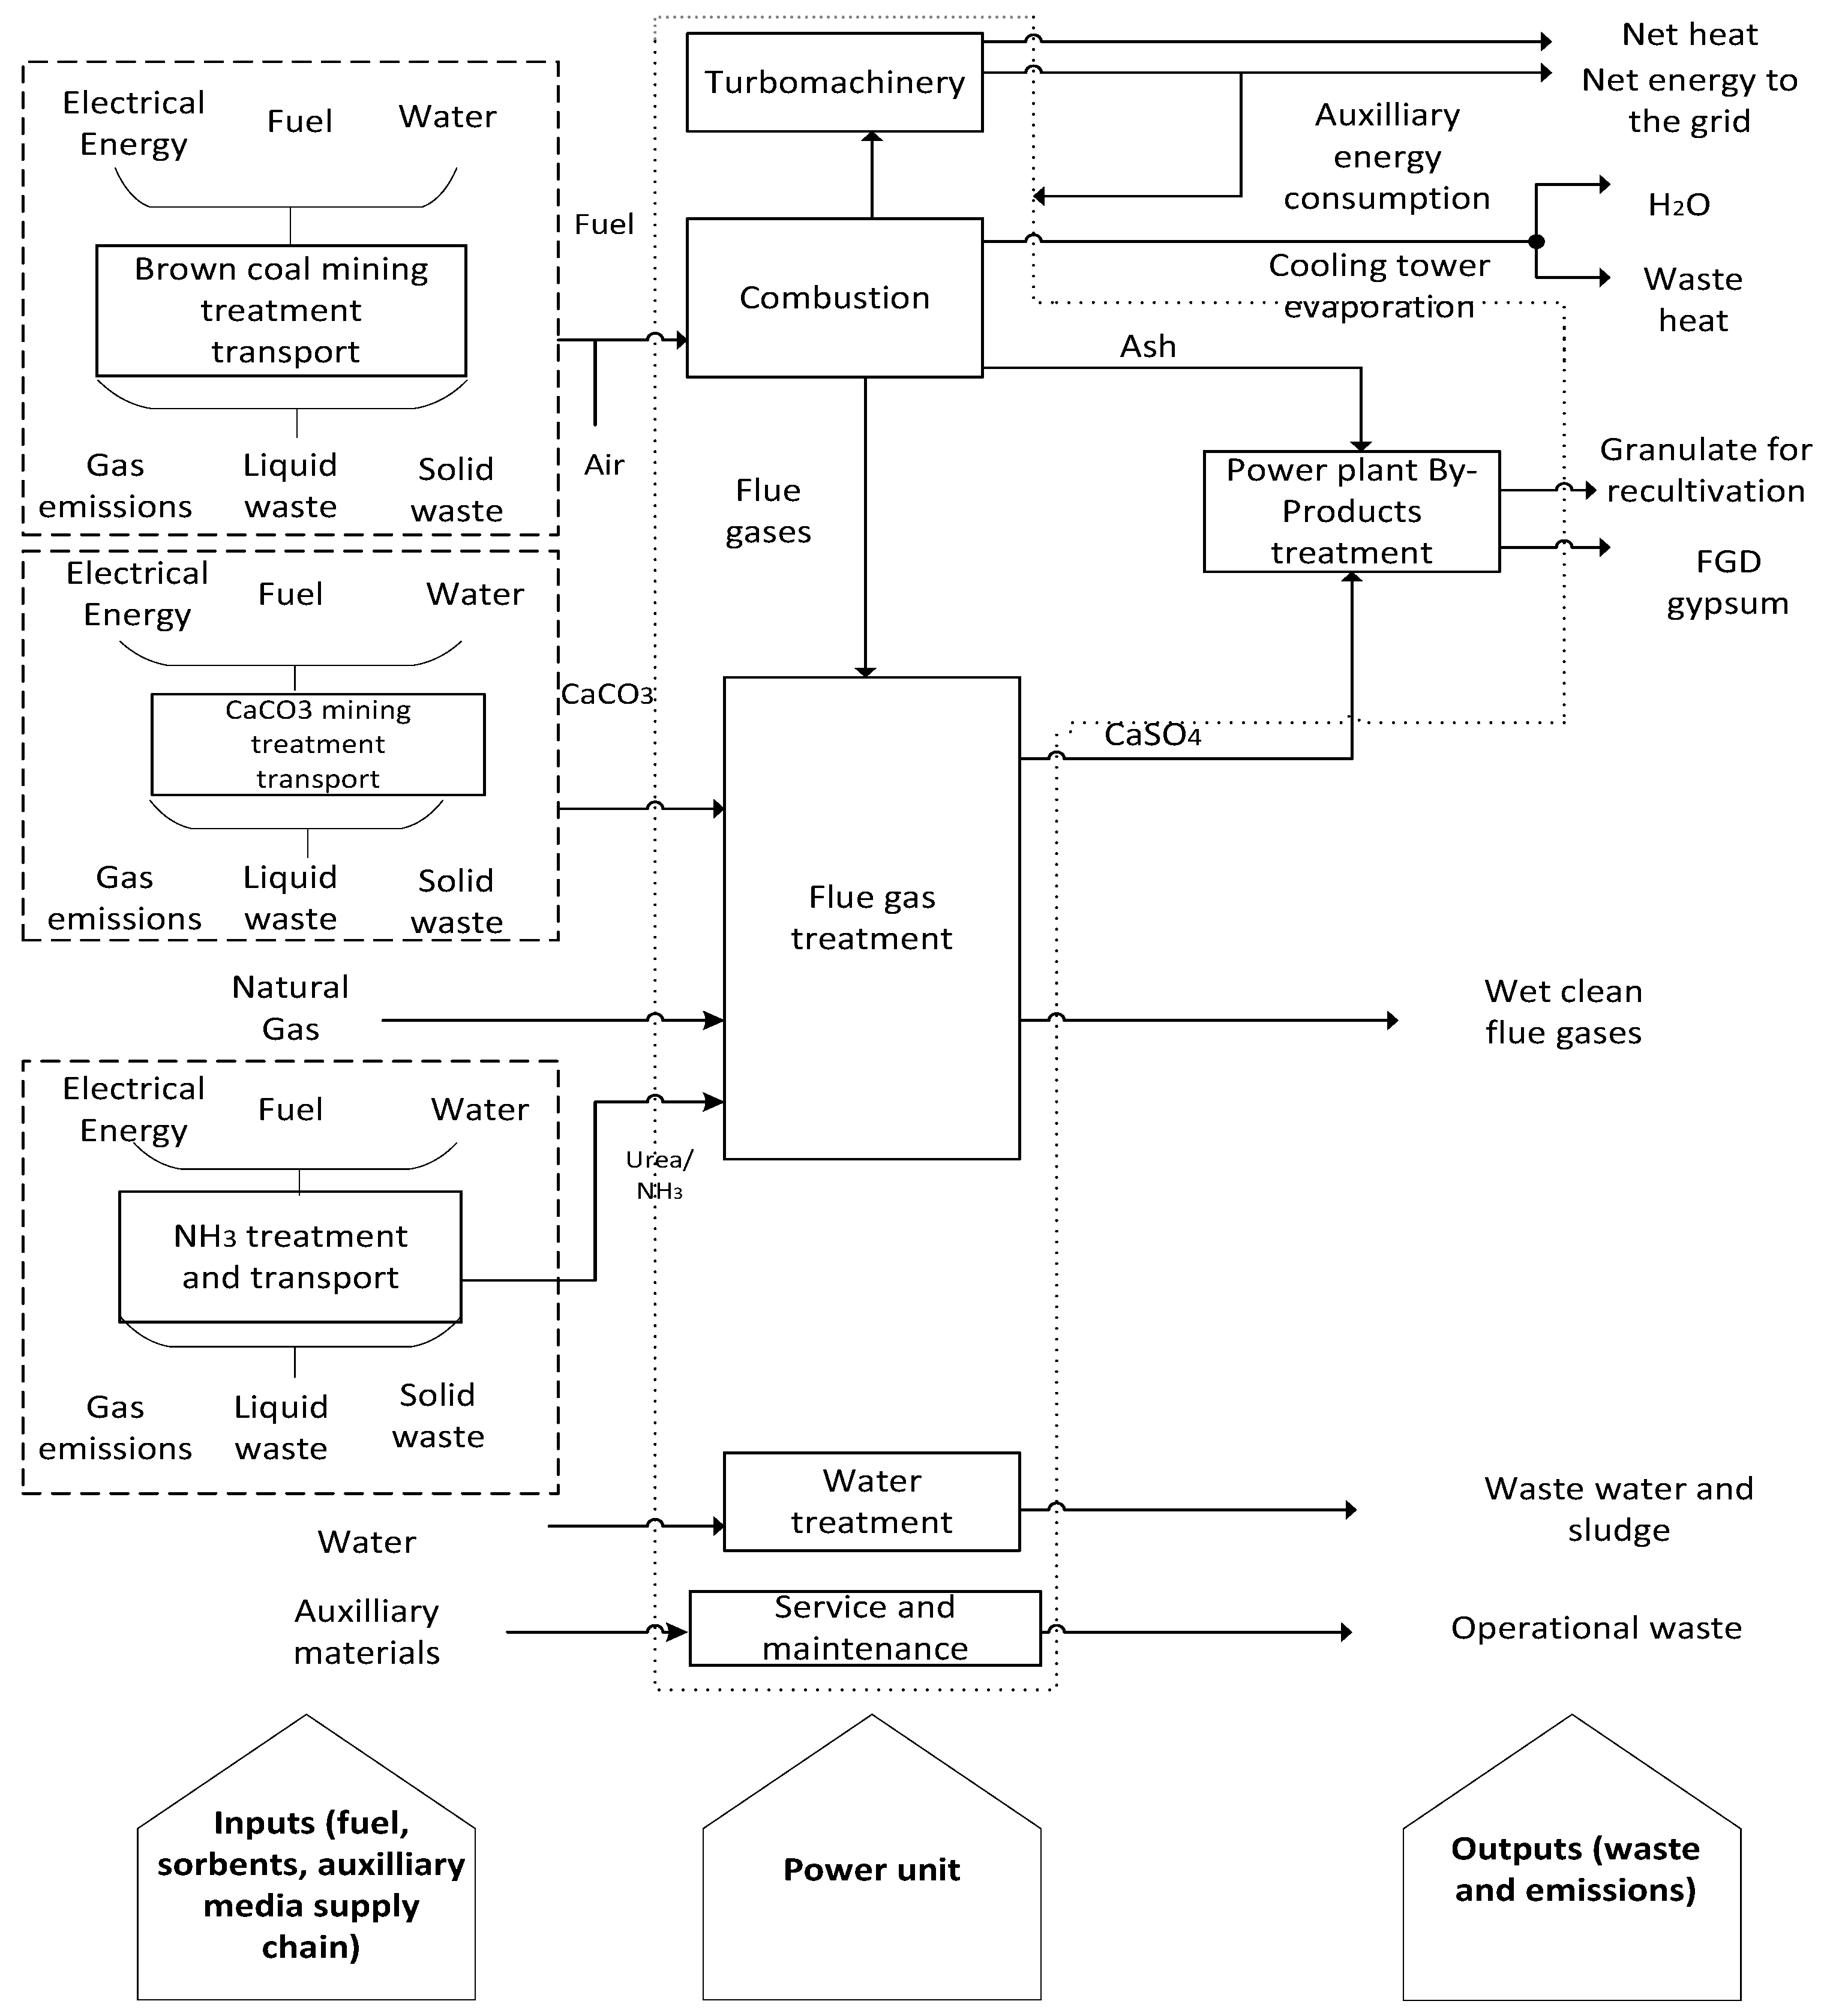
- Scenario 1 which is the assessment of electricity production by the 250 MW coal power unit.
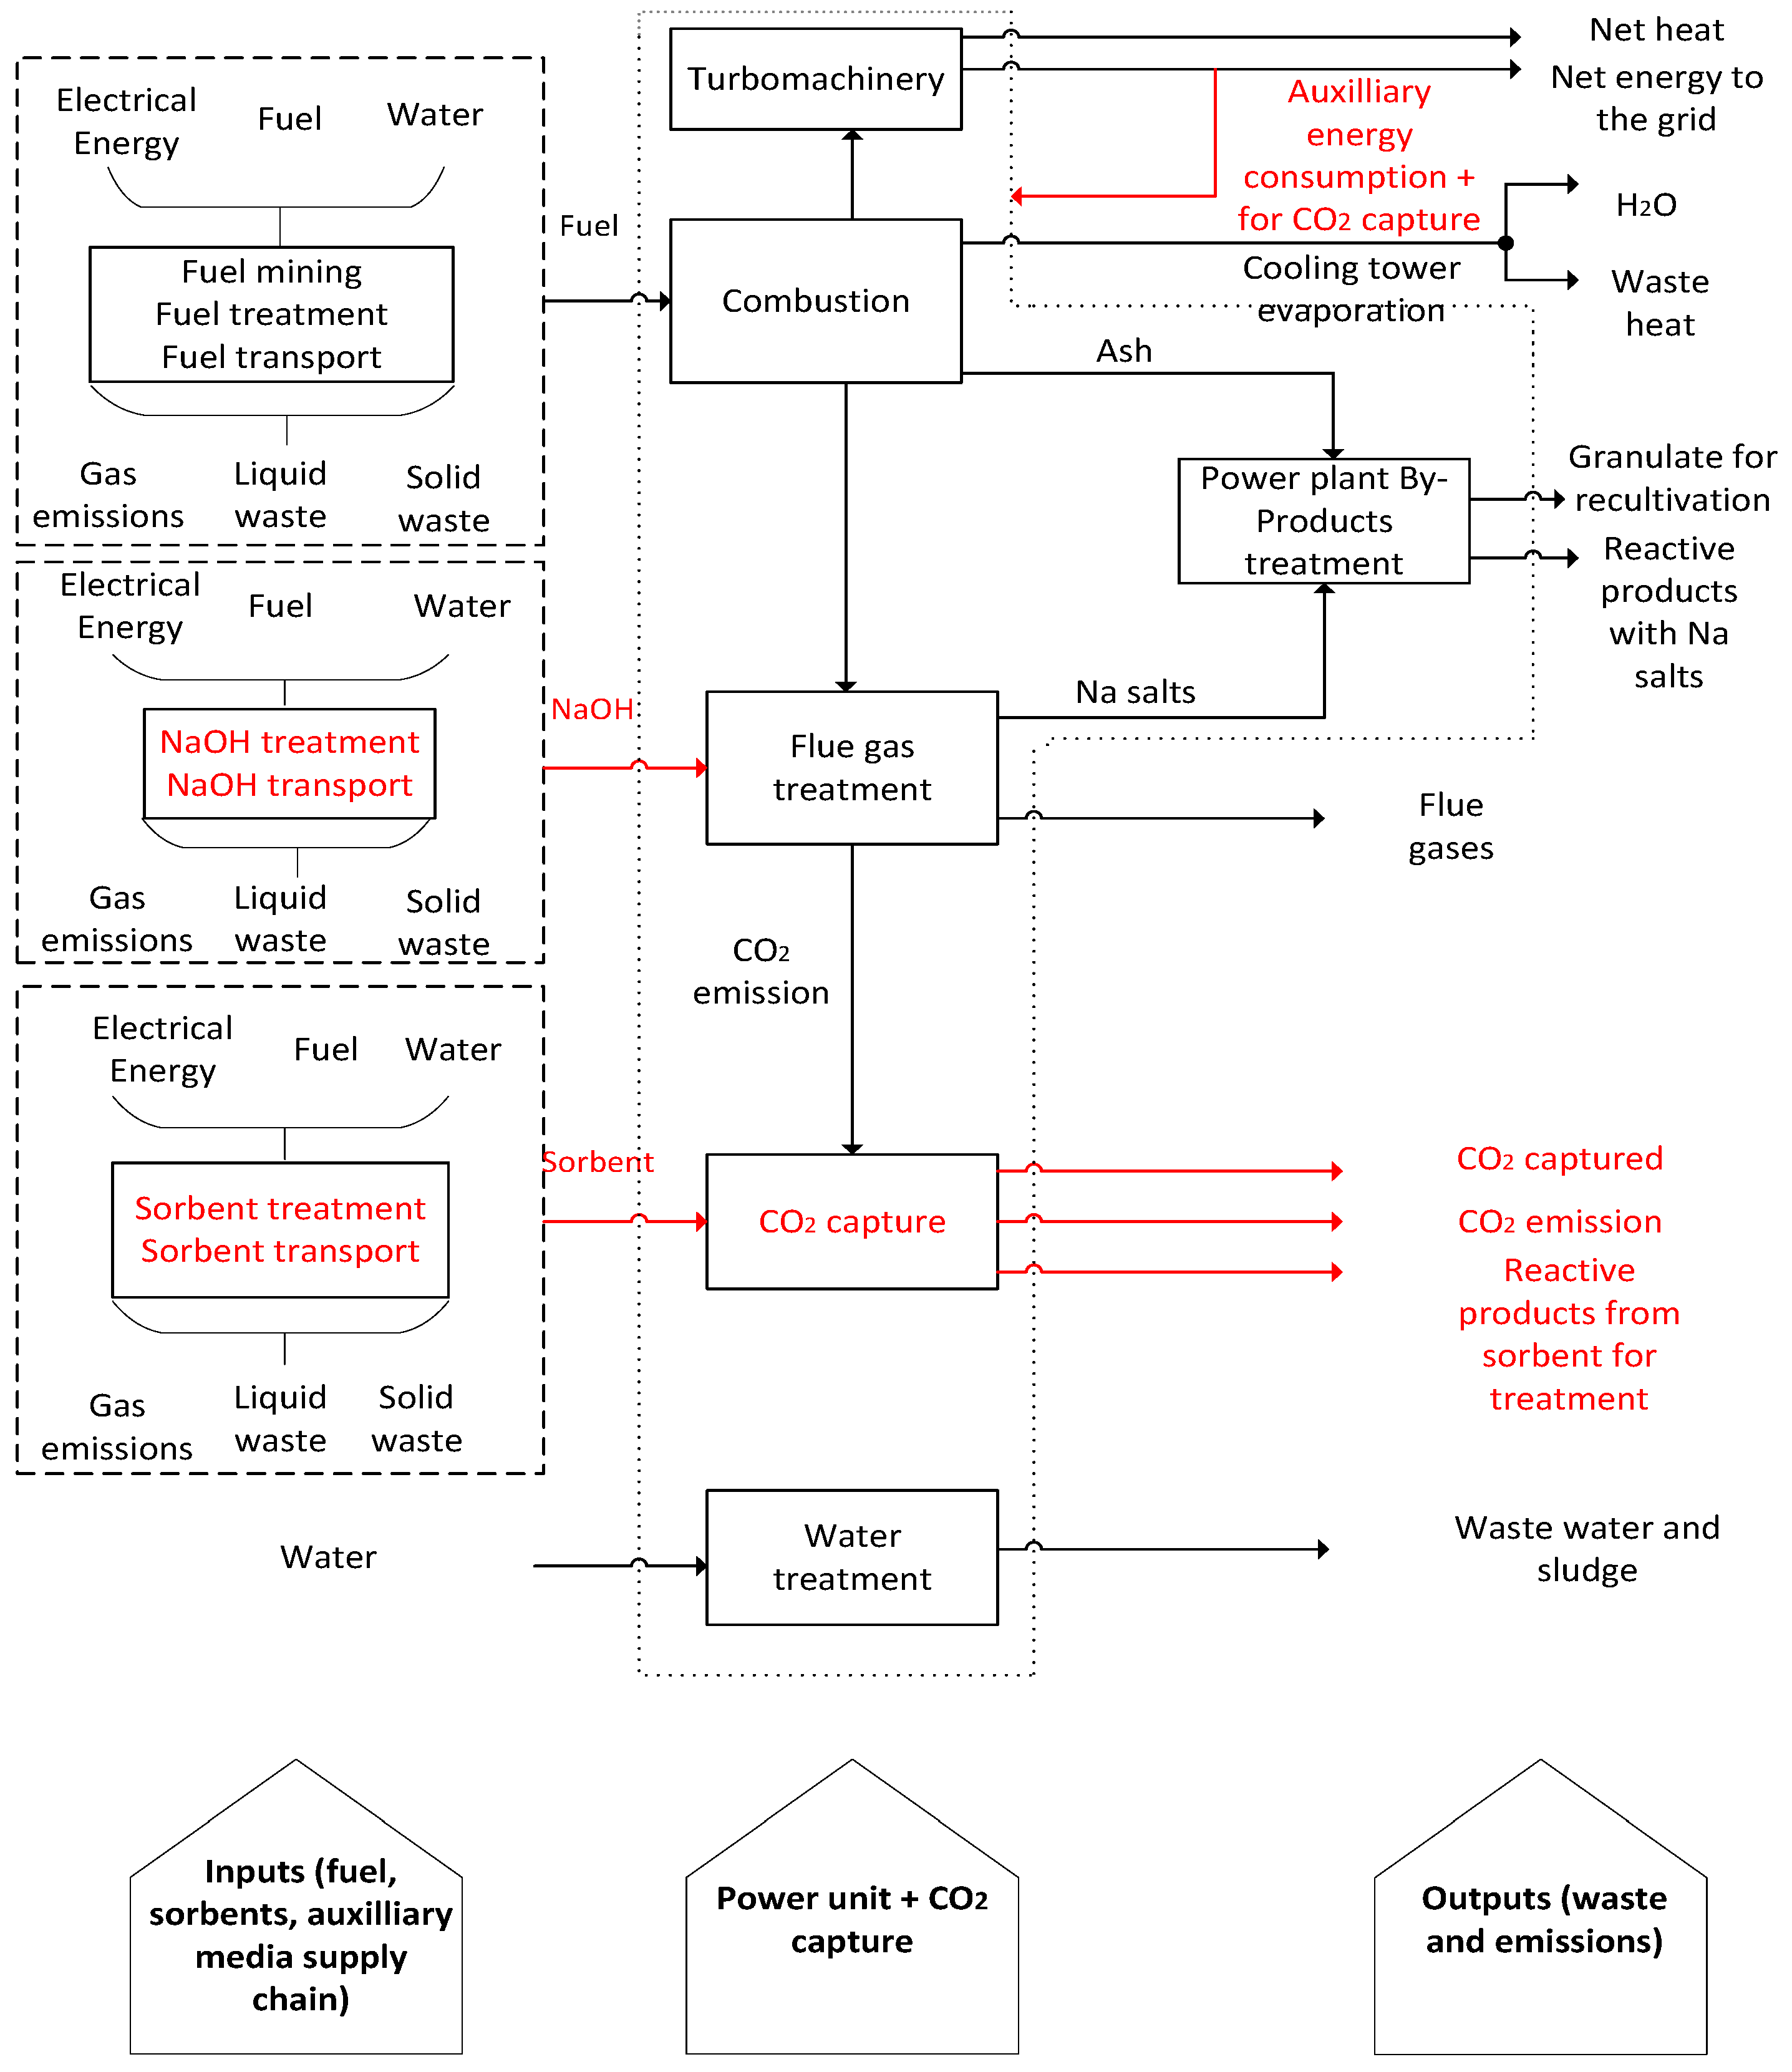
- Scenario 2 which is the assessment of the electricity production by the 250 MW coal power unit integrated with the CO2 adsorption unit.
2.2. Economical Assessment and Economical Inventory of the Carbon Capture Unit (CCU)
3. Case Study Definition: Reduction of CO2 Emissions in the Czech Republic
3.1. Scenario 1: Reference Power Plant
3.2. Scenario 2: Activated Carbon Adsorption for Reference Power Plant
3.3. LCA Study: System Boundaries Definition
3.4. Life Cycle Inventory
- The energy required for the 250 MW power unit is determined by brown coal mix production in the conditions of the Czech Republic.
- The reactive product from the NaOH reaction is a non-utilized waste which would be stored at a landfill.
- The wastewater is processed in a wastewater treatment plant and the data for the wastewater treatment plant was taken from the general EU standard dataset thinkstep.
- The primary resource of the activated carbon is hard coal, which is transported by diesel train for an average distance of 1000 km.
- The energy source required for activated carbon activation and carbonization is natural gas.
3.5. Economical Calculation
- Capture effectivity 50%;
- CCU unit would process 0.1% to 0.2% of flue gases produced by an average power plant block;
- CCU unit would capture around 1200 t CO2/year.
4. Results
4.1. Life Cycle Impact Assessment
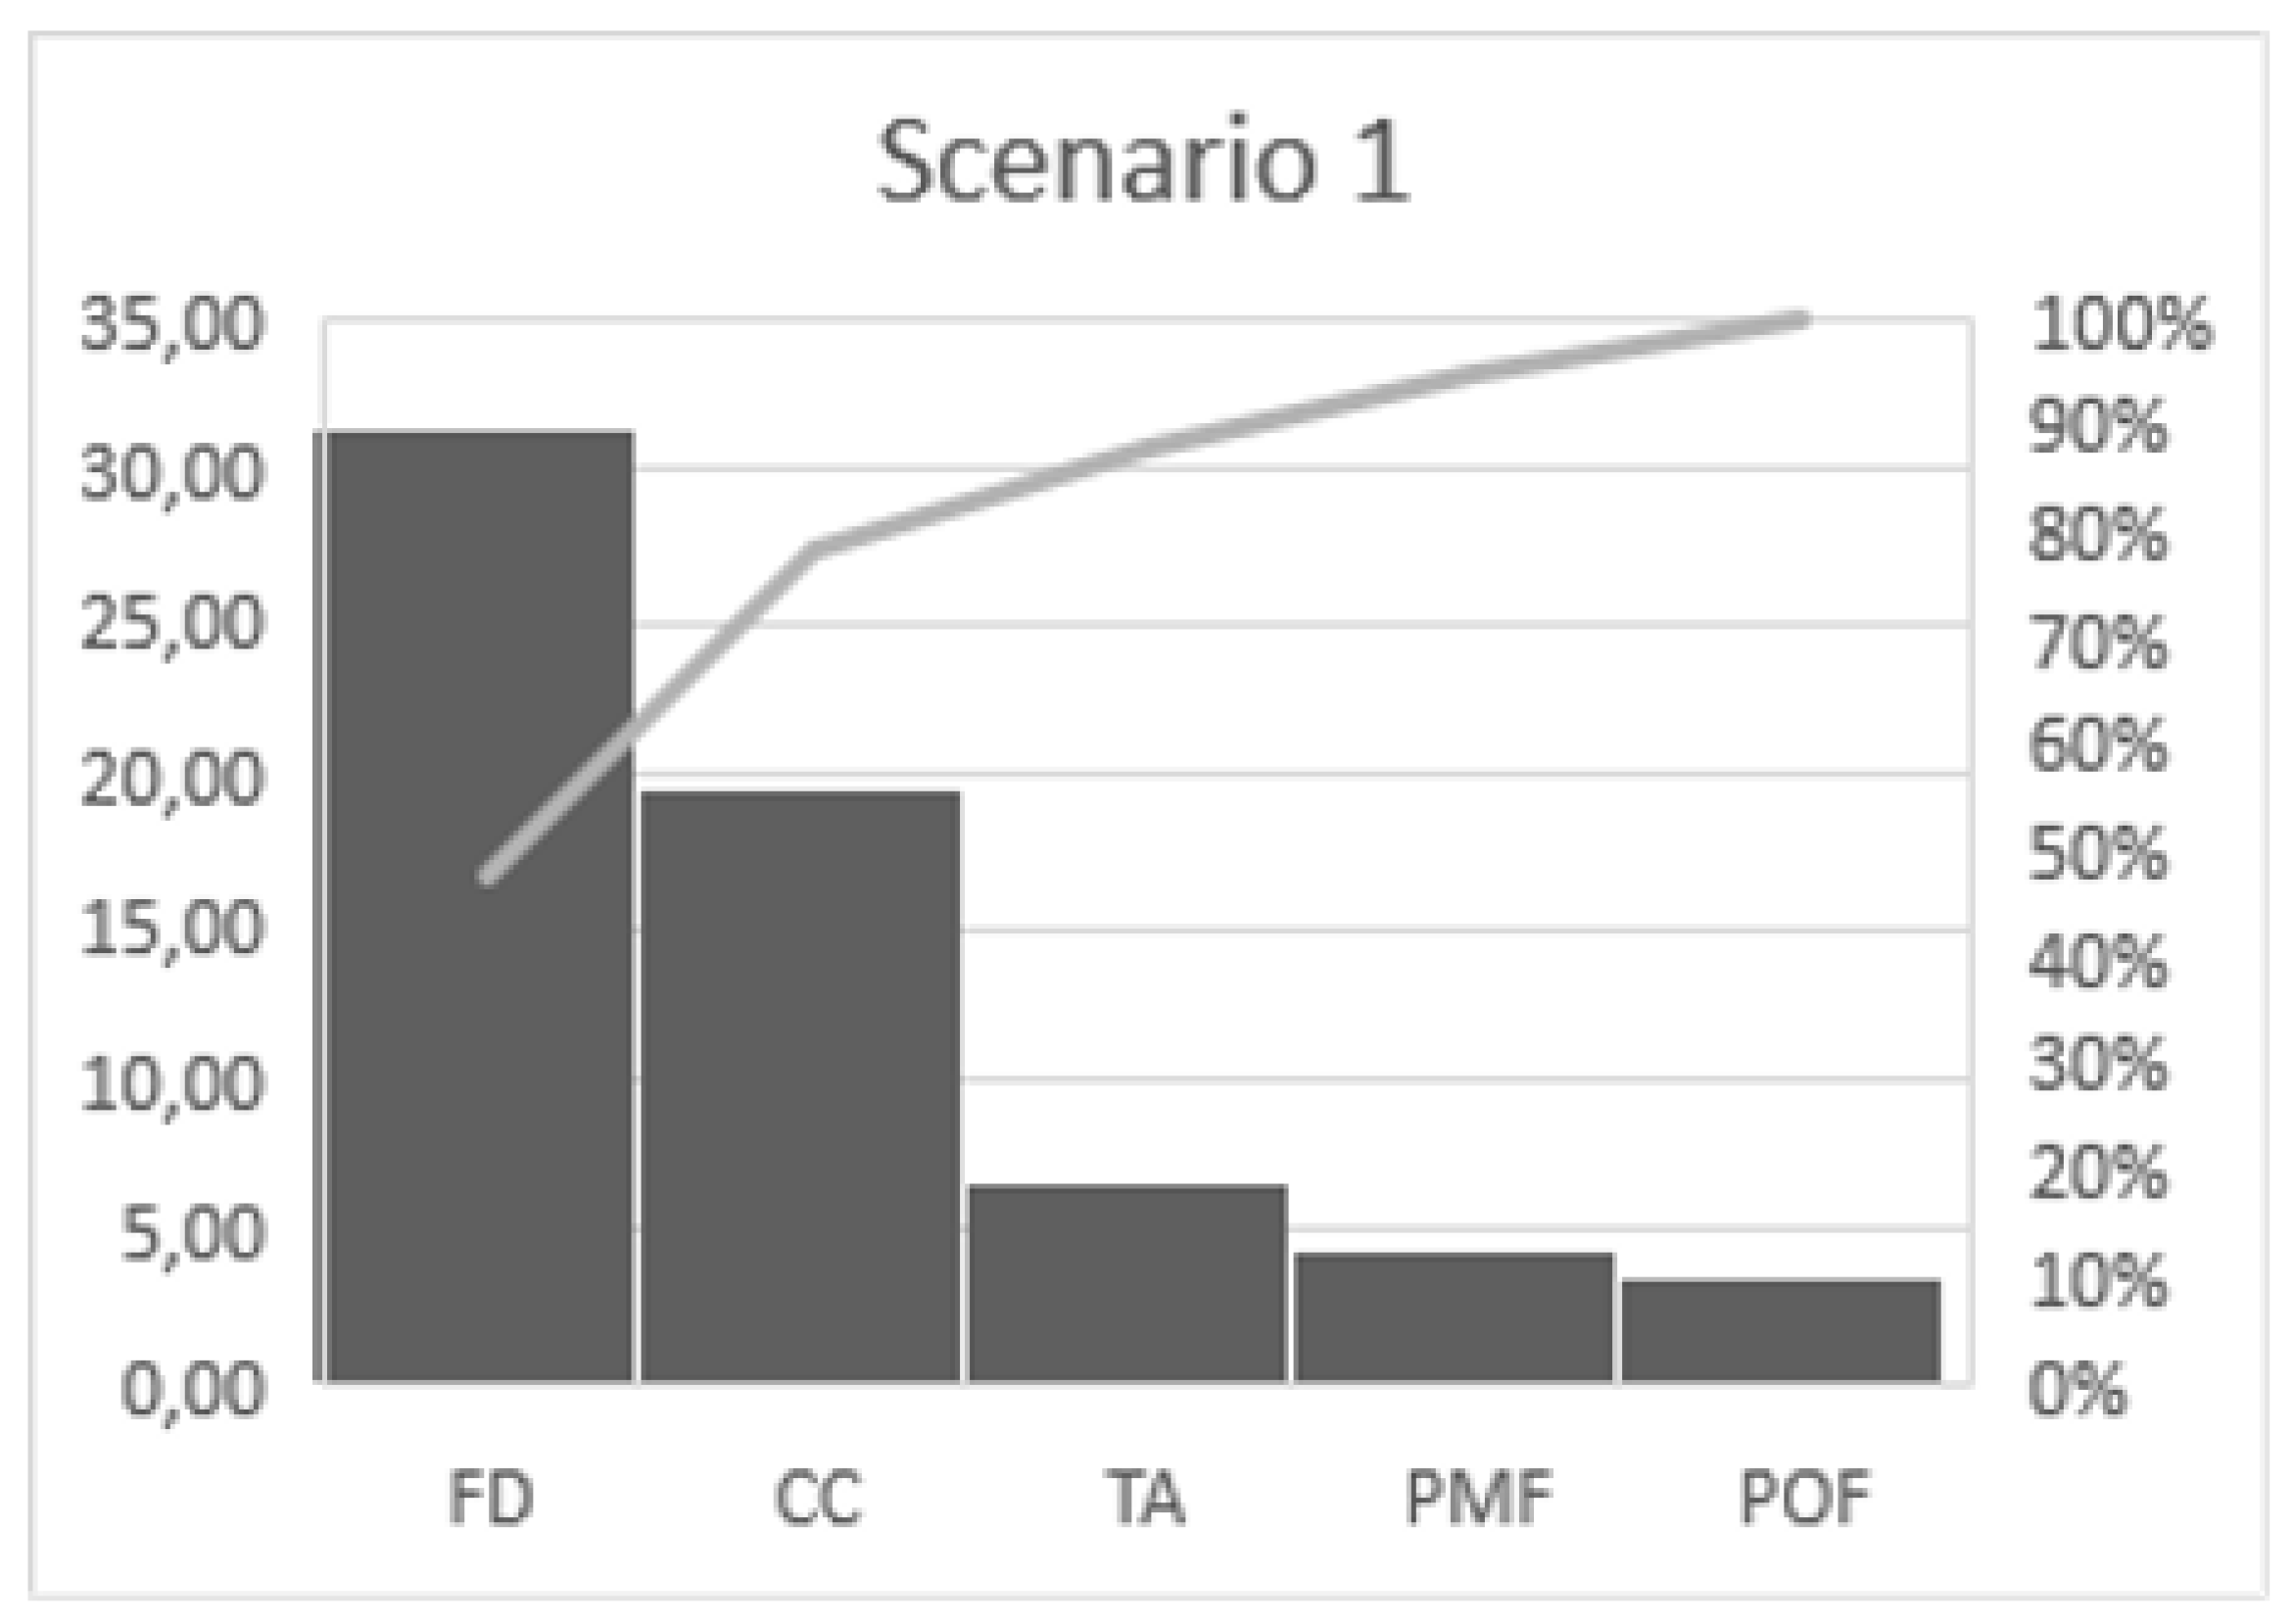
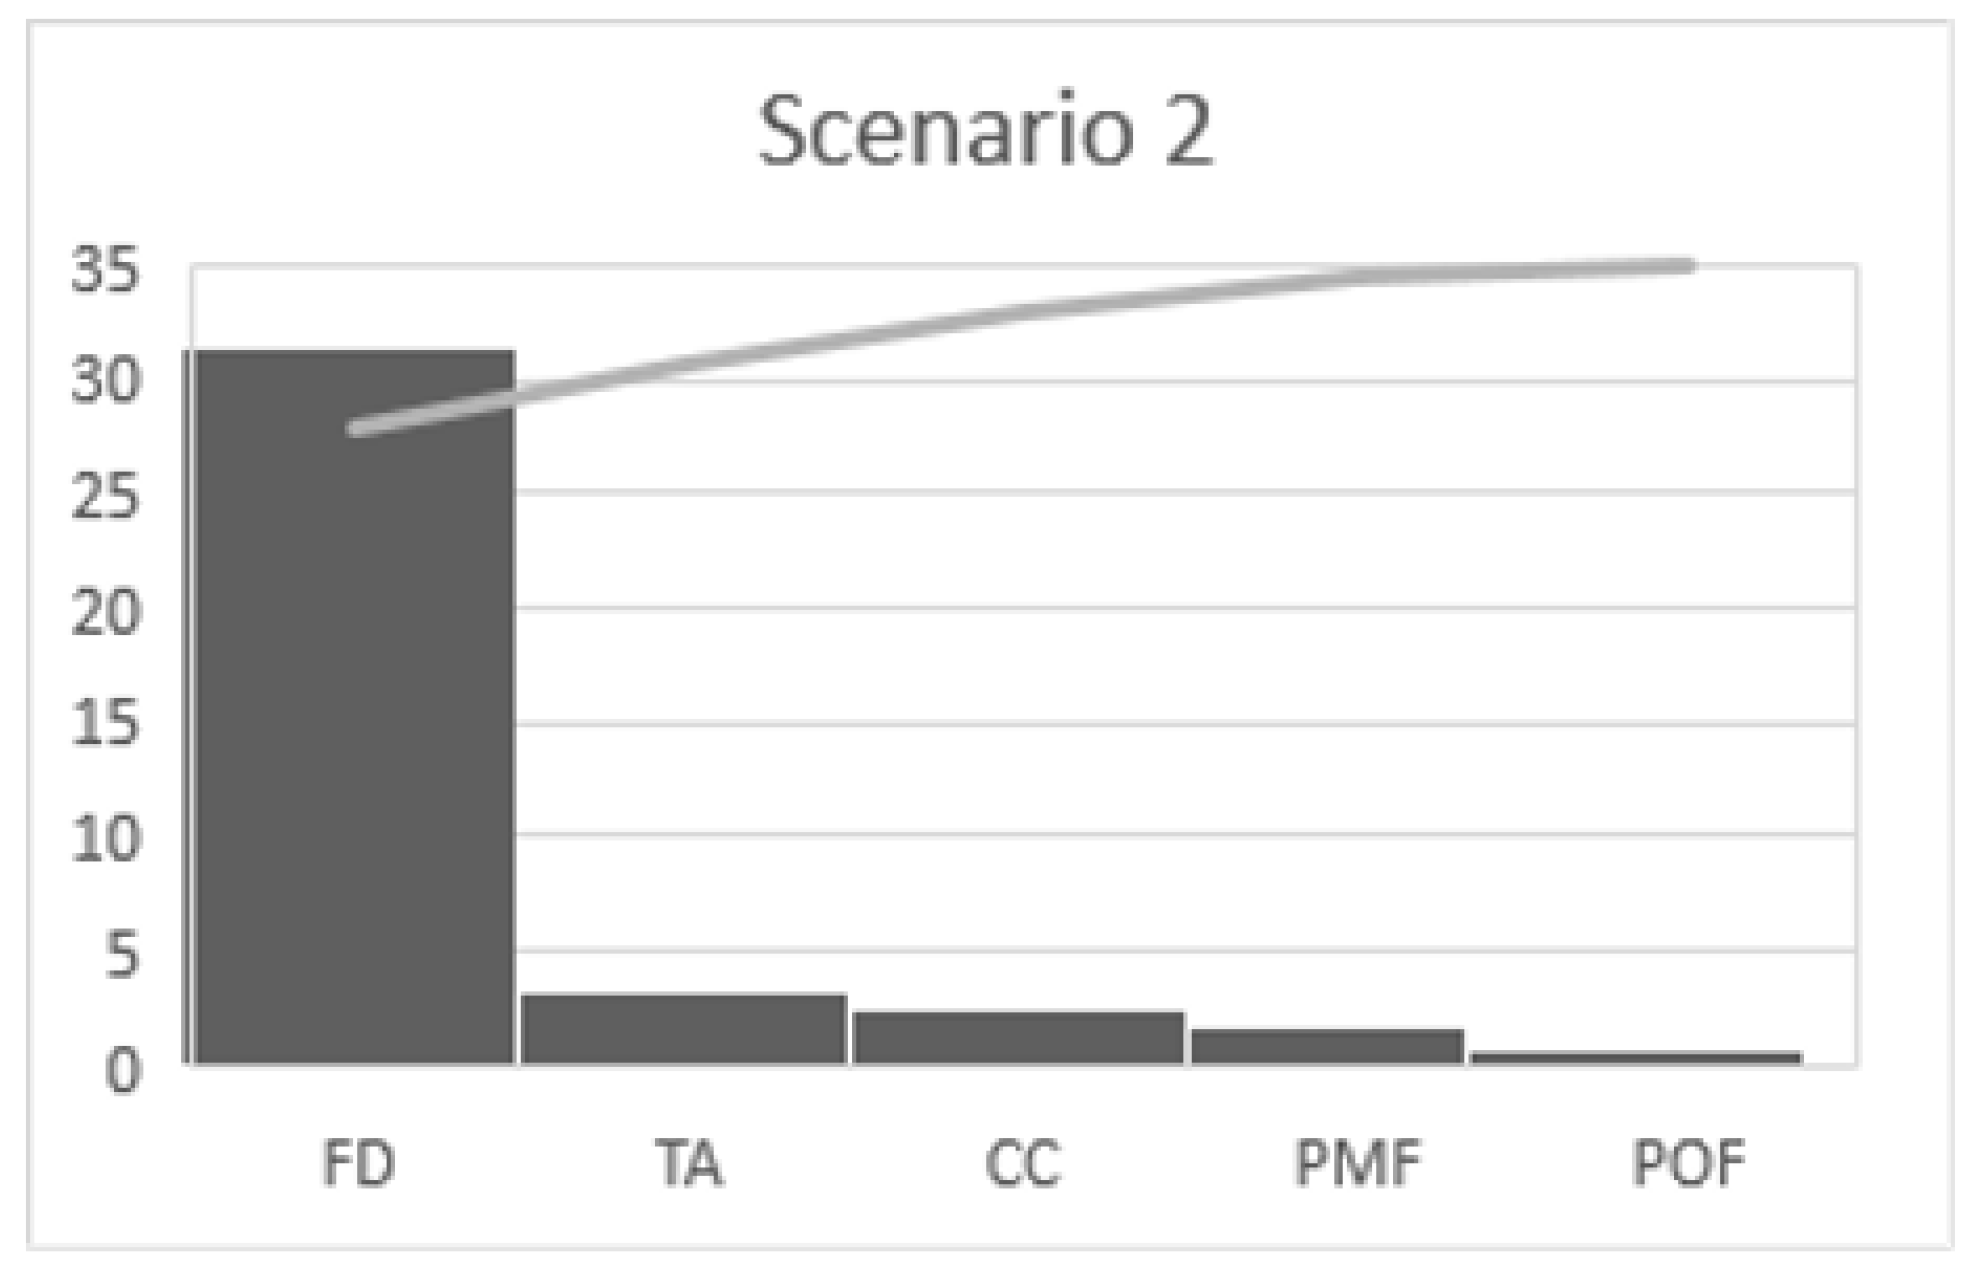
4.2. Pareto Analysis of the Scenarios and Processes
Environmental Impact Assessment of Activated Carbon Production
4.3. Economical Evaluation of the Payback Period of the Pilot CO2 Capture Unit
5. Discussion
6. Conclusions
Author Contributions
Funding
Acknowledgments
Conflicts of Interest
References
- European Association for Coal and Lignite. Eurocoal Statistics, Coal in Europe 2017. Available online: www.eurocoal.eu (accessed on 9 February 2019).
- Czech Statistical Office. Czech Republic in International Comparison—(Selected Indicators)-2017. Available online: www.czso.cz (accessed on 2 February 2019).
- Grant, T.; Anderson, C.; Hooper, B. Comparative Life Cycle Assessment of Potassium Carbonate and Monoethanolamine Solvents for CO2 Capture from Post Combustion Flue Gases. Int. J. Greenh. Gas Control 2014, 28, 35–44. [Google Scholar] [CrossRef]
- Manuilova, A.; Koiwanit, J.; Piewkhaow, L.; Wilson, M.; Chan, C.W.; Tontiwachwuthikul, P. Life Cycle Assessment of Post-Combustion CO2 Capture and CO2-Enhanced Oil Recovery Based on the Boundary Dam Integrated Carbon Capture and Storage Demonstration Project in Saskatchewan. Energy Procedia 2014, 63, 7398–7407. [Google Scholar] [CrossRef] [Green Version]
- Koornneef, J.; van Keulen, T.; Faaij, A.; Turkenburg, W. Life Cycle Assessment of a Pulverized Coal Power Plant with Post-Combustion Capture, Transport and Storage of CO2. Int. J. Greenh. Gas Control 2008, 2, 448–467. [Google Scholar] [CrossRef] [Green Version]
- Petrakopoulou, F.; Tsatsaronis, G. Can Carbon Dioxide Capture and Storage from Power Plants Reduce the Environmental Impact of Electricity Generation? Energy Fuels 2014, 28, 5327–5338. [Google Scholar] [CrossRef]
- Odeh, N.A.; Cockerill, T.T. Life Cycle GHG Assessment of Fossil Fuel Power Plants with Carbon Capture and Storage. Energy Policy 2008, 36, 367–380. [Google Scholar] [CrossRef]
- Singh, B.; Strømman, A.H.; Hertwich, E.G. Scenarios for the Environmental Impact of Fossil Fuel Power: Co-Benefits and Trade-Offs of Carbon Capture and Storage. Energy 2012, 45, 762–770. [Google Scholar] [CrossRef]
- Clarens, F.; Espí, J.J.; Giraldi, M.R.; Rovira, M.; Vega, L.F. Life Cycle Assessment of CaO Looping versus Amine-Based Absorption for Capturing CO2 in a Subcritical Coal Power Plant. Int. J. Greenh. Gas Control 2016, 46, 18–27. [Google Scholar] [CrossRef]
- Hjaila, K.; Baccar, R.; Sarrà, M.; Gasol, C.M.; Blánquez, P. Environmental Impact Associated with Activated Carbon Preparation from Olive-Waste Cake via Life Cycle Assessment. J. Environ. Manag. 2013, 130, 242–247. [Google Scholar] [CrossRef] [PubMed]
- Arena, N.; Lee, J.; Clift, R. Life Cycle Assessment of Activated Carbon Production from Coconut Shells. J. Clean. Prod. 2016, 125, 68–77. [Google Scholar] [CrossRef] [Green Version]
- Štefanica, J.; Smutná, J.; Kočí, V.; Macháč, P.; Pilař, L. Environmental Gains and Impacts of a CCS Technology—Case Study of Post-Combustion CO2 Separation by Ammonia Absorption. Energy Procedia 2016, 86, 215–218. [Google Scholar] [CrossRef] [Green Version]
- Zakuciová, K.; Lapao Rocha, J.; Koci, V. Life Cycle Assessment Overview of Carbon Capture and Storage Technologies. Annu. Int. Conf. Sustain. Energy Environ. Sci. 2016, 84–90. [Google Scholar] [CrossRef]
- Pilar, L.; Slouka, P.; Vlček, Z. Technical Report of Project TA02020205; ÚJV Řež, a.s., Řež: Husinec, Czech Republic, 2015. [Google Scholar]
- International Organization for Standardisation. IS/ISO 14044 (2006): Environmental Management-Life Cycle Assessment-Requirements and Guidelines; Bureau of Indian Standarts: New Delhi, India, 2006. [Google Scholar]
- Hauschild, M.Z.; Rosenbaum, R.K.; Olsen, S.I. Life Cycle Assessment, Theory and Practice; Springer International Publishing AG: Montpellier, France, 2018. [Google Scholar] [CrossRef]
- Goedkoop, M.; Heijungs, R.; Huijbregts, M.; De Schryver, A.; Struijs, J.; Van Zelm, R. ReCiPe 2008 First Edition (Version 1.08) Report I: Characterisation; Ministry of foreign Affairs: Rijnstraat, Netherlands, 2013.
- Jolliet, O.; Margni, M.; Charles, R.; Humbert, S.; Payet, J.; Rebitzer, G.; Rosenbaum, R. Presemmg a New Meth6d IMPACT 2002+: A New Life Cycle Impact Assessment Methodology. Int. J. Life Cycle Assess 2003, 8, 324–330. [Google Scholar] [CrossRef] [Green Version]
- Benini, L.; Mancini, L.; Sala, S.; Schau, E.; Manfredi, S.; Pant, R. Normalisation Method and Data for Environmental Footprints; Office of the European Union: Luxembourg, 2014; Volume 113. [Google Scholar] [CrossRef]
- Carvalho, A.; Mimoso, A.F.; Mendes, A.N.; Matos, H.A. From a Literature Review to a Framework for Environmental Process Impact Assessment Index. J. Clean. Prod. 2014, 64, 36–62. [Google Scholar] [CrossRef]
- Shen, L.; Patel, M.K. Lca Single Score Analysis of Man-Made Cellulose Fibres. Lenzing. Ber. 2010, 88, 7. [Google Scholar]
- CEZ Group. Power Plant Prunerov. Available online: www.cez.cz (accessed on 9 February 2018).
- Tzimas, E.; Georgakaki, A.; Peteves, S. Reducing CO2 Emissions from the European Power Generation Sector-Scenarios to 2050. Energy Procedia 2009, 1, 4007–4013. [Google Scholar] [CrossRef]
- Vávrová, J.; Štefanica, J.; Hájek, P.; Smejkalová, J. Technical Report of Project TA02020205; ÚJV Řež, a.s., Řež: Husinec, Czech Republic, 2013. [Google Scholar]
- Kantová, N.; Holubčík, M.; Jandačka, J.; Čaja, A. Comparison of Particulate Matters Properties from Combustion of Wood Biomass and Brown Coal. Procedia Eng. 2017, 192, 416–420. [Google Scholar] [CrossRef]
- Vassilev, S.V.; Vassileva, C.G.; Vassilev, V.S. Advantages and Disadvantages of Composition and Properties of Biomass in Comparison with Coal: An Overview. Fuel 2015, 158, 330–350. [Google Scholar] [CrossRef]
- Ministerstvo Zivotniho Prostredi České Republiky. Integrovany Registr Znecistovani. Available online: www.irz.cz (accessed on 8 February 2018).


| References | Scope | LCA Software and Database or Method | Significant LCA Impacts |
|---|---|---|---|
| Koornneef et al., 2008 | Comparative LCA study of SC-PC and SPC-PC power plants with and without CCS CO2 capture by MEA absorption | CML 2 baseline 2000 V2.03 SW EcoInvent database v1.3 | ADP, GWP, ODP, HTP, FAETP, MAETP, POP, AP, EP |
| Odeh and Cockerill, 2008 | Comparative LCA study of SPC-PC, NGCC, and IGCC power plants with and without CCS CO2 capture by MEA absorption | SimaPro SW EcoInvent | GWP |
| Singh et al., 2012 | Feasibility study of SC-PC and SPC-PC power plants with and without CO2 capture, FGD, and SCR. CO2 capture by MEA absorption | EcoIndicator 99 | According to EcoIndicator 99 |
| Hjaila et al., 2013 | LCA of AC production from olive waste cakes in Tunisia | Simapro SW CML 2 Baseline 2000 Ecoinvent v 2.2 database | AP, EP |
| Grant et al., 2014 | Comparative life cycle assessment of K2CO3 and MEA solvents for CO2 capture from post combustion flue gases | CML 2001 methodology Human and ecotoxicity based on USETox method | Potassium carbonate solvents improves TET, carcinogen emissions and energy consumption |
| Manuilova et al., 2014 | Case study, Boundary Dam Power Station CO2 capture by MEA absorption | Operational data by Cenovus Energy, Canadian provinces, USA and other countries | GWP, AP, EP, ODP, HTP, FAETP |
| Petrakopoulou and Tsatsaronis, 2014 | Comparative LCA study of PC and NGCC power plants with and without CCS CO2 capture by MEA absorption and chemical looping combustion | EcoIndicator 99 | According to EcoIndicator 99 |
| Clarens et al., 2016 | CaO looping vs. MEA based adsorption | ReCiPe Midpoint for Europe, v 1.04 | Reductions in GWP category for CaO looping (73%), conventional MEA (66%), advanced MEA (72%) |
| Arena et al., 2016 | LCA of activated carbon production from coconut shells | GaBi 6.0 software CML-2001databank Ecoinvent 3.0 | HTP, AP, GWP |
| Parameter | Value | Unit |
|---|---|---|
| Nominal power output | 250 | MW |
| Brown coal production | 214 | t/h |
| Yearly operation | 6300 | h |
| Electricity produced | 1424 | MWh/y |
| Wet flue gases | 766,045 | m3/h |
| Parameter | Value | Unit |
|---|---|---|
| Consumption of fresh activated carbon | 23 | kg/h |
| CO2 | 211 | t/h |
| NOx | 159 | kg/h |
| SO2 | 119 | kg/h |
| Waste heat | 222 | MWt |
| Total energy consumption for CO2 capture | 23.08 | MW |
| Consumption of cooling water | 9259 | t/h |
| NaOH consumption | 0.305 | t/h |
| Compound | Value | Unit |
|---|---|---|
| Na2SO3 | 235 | kg/h |
| Na2SO4 | 16.9 | kg/h |
| NaCl | 2.54 | kg/h |
| NaF | 6.67 | kg/h |
| NaNO2 | 119 | kg/h |
| NaNO3 | 147 | kg/h |
| Parameter | Value | Unit |
|---|---|---|
| SO2 | 68.6 | kg/h |
| NOx | 13.72 | kg/h |
| CO2 exhaust gas | 18.3 | t/h |
| Captured CO2 | 158 | t/h |
| Wastewater | 19.73 | t/h |
| Scenario 1 | Scenario 2 | |||||
|---|---|---|---|---|---|---|
| Environmental Impact Categories | Values in Category Units | ReCiPe 1.08, Mid-point Normalization, Europe, excl biogenic carbon | Relative Contribution in % | Values in Category Units | ReCiPe 1.08, Mid-point Normalization, Europe, excl biogenic carbon | Relative Contribution in % |
| ALO (m2a) | 473 | 0.11 | 0.16 | 473 | 0.11 | 0.26 |
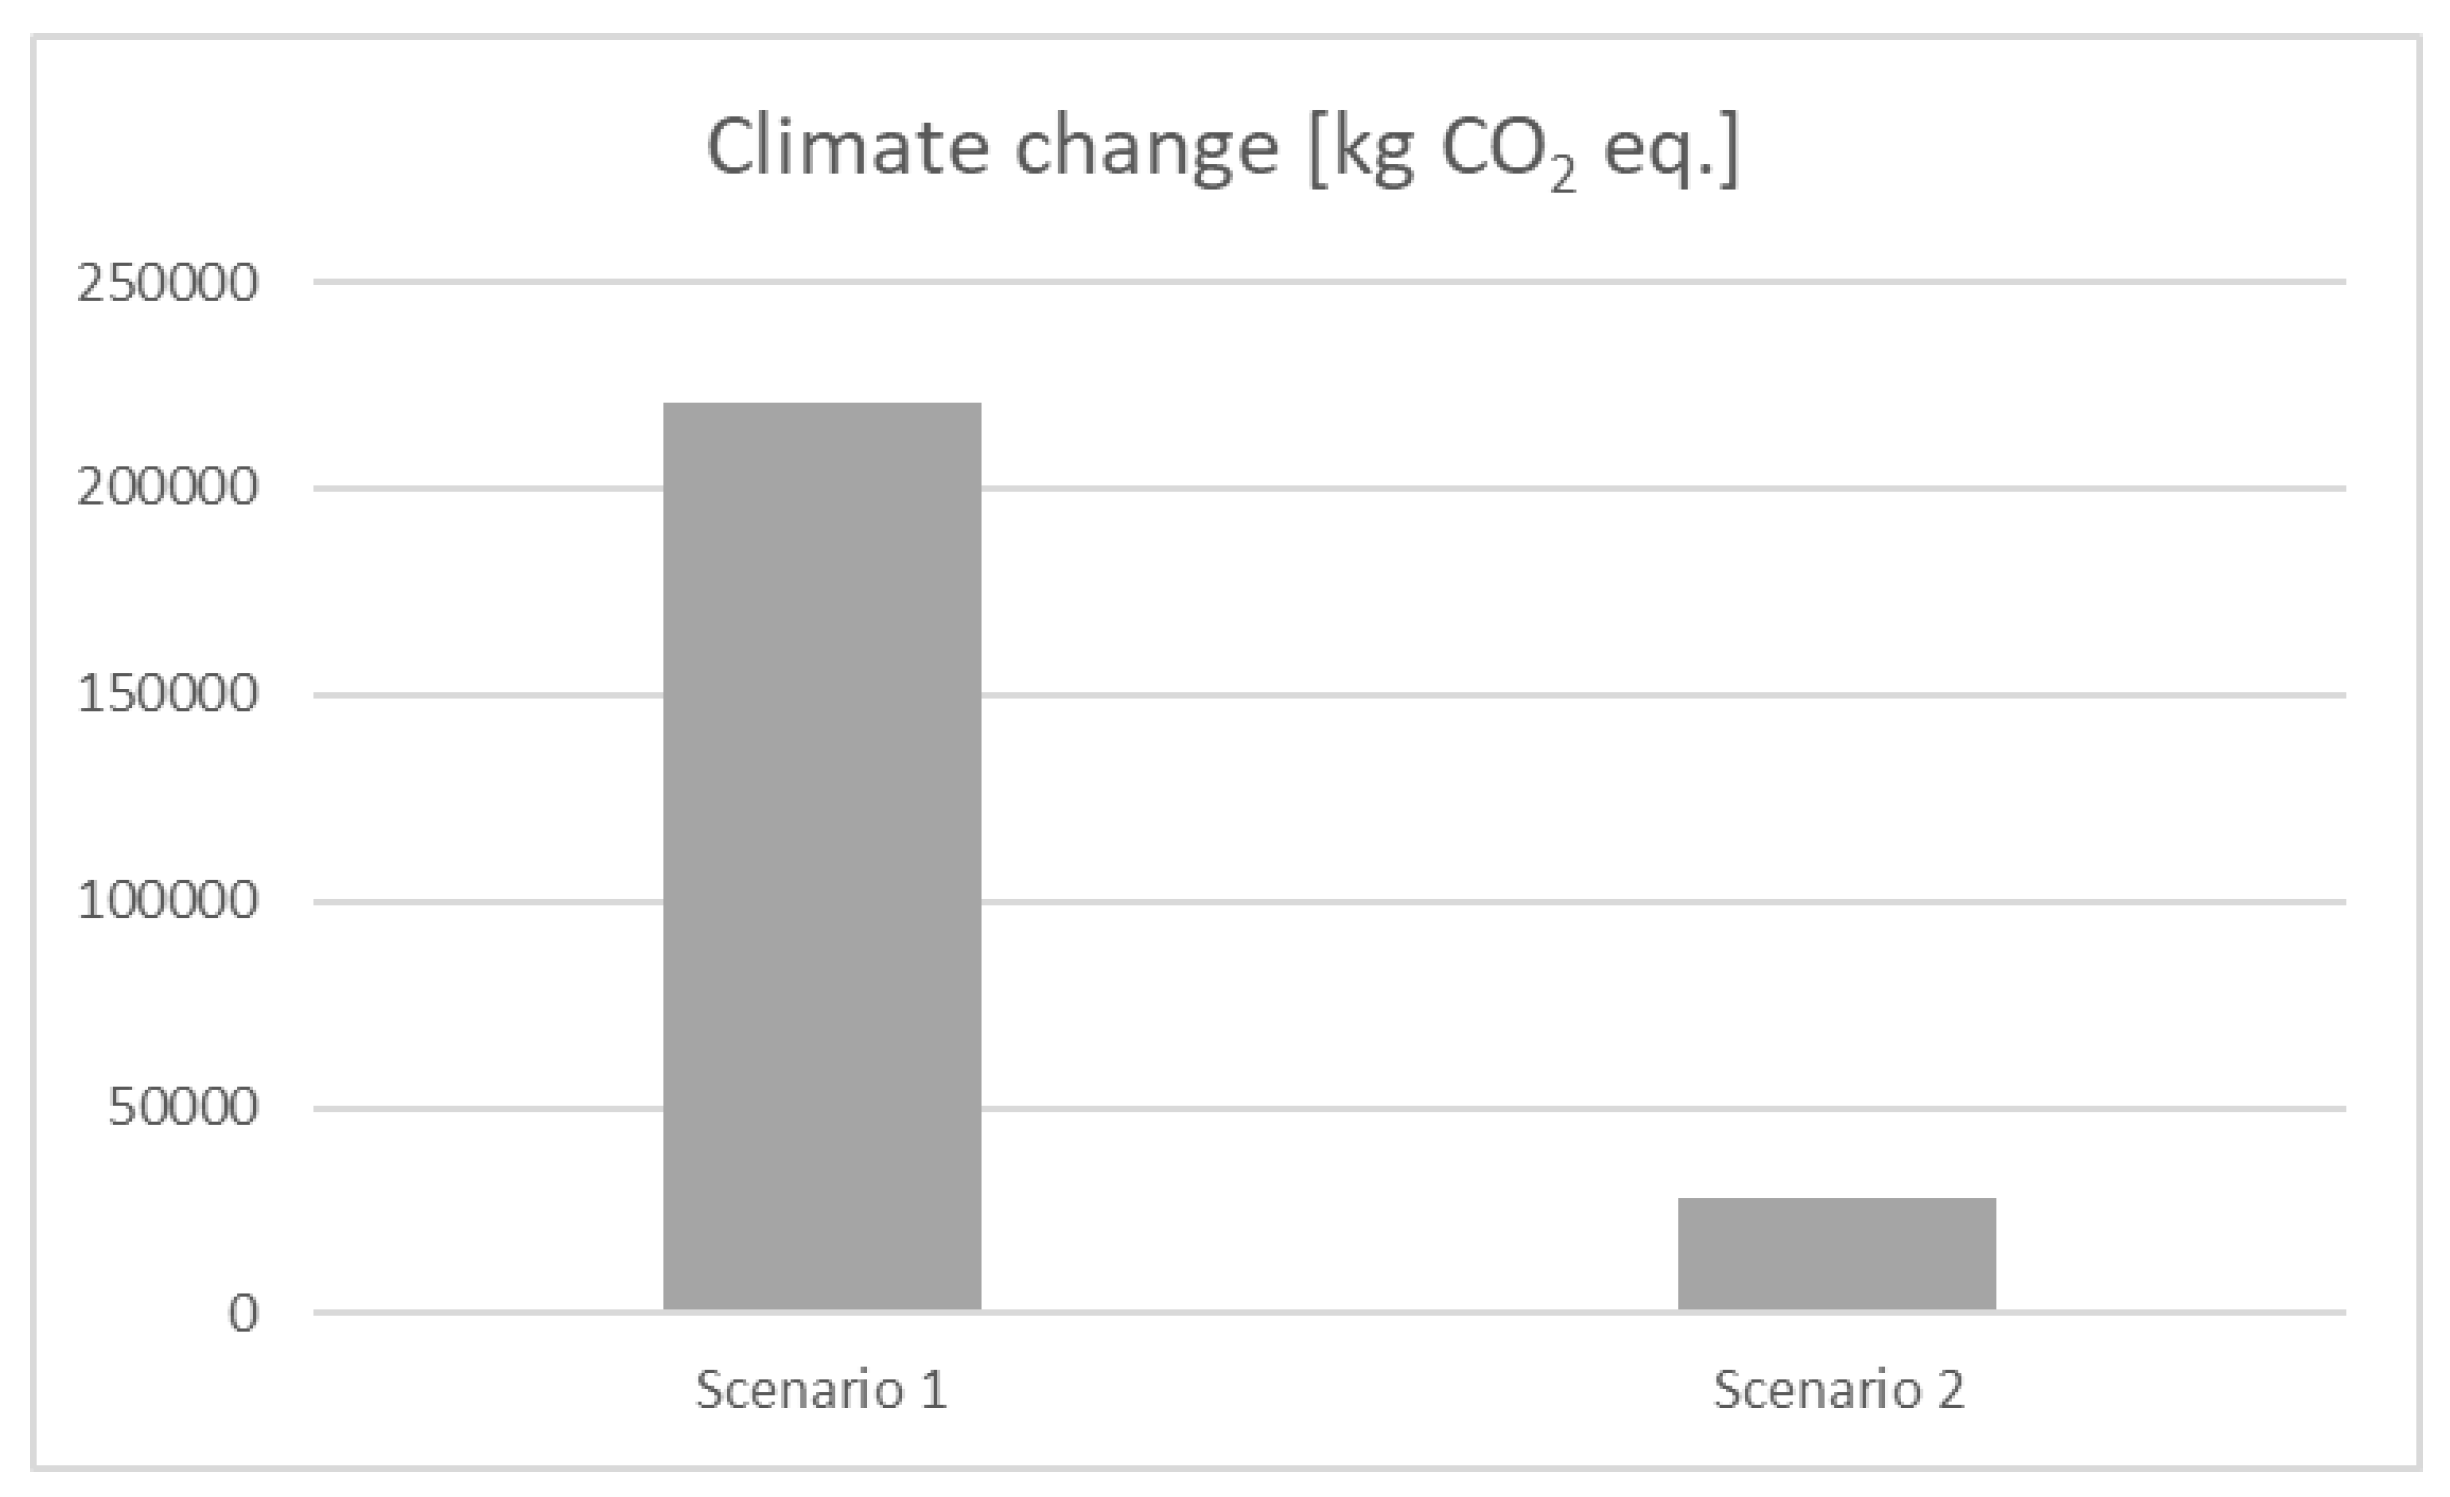
| CC, excl biogenic carbon (kg CO2 eq.) | 221,000 | 19.70 | 29.27 | 28,000 | 2.50 | 6.14 |
| FD (kg oil eq.) | 49,100 | 31.50 | 46.81 | 49,100 | 31.50 | 77.41 |
| FET (kg 1,4-DB eq.) | 1.24 | 0.11 | 0.17 | 1.25 | 0.12 | 0.28 |
| FE (kg P eq.) | 0.023 | 0.05 | 0.08 | 0.02 | 0.05 | 0.13 |
| HT (kg 1,4-DB eq.) | 171 | 0.29 | 0.43 | 171 | 0.29 | 0.71 |
| IR (U235 eq.) | 314 | 0.05 | 0.07 | 314 | 0.05 | 0.12 |
| MET (kg 1,4-DB eq.) | 1.46 | 0.17 | 0.26 | 1.46 | 0.17 | 0.42 |
| ME (kg N eq.) | 7.83 | 0.78 | I.15 | 2.18 | 0.22 | 0.53 |
| MD (kg Fe eq.) | 16.20 | 0.02 | 0.03 | 16.20 | 0.02 | 0.06 |
| NLT (m2) | 0.014 | 0.09 | 0.13 | 0.01 | 0.09 | 0.21 |
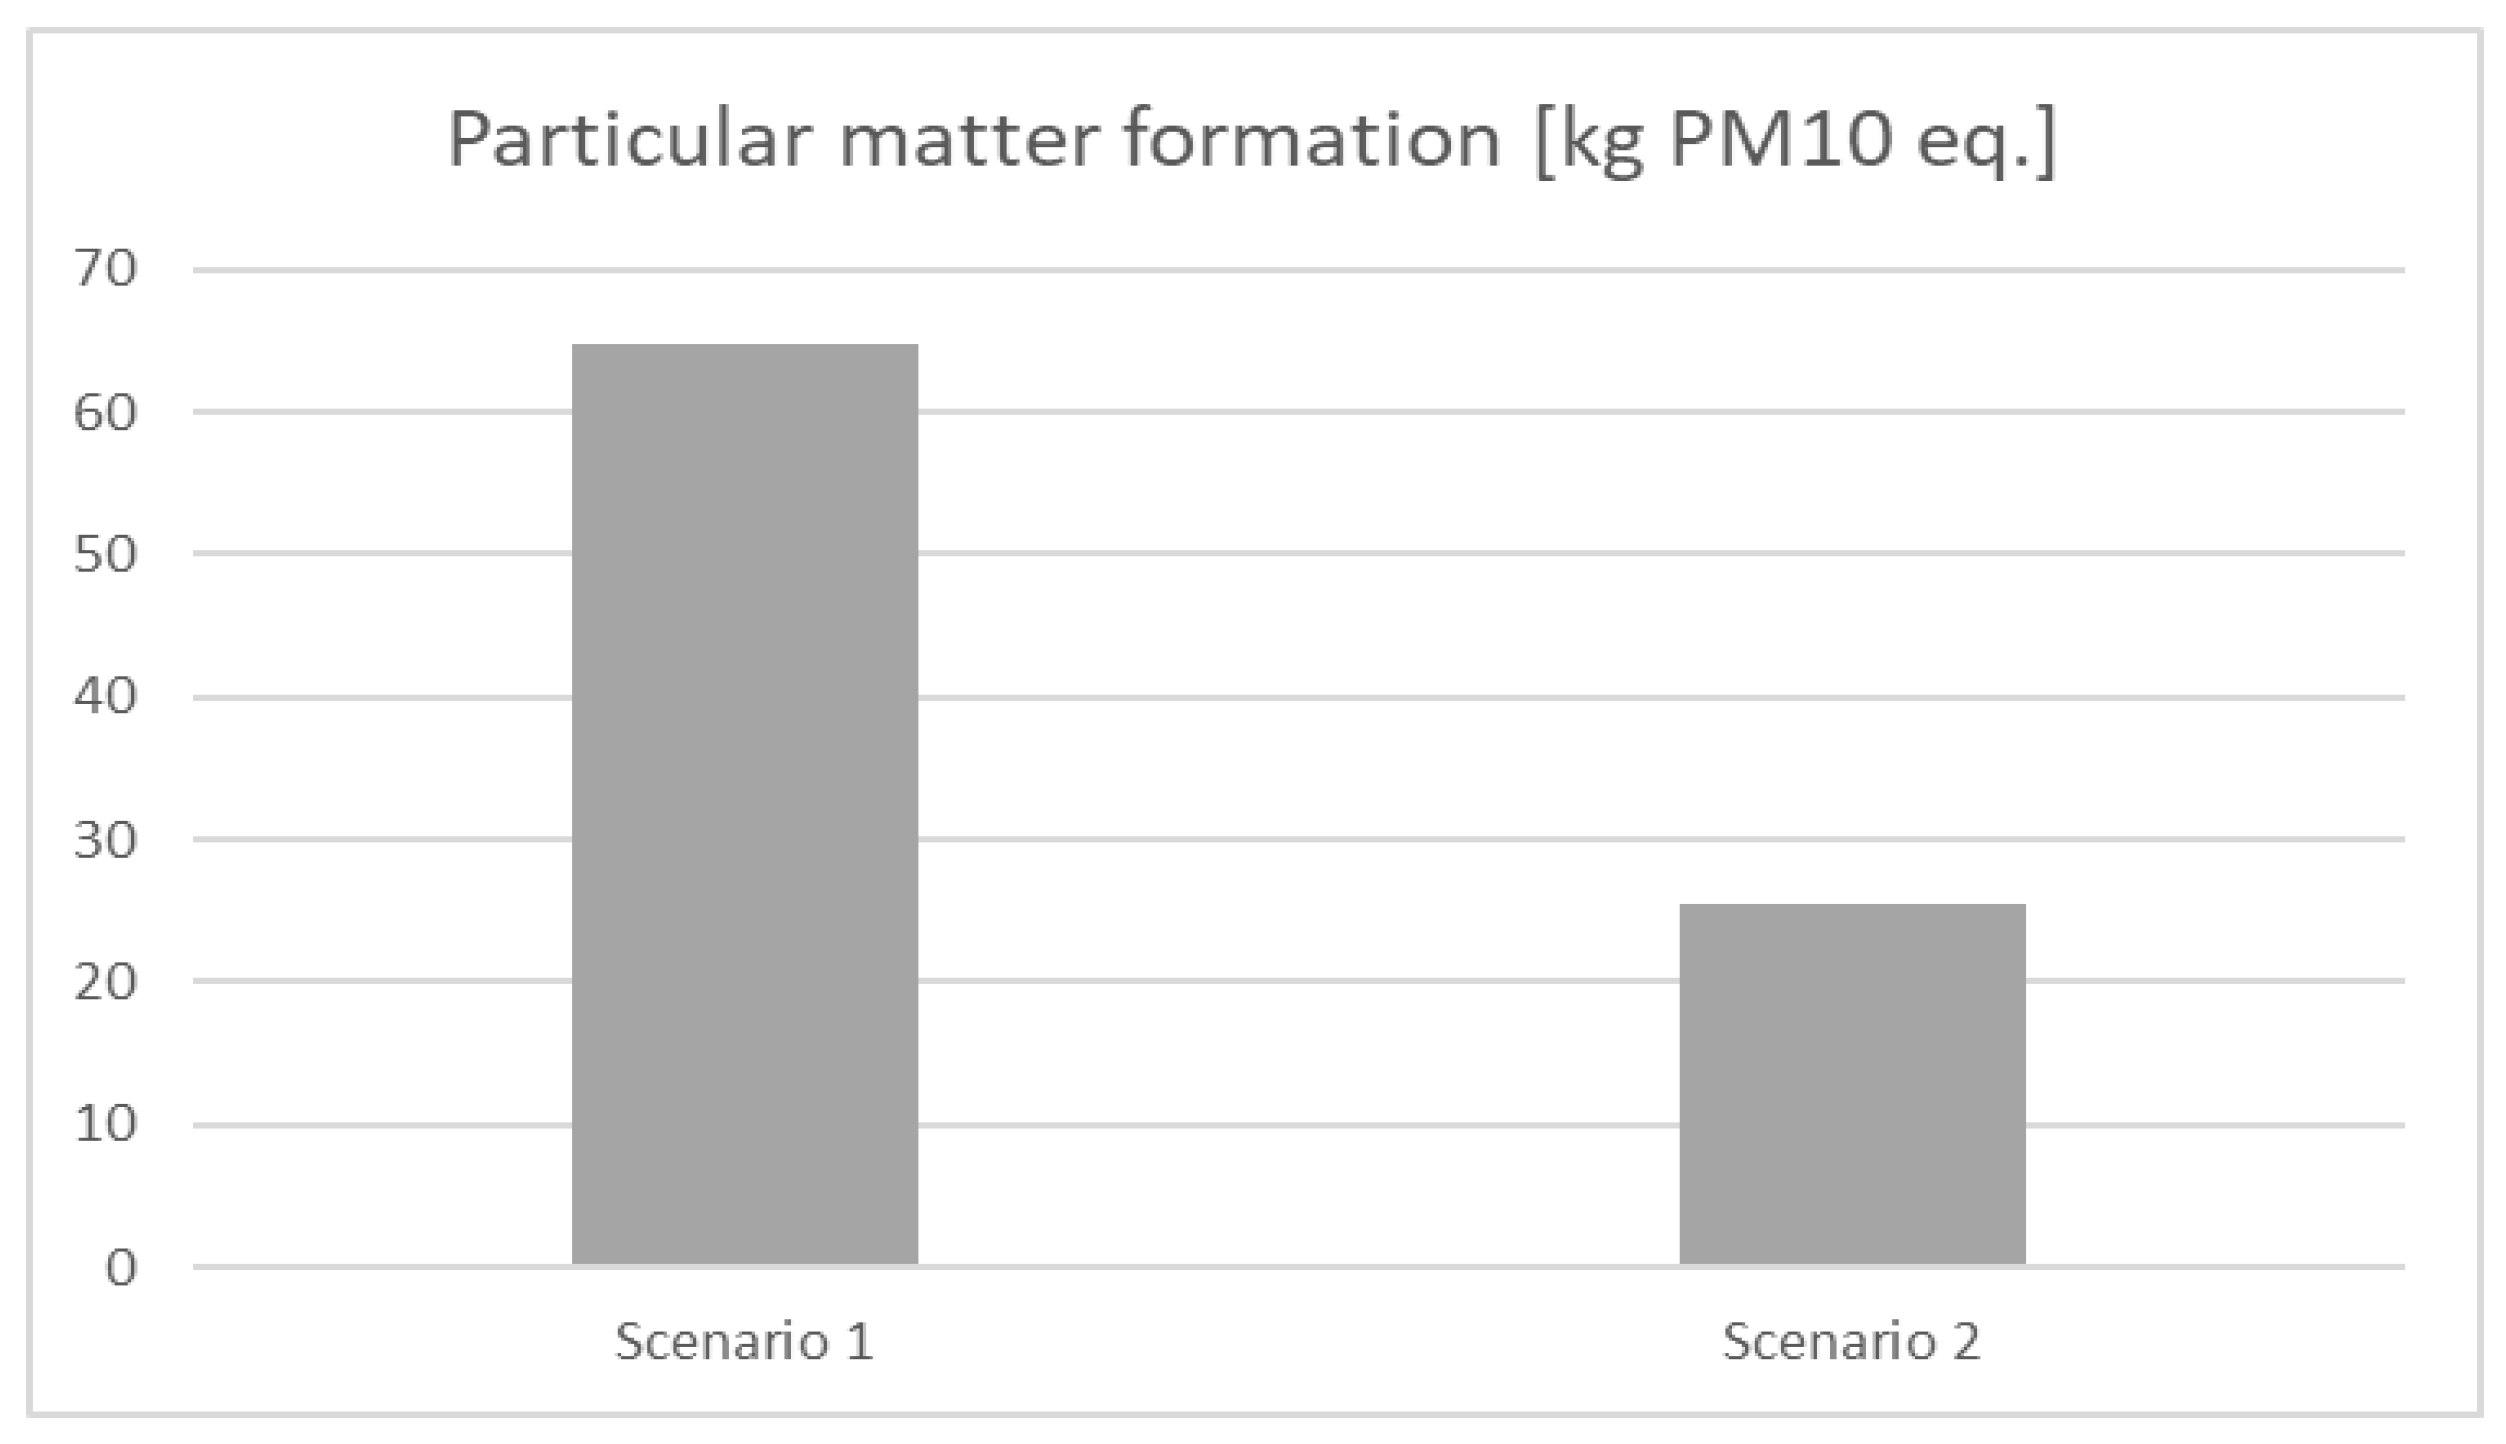
| PMF (kg PM10 eq.) | 64.70 | 4.34 | 6.45 | 25.40 | 1.71 | 4.20 |
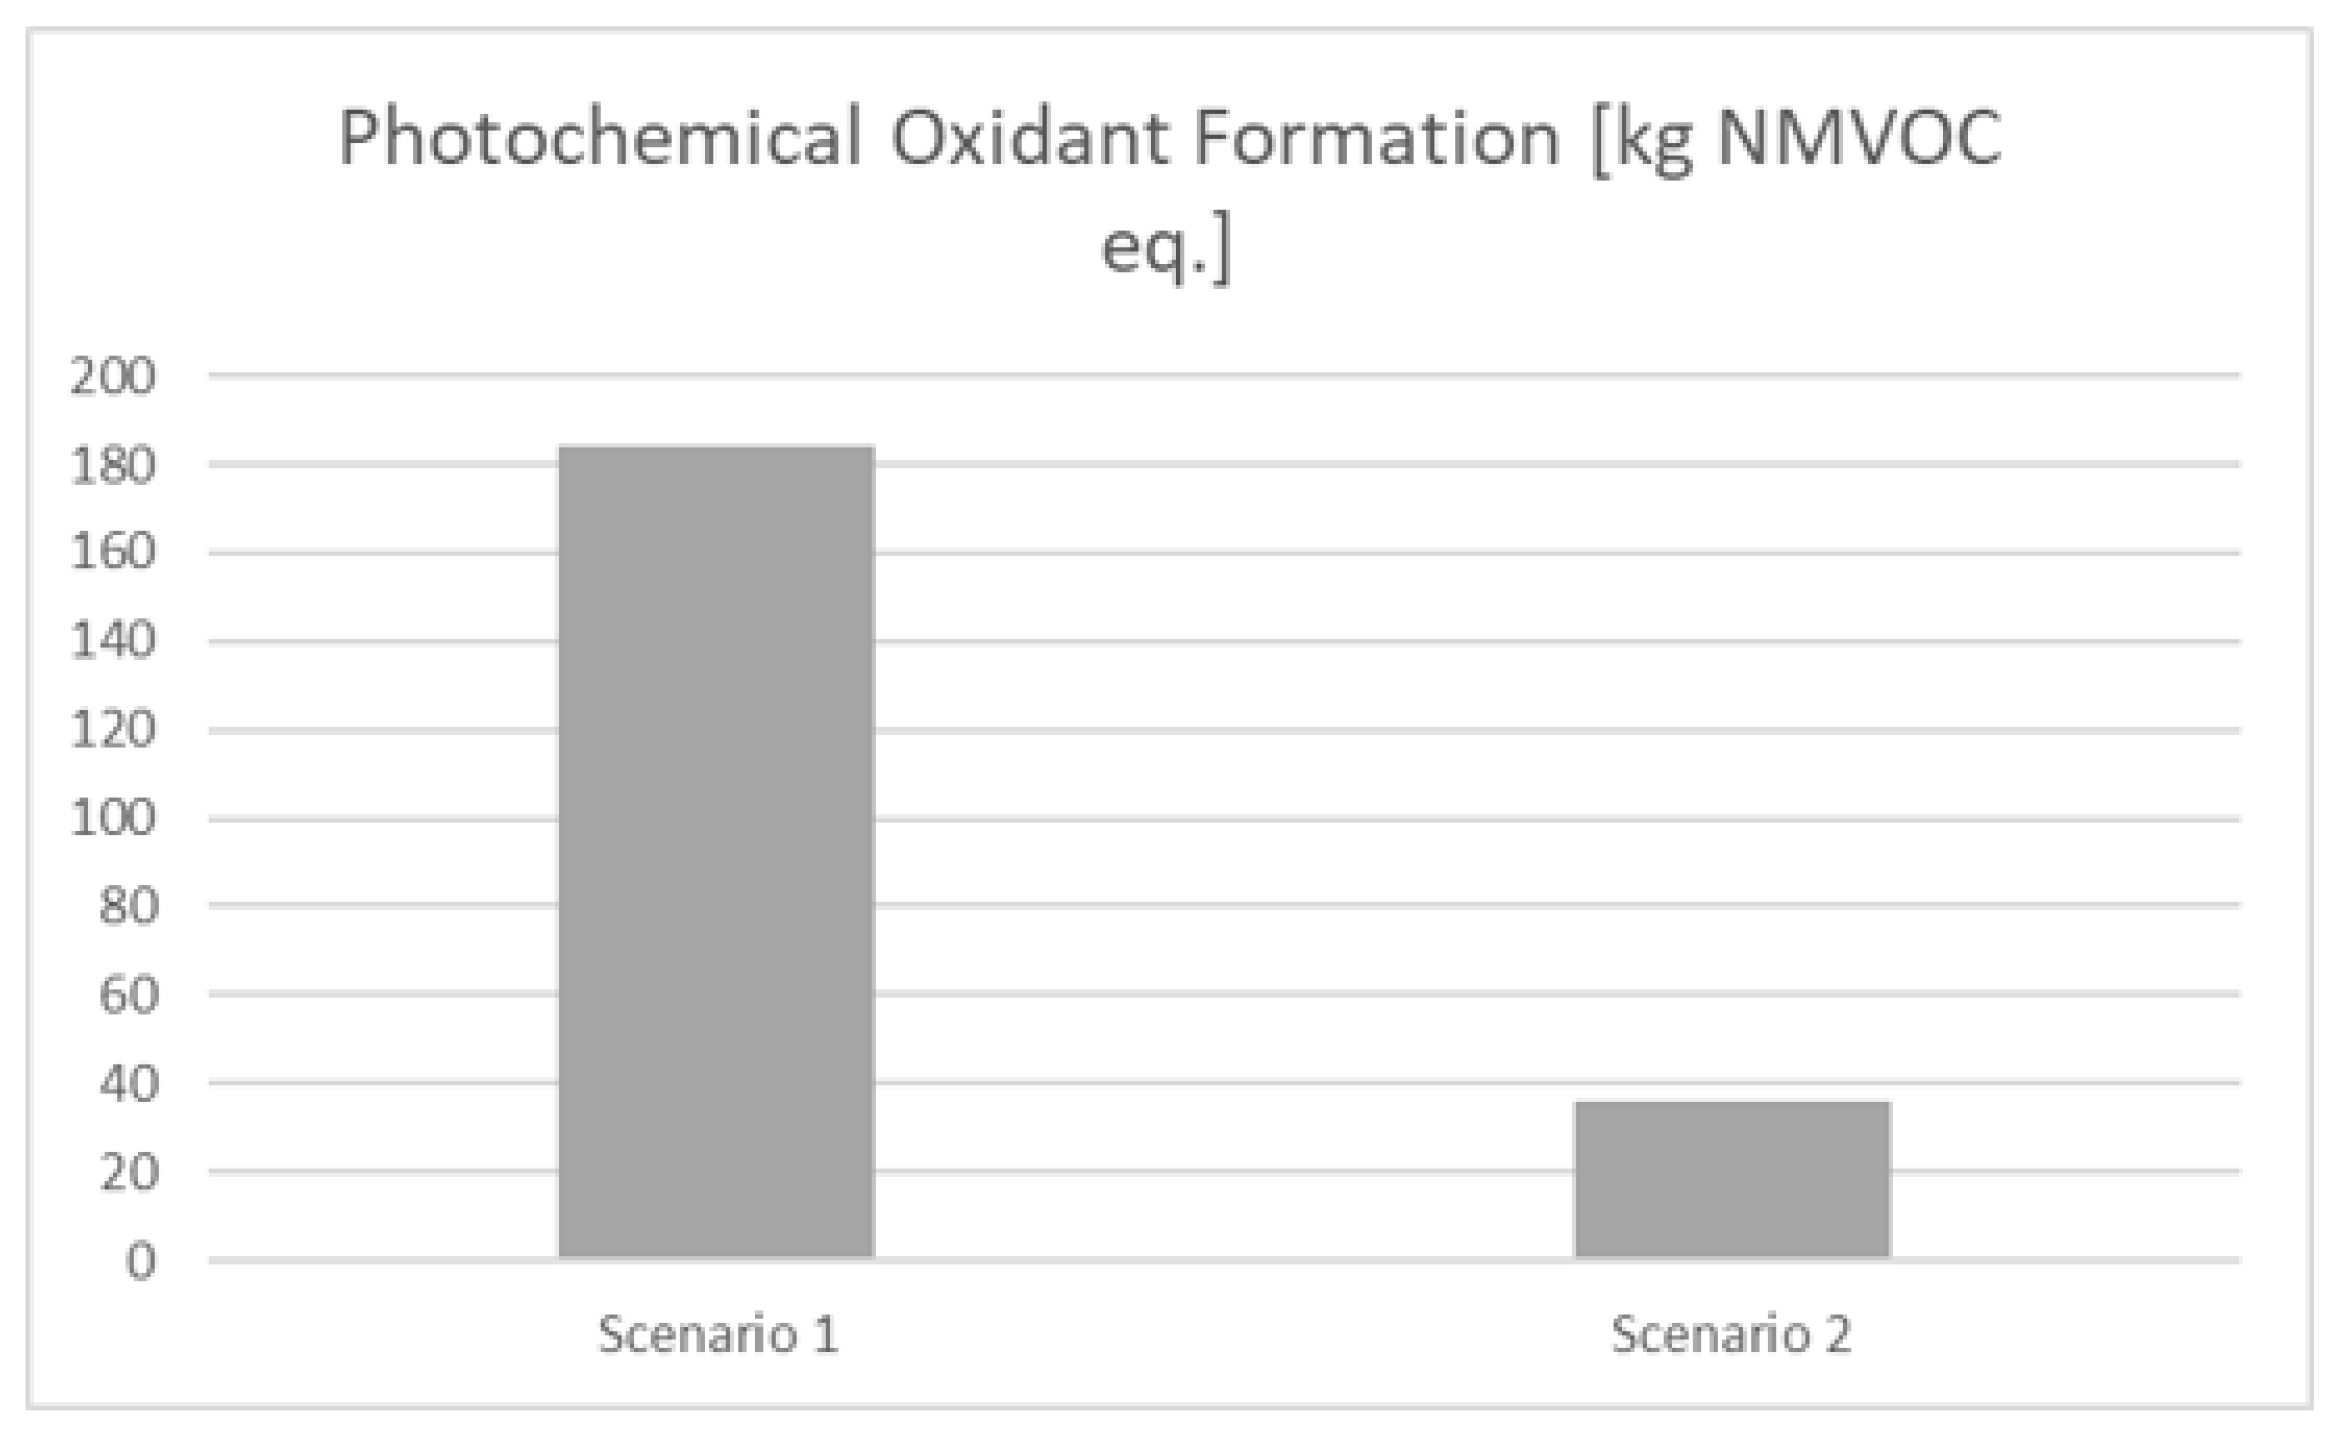
| POF (kg NMVOC eq.) | 184 | 3.47 | 5.16 | 36.30 | 0.68 | 1.68 |
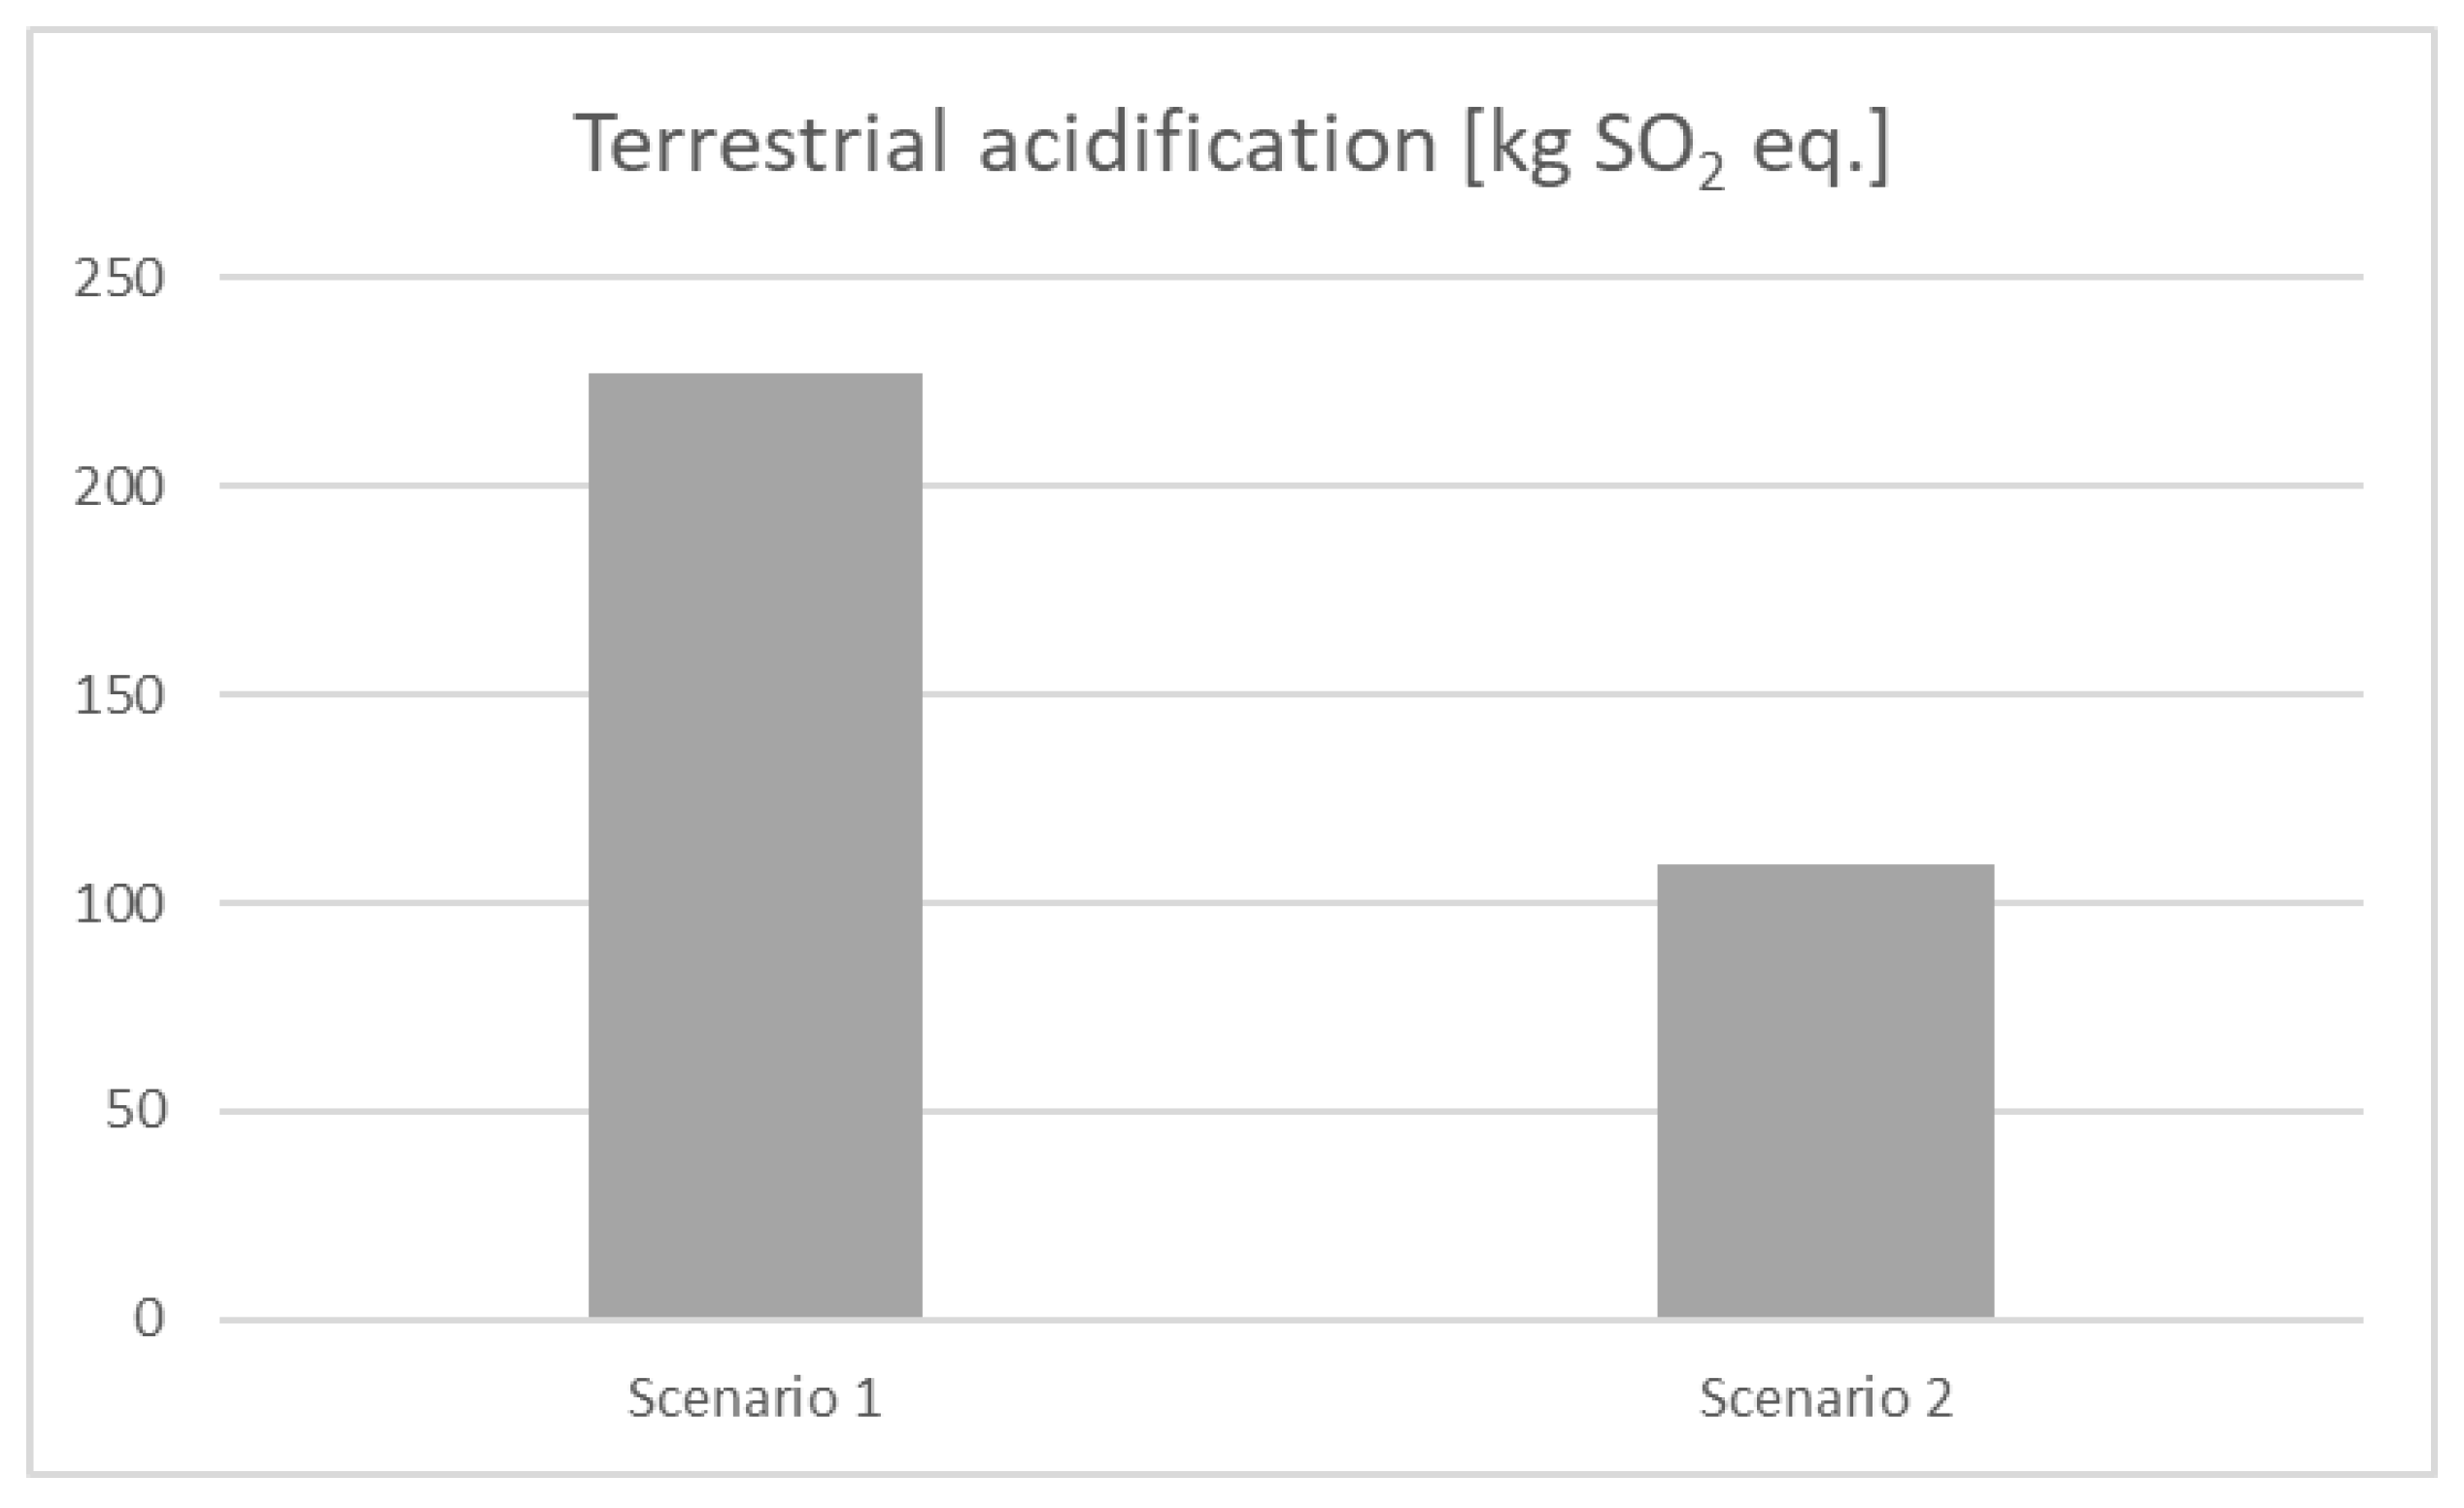
| TA (kg SO2 eq.) | 227 | 6.61 | 9.82 | 109 | 3.18 | 7.81 |
| TET (kg 1,4-DB eq.) | 0.075 | 0.01 | 0.01 | 0.07 | 0.01 | 0.02 |
| ULO (m2a) | 0.016 | 0.00 | 0.00 | 0.02 | 0.00 | 0.00 |
| WD (m3) | 6390 | 0.00 | 0.00 | 6400 | 0.00 | 0.00 |
| Sum | - | 67.30 | 100 | - | 40.69 | 100 |
| Scenario 2 | Brown Coal Mining | Transport | CO2 Adsorption Process | Thermal Energy for Adsorption Process |
|---|---|---|---|---|
| Terrestrial acidification (kg SO2 eq.) | 15.6 | 3.68 | 82.3 | 7.68 |
| Brown Coal Mining | Transport | NaOH Production | Water Consumption | |
| Fossil depletion (t oil eq.) | 48.10 | 1.03 | 0.28 | 0.59 |
| Environmental Impact Categories | Values in Category Units | Relative Contribution in % |
|---|---|---|
| Climate change (kg CO2 eq.) | 6.98 | 98.46 |
| Fossil depletion (kg oil eq.) | 0.107 | 1.51 |
| Water depletion (m3) | 0.002 | 0.03 |
| Cost Estimation for Commercial CCU Unit in EURO | |
|---|---|
| 4x reactor | 40,000 |
| Fittings | 24,000 |
| Measure appliances | 14,000 |
| CO2 tank (pressurized) | 20,000 |
| Electro + regulations | 12,000 |
| CO2 compression | 6000 |
| Ventilators | 4000 |
| Project | 24,000 |
| Cooling | 8000 |
| Heating (steam transport) | 6000 |
| Others + non predictable | 32,000 |
| Construction | 40,000 |
| Capital expenditure | 434,000 |
| New technology x1,7 | 737,800 |
| Expenditures | 737,800 | EUR |
| Operational costs | 36,890 | EUR |
| Captured CO2 | 1200 | t |
| Cost of CO2 allowance | 25 | EUR/t |
| Market price of CO2 produced | 120 | EUR/t |
| Income | 174,000 | EUR |
| Payback period | 5.38 | years |
© 2020 by the authors. Licensee MDPI, Basel, Switzerland. This article is an open access article distributed under the terms and conditions of the Creative Commons Attribution (CC BY) license (http://creativecommons.org/licenses/by/4.0/).
Share and Cite
Zakuciová, K.; Štefanica, J.; Carvalho, A.; Kočí, V. Environmental Assessment of a Coal Power Plant with Carbon Dioxide Capture System Based on the Activated Carbon Adsorption Process: A Case Study of the Czech Republic. Energies 2020, 13, 2251. https://doi.org/10.3390/en13092251
Zakuciová K, Štefanica J, Carvalho A, Kočí V. Environmental Assessment of a Coal Power Plant with Carbon Dioxide Capture System Based on the Activated Carbon Adsorption Process: A Case Study of the Czech Republic. Energies. 2020; 13(9):2251. https://doi.org/10.3390/en13092251
Chicago/Turabian StyleZakuciová, Kristína, Jiří Štefanica, Ana Carvalho, and Vladimír Kočí. 2020. "Environmental Assessment of a Coal Power Plant with Carbon Dioxide Capture System Based on the Activated Carbon Adsorption Process: A Case Study of the Czech Republic" Energies 13, no. 9: 2251. https://doi.org/10.3390/en13092251