Abstract
Building energy savings and occupant thermal comfort are the main issues in building technology. As such, the development of energy-efficient heating, ventilation, and air-conditioning (HVAC) systems and the control strategies of HVAC systems are emerging as important topics in the HVAC industry. Variable refrigerant flow (VRF) systems have efficient energy performance, so the use of VRF systems in buildings is increasing. However, most studies on VRF systems focus on improving mechanical efficiency, with few studies on energy-efficient control while satisfying the thermal comfort of occupants. The goal is to estimate the energy-saving potential of adjusting the temperature set-points and dead-band (range) in VRF air-conditioned building. To do so, we analyzed the influence of control strategies of a VRF system on human thermal comfort and energy consumption using a simulation method. The results showed that energy consumption can be reduced by 25.4% for predicted mean vote (PMV)-based control and 27.0% for the American Society of Heating, Refrigerating and Air-Conditioning Engineers (ASHRAE) comfort range control compared with the typical set-point temperature control of a VRF system. The indoor thermal environments of the analyzed control strategies are controlled in the thermal comfort range, which is based on a PMV at ±0.5. Compared with the typical set-point control, PMV and ASHRAE comfort range-based control reduced the operation time of the compressor in the VRF system.
1. Introduction
In 2018, about 40% of the total US energy consumption was consumed by the residential and commercial sectors, which was mostly building-related [1]. As of 2018, heating, ventilation, and air-conditioning (HVAC) energy demand constituted 30% of commercial and 39% of residential building primary energy consumption by end use in the US [2]. In Europe, space heating and cooling energy demand is around 64% in residential buildings and around 53% in commercial buildings [3]. Increased building stock and reliance on the HVAC systems have led to a significant increase in building energy usage in the world. Also, the growing demand for better thermal comfort requirements of occupants has resulted in increased HVAC energy consumption [4]. Developing energy-efficient HVAC systems is essential to preserve both consumers from increasing power rates and the adverse environmental effects of greenhouse gas emissions due to the use of energy-inefficient HVAC appliances. There are several methods to implement efficient HVAC systems with the rapid change of technology [5]. In addition, the development of HVAC system control that changes according to environmental conditions will minimize the energy load of the building [6,7,8,9,10]. The combination of the energy-efficient HVAC systems and the optimal control method for that system can achieve an optimized balance between energy usage and thermal comfort [6].
Variable refrigerant flow (VRF) systems are known to have high energy efficiency among HVAC system types for space heating and cooling in buildings. VRF systems were first introduced in Japan in the 1980s, and they became popular in many countries. The technology of VRF systems gradually expanded its market presence, reaching European markets in 1987 [11]. Currently, VRF systems have become one of the most widely used systems in commercial buildings in the US [12]. The American National Standards Institute (ANSI)/Air-Conditioning, Heating, and Refrigeration Institute (AHRI) released a standard of performance rating for VRF systems in 2010, which encouraged a gradual expansion of VRF systems in US markets [13].
In retrofit situations for HVAC systems, a VRF system can be an ideal application for ductless systems because it can minimize additional ductwork compared to ducted systems [14]. The multi-split VRF system consumes less energy than the typical air-conditioning systems such as constant air volume (CAV), variable air volume (VAV), and fan-coil unit (FCU) plus fresh air in the cooling season. Furthermore, since the VRF systems can be individually controlled or zone controlled, they provide better thermal comfort compared to other typical systems [15]. VRF systems showed energy saving of about 40–53% compared to the VAV systems depending on the set-point temperature value and control mode [16,17].
Conventional air-conditioning systems are generally used as a controlled parameter of air temperature, which is determined by design criteria at the design stage and has a specified range [18]. A VRF system can use electronic expansion valves (EEVs) and variable-speed drive (VSD) compressors for precise control of the system [19]. The VSD compressor can evaluate the deviation between the load and system capacity to linearly regulate the refrigerant flow rate so that it provides control flexibility and accurate system capacity control [20]. The coefficient of performance (COP) of the multi-split VRF system has a high part load performance, so it shows high efficiency in the space where the partial load conditions occur [21,22,23]. Therefore, a method implemented with high energy efficiency is to control the frequency changes of the compressor frequency according to the partial load. Park et al. [24] analyzed the VRF system performance with variations in the operating frequency of the compressor and cooling load. They proposed a system simulation program to analyze the relationship among the COP and openings of EEVs and operation frequency. Choi et al. [25] explored the performance of an inverter-driven VRF system by changing the EEV opening and compressor speed according to various indoor loads. Lin et al. [26] proposed a feedback controller design for multi-evaporator air-conditioners (MECAs) to control the variable-speed compressors and variable-opening expansion valves properly. Wu et al. [27] proposed a control strategy and a dynamic model for MECAs. Compressor speed is controlled by the suction pressure, and the opening of the individual expansion valve was adjusted according to the change in room air temperature. The controller incorporates a self-tuning fuzzy algorithm for automatic correction. Tu et al. [28] proposed the control strategy for digital scroll compressor switching and developed a model to control compressor output capacity. The results showed that the proposed control strategy was reliable and showed high control accuracy of the air outlet temperature.
These studies [19,20,21,22,23,24,25,26,27,28] mainly focused on the control method of EEVs to set the refrigerant flow rate to achieve an optimal refrigeration effect; they also focused on improving the efficiency of mechanical factors for better energy performance. They did not study the energy-saving potential through more energy efficient system operation such as adjusting the temperature set-points or deadband of the VRF system.
The behavior of building facility managers or occupants to increase building energy performance based on efficient systems management is called human-based retrofits [29]. Action to improve energy performance includes the use of optimal set-point temperatures of the HVAC system, dimming lighting system, and the use of high-efficiency equipment. Recent studies have shown that savings of up to 20% of total energy consumption in the building are achieved by adjusting the set-point temperature [30,31,32].
The set-point temperature of HVAC systems plays an important role in energy consumption and human thermal comfort [33,34]. Many countries are proposing and implementing a method to reduce the energy consumption of buildings by raising the set-point temperature during cooling. The Japanese government launched the ‘Cool Biz’ campaign in 2005 [35], which set the minimum cooling set-point temperature to at least 28 °C over in summer, and relaxed the dress code of occupants [36]. Similar campaigns such as ‘Cool Asia’ [37], ‘Cool UN (United Nations)’ [38], and ‘Cool Work’ [39] campaigns followed. Despite the apparent success of these campaigns, some warned that increasing the cooling set-point could adversely affect productivity and thermal comfort [40].
The main indicators used to estimate thermal comfort are the thermal comfort range (temperature and humidity), predicted mean vote (PMV) [41], and actual thermal sensation vote. The PMV index is most commonly used in studies as the control variable of an HVAC system for thermal comfort [36,42,43,44,45,46]. The PMV index has been used as an objective variable to control optimal energy consumption and thermal comfort using combined computational fluid dynamics (CFD) and an artificial neural network (ANN) [47,48,49]. In addition to the PMV index, several studies have been conducted to assess the control parameters of HVAC systems using dry bulb temperatures (DBT) and relative humidity (RH) ranges in the comfort zone in Psychometric charts [50] and use of the operative temperature (OT) [51]. This allowed them to determine the optimal temperature based on the Fanger [41] and American Society of Heating, Refrigerating and Air-Conditioning Engineers (ASHRAE) comfort zone [52].
Many studies have proposed control strategies of air conditioning systems for thermal comfort and energy saving through experiments and simulations. Most of them are conducted for the typical centralized HVAC system, but the energy-efficient operation strategies for the VRF system have rarely been studied. Unlike conventional air conditioning systems, the VRF system can be individually applied and controlled to achieve each room condition. The possibility of individual control makes this system more cost and energy efficient.
The motivation for this paper comes from the fact that the VRF system has more controllability than the existing air-conditioning system. Various studies have shown that when occupants can control the thermal environment, the tolerance for inconveniences increases and results in energy saving [53,54]. However, conventional HVAC control, it is difficult to sense or input many variables in real time control. The rapid development of Internet of Things (IoT) technology has made it very easy to implement complex control logic. The goal of study is to evaluate the energy-saving potential of adjusting the temperature set-points and deadband (range) based on the new control logic in a VRF air-conditioned building. To do so, we analyzed the influence of control strategies used for the VRF system on human thermal comfort and energy consumption by the simulation method. The conventional predetermined set-point temperature control of VRF system was compared to the extended temperature set-point control base on the existing thermal comfort index, PMV index, and ASHRAE comfort zone. The indoor thermal environment was controlled such that the residents were in a thermally comfortable range.
Therefore, this paper is presented with new perspectives and contributes to three main aspects. First, this study provides researchers and experts, who are in the fields of building science and facility management, with a better understanding of the energy saving potential of human-based retrofitting. Second, focusing on the VRF system as an air-conditioning system fills the gap in the current literature. Finally, this study analyzes the impact of the VRF system’s control strategy on human thermal comfort and energy consumption.
The paper is structured as follows. In Section 2, we describe the indoor temperature-control logic of the VRF system, as well as applications of control logic in this study. Section 3 discusses the analysis method, including simulation method and modeling. In Section 4, we present the energy-saving performance, system operation characteristics, indoor temperature control, and occupant thermal comfort and discussed their implications. Finally, Section 5 concludes the paper by summarizing the main finding and suggesting ideas for future work.
2. Indoor Temperature Control Strategies
2.1. Set-Point Control
Set-point temperature control, which is the traditional control method, is a simple and highly usable control method. Thus, it is used in many buildings with a VRF system. This control method generally uses on/off control of a compressor in an outdoor unit. Already established comfort benchmarks of ASHRAE 55-2017 [52], ‘Thermal Environment Conditions for Human Occupancy’, recommend a summertime thermal comfort zone of 23–26 °C. In this study, the action of typical set-point temperature control with a VRF system has a 26 °C set-point temperature for cooling and a set-point temperature deadband that is set to range from –1 °C to +0.5 °C.
2.2. Predicted Mean Vote (PMV) Comfort Control
PMV comfort range control is based on the PMV comfort indicator [52,55]. The PMV value is determined based on environmental factors such as DTB, RH, mean radiant temperature (MRT), and air velocity. In this study, the individual factor was set to 1.1 met of activity level and 0.5 clo of clothing, representing the summer condition in a classroom, which is assumed to be constant.
PMV comfort range control is modeled to repeat the on/off cycle of cooling, which satisfies the comfort range by the partial load operation of the compressor as well as the set-point temperature control model.
The dead-band of the PMV comfort range was set at −0.5 to +0.5, which is the thermally acceptable range in the PMV scale. One cycle of the system is defined as on (cooling) and off, and the steps for the cycle are shown in Figure 1. When the PMV of the indoors is +0.5 or higher, the compressor operates and continues cooling until it reaches a PMV of −0.5. In the range where cooling is required, the compressor performs the partial load operation according to the indoor condition. When the PMV reaches a −0.5 value, the compressor and the indoor unit remain non-operational and in the off state until the PMV of the indoors reaches a +0.5 value.
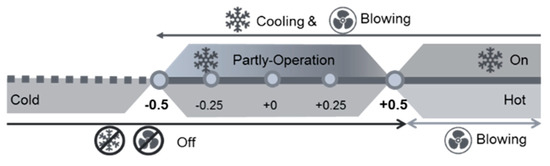
Figure 1.
Predicted mean vote (PMV) comfort range control.
Figure 2 shows the algorithm of PMV comfort range control. Depending on the range of the PMV, the operation of the compressor is determined, and the compressor’s speed changes in the PMV level. As shown in the algorithm, if the PMV range changes when the compressor is operating at high speed, the compressor speed decreases.
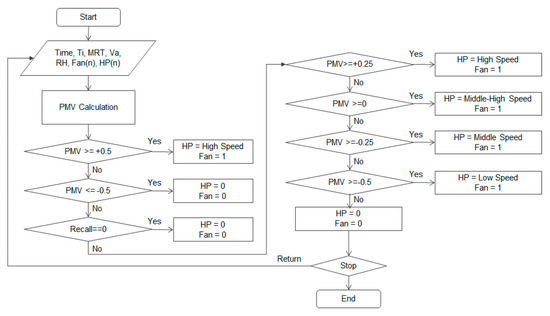
Figure 2.
The algorithm of PMV comfort range control.
2.3. American Society of Heating, Refrigerating and Air-Conditioning Engineers (ASHRAE) Comfort Range Control
The graphic comfort zone method of the ASHRAE [52] suggests a thermal comfort range based on OT and humidity. This method is limited to occupants with metabolic rates between 1.0–1.3 met and clothing insulation 0.5–1.0 clo at an average airspeed of less than 0.2 m/s. There are two comfort zones, summer comfort zone and winter comfort zone, based on the value of clothing insulation for summer and winter.
The ASHRAE Graphic Comfort Zone is limited to the maximum humidity ratio value of 0.012 kg/kg’. This comfort zone does not suggest the minimum humidity range. However, at low levels of indoor humidity, negative health implications have appeared like “dry eyes” and “dry skin” [52]. Some studies about Indoor air quality (IAQ) recommend a lower limit of 40% relative humidity [56,57,58]. Therefore, the relative humidity range for a comfort zone in this study is controlled to be between 40% and 60%.
The comfort range of cooling in the ASHRAE comfort zone is defined as 24–27 °C of the indoor OT, and RH is recommended between 40% and 60%. Two parameters, OT and wet bulb temperature (WBT), are used to control the system. WBT, which can consider both the dry bulb temperature and humidity, is used as a control variable because it is difficult for the relative humidity to reflect the indoor actual humidity level. The control rage of the WBT was set from 16 °C to 20 °C considering the OT and relative humidity of the comfort zone in this control method.
Figure 3; Figure 4 show the concept of one cycle and the algorithm in the ASHRAE comfort range control, respectively. This control has two major steps for cooling control. One is the determination of whether the cooling operation is performed according to the indoor OT range. The second is partial load operation by the indoor WBT range under cooling. The VRF systems benefit from part load conditions, and operation under these conditions can reduce a lot of energy. In the comfort range of the OT, the compressor speed is gradually decreased to the temperature decrease of the WBT. In this control scheme, the difference from the two previous control modes (set-point control and PMV comfort range control) is that the indoor unit fan operates even when the cooling is off. The air blowing mode is a control method for generating an air flow in the room by operating only the indoor fan without operating the compressor, thereby maintaining the thermal comfort of the occupant for a long time.
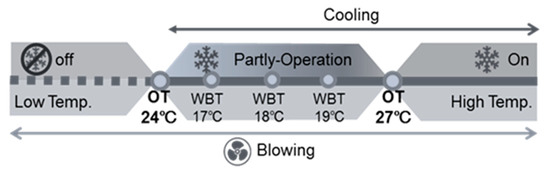
Figure 3.
American Society of Heating, Refrigerating and Air-Conditioning Engineers (ASHRAE) comfort range control.
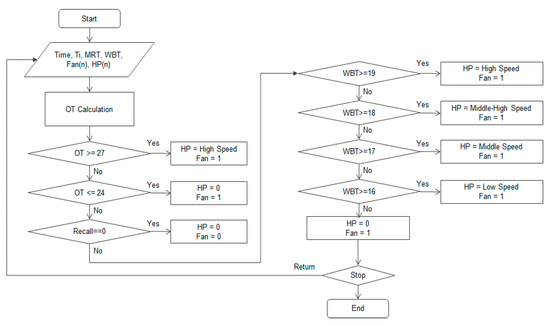
Figure 4.
The algorithm for ASHRAE comfort range control.
3. Methods
3.1. Field Measurement
A field measurement was conducted to investigate the energy saving performance and thermal comfort of VRF system with the proposed control logic in the previous study. The analyzed space was about 60 m2 occupied by 10 people (8 male and 2 female) and the experiment was conducted from 15 July 2018 to 15 August 2018. Two indoor units of VRF system were installed, each of which handles the thermal load of the interior zone and perimeter zone. The VRF system was controlled by set-point temperature control and PMV comfort range control. The variables necessary for calculating PMV are collected by sensors. Air temperature and humidity sensors, air wind speed sensors, and globe temperature sensors for MRT are installed for PMV control in this space. All data were recorded at 5-min intervals. Figure 5 shows the target space and the measurement sensor positions. In order to analyze the energy consumption characteristics according to the indoor cooling operation mode under the same ambient temperature, the set temperature control and PMV control were repeated on a daily basis.
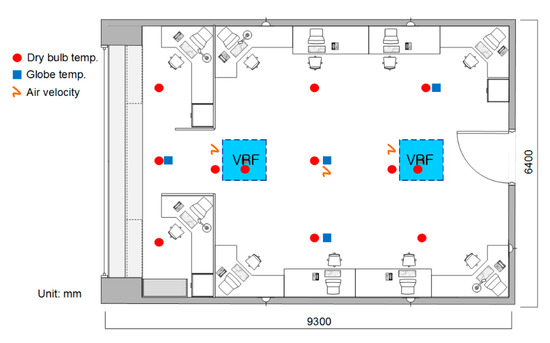
Figure 5.
Measurement detail in PMV comfort control.
A web-based survey program to investigate the occupants’ thermal sensing vote (TSV) and comfort sensing vote (CSV) was developed (Figure 6). The survey was accomplished at 1 h intervals. The survey program notified the occupant to express their thermal comfort with a pop-up menu through their PC. The responses of the occupant were accumulated in a server computer.
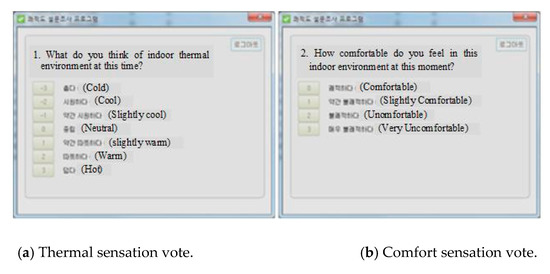
Figure 6.
Web-based survey program.
Thermal sensations were informed on the ASHRAE 7-point scale [54]. Based on the scale developed by Zhang, the thermal comfort scale was used [59]. The background questionnaire of subjects was prepared before the experiment and dealt with demographic data, as well as situational and psychological factors that could affect the thermal responses to the environment.
The clothing of the male subjects were 0.65 clo (men’s briefs, T-shirt, ankle-length socks, short-sleeved shirt, overalls, shoes), and those of the female subjects were 0.55 clo (bra, panties, T-shirt, stockings, shoes, skirt(thin), long-sleeve dress shirt). The clothing insulation was calculated using clo data provided by ISO 7730 [56] and ASHRAE 55 [52]. The subject’s metabolic rate was 1.1 met (sitting), which used data from ASHRAE 55.
Figure 7 shows the daily electric consumption of 26 °C set-point temperature control and the PMV control for the day when the outdoor temperature condition was almost same in the field measurement data. Accumulated electric usage showed a decrease of about 24% in PMV control comparison with the set-point control. In the previous study, the PMV control confirmed the applicability of VRF system control and showed that energy saving is possible. In Section 3 and 4, we will evaluate the effect of PMV control on VRF cooling energy demand during the summer season through simulation.
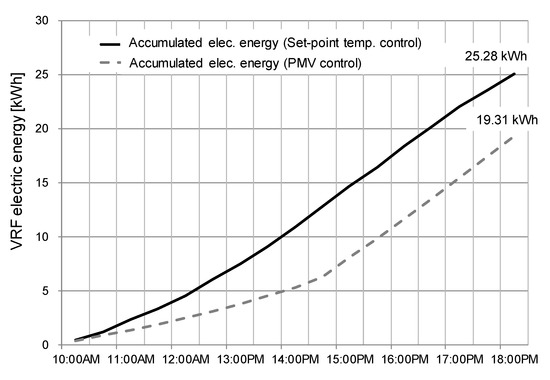
Figure 7.
Comparison of variable refrigerant flow (VRF) electric energy consumption (set-point control and PMV control).
Figure 8 shows the survey results of occupants’ thermal comfort when the indoor thermal environment was controlled by set-point temperature control and PMV control. In a case with a room temperature of 26 °C (78.8 °F), about 53.1% of the occupants felt “comfortable” and 38.3% were “slightly comfortable”. About 91.4% of all subjects reported that the thermal comfort level was acceptable.
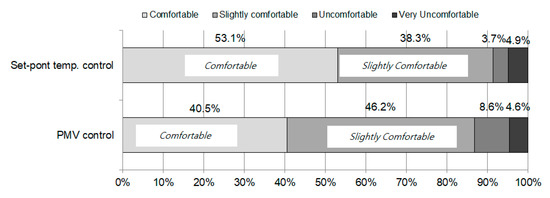
Figure 8.
Survey results of the occupants’ thermal comfort (set-point control and PMV control).
However, in a case with the PMV control, “comfortable” and “slightly comfortable” were reported at 40.5% and 46.2%, respectively, about 86.8% of all subjects felt that the thermal comfort level was acceptable.
The field measurement results confirmed that the PMV base control of the VRF system proposed in this study has the energy saving effect while not compromising the occupants’ thermal comfort.
3.2. Simulation
Energy simulations were carried out to analyze the thermal comfort and cooling energy demand for the VRF system mentioned in Section 2. The performance of the VRF system was simulated in TRNSYS for various control strategies [60]. The VRF system consists of an outdoor unit and several indoor units. The VRF system maintains the zone air temperature at the set-point by changing the refrigerant flow rate through a VSD compressor and EEVs. The components for implementing the VRF systems were all simulated in TRNSYS [61]. The VRF system simulation model was used to match a real product’s performance at rated conditions and perform simulations for all the required operating condition ranges to generate maps as input to the TRNSYS analyses. The TRNSYS simulations have independent controls for each indoor terminal unit for turning the units on and off and altering the indoor air flow rate to control the zone temperatures. Controls were set up in TRNSYS to automatically switch the modes.
The simulation method was set up in this study as shown in Figure 9. According to the control variable of the control strategies, the parameters of the target space are measured, and the operation signal was sent to the outdoor unit for the demand of the partial load. The outdoor unit, which receives the operating signal, evaluates the supply air temperature, humidity, and power consumption depending on the performance curve of the VRF. The indoor unit uses the supply air temperature and humidity ratio from the calculated cooling capacity in the outdoor unit and controls the air flow rate from the fan signal of the control component.
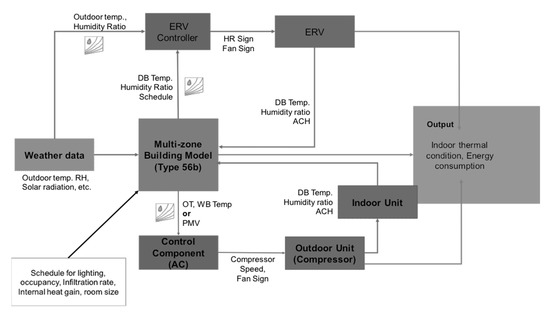
Figure 9.
Schematic diagram of thermal performance of a system air conditioner and energy recovery ventilator (ERV) by simulation.
An energy recovery ventilator (ERV) was added to the VRF system because school buildings are legally required to be equipped with ventilation systems in Korea. The ventilation rate of the conditioned space was modeled to use the same conditions in each case.
The target building is a classroom in a high school in Gimpo, South Korea. Figure 10 shows the floor plans of the classroom. The number of occupants is 30 persons in the classroom, and this number is based on the School Green Building Certification System in Korea [62]. For the PMV calculation, the students were assumed to wear 0.5 clo of clothing and have a 1.1 met activity level. Occupancy and system operation schedules were set to range from 9:00 to 17:20. The building construction of the target building was modeled according to the energy saving design standards of buildings in Korea [63]. The simulation cases and conditions are presented in Table 1; Table 2, respectively.
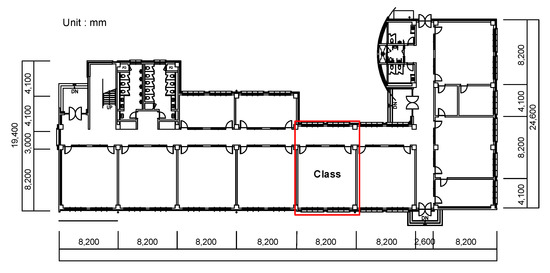
Figure 10.
Analyzed space–floor plan.

Table 1.
Summary of analyzed cases.
Table 2.
Simulation conditions.
The VRF system and the ERV system were installed in this classroom. The VRF system used capacity according to the cooling load of the classroom, and the ERV system also considered the ventilation requirement of classroom occupancy. Constant ventilation was applied in the occupancy schedule. The system performance and specifications are shown in Table 3.
Table 3.
VRF and ERV systems.
4. Results and Discussion
Table 4 shows the energy consumption per unit area for a classroom using each control strategy during July. The extension of the VRF system set-point temperature with a PMV comfort range (−0.5 ≤ PMV ≤ +0.5) and ASHRAE cooling comfort zone showed the energy savings about 25.4% for the PMV comfort range control and 27.0% for the ASHRAE comfort range control in comparison with the set-point temperature control. The energy consumptions of the VRF system during July was 3.18 kWh/m2 for the set-point temperature control, 2.37 kWh/m2 for the PMV comfort range control, and 2.32 kWh/m2 for the ASHRAE comfort range control. The energy recovery ventilator (ERV) consumed the same energy in all controls because it operated on the same control schedule.
Table 4.
Energy savings summary.
This stacked bar graph in Figure 11 shows the percentage of time used on operations, which are compressor on (each compressor speed), compressor off, and the blowing mode of the indoor unit in the VRF system. The results indicate that the compressor on set-point temperature control operates for more time in the high-speed mode than the other controls. Since the outdoor fan of the VRF system ran simultaneously with the compressor, it was proportional to the time of compressor operation in each control. The energy consumption of an indoor fan in the ASHRAE comfort range control, which had a blower mode, was about twice that of other controls. The compressor operation times were 68% of the total time in the set-point temperature control, 54% in the PMV comfort range control, and 49% in the ASHRAE comfort range control.
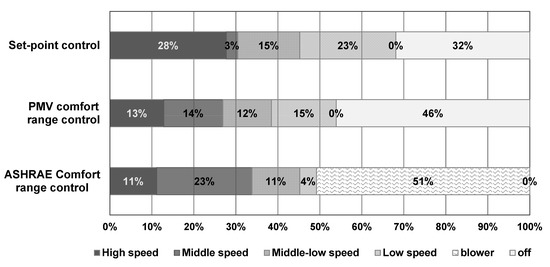
Figure 11.
VRF system operation behavior (July).
Table 5 shows the dry-bulb temperature control behaviors of each control mode on 24 July. The average outdoor temperature was 27 °C, and the relative humidity was 79.4% on 24 July, which represents summer conditions in Korea. In the set-point temperature control mode, the indoor dry-bulb temperature was controlled to an average of 25.7 °C, and the range was 25 °C to 26.8 °C. In the PMV comfort range control mode, the average indoor temperature was 24.7 °C, and the range was 22.2 °C to 27.2 °C. In the case of the ASHRAE comfort range control mode, the average indoor temperature was 24.6 °C, and the range was 22.0 °C to 27.2 °C.
Table 5.
Indoor dry-bulb temperature control behavior (24 July).
Figure 12 indicates the indoor air control behavior for one cycle of each control strategy in a psychrometric chart. One cycle in each control means the on/off cycle of the compressor in the outdoor unit. In the set-point temperature control, one cycle was 10 min, and the compressor operated for 7 min. The indoor operative temperature was maintained in the range of 26.6 ± 0.4 °C.
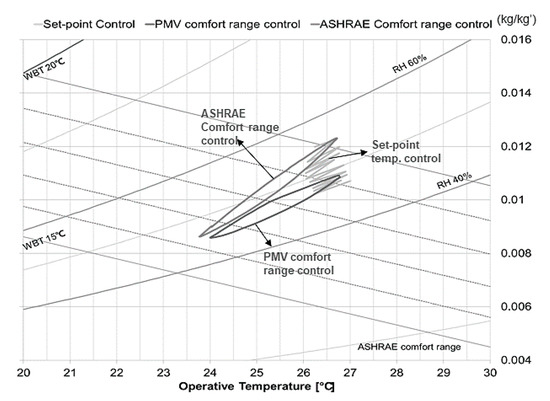
Figure 12.
Indoor air control behavior.
The PMV comfort range control and the ASHRAE comfort range control had a single cycle of 32 min and 36 min, respectively, and the compressor of both controls operated for about 19 min. One cycle of the ASHRAE comfort range control extended the comfort period due to the blowing mode in this control. In the PMV control, when the PMV exceeded +0.5 at about 26.7 °C (DBT) and 52% (RH), cooling started. When the PMV fell below −0.5 at about 22.8 °C (DBT) and 48% (RH), the outdoor unit stopped. ASHRAE comfort control also showed an expansion temperature range. The temperature range was also extended from DBT of 22.3 °C and RH 48% (OT was 24 °C and WT was 16.8 °C) to DBT 27.2 °C and RH 58% (OT was 26.8 °C and WT 20.6 °C).
As shown in Figure 13, even though the indoor air temperature control range of the VRF system was expanded by the PMV comfort range control and ASHRAE comfort zone control, all three control modes satisfied the thermal comfort of residents with PMV between −0.5 and +0.5. The set-point temperature control had a small variation range of PMV because the control variable was constant with a narrow deadband. On the other hand, the PMV comfort range control and the ASHRAE comfort range control showed relatively wide PMV changes.
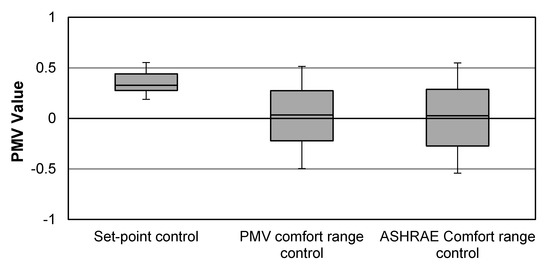
Figure 13.
Indoor air control behavior-PMV distribution.
The results presented in this paper suggest that the current set-point temperature control of the VRF system should be reconsidered. VRF systems are operated in individual or zonal control, and this characteristic makes this system more cost and energy efficient. About 20% of the cooling energy consumption can be avoided by properly extending the set-point temperature range without compromising occupant thermal comfort. This evidence demonstrates the possibility of a human-based retrofit that does not require additional cost.
The current set-point temperature control range is too narrow, and the indoor air temperature was controlled in a range of 25.4 °C to 26.3 °C, with PMV ranging from 0.28 to 0.44. On the other hand, when the cooling control range of the VRF was set according to the PMV comfort range or the ASHRAE comfort zone, the indoor air temperature was in the range of 23.1 °C to 26 °C, and the PMV expanded from −0.27 to +0.29.
Set-point temperature control was widely applied because of its simplicity and low cost. Sensing the indoor air temperature is sufficient as a control element in this control method. However, the PMV based control needs to sense or input more variables such as indoor thermal environmental factors (DBT, RH, MRT, air velocity) and individual factors (metabolic rate, met; clothing, clo). Also, ASHRAE comfort zone-based control was determined based on the OT and WBT, but the indoor DBT, MRT, and RH should be measured. In conventional HVAC control, it is difficult to sense or input many variables in real-time control. This is why PMV-based control and ASHRAE comfort zone-based control have already been proposed but are difficult to use as actual control logic.
However, recent breakthroughs in Internet of Things (IoT) technology have made it possible to implement complex logic very easily, which was previously difficult to implement in air-conditioning control [64]. IoT can change the monitoring and control that are possible by collecting and analyzing information data of the HVAC system. Acquisition of various information is not limited to heating, cooling, ventilation, cooling, and refrigeration and enables overall energy efficiency and operating cost management. The VRF system is a highly efficient technology and has been widely used in current HVAC systems. It has become one of the main systems of commercial buildings in the world. Linking the IoT to the VRF systems provides opportunities to improve energy efficiency and operational performance by connecting it to other data sets. As future work, we plan to validate our findings of this study through field measurements with an IoT-based control system in existing office buildings.
5. Conclusions
The goal of this study is to assess the energy-saving potential of adjusting the temperature set-points and deadband (range) in a VRF air-conditioned building. The energy saving potential of the control strategies of the VRF system without compromising human thermal comfort was analyzed by simulation methods. The conventional predetermined set-point temperature control of the VRF system was compared to the extended temperature set-point control based on the existing thermal comfort index, PMV index, and ASHRAE comfort zone.
In the field measurement results, the electric consumption of VRF with the PMV control showed a decrease of about 24% compared with the 26 °C set-point control. The results of occupants’ thermal comfort showed that about 86.8% of all subjects felt an acceptable thermal comfort level which is comfortable and slightly comfortable. The results of simulation showed that the PMV comfort range control and ASHRAE comfort range control reduced the compressor operation time by 21% and 28%, respectively, and the total energy consumption by 25.4% and 27% compared to the set-point temperature control of the VRF system.
All the control methods analyzed in this study showed that the indoor thermal environment was controlled within a comfort range of PMV at ±0.5. The indoor temperature was controlled in too narrow a range of 25.4 °C to 26.3 °C for the set-point temperature control. The resulting thermal environment of PMV ranged from 0.28 to 0.44. The indoor temperature dead-band and resulting PMV range was expanded for the PMV comfort range and the ASHRAE comfort zone control, and the indoor air temperature was in the range of 23.1 °C to 26 °C, while the PMV expanded from −0.27 to +0.29. If we simply use the expanded temperature range for indoor air control from this result, it will demonstrate the possibility of human-based energy saving potentials that do not require the additional cost associated with a VRF system control. The findings presented in this paper can help building operation managers to better understanding the energy saving potential of a human-based retrofit of the VRF system that does not require additional cost. In addition, the proposed VRF control logic in this study can be implemented in actual buildings equipped with a VRF system. The reason why the control logic discussed in this study can be actually applied is that the proposed control logic ensures the thermal comfort of the occupant. As future work, field measurements for energy saving performance of the VRF system with the proposed control logic in this paper will be obtained in existing office buildings.
Author Contributions
Conceptualization, D.S.; Data curation, J.K.; Funding acquisition, D.S.; Investigation, S.P.; Resources, S.K.; Software, S.K. and S.P.; Supervision, D.S.; Validation, Y.C. and H.L.; Visualization, Y.C. and H.L.; Writing—original draft, J.K.; Writing—review & editing, J.K. and D.S. All authors have read and agreed to the published version of the manuscript.
Funding
This research was supported by a grant (20AUDP-B099686-06) from the Architecture and Urban Development Research Program funded by Ministry of Land, Infrastructure and Transport of the Korean government.
Conflicts of Interest
The authors declare no conflict of interest.
References
- Capuano, L. International energy outlook 2018 (IEO2018); US Energy Information Administration (EIA): Washington, DC, USA, 2018; Volume 2018, p. 21. [Google Scholar]
- Energy Information Administration. Annual Energy Outlook 2018; Johns Hopkins University: Washington, DC, USA, 2018.
- Karami, P. Robust and Durable Vacuum Insulation Technology for Buildings; KTH Royal Institute of Technology: Stockholm, Sweden, 2015. [Google Scholar]
- Pérez-Lombard, L.; Ortiz, J.; Pout, C. A review on buildings energy consumption information. Energy Build. 2008, 40, 394–398. [Google Scholar] [CrossRef]
- Vakiloroaya, V.; Samali, B.; Fakhar, A.; Pishghadam, K. A review of different strategies for HVAC energy saving. Energy Convers. Manag. 2014, 77, 738–754. [Google Scholar] [CrossRef]
- Ghahramani, A.; Zhang, K.; Dutta, K.; Yang, Z.; Becerik-Gerber, B. Energy savings from temperature set-points and deadband: Quantifying the influence of building and system properties on savings. Appl. Energy 2016, 165, 930–942. [Google Scholar] [CrossRef]
- Azar, E.; Menassa, C.C. A comprehensive framework to quantify energy savings potential from improved operations of commercial building stocks. Energy Policy 2014, 67, 459–472. [Google Scholar] [CrossRef]
- Azar, E.; Menassa, C.C. A comprehensive analysis of the impact of occupancy parameters in energy simulation of office buildings. Energy Build. 2012, 55, 841–853. [Google Scholar] [CrossRef]
- Lakeridou, M.; Ucci, M.; Marmot, A. Imposing limits on summer set-points in UK air-conditioned offices: A survey of facility managers. Energy Policy 2014, 75, 354–368. [Google Scholar] [CrossRef]
- Mui, K.; Wong, L.; Fong, N. Optimization of indoor air temperature set-point for centralized air-conditioned spaces in subtropical climates. Autom. Constr. 2010, 19, 709–713. [Google Scholar] [CrossRef]
- Goetzler, W. Variable refrigerant flow systems. Ashrae J. 2007, 49, 24–31. [Google Scholar]
- Kim, D.; Cox, S.J.; Cho, H.; Im, P. Evaluation of energy savings potential of variable refrigerant flow (VRF) from variable air volume (VAV) in the US climate locations. Energy Rep. 2017, 3, 85–93. [Google Scholar] [CrossRef]
- AHRI Standard 1230. Performance Rating of Variable Refrigerant Flow (VRF) Multi-split Air-conditioning and Heat Pump Equipment; AHRI: Arlington, VA, USA, 2010; Available online: http://www.ahrinet.org/App_Content/ahri/files/standards%20pdfs/AHRI%20standards%20pdfs/AHRI%20Standard%201230%20-%202010.pdf (accessed on 2 August 2010).
- Amarnath, A.; Blatt, M. Variable refrigerant flow: Where, why, and how. Eng. Syst. 2008, 25, 54–60. [Google Scholar]
- Aynur, T.N. Variable refrigerant flow systems: A review. Energy Build. 2010, 42, 1106–1112. [Google Scholar] [CrossRef]
- Aynur, T.N.; Hwang, Y.; Radermacher, R. Simulation comparison of VAV and VRF air conditioning systems in an existing building for the cooling season. Energy Build. 2009, 41, 1143–1150. [Google Scholar] [CrossRef]
- Yu, X.; Yan, D.; Sun, K.; Hong, T.; Zhu, D. Comparative study of the cooling energy performance of variable refrigerant flow systems and variable air volume systems in office buildings. Appl. energy 2016, 183, 725–736. [Google Scholar] [CrossRef]
- Halawa, E.; van Hoof, J.; Soebarto, V. The impacts of the thermal radiation field on thermal comfort, energy consumption and control—A critical overview. Renew. Sustain. Energy Rev. 2014, 37, 907–918. [Google Scholar] [CrossRef]
- Lin, X.; Lee, H.; Hwang, Y.; Radermacher, R. A review of recent development in variable refrigerant flow systems. Sci. Technol.Built Environ. 2015, 21, 917–933. [Google Scholar] [CrossRef]
- Kwon, L.; Lee, H.; Hwang, Y.; Radermacher, R.; Kim, B. Experimental investigation of multifunctional VRF system in heating and shoulder seasons. Appl. Therm. Eng. 2014, 66, 355–364. [Google Scholar] [CrossRef]
- Ekren, O.; Celik, S.; Noble, B.; Krauss, R. Performance evaluation of a variable speed DC compressor. Int. J. Refrig. 2013, 36, 745–757. [Google Scholar] [CrossRef]
- Zhou, Y.; Wu, J.; Wang, R.; Shiochi, S.; Li, Y. Simulation and experimental validation of the variable-refrigerant-volume (VRV) air-conditioning system in EnergyPlus. Energy Build. 2008, 40, 1041–1047. [Google Scholar] [CrossRef]
- Zhang, D.; Zhang, X.; Liu, J. Experimental study of performance of digital variable multiple air conditioning system under part load conditions. Energy Build. 2011, 43, 1175–1178. [Google Scholar] [CrossRef]
- Park, Y.C.; Kim, Y.C.; Min, M.-K. Performance analysis on a multi-type inverter air conditioner. Energy Convers. Manag. 2001, 42, 1607–1621. [Google Scholar] [CrossRef]
- Choi, J.; Kim, Y.C. Capacity modulation of an inverter-driven multi-air conditioner using electronic expansion valves. Energy 2003, 28, 141–155. [Google Scholar] [CrossRef]
- Lin, J.-L.; Yeh, T.-J. Identification and control of multi-evaporator air-conditioning systems. Int. J. Refrig. 2007, 30, 1374–1385. [Google Scholar] [CrossRef]
- Wu, C.; Xingxi, Z.; Shiming, D. Development of control method and dynamic model for multi-evaporator air conditioners (MEAC). Energy Convers. Manag. 2005, 46, 451–465. [Google Scholar] [CrossRef]
- Tu, Q.; Dong, K.; Zou, D.; Lin, Y. Experimental study on multi-split air conditioner with digital scroll compressor. Appl. Therm. Eng. 2011, 31, 2449–2457. [Google Scholar] [CrossRef]
- Pisello, A.L.; Asdrubali, F. Human-based energy retrofits in residential buildings: A cost-effective alternative to traditional physical strategies. Appl. Energy 2014, 133, 224–235. [Google Scholar] [CrossRef]
- Papadopoulos, S.; Azar, E. Integrating building performance simulation in agent-based modeling using regression surrogate models: A novel human-in-the-loop energy modeling approach. Energy Build. 2016, 128, 214–223. [Google Scholar] [CrossRef]
- Barbosa, J.D.; Azar, E. Modeling and implementing human-based energy retrofits in a green building in desert climate. Energy Build. 2018, 173, 71–80. [Google Scholar] [CrossRef]
- Jain, R.K.; Taylor, J.E.; Culligan, P.J. Investigating the impact eco-feedback information representation has on building occupant energy consumption behavior and savings. Energy Build. 2013, 64, 408–414. [Google Scholar] [CrossRef]
- Yang, L.; Yan, H.; Lam, J.C. Thermal comfort and building energy consumption implications–a review. Appl. Energy 2014, 115, 164–173. [Google Scholar] [CrossRef]
- Park, J.Y.; Nagy, Z. Comprehensive analysis of the relationship between thermal comfort and building control research-A data-driven literature review. Renew. Sustain. Energy Rev. 2018, 82, 2664–2679. [Google Scholar] [CrossRef]
- Team Minus 6%. In Introduction of Team Minus 6%—Results of COOL BIZ and WARM BIZ Campaign; Ministry of the Environment: Tokyo, Japan, 2007.
- Ferreira, P.; Ruano, A.; Silva, S.; Conceicao, E. Neural networks based predictive control for thermal comfort and energy savings in public buildings. Energy Build. 2012, 55, 238–251. [Google Scholar] [CrossRef]
- Tan, C.K.; Ogawa, A.; Matsumura, T. Innovative climate change communication: Team Minus 6%; Global Environment Information Centre (GEIC): Manchester, England; United Nations University (UNU): Tokyo, Japan, 2008; pp. 53–70. [Google Scholar]
- Tan, C. Cool United Nations. United Nations University. 2008. Available online: http://ourworld.unu.edu/en/cool-united-nations (accessed on 26 August 2008).
- TUC. Hot Workers Urged to Adopt Cool Japanese Summer Dress Code; TUC: London, UK, 2006. [Google Scholar]
- Uchida, S.; Tanabe, S.-I.; Nishihara, N.; Haneda, M.; Nakamura, S.; Kawaguchi, G. The evaluation of productivity in COOL BIZ office by field measurement of thermal environment and questionnaire survey. In Proceedings of the 9th International Healthy Buildings Conference and Exhibition, Syracuse, NY, USA, 13–17 September 2019. [Google Scholar]
- Fanger, P.O. Thermal Comfort. Analysis and Applications in Environmental Engineering; Danish Technical Press: Copenhagen, Denmark, 1970. [Google Scholar]
- Donaisky, E.; Oliveira, G.H.; Freire, R.Z.; Mendes, N. PMV-based predictive algorithms for controlling thermal comfort in building plants. In Proceedings of the 2007 IEEE International Conference on Control Applications, Singapore, 1–3 October 2007; pp. 182–187. [Google Scholar]
- Klaučo, M.; Kvasnica, M. Explicit MPC approach to PMV-based thermal comfort control. In Proceedings of the 53rd IEEE Conference on Decision and Control, Los Angeles, CA, USA, 15–17 December 2014; pp. 4856–4861. [Google Scholar]
- Liang, J.; Du, R. Design of intelligent comfort control system with human learning and minimum power control strategies. Energy Convers. Manag. 2008, 49, 517–528. [Google Scholar] [CrossRef]
- Ku, K.; Liaw, J.; Tsai, M.; Liu, T. Automatic control system for thermal comfort based on predicted mean vote and energy saving. IEEE Trans. Autom. Sci. Eng. 2014, 12, 378–383. [Google Scholar] [CrossRef]
- Xu, Z.; Hu, G.; Spanos, C.J.; Schiavon, S. PMV-based event-triggered mechanism for building energy management under uncertainties. Energy Build. 2017, 152, 73–85. [Google Scholar] [CrossRef]
- Stavrakakis, G.; Karadimou, D.; Zervas, P.; Sarimveis, H.; Markatos, N. Selection of window sizes for optimizing occupational comfort and hygiene based on computational fluid dynamics and neural networks. Build. Environ. 2011, 46, 298–314. [Google Scholar] [CrossRef]
- Stavrakakis, G.; Zervas, P.; Sarimveis, H.; Markatos, N. Optimization of window-openings design for thermal comfort in naturally ventilated buildings. Appl. Math. Model. 2012, 36, 193–211. [Google Scholar] [CrossRef]
- Xue, Y.; Zhai, Z.J.; Chen, Q. Inverse prediction and optimization of flow control conditions for confined spaces using a CFD-based genetic algorithm. Build. Environ. 2013, 64, 77–84. [Google Scholar] [CrossRef]
- Freire, R.Z.; Oliveira, G.H.; Mendes, N. Predictive controllers for thermal comfort optimization and energy savings. Energy Build. 2008, 40, 1353–1365. [Google Scholar] [CrossRef]
- Halawa, E.; Marquand, C. Improving thermal comfort conditions by accounting for the mean radiant temperature. Int. J. Ambient. Energy 1994, 15, 87–90. [Google Scholar] [CrossRef]
- ASHRAE Standard. Standard 55–2017 Thermal Environmental Conditions for Human Occupancy; American Society of Heating, Refrigerating and Air Conditioning Engineers: Atlanta, GA, USA, 2017. [Google Scholar]
- Brager, G.; Paliaga, G.; De Dear, R. Operable windows, personal control and occupant comfort. ASHRAE Trans. 2004, 110, 17–35. [Google Scholar]
- Haldi, F.; Robinson, D. On the unification of thermal perception and adaptive actions. Build. Environ. 2010, 45, 2440–2457. [Google Scholar] [CrossRef]
- ISO 7730:2005 Ergonomics of the Thermal Environment-Analytical Determination and Interpretation of Thermal Comfort Using Calculation of the PMV and PPD indices and Local Thermal Comfort Criteria; ISO: Geneva, Switzerland, 2005.
- Wolkoff, P. Indoor air humidity, air quality, and health–An overview. Int. J. Hyg. Environ. Health 2018, 221, 376–390. [Google Scholar] [CrossRef] [PubMed]
- Noti, J.D.; Blachere, F.M.; McMillen, C.M.; Lindsley, W.G.; Kashon, M.L.; Slaughter, D.R.; Beezhold, D.H. High humidity leads to loss of infectious influenza virus from simulated coughs. PLoS ONE 2013, 8, e57485. [Google Scholar] [CrossRef] [PubMed]
- Nevins, R. Effect of floor surface temperature on comfort Part IV: Cold floors. ASHRAE Trans. 1967, 73, III2–III8. [Google Scholar]
- Zhang, H. Human Thermal Sensation and Comfort in Transient and Non-Uniform Thermal Environments; University of Califonia: Berkeley, CA, USA, 2003. [Google Scholar]
- Beckman, W. TRNSYS Reference Manual; Solar Energy Laboratory: Madison, WI, USA, 2001. [Google Scholar]
- Zhu, Y.; Jin, X.; Du, Z.; Fang, X.; Fan, B. Control and energy simulation of variable refrigerant flow air conditioning system combined with outdoor air processing unit. Appl. Therm. Eng. 2014, 64, 385–395. [Google Scholar] [CrossRef]
- Korean Educational Development Institute. Brief statistics on Korean education; Korean Educational Development: Seoul, Korea, 2011. [Google Scholar]
- Ministry of Land, I.a.T. Building Design Criteria for Energy Saving. Available online: https://www.energy.or.kr/renew_eng/energy/buildings/worksheet.aspx (accessed on 2 April 2020).
- Png, E.; Srinivasan, S.; Bekiroglu, K.; Chaoyang, J.; Su, R.; Poolla, K. An internet of things upgrade for smart and scalable heating, ventilation and air-conditioning control in commercial buildings. Appl. Energy 2019, 239, 408–424. [Google Scholar] [CrossRef]


© 2020 by the authors. Licensee MDPI, Basel, Switzerland. This article is an open access article distributed under the terms and conditions of the Creative Commons Attribution (CC BY) license (http://creativecommons.org/licenses/by/4.0/).