Article

Plug-In Electric Bus Depot Charging with PV and ESS and Their Impact on LV Feeder

1
Department of Electrical and Electronic Engineering, Auckland University of Technology, Auckland 1010, New Zealand
2
Department of Electrical Engineering, Lahore University of Management Sciences, Lahore 54792, Pakistan
*
Author to whom correspondence should be addressed.
Energies 2020, 13(9), 2139; https://doi.org/10.3390/en13092139
Submission received: 9 March 2020 / Revised: 2 April 2020 / Accepted: 19 April 2020 / Published: 29 April 2020

Abstract

:
Plug-in electric buses (PEBs) are a promising alternative to conventional buses to provide a sustainable, economical, and efficient mode of transportation. However, electrification of public transportation leads to a phenomenon of peak load that impacts the stability of low voltage (LV) feeders. In this context, the effective integration of an energy storage system (ESS) and photovoltaic (PV) in a bus depot charging ecosystem can lead to i) peak load reduction and ii) charging cost reduction with low carbon emission. Therefore, a limited PEB charge scheduling algorithm is proposed for: i) bus depot operator (BDO) profit maximization and ii) grid stability enhancement considering the constraints of PEB charging and grids. A mixed integer linear programming (MILP) model for BDO profit maximization has been formulated and analyzed using IBM ILOG studio with CPLEX solver. Simulation has been performed for SkyBus electric fleet using real-world data such as actual bus arrival and departure schedules under diverse traffic, number of passengers, trip duration, daily load profile, solar radiation profile, and benchmark storage price. The charging impact of PEBs was tested on one of the distribution feeders in Auckland, New Zealand. The BDO generates revenue by performing energy trading among PV, ESS, PEBs, and buildings after incorporating capital investment, operation and maintenance, and depreciation costs.

1. Introduction

The United Nations Framework Convention on Climate Change held in December 2015, resulted in a historical endorsement among more than 190 countries on a decarbonization plan to minimize the worldwide rise in temperature and carbon emissions. To successfully implement this agreement, decarbonization is required in all subdivisions of the economy. A significant portion of energy consumption is due to the transport sector, which represented 23% of global emission in 2013, of which 75% was contributed by road transportation. This was a 68% increase compared to that in 1990 [1].
In recent years, the electric buses have attracted significant attention, with their uptake in China, Europe, and USA reaching 343, 500, 1273, and 200 buses, respectively, in 2016 [2]. In Auckland, 81% of air pollution-related health costs are due to emission by diesel vehicles. Thus, Auckland Transport (AT), New Zealand’s largest regional transport agency, joined 11 other global cities for the Fossil Fuel Free Streets Declaration. In addition, AT has committed to use only zero-emission buses starting in 2025 [3] with the intention of achieving the decarbonization target of the public transport sector set by the New Zealand government.
Currently, 85% of New Zealand’s electricity generation is renewable, and a target of 100% renewable by 2035 has been set by the government [4]. Various renewable energy sources (RESs) such as wind energy, ocean energy, solar energy, biomass energy, geothermal energy, and fuel cell technology can be deployed for electricity generation. The use of renewable energy is attractive particularly for electric bus depot owners because they only need to pay the cost of electricity generation, not transmission and distribution that do not contribute to climate change or impact environment adversely [5]. Plug-in electric buses (PEBs) are therefore gaining attention and charging PEBs from an electric bus depot where renewable energy is installed presents a cost-effective solution to PEB owners [6].
This growth of PEBs offers both challenges (e.g., charging the PEBs’ battery) and opportunities for the future power network since they are huge, but flexible, loads [7]. The power grid can face tremendous stress due to the uncoordinated charging of PEBs [8]. On the other hand, coordinated charging can deliver excessive benefits such as valley filling and peak clipping [9]. Optimal charge scheduling of electric vehicles (EVs) has become an essential step towards smart grid implementation [10] which is an effective way of flattening the load profile of the electrical system. This will reduce the capital costs of building charging infrastructure as well as the charging cost of vehicles. Therefore, several mathematical models have been proposed and developed, for example, linear and mixed-integer linear models to tackle the issue of coordinated charging over day-ahead scheduling; i.e., minimizing EV load variance [11], total loss minimization [12], and charging cost minimization [13]. Other objectives such as minimization of power grid loss, EV battery degradation, CO2 emission, and maximizing EV owners’ degree of satisfaction have been considered as well [14]. With the increasing amount of EVs and participation of RESs in the future power network, it helps to create a new business paradigm. More recently, researchers have proposed a state-of-the-art bi-level model to maximize the profit of EV parking lot owners [15], minimize power loss, and maximize the load factor [16]. However, these studies have not investigated the nexus between public transportation and the power grid.
Several studies have been considered the scheduling of EVs and their impact on the power grid [17,18]. However, very few studies investigate scheduling for a PEB fleet. Among those that do, few give attention to the larger-scale electric bus charging infrastructure. Mohamed and colleagues [19] investigated the grid impact and operational feasibility of three charging concepts such as opportunity, depot, and flash charging. The power quality issue in the fast charging station was addressed in a study by Thiringer and Haghbin [20], who utilized real electric bus data from Gothenburg, Sweden, and explored the impact of EVs (including electric bus) on the substation reserve [21]. These studies considered the possible issues related to the impact on the power grid, however they did not propose solutions regarding the charging schedule. Numerous optimization methods, such as battery swapping [22] and the flash wireless charging concept for bus schedules have been analyzed [23]. These findings are based on the battery swapping, opportunity or flash wireless charging concepts which are not very efficient in terms of installation cost [24] and charging efficiency [25], respectively. The buses are scheduled to run all day long and thus may require charging before the next round. Therefore, the paper proposes charging algorithms that can handle such situations while minimizing the overloading on the low voltage (LV) feeder.
Considering the charging scheduling of electric buses for the centralized depot, Leou and Hung [26] proposed a mathematical model and tested for a small bus fleet comprising of 10 buses. This model takes the time-of-use prices during the day and schedule charging with the objective to minimize the energy cost. However, the authors did not reflect the charging effect of the PEB fleet on the grid (unlimited power intake from the grid) which causes overloading in the distribution transformer [27]; more importantly, buses need to wait until the off-peak time to be charged. To overcome this problem, this paper developed a coordinated with limited charge scheduling algorithm. The key contributions of this work are as follows:
  • A mathematical model is developed for a bus depot charging ecosystem to maximize the profit of the bus depot operator (BDO).
  • A feed-in tariff (FIT) scheme for two purposes: i) BDO profit maximization and ii) negative impact minimization of charging a fleet of PEBs on a LV feeder in Auckland, New Zealand.
  • A coordinated with limited charge scheduling algorithm is proposed for a large fleet comprising of 24 buses to reduce the overloading on LV feeder.
The proposed algorithm considers the grid constraints (i.e., the limit of power intake from a LV feeder (5 kW)) and PEB constraints such as i) ensuring all PEBs are fully charged to 100% state of charge (SOC) before departure from the depot; ii) initial SOC of a PEB when it arrives at the charging station (10% of total PEB capacity); and iii) energy consumption (route and stop) per trip.

2. System Configuration

2.1. A Framework of the Proposed Study

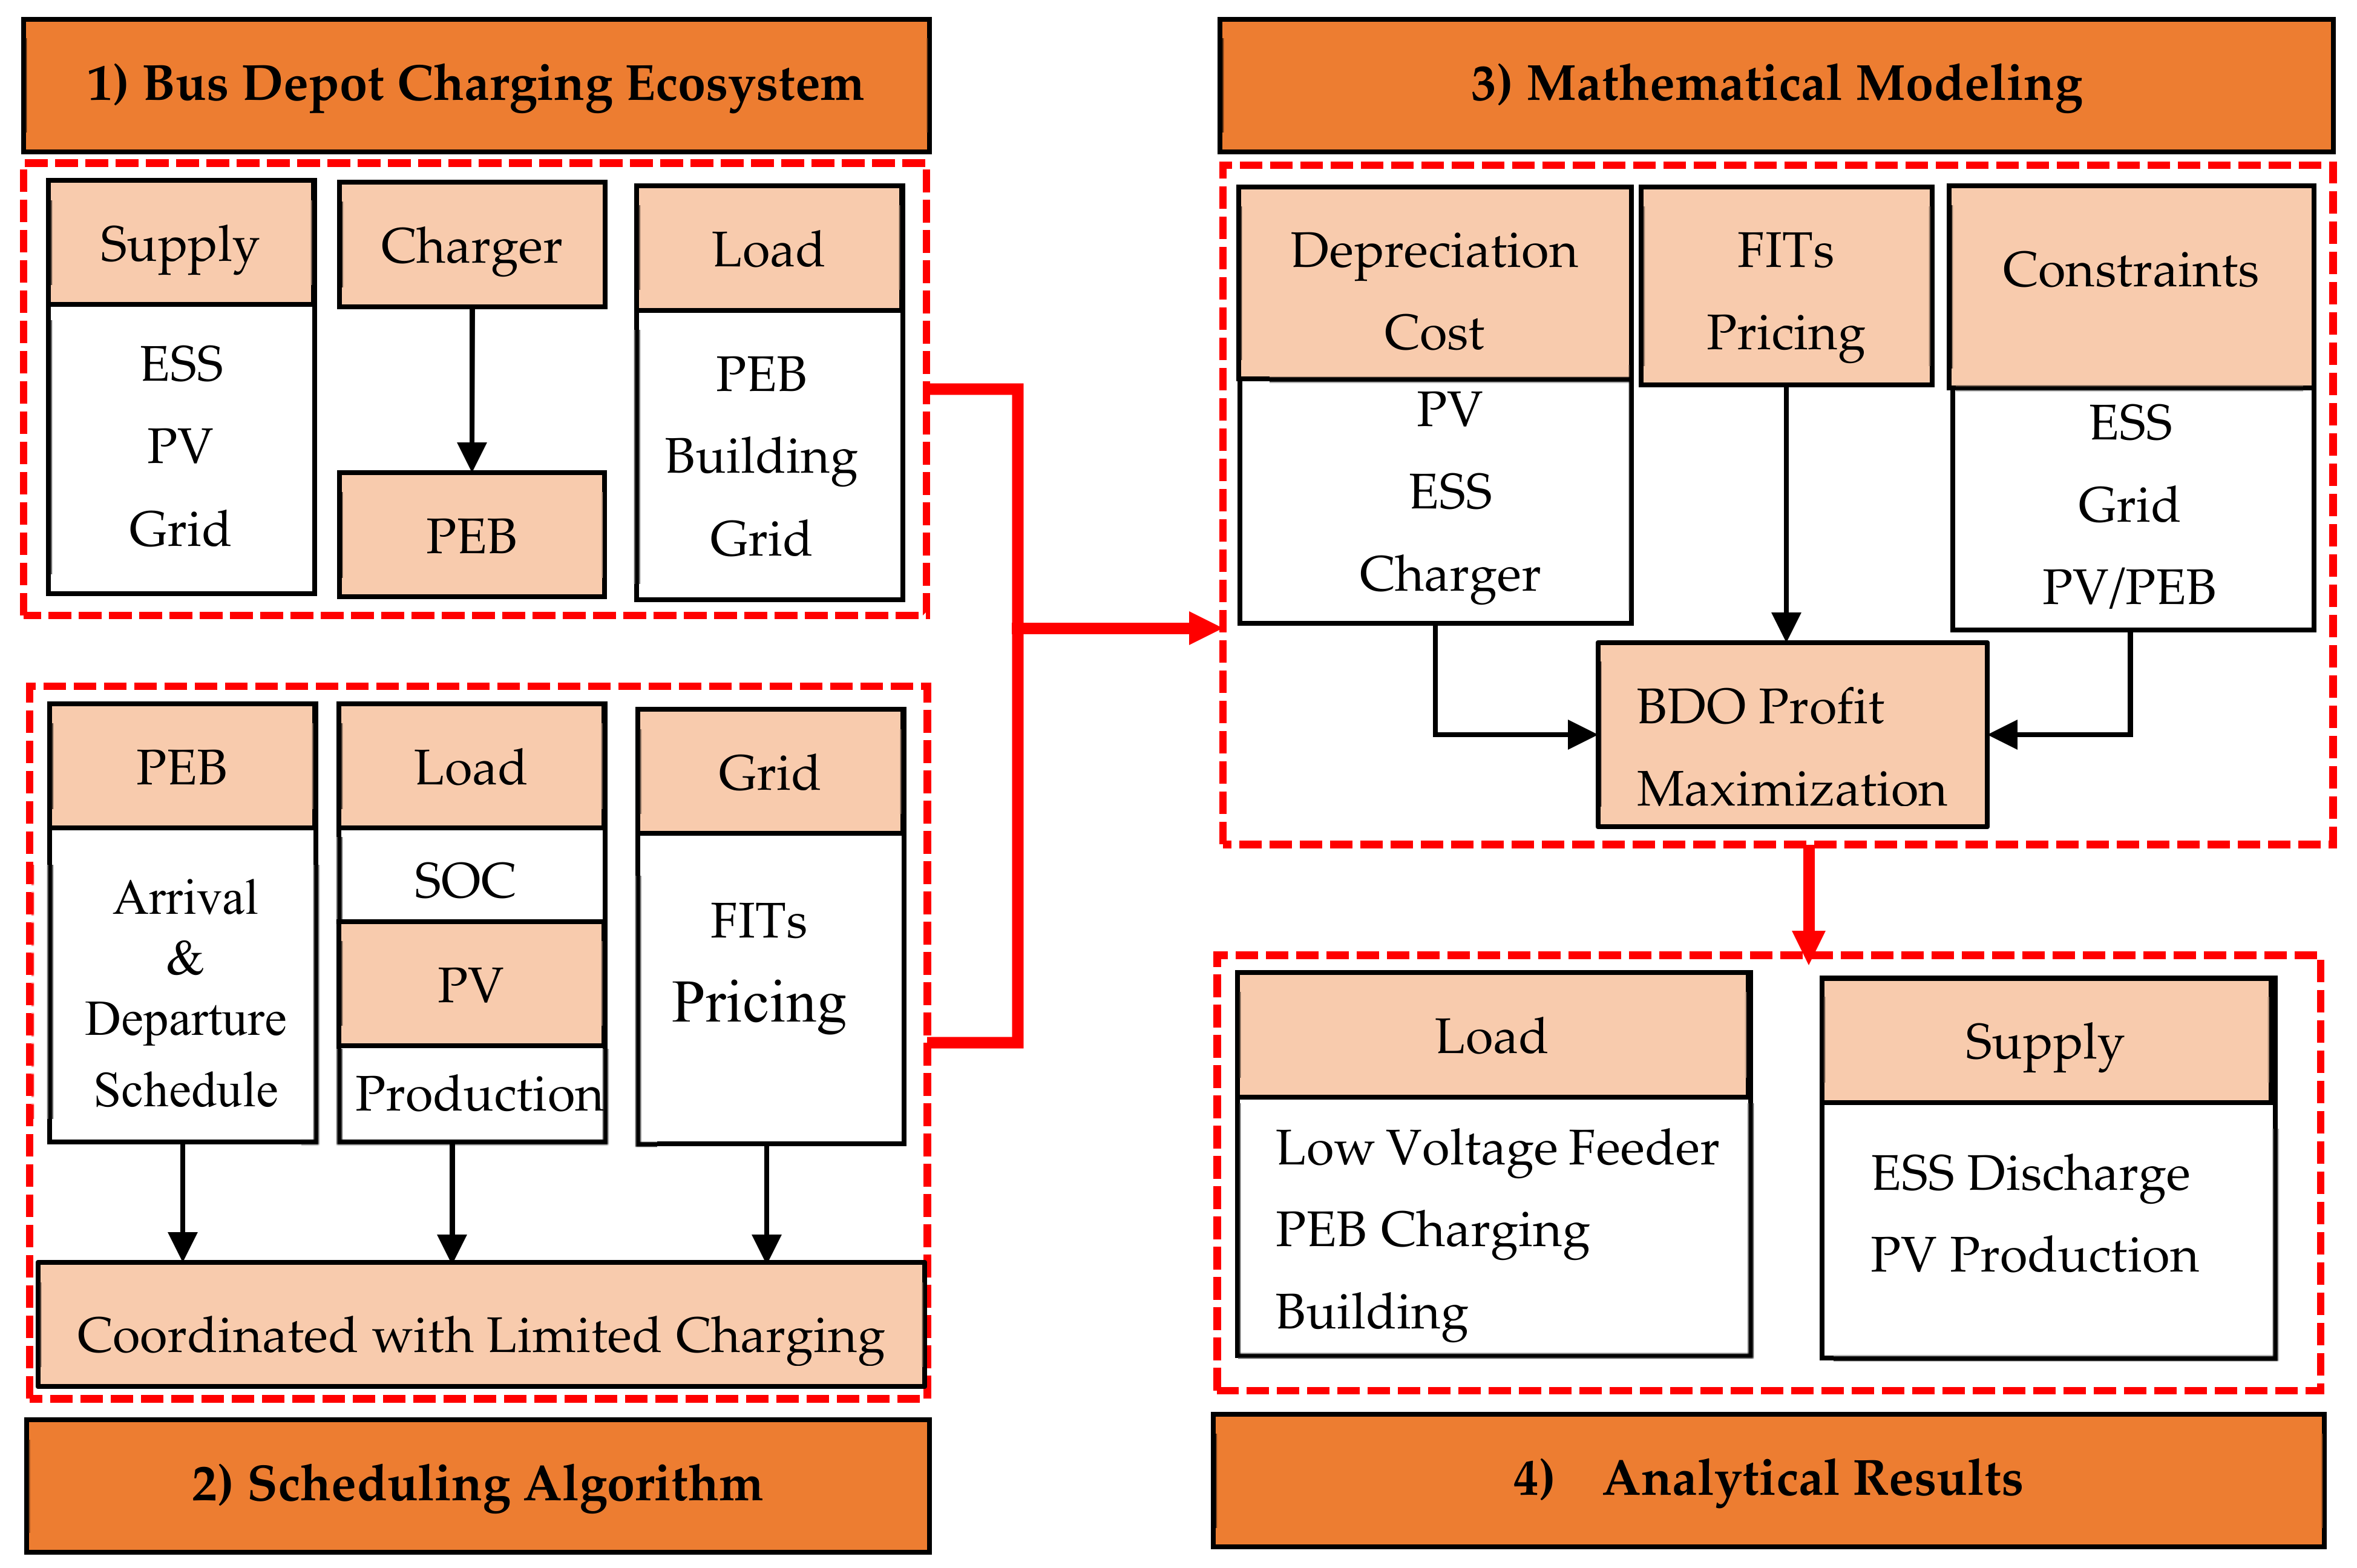
Figure 1 shows the outline of the proposed study. 1) In the bus depot charging ecosystem, Plug-in electric buses (PEBs) start to charge when they arrive according to the photovoltaic (PV) outputs, available power in the energy storage system (ESS), grid limit, and building loads. 2) A PEB charge scheduling algorithm: coordinated with limited charge scheduling is proposed considering the PEBs’ arrival and departure schedules, the ESS state of charge (SOC), PV production, and feed-in-tariff (FITs) scheme. 3) The aim of this study is to maximize the daily profit of the bus depot operator (BDO) considering the nexus between transportation and the power grid. The constraints (PV, ESS, and grid limit), capital investment, operation and maintenance, and depreciation costs of PV, ESS, charger, and FIT price of the grid are considered in the mathematical modeling. 4) Finally, the analytical results of the PEB charging algorithm, ESS SOC, building loads, PV generation and its demand, and impact on the LV feeder are presented.

2.2. Assumptions

  • The bus depot charging ecosystem is located at the Auckland airport where a 100 kW PV system is integrated with 500 kWh ESS and 12 chargers are available.
  • Every charger has two charging guns and thus 12 chargers are required to charge 24 PEBs and this is the maximum charging capacity of the BDO.
  • To maximize the daily BDO profit, the ESS buys and stores power from the grid when its price is low. At other times, the power stored in the ESS and that generated by the PV system may be exported back to the power grid or sold to the building at two-thirds or one-third of the purchase cost from the grid, [28] respectively.
  • The PEB owner agrees to purchase the power from the BDO at a higher price than the actual price on the grid for the time intervals, 1:00–7:00 am.
  • Coordinated with limited charging, the charger uses only 5 kW, while coordinated with unlimited charging, it may use more than 250 kW in 10-minute time intervals from the grid.
  • The solar profile irradiation of the city of Auckland [29], charger price from Ecotricity New Zealand [30], and FIT prices from the distribution company Electra [31] are used as real-world data in our simulations.

2.3. Bus Depot Charging Ecosystem

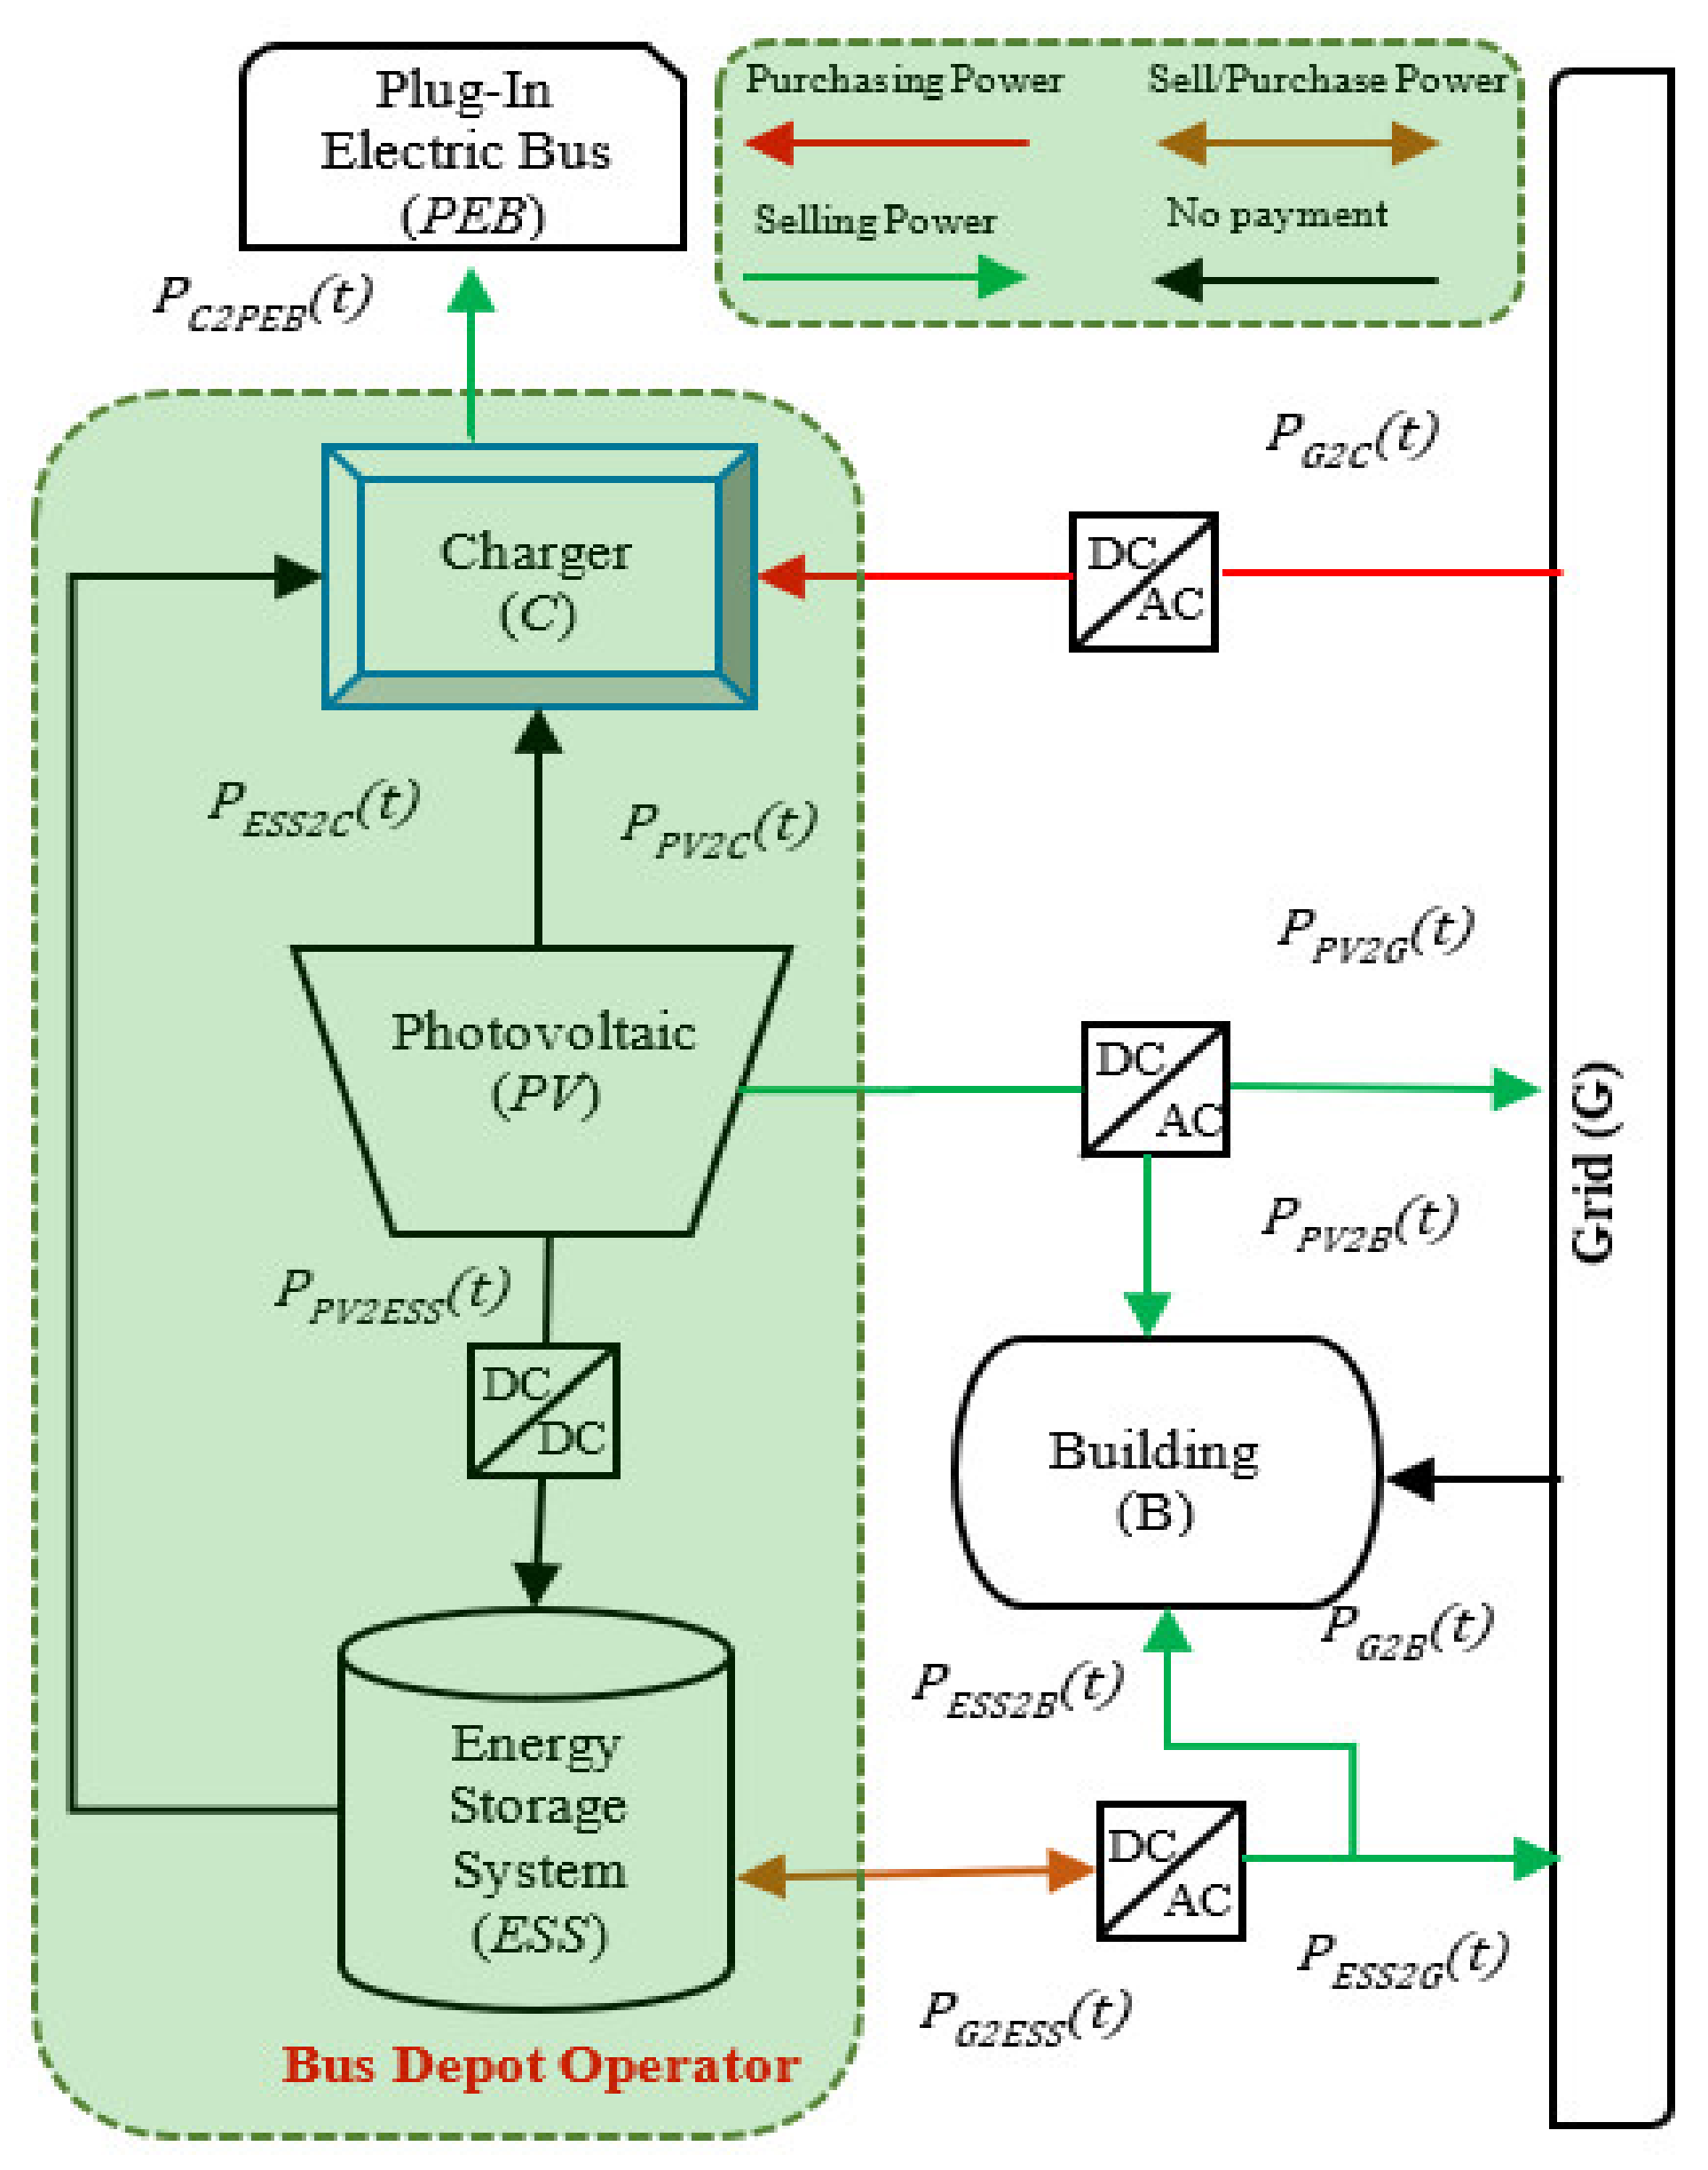
The bus depot charging ecosystem consists of a BDO (as a charging service provider that owns the PV, ESS, and charger), PEBs, and access to the building(s) and the grid as shown in Figure 2.
The PEBs arrive at the charging depot to charge up their batteries. The BDO pays when it purchases power from the grid for its ESS and charger (red arrow). On the other hand, the BDO generates revenue when it sells power to the PEBs, buildings, and the grid (green arrow). The BDO does not need to pay for the amount of power drawn by the building. The power drawn by the building (B) is paid by its owner, therefore there is no payment involved (black arrow) during optimization. Lithium-ion batteries and one of our campus buildings are used as the ESS and load, respectively. It is preferred that PEBs are charged during the night at the bus depot as they will be on the road during the daytime for scheduled trips. When the PEBs arrive at the charging station, the BDO should charge all the PEBs before their next scheduled departure [32].
To maximize the BDO’s daily profit, the proposed algorithm will charge the PEBs using PV or ESS resources if available, or otherwise, from the grid. The total system cost (capital investment and operation and maintenance) of PV, ESS, and PEB charger per day [33] is shown in Table 1.

2.4. Skybus Route

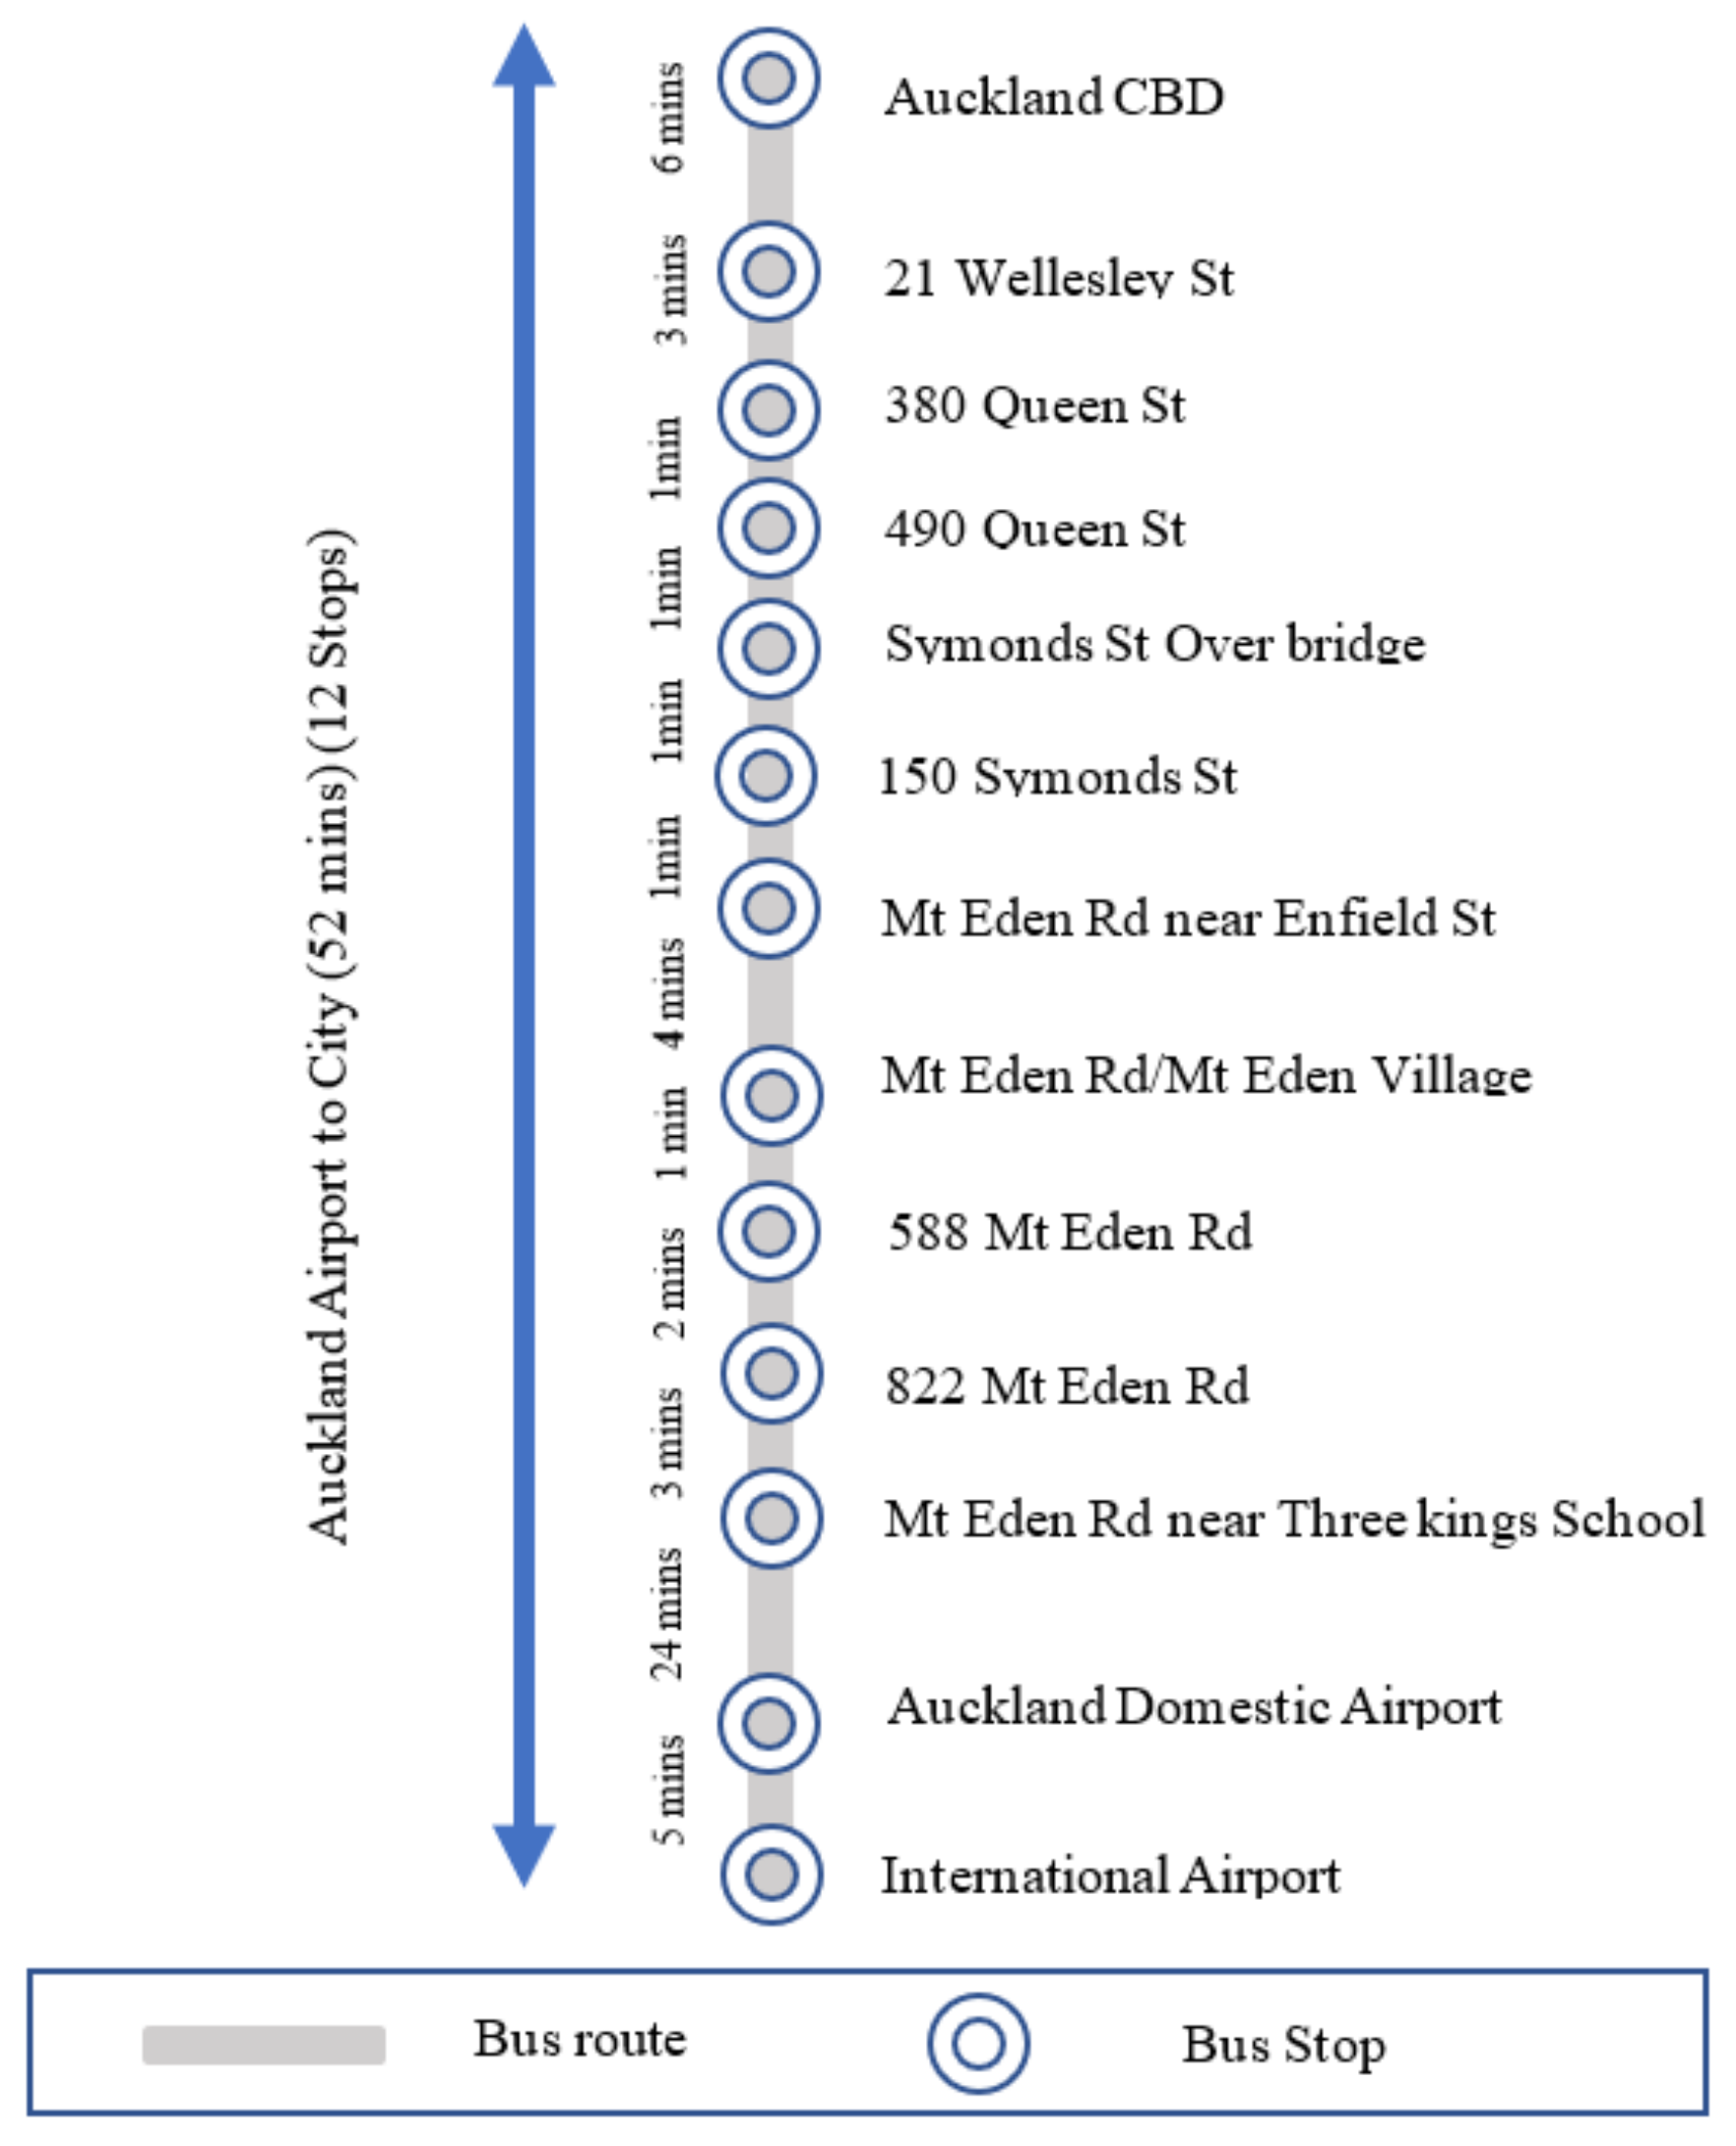
Skybus is an airport bus service for commuters traveling between the Auckland Airport and Auckland central business district (CBD) as shown in Figure 3.
Its route has 12 stops and covers a total distance of 20.5 km at an average time of 52 min. During peak periods, the route operates 24 PEBs, with half of them in each direction between the airport and CBD.

2.5. Skybus Fleet Arrival and Departure Schedule

During peak time, one bus departs every 10 min in each direction, as shown in Table 2. In a single charge, all PEBs can perform six return trips. To validate the proposed algorithms, simulations were performed and results of the 1st, 6th and 12th PEB are discussed in Section 6.

3. Mathematical Modeling

The total cost of the bus depot charging ecosystem consists of two parts: capital investment cost CI and operation and maintenance cost CO&M for PV, ESS, and chargers. It is calculated as described in Equation (1).
C Total = C I + C O & M
As a general rule, CO&M is supposed to be 10% of the overall investment cost [34]. The annual real interest rate (r = 6%) = nominal interest rate − inflation rate [35] and N is the PV, ESS, and charger lifetime. The present worth factor (PWF) [36] is used to transform the total cost into an annualized total present cost shown in Equation (2).
P W F r , N = 1 + r N 1 r 1 + r N
The objective function is defined as a mixed integer linear programming (MILP) problem for the BDO’s daily profit maximization as shown in Equation (3). The salvage price is the projected resale price of an asset at the end of its valuable life which is calculated using a depreciation rate of 40% for the ESS and charger and 16% for the PV (New Zealand power generation and electrical reticulation systems assets) [34]. The total investment cost, salvage value, and PWF of PV, ESS, and charger are different, therefore the total daily present cost (recovery) for each one is calculated separately.
p r o f i t Max day = R e v Max day ( C Total PV S PV × P W F PV 365 + C Total ESS S ESS × P W F ESS 365 + C Total C S C × P W F C 365 )
where C Total PV , C Total ESS , C Total C ,   S PV , S ESS , S C , P W F PV , P W F ESS , and P W F C are the total investment cost, salvage value, present worth factor of PV, ESS, and charger, respectively. The first term of Equation (3) shows the maximized revenue (Rev) generated by the BDO per day; the second, third, and fourth terms show the total daily present cost of PV, ESS, and charger, respectively.
The energy trading is performed between the grid, PEB, and building for 24 h. The revenue per day generated in time slot ∆t is calculated as described in Equation (4) which depends on the selling and purchasing energy cost between PV2G, PV2B, ESS2G, ESS2B, C2PEB, G2C, and G2ESS. ∆t is the resolution time (10 min).
R e v M a x d a y = M a x t = 1 24 ( ( P P V 2 G t × C S e l l 2 G t + P E S S 2 G t × C S e l l 2 G t + P P V 2 B t × C S e l l 2 B t + P E S S 2 B t × C S e l l 2 B t + P P V 2 C t × C S e l l 2 C t + P E S S 2 C t × C S e l l 2 C t + P C 2 P E B i t × C S e l l 2 P E B i t P G 2 C t × C P u r f r o m G t P G 2 E S S t × C P u r f r o m G t ) × Δ t
Subject to:
S O C min ESS t S O C ESS t S O C max ESS t
P ESS 2 B t P max ESS t
P ESS 2 C t P max ESS t
P ESS 2 G t P max ESS t
P G 2 ESS t P max Grid t
P G 2 C t P max Grid t
X t + Y t 1 ,   X t , Y t 0 , 1
P PV 2 ESS t + P G 2 ESS t × η char P max ESS t P min ESS t × Y t
P ESS 2 B t + P ESS 2 G t + P ESS 2 C t / η dis P max ESS t P min ESS t × X t
PEB and charger constraints:
S O C min PEB i t S O C PEB i t S O C max PEB i t
P G 2 C t P max G t
P PV 2 C t P max PV t
P ESS 2 C t P max ESS t
P ESS 2 C t + P PV 2 C t + P G 2 C t × η char P max PEB i t P min PEB i t
P PV 2 ESS t , P PV 2 B t , P PV 2 G t , P PV 2 PEB i t , P G 2 B t 0
Equation (5) defines the SOC limit (maximum and minimum) to preserve the lifespan of the batteries [36]. Equations (6)–(8) represent the maximum amount of power that the ESS can provide to the building, charger, and grid, respectively. Electrification of public transportation leads to a phenomenon of peak load that can negatively impact the stability of the grid. Equations (9) and (10) represent the maximum power that the grid can provide to the ESS and charger, respectively, which should be less than the grid capacity. Simultaneously charging and discharging the ESS is not possible, therefore, Equation (11) represents the charging and discharging binary variables. Equations (12) and (13) define the ESS’s charging and discharging limit, respectively. The SOC safety level of PEB(i) is defined in Equation (14). Equations (15)–(17) represent the maximum power obtain by PEBs from the electrical grid, PV, and ESS, respectively. Equation (18) determines PEBs charging power obtained from the grid, PV, and ESS, respectively and the maximum capacity. As the PV, ESS, PEB, and building are integrated into the bus depot charging ecosystem, the constraint in Equation (19) is required to prevent reverse power flow.

4. PEB Charge Scheduling Algorithm

The battery capacity of PEBs for the public transit system is bigger and thus their charging power is often larger than that of private EVs. This causes tremendous energy consumption and a negative effect on the distribution grid. To overcome this problem, a PEB charge scheduling algorithm is proposed for the bus depot charging ecosystem consisting of PV, ESS, and power grid and applied to a fleet of SkyBus PEBs. The PEB integration into the distribution grid can be enhanced when their charging takes place mostly during off-peak times. This coordinated scheduling of their charging can be referred to as coordinated charging [37]. Moreover, when the charging power can be limited or controlled, the negative impact of PEBs on the distribution system can be further mitigated. However, not every grid operator is equipped to control the charging power. Such coordination of charge scheduling and the potential limit of charging power gives rise to Algorithm 1:

Coordinated with Limited PEB Charging

Both the charge scheduling and charging power can be coordinated and limited, respectively, based on the available capacity of a charger in the market [38,39] and grid power. Initially, when the PEBs arrive at the charging station, the algorithm checks the initial SOC of the PEBs and ESS, and then charges the PEBs up to a controlled limit based on the FIT scheme without affecting their departure schedule. Due to the coordination between PEBs charging and grid limit, the proposed algorithm can mitigate the overloading problem in the LV feeder.
Algorithm 1 Coordinated with limited PEB charging power and charge scheduling algorithm.
1:
Input: Obtain PEBs arrival and departure schedule, PEBs energy consumption per km, maximum allowable charging power to each PEB, initial and final SOC of PEBs and ESS. Obtain the PV generation, building load demand, price of selling electricity to PEBs, and electricity buying price from the grid, at an intervening time t. PEB charging is performed after coordinating the FIT price, available energy in the ESS, and available PV generation.
2:
Procedure
3:
  for all t < T do
4:
   Lookup PEBs arrival and departure schedule
5:
   If PEBs are in the charging station then
6:
    for all i < I do
7:
Optimize:
8:
    Max PEBs charging power using Equation (20)
9:
    S.T t = A i L i S O C PEB i L i = S O C max PEB i i = 1 c h a r g e r N o P max G 2 C i t × η i 5 k W
10:
    end for
11:
   else
12:
   PEBs are on the road and the energy will consume according to:
13:
    PEB l o a d i t = L o a d n , n = 1 , 2 , 3 , N P ESS 2 PEB i t + P PV 2 PEB i t + P G 2 PEB i t = 0 S O C PEB i t + 1 = S O C PEB i t P E B l o a d i t , t = 1 , 2 , 3 , T
14:
  end for
15:
  Output: Optimized the charging schedule and charging power of each PEB’s battery from integrated PV, ESS, and grid for the time interval t = 1…,24 h (with 10-min time intervals).
where   S O C PEB i L i , S O C max PEB i , are the SOC (leaving from the depot) at time t and maximum SOC of PEB i; respectively,   L i and   A i are the leaving time and starting charging time of PEB i; P max G 2 C i is the maximum power that the grid can provide to charger i and the charging pole i efficiency is represented as   η i . Steps 1–10 are maximizing charging power of PEB i from PV, ESS if available, or otherwise purchasing power from the grid using Equation (20). Steps 12–14 show the energy consumptions due to l o a d n as shown in Table 3. In Step 9, the first constraint is to ensure the PEBs fully charge before their departure from the depot and the second constraint is to avoid power consumption exceeding the grid limit.

5. Results and Discussion

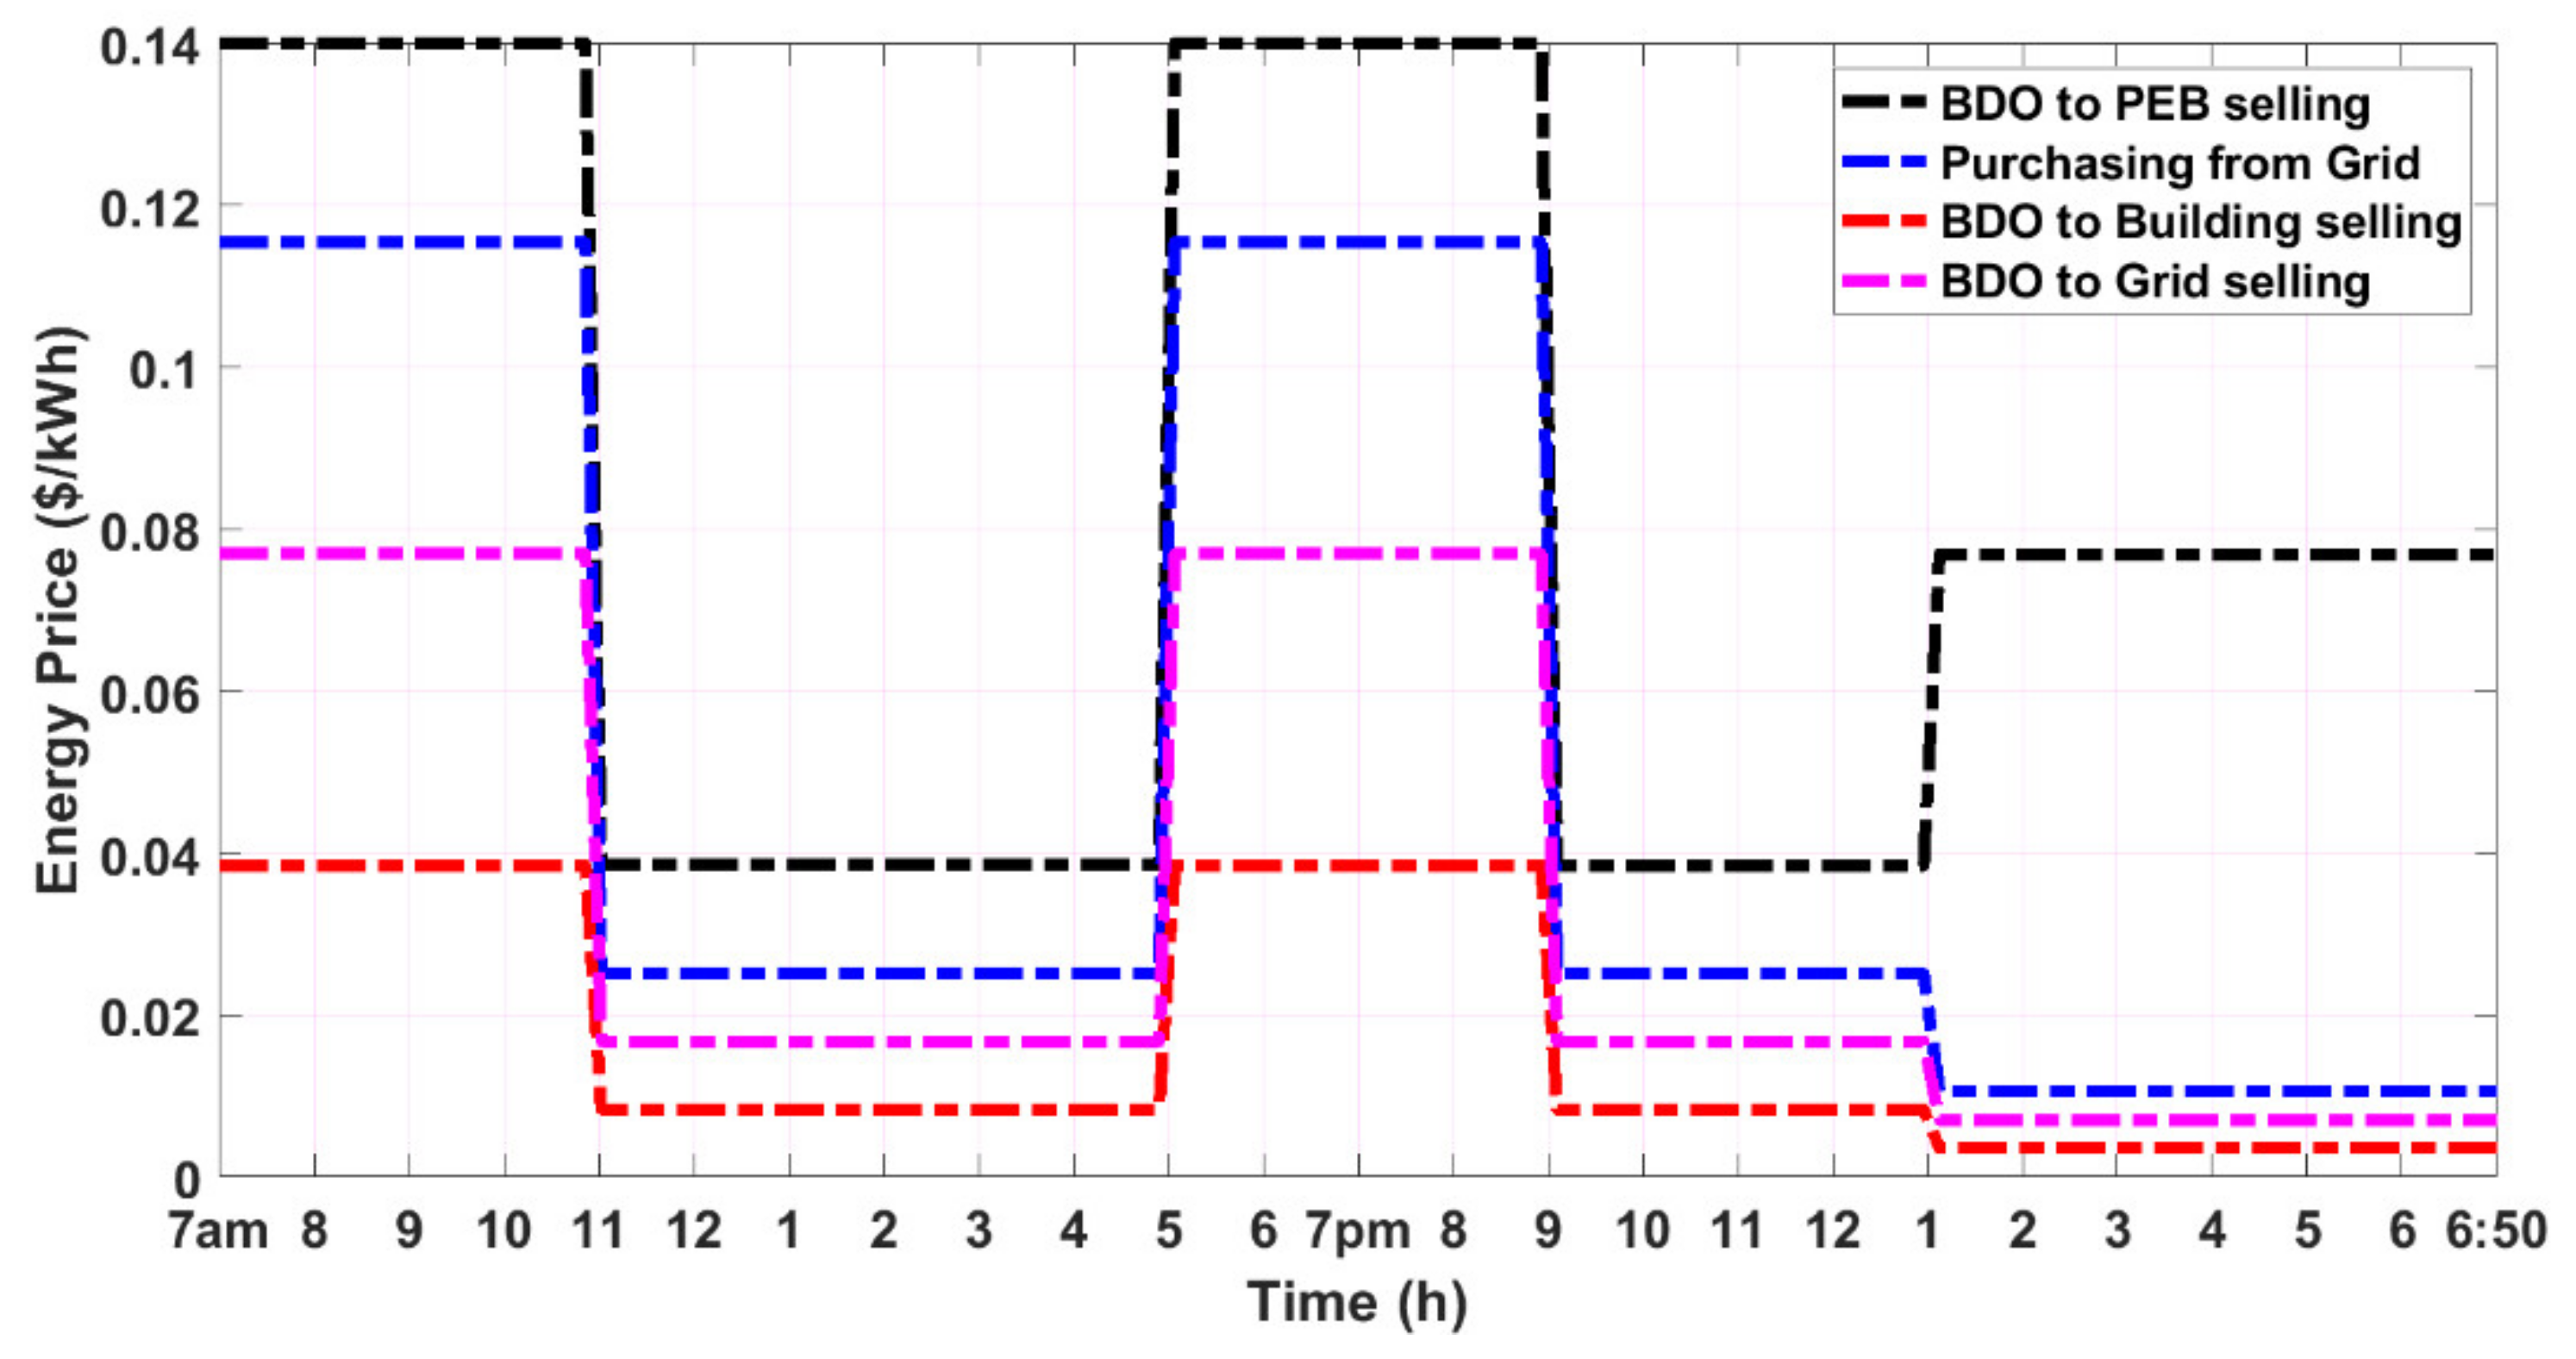
A simulation was performed for the SkyBus fleet using real-world data from Yutong PEBs [40] and SkyBus arrival and departure schedule [32]. To test the proposed coordinated and limited charge scheduling algorithm and to analyze the impact of charging PEBs on the distribution feeder, this study used one of the feeders of the Manurewa distribution system in Auckland, New Zealand. The electricity purchasing price from the grid (blue dotted line) [31] and Genesis Energy (one of the biggest distribution and generation company in New Zealand) offer selling back to the grid price (magenta dotted line) which is two-thirds of the purchasing price [28]. According to these two prices, the selling to PEB price (black dotted line) and building price (red dotted line) is set in the proposed FIT scheme for the bus depot ecosystem shown in Figure 4.
To validate the proposed model, diverse road traffic conditions, such as a different number of stops, passengers, and terrain condition were considered. The simulation was performed using Yutong PEBs (374 kWh) with three test cases: i) fully loaded bus with air condition unit fully on; ii) 50% loaded bus with air condition unit partially on; and iii) fully unloaded bus with air condition unit off. Table 3 shows the energy consumption rate for each test case.

5.1. Coordinated and Unlimited Charging and its Impact on the Grid

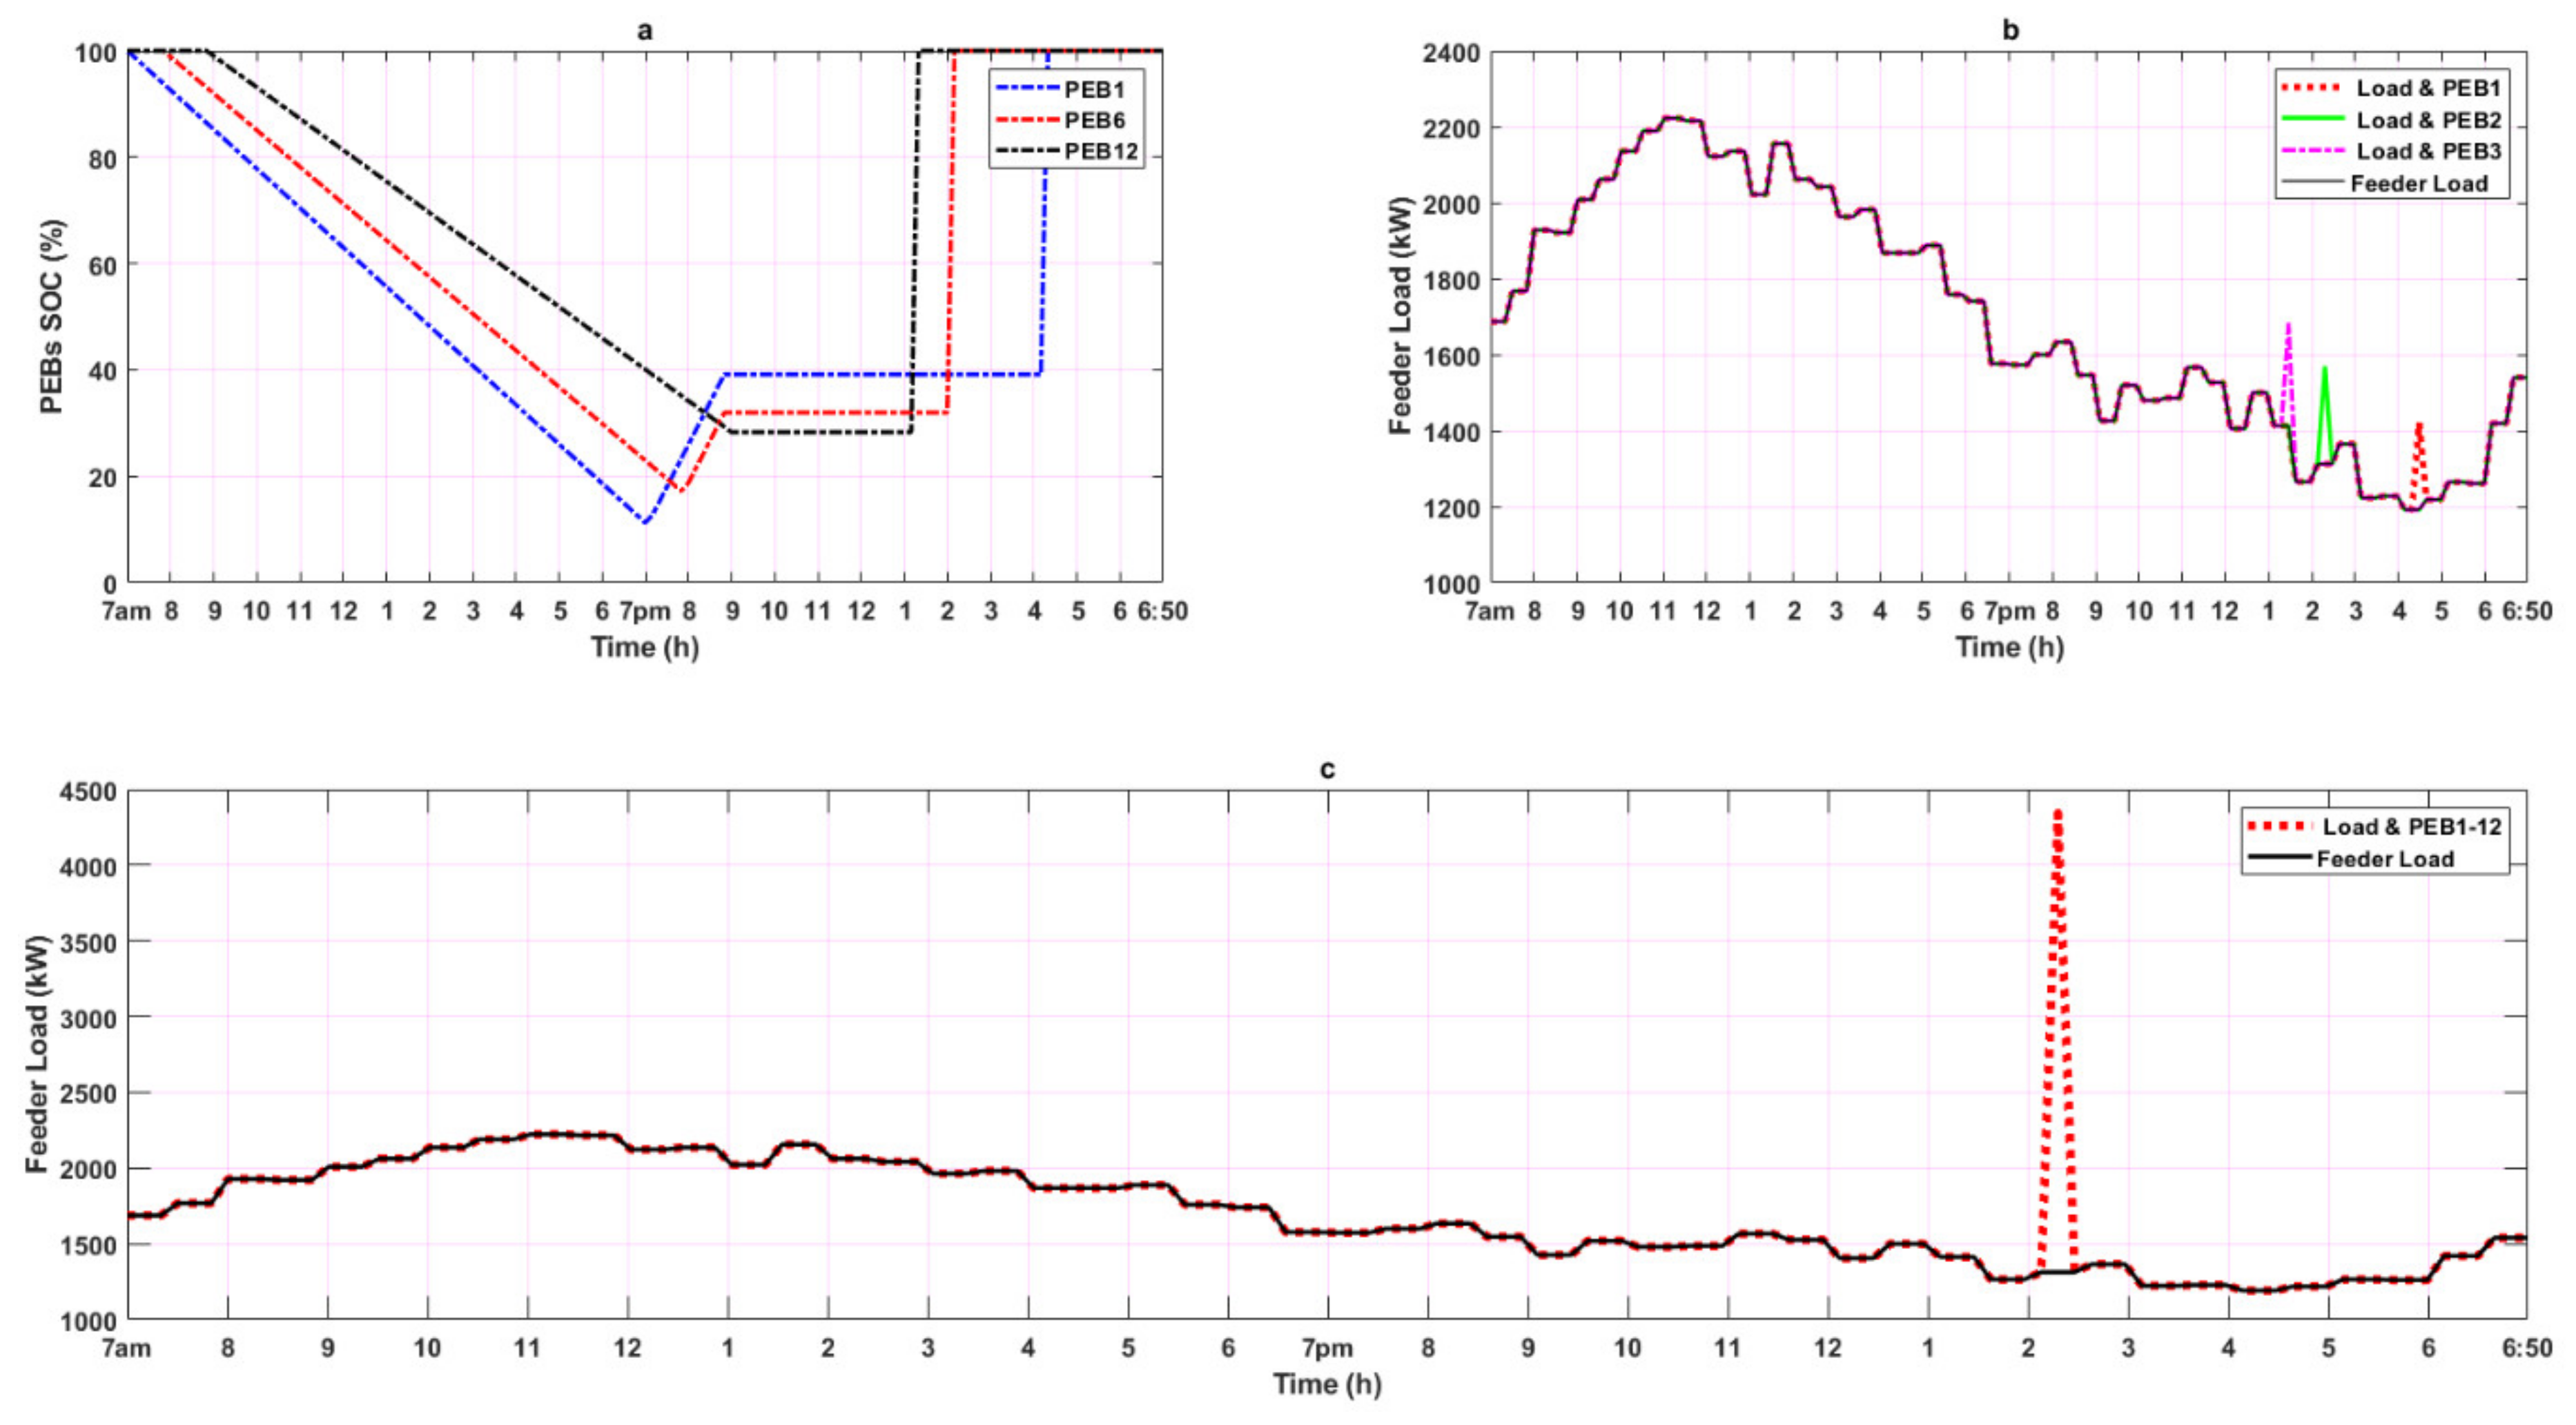
The SOC updates of PEB1, PEB6, PEB12 (corresponding to test cases I, II, and III, respectively, in Table 3) with 374 kWh battery capacity in the bus depot charging station at each time interval under coordinated and unlimited charging for the whole day is shown in Figure 5a. Due to higher SOC consumption per trip of PEB1 and PEB6 compared to PEB12, the slope of PEB1 and PEB6 are steeper than PEB12. When PEBs arrive at the bus depot, they start to charge; for example, PEB1 and PEB6 are charging upon their arrival at 7:00 pm and 7:50 pm respectively, until 9:00 pm. During these time periods, the price on the grid is high. Thus, PEB1 and PEB6 are charged from the ESS. Due to the same energy selling price to PEBs during 1:00–7:00 am (set by the BDO), PEBs can charge any time during these periods. In the coordinated and unlimited charging case, three PEBs are charged from the grid between 1:20–4:10 am and the charging impact on distribution feeder is shown in Figure 5b. The daily profit gain by the BDO under coordinated with unlimited charging was New Zealand Dollar (NZD) 251.822.
The extra load due to charging PEBs in the distribution substation causes transformer overloading. The transformer loading refers to the power (kVA) which should remain under the transformer kVA rating. If the load demand goes more than the transformer kVA rating, then the transformer can become overloaded [41]. This can happen in the unlimited PEB charging case. Even charging half of the PEB fleet (12 PEBs) at the same time (2:10 am) causes the power consumption of more than 4000 kW from the grid as shown in Figure 5c. Thus, the unlimited charging of PEBs may cause overloading in the distribution transformer and therefore the coordinated and limited charging algorithm is proposed in the next subsection.

5.2. Coordinated and Limited Charging and its Impact on the Grid

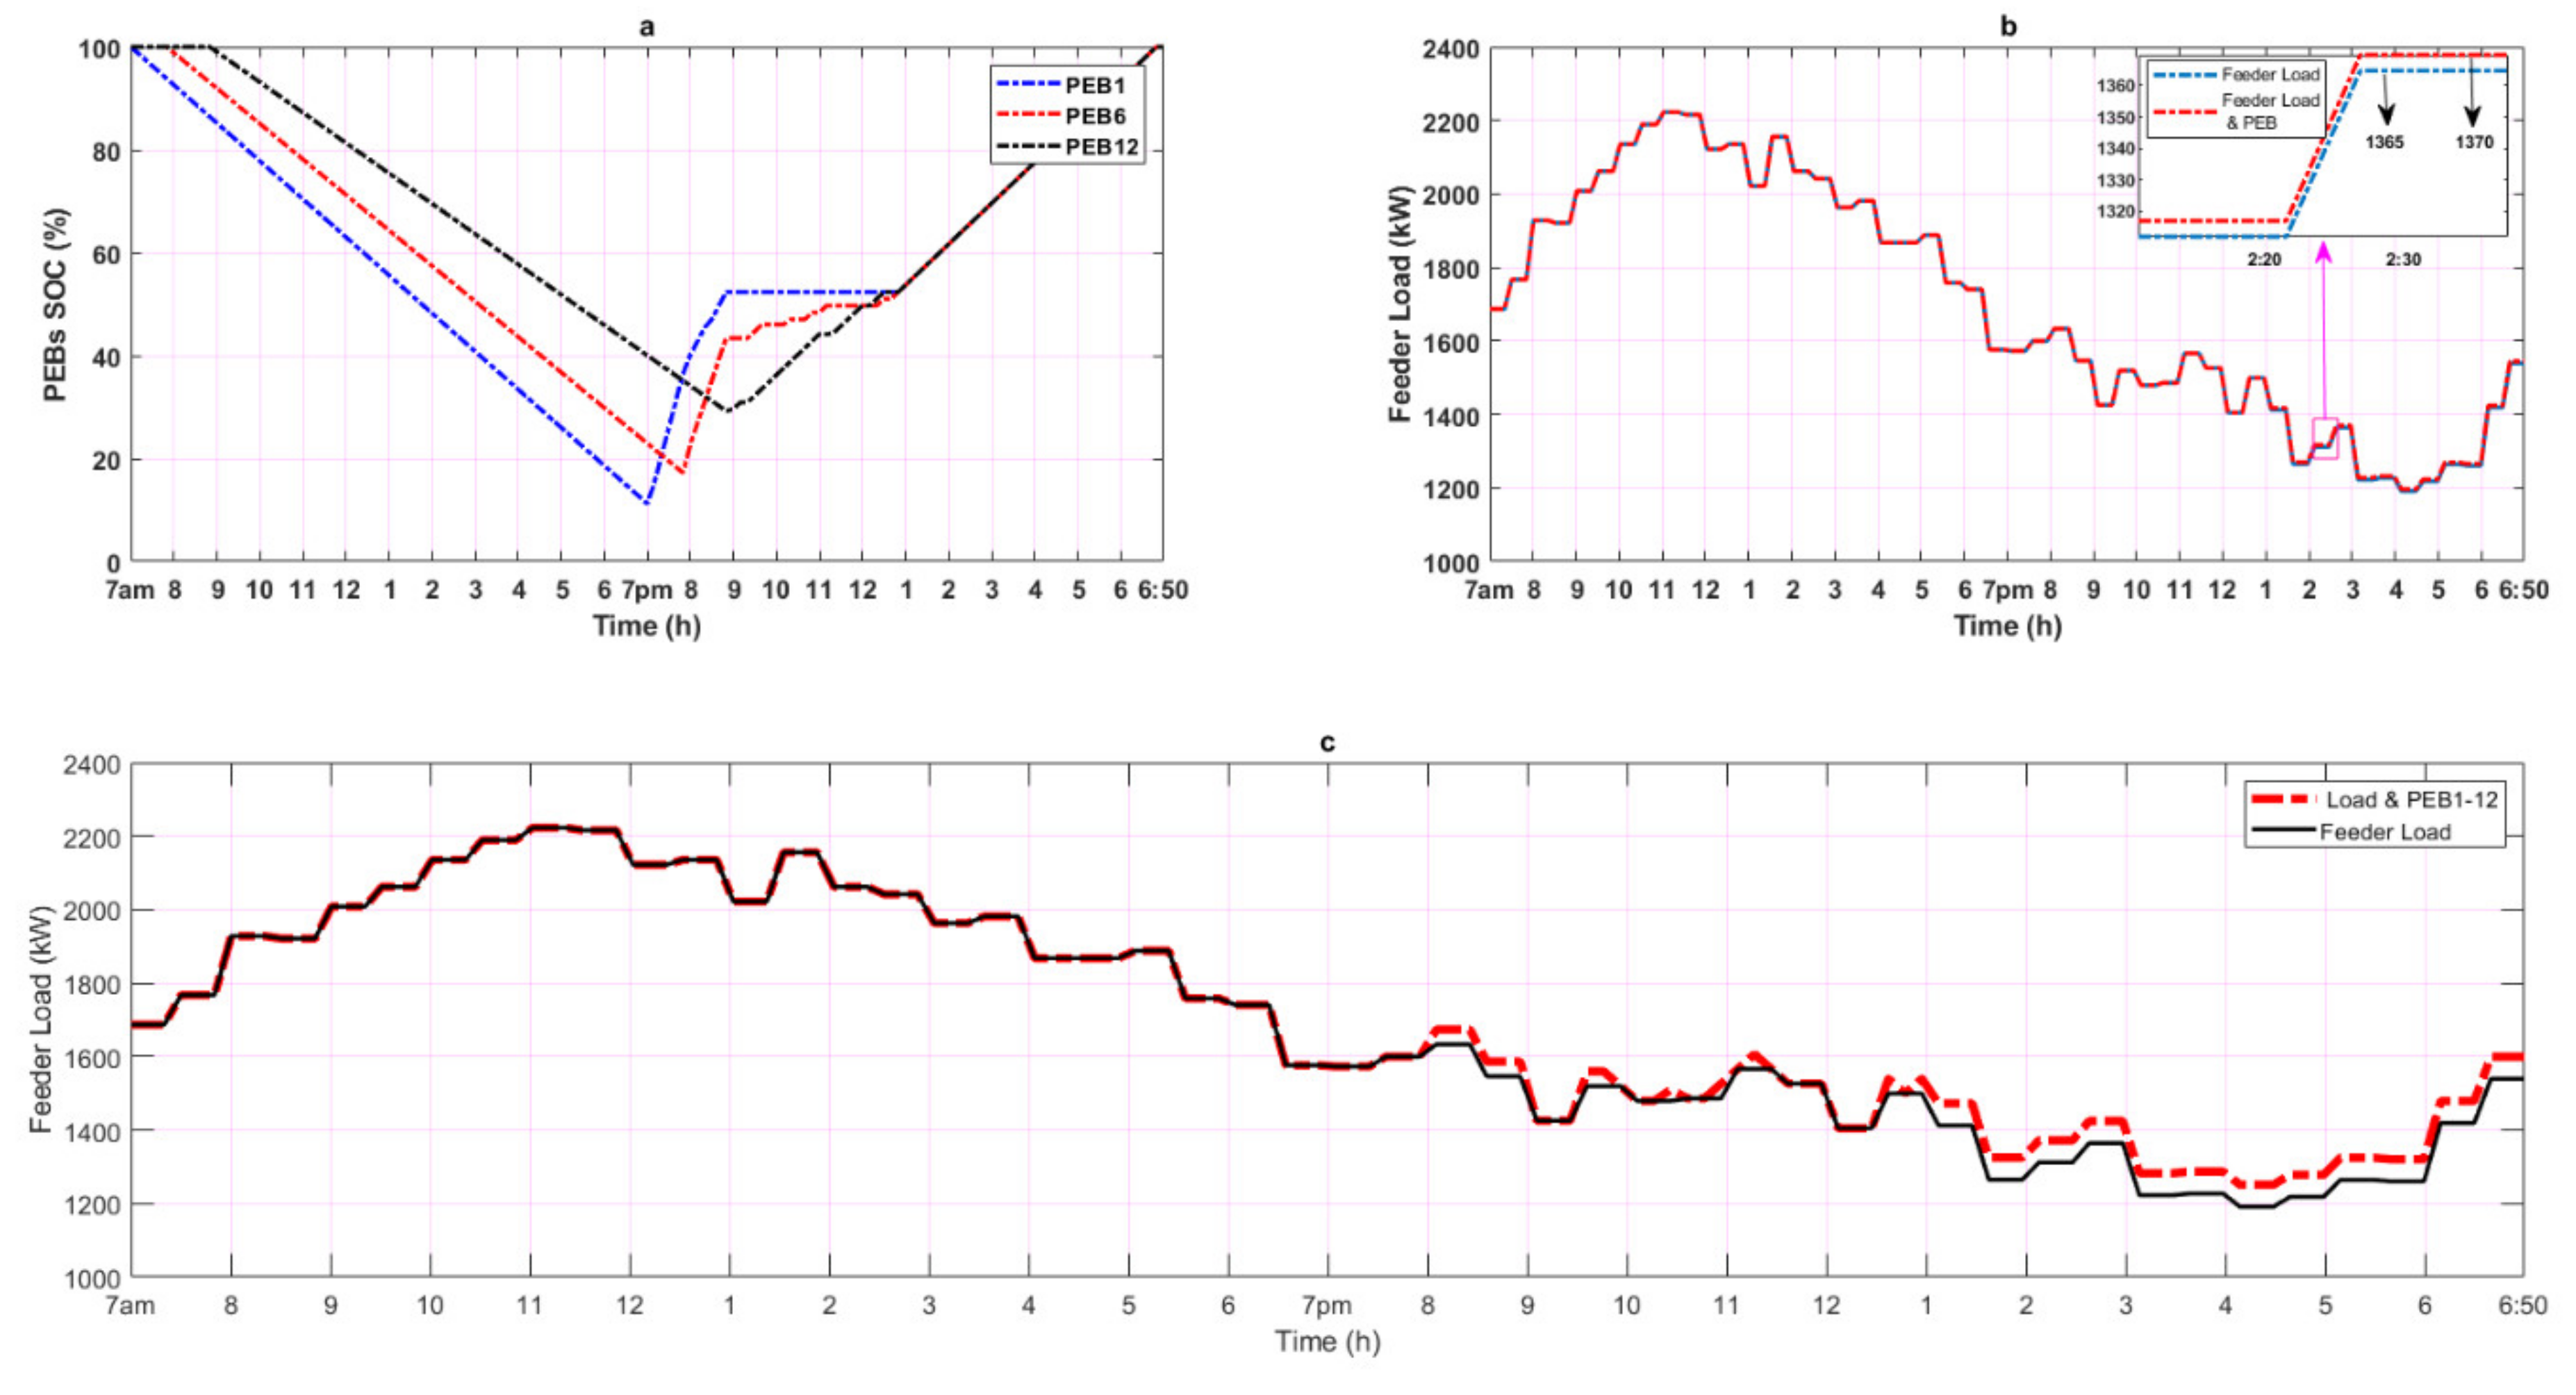
The SOC updates of PEB1, PEB6, and PEB12 (corresponding to test cases I, II, and III, respectively, in Table 3) with 374 kWh battery capacity in the bus depot charging station at each time interval under coordinated and limited charging for the whole day is shown in Figure 6a. Each of the three PEBs was on the road (with different loads) until 7:00 pm, 7:50 pm, and 8:50 pm, respectively, after which they started to charge in the bus depot charging station. Between 7:00 and 9:00 pm, the price on the grid is high, and thus PEB1 and PEB6 are charged from the ESS. After 1:00 am, all three PEBs are charged from the grid as the price and load on the grid are low. The SOC updates of all three PEBs are calculated using Equation (20).
S O C PEB i t + 1 = S O C PEB i t + P ESS 2 C t + P G 2 C t + P PV 2 C t × Δ t × η char
Considering the negative impact on the power distribution network, a limit of 5 kW is set on the allowable power injection from the grid which overcomes the transformer overloading issue. The impact of charging three PEBs on the distribution feeder (1:00–6:50 am) is very small as shown in Figure 6b. Moreover, charging half the fleet has less effect on the distribution feeder as observed in Figure 6c. The daily profit gain by the BDO in this scheme is slightly lower than unlimited charging which is NZD 233.8.

5.3. Generalization of the Findings

  • The PEBs coordinated and limited charging results for SkyBus in Figure 6 can be generalized to other public transport companies whose PEBs operate on similar battery capacity and arrival/departure schedules.
  • Since the revenue generated by the BDO for some time slot t is a parameterized function of its power and selling/purchasing price, the proposed PEB charging scheduling algorithm could be easily adapted to any future changes in the BDO’s power generation/consumption and in the electricity prices.

5.4. ESS and PV Power Supply to PEBs and Building

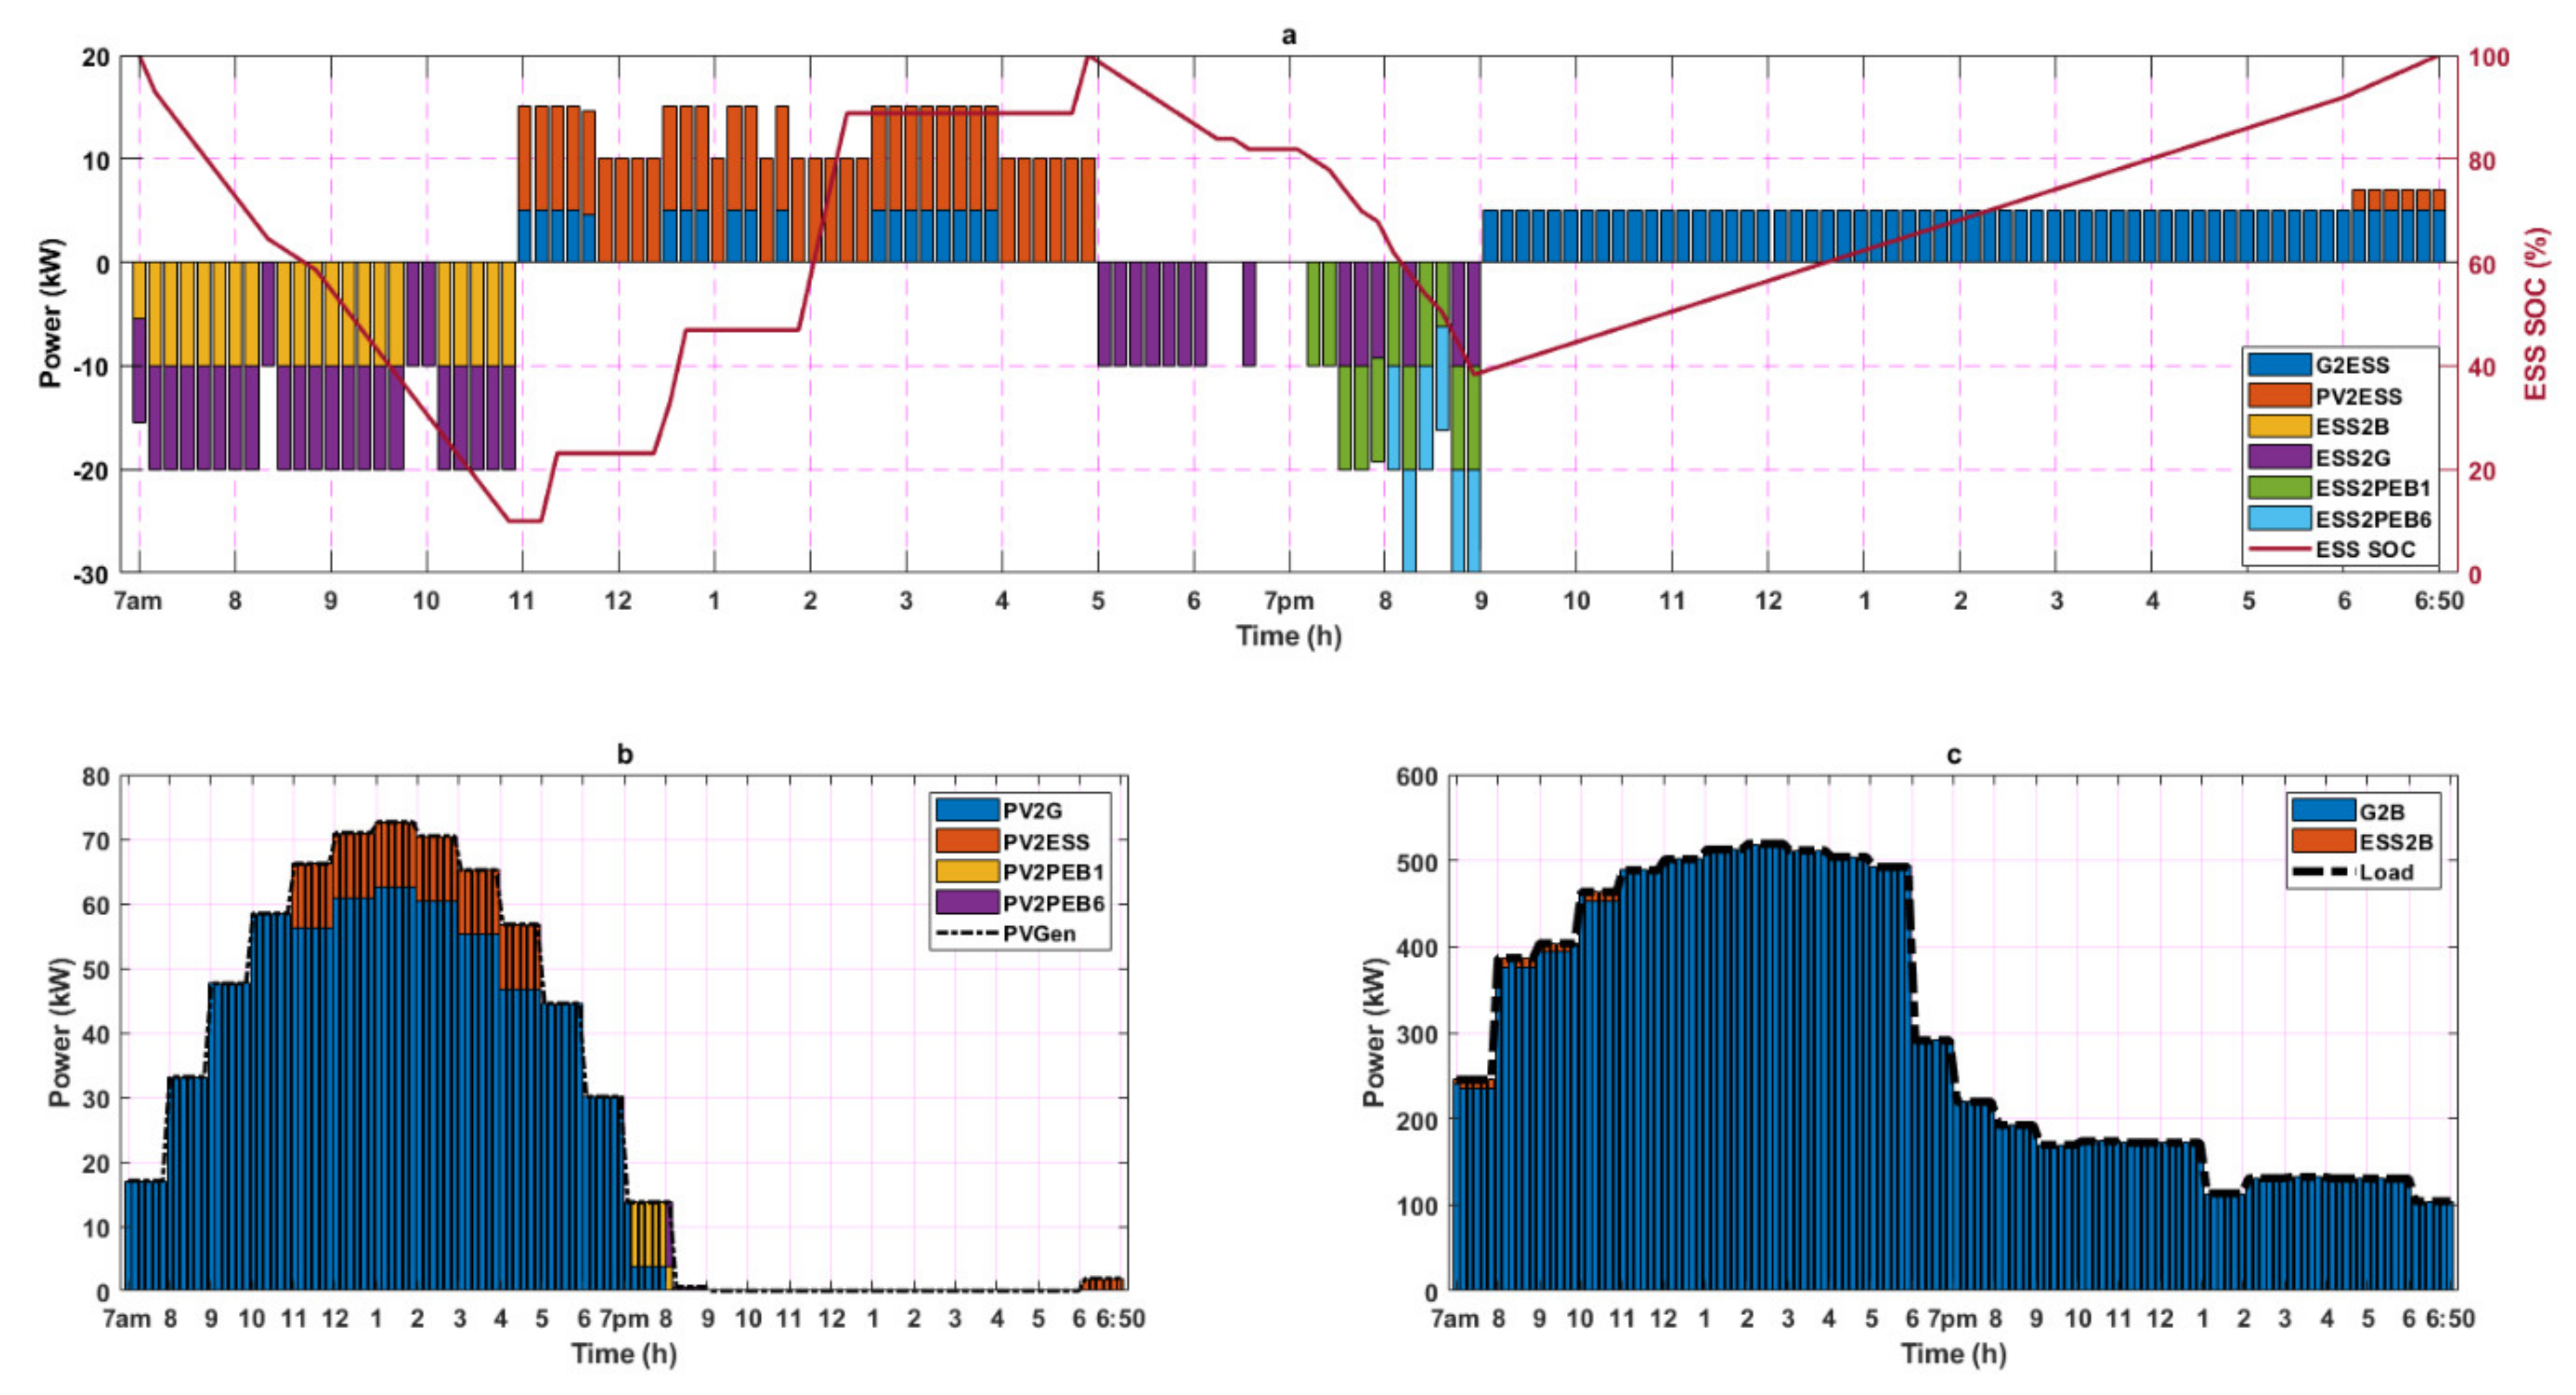
Figure 7a presents an ESS’s charging and discharging status for a full day. The positive and negative power values on the y-axis represent the ESS charging from the PV and grid and discharging to the building, grid, and PEBs, respectively. According to the proposed FIT scheme, when the price on the grid is low, the ESS will charge from the grid. The grid and building offer high prices during 7:00–11:00 am, therefore, ESS is selling power to the grid and building. However, the ESS is charging from 11:00–5:00 pm from PV and grid for future use. During the time interval 5:00–9:00 pm, some of the available power in the ESS is sold to the grid and the rest are used to charge PEB1 and PEB6 from 5:00–8:00 pm and 7:10–9:00 pm, respectively as the three PEBs (PEB1, PEB6, PEB12) arrived at the depot at 7:00 pm, 7:50 pm, and 8:50 pm, respectively, as bolded in the second to last column (round trip #6) of Table 2.
Again from 9:00 pm–6:50 am, the ESS is charging from the grid and PV (if available) to make the ESS fully charged for use the next day. The ESS SOC is updated in each time interval using Equation (21).
S O C ESS t + 1 = S O C ESS t + P G 2 ESS t + P PV 2 ESS t × Δ t × η char P ESS 2 G t + P ESS 2 B t + P ESS 2 C t × Δ t / η dis
According to the FIT scheme, the PV generated power is exported back to the grid or sold to the building or PEBs. In the current scenario, PV-generated power is not sold to the building but stored in the ESS and exported back to the grid (offers a better price than building) and some of the PV-generated power is used to charge the PEB1 and PEB6 when the price on the grid is high. The balance between the total PV power production and consumption (due to grid, ESS, PEBs, and building) is performed using Equation (22) and the results are shown in Figure 7b.
P PV t = P PV 2 G t + P PV 2 ESS t + P PV 2 C t + P PV 2 B t
To reduce the load on the distribution feeder due to higher building energy consumption arising from increased urbanization, the stored power in the ESS is used to supply power to the building when it is available. The balance between the building load demand and the total power supply (due to ESS, PV, and the grid) is determined using Equation (23) and the results are shown in Figure 7b.
B u i l d i n g _ L o a d = P ESS 2 B t + P PV 2 B t + P G 2 B t

6. Conclusions

The unlimited charging of PEBs in a bus depot charging station can maximize the daily profit of the BDO. However, it has a negative impact (i.e., build-up peak load which has an adverse effect on the loading of the distribution transformer). In this context, a mathematical model for BDO profit maximization is formulated, a coordinated with limited charge scheduling algorithm is used, and a FIT scheme is proposed for the Skybus fleet of PEBs in a bus depot ecosystem.
It was found that the coordinated with unlimited charging only maximizes the daily profit of the BDO, while the coordinated with limited charging algorithm maximizes the daily profit and minimizes the impact on the LV feeder. The daily profit for the coordinated with limited charging (5 kW) and coordinated with unlimited charging (250 kW) is NZD 233.8 and NZD 251.822, respectively. Therefore, the installation of PV and ESS in a bus depot charging ecosystem together with a coordinated with limited charge scheduling algorithm is a viable business option for the BDO and provides a complete charging solution for the PEB fleet without disrupting its departure schedule, while reducing the peak load demand on the LV feeder.

Author Contributions

Conceptualization, methodology, writing—original draft preparation, S.M.A. (Syed Muhammad Arif); writing—review and editing, supervision, investigation, and visualization, T.T.L. and B.C.S.; software, S.M.A. (Syed Muhammad Ahsan), and H.A.K. All authors have read and agreed to the published version of the manuscript.

Funding

This research received no external funding.

Acknowledgments

The authors would like to thank Vector limited for providing the feeder data.

Conflicts of Interest

The authors declare no conflict of interest.

Nomenclature

Subscripts
tHours (1–24)
iNumber of PEBs
Constants
η char ,   η dis ESS and PEB batteries charging/discharging efficiency (90%)
E min ESS t ,   E max ESS t Minimum and maximum energy level of ESS at any time interval ‘t’ (kWh)
P min ESS t ,   P max ESS t Minimum and maximum ESS power limit at any time interval ‘t’ (kW)
E min PEB i t ,   E max PEB i t Minimum and maximum energy level of PEBi at any time interval ‘t’ (kWh)
C Sell 2 G t ,   C Sell 2 B t Selling cost to grid and building at any time interval ‘t’ ($/kWh)
C Sell 2 PEB i t Selling cost to PEBi at any time interval ‘t’ ($/kWh)
C Pur fromG t Purchasing cost from grid at any time interval ‘t’ ($/kWh)
P max Grid t Maximum power grid can deliver at any time interval ‘t’ (kW)
x t , y t Binary variable associated with charging/discharging the ESS
Variables
P PV 2 ESS t ,   P PV 2 B t PV to ESS and building power flow (kW) at any time interval ‘t
P PV 2 G t ,   P PV 2 C t PV to grid and charger power flow (kW) at any time interval ‘t
P G 2 B t ,   P ESS 2 B t Grid and ESS to building B power flow (kW) at any time interval ‘t
E ESS t ,   E PEB i t Energy level of ESS and PEBi (kWh) at any time interval ‘t
P G 2 C t ,   P G 2 PEB i t Grid to charger and PEBi power flow (kW) at any time interval ‘t
P PV t ,   P max PV t PV power production (kW) and its maximum limit at any time interval ‘t
P PV 2 PEB i t PV to PEBi power flow (kW) at any time interval ‘t
P C 2 PEB i t Charger to PEBi power flow (kW) at any time interval ‘t
P G 2 ESS t Grid to ESS power flow (kW) at any time interval ‘t
P ESS 2 G t ESS to grid power flow (kW) at any time interval ‘t
P ESS 2 C t ESS to charger power flow (kW) at any time interval ‘t

References

  1. Xylia, M.; Leduc, S.; Patrizio, P.; Silveira, S.; Kraxner, F. Developing a dynamic optimization model for electric bus charging infrastructure. Transp. Res. Procedia. 2017, 27, 776–783. [Google Scholar] [CrossRef] [Green Version]
  2. Global EV Outlook 2018. Available online: https://www.iea.org/publications (accessed on 4 December 2018).
  3. Auckland’s Low Emission Bus Roadmap December 2018. Available online: https://at.govt.nz/media/1980070/low-emissions-bus-roadmap-dec-2018 (accessed on 28 April 2020).
  4. Adjusting to NZ’s changing electricity future. Available online: https://www.ea.govt.nz/about-us/media-and-publications/market-commentary/outlook/adjusting-to-nzs-changing-electricity-future/ (accessed on 8 March 2020).
  5. Saber, A.Y.; Venayagamoorthy, G.K. Plug-in vehicles and renewable energy sources for cost and emission reductions. IEEE Trans. Ind. Electron. 2010, 58, 1229–1238. [Google Scholar] [CrossRef]
  6. Kamruzzaman, M.; Benidris, M. Reliability-Based Metrics to Quantify the Maximum Permissible Load Demand of Electric Vehicles. IEEE Trans. Ind. Appl. 2019, 55, 3365–3375. [Google Scholar] [CrossRef]
  7. Khemakhem, S.; Rekik, M.; Krichen, L. A flexible control strategy of plug-in electric vehicles operating in seven modes for smoothing load power curves in smart grid. Energy 2017, 118, 197–208. [Google Scholar] [CrossRef]
  8. Korolko, N.; Sahinoglu, Z. Robust optimization of EV charging schedules in unregulated electricity markets. IEEE Trans. Smart Grid 2015, 8, 149–157. [Google Scholar] [CrossRef]
  9. Haidar, A.M.; Muttaqi, K.M.; Sutanto, D. Technical challenges for electric power industries due to grid-integrated electric vehicles in low voltage distributions: A review. Energy Convers. Manag. 2014, 86, 689–700. [Google Scholar] [CrossRef]
  10. Sun, B.; Huang, Z.; Tan, X.; Tsang, D.H. Optimal scheduling for electric vehicle charging with discrete charging levels in distribution grid. IEEE Trans. Smart Grid 2016, 9, 624–634. [Google Scholar] [CrossRef]
  11. Karfopoulos, E.; Hatziargyriou, N. Distributed coordination of electric vehicles for conforming to an energy schedule. Electr. Power Syst. Res. 2017, 151, 86–95. [Google Scholar] [CrossRef]
  12. Erdinç, O.; Taşcıkaraoǧlu, A.; Paterakis, N.G.; Dursun, I.; Sinim, M.C.; Catalão, J.P. Comprehensive optimization model for sizing and siting of DG units, EV charging stations, and energy storage systems. IEEE Trans. Smart Grid 2017, 9, 3871–3882. [Google Scholar] [CrossRef]
  13. Wu, F.; Sioshansi, R. A two-stage stochastic optimization model for scheduling electric vehicle charging loads to relieve distribution-system constraints. Transp. Res. Part B Methodol. 2017, 102, 55–82. [Google Scholar] [CrossRef]
  14. Kang, Q.; Feng, S.; Zhou, M.; Ammari, A.C.; Sedraoui, K. Optimal load scheduling of plug-in hybrid electric vehicles via weight-aggregation multi-objective evolutionary algorithms. IEEE Trans. Intell. Transp. Syst. 2017, 18, 2557–2568. [Google Scholar] [CrossRef]
  15. Shafie-Khah, M.; Siano, P.; Fitiwi, D.Z.; Mahmoudi, N.; Catalão, J.P. An innovative two-level model for electric vehicle parking lots in distribution systems with renewable energy. IEEE Trans. Smart Grid 2017, 9, 1506–1520. [Google Scholar] [CrossRef]
  16. Clement-Nyns, K.; Haesen, E.; Driesen, J. The impact of charging plug-in hybrid electric vehicles on a residential distribution grid. IEEE Trans. Power Syst. 2009, 25, 371–380. [Google Scholar] [CrossRef] [Green Version]
  17. Deb, S.; Tammi, K.; Kalita, K.; Mahanta, P. Impact of electric vehicle charging station load on distribution network. Energies 2018, 11, 178. [Google Scholar] [CrossRef] [Green Version]
  18. Abul’Wafa, A.R.; Mohamed, W.A.F. Uncoordinated vs Coordinated Charging of Electric Vehicles in Distribution Systems Performance. IEEE Trans. Intell. Transp. Syst. 2017, 19, 1814–1826. [Google Scholar]
  19. Mohamed, M.; Farag, H.; El-Taweel, N.; Ferguson, M. Simulation of electric buses on a full transit network: Operational feasibility and grid impact analysis. Electr. Power Syst. Res. 2017, 142, 163–175. [Google Scholar] [CrossRef]
  20. Thiringer, T.; Haghbin, S. Power quality issues of a battery fast charging station for a fully-electric public transport system in Gothenburg city. Batteries 2015, 1, 22–33. [Google Scholar] [CrossRef] [Green Version]
  21. Schumann, M.; Meyer, M.; Dietmannsberger, M.; Detlef, S. Demands on the Electrical Grid due to Electromobility in Hamburg. In Proceedings of the 1st E-Mobility Power System Integration Symposium, Berlin, Germany, 23 October 2017; Volume 10, pp. 1–7. [Google Scholar]
  22. You, P.; Yang, Z.; Zhang, Y.; Low, S.H.; Sun, Y. Optimal charging schedule for a battery switching station serving electric buses. IEEE Trans. Power Syst. 2015, 31, 3473–3483. [Google Scholar] [CrossRef]
  23. Yang, C.; Lou, W.; Yao, J.; Xie, S. On charging scheduling optimization for a wirelessly charged electric bus system. IEEE Trans. Intell. Transp. Syst. 2017, 19, 1814–1826. [Google Scholar] [CrossRef]
  24. Martínez-Lao, J.; Montoya, F.G.; Montoya, M.G.; Manzano-Agugliaro, F. Electric vehicles in Spain: An overview of charging systems. Renew. Sustain. Energy Rev. 2017, 77, 970–983. [Google Scholar] [CrossRef]
  25. Ko, Y.D.; Jang, Y.J. The optimal system design of the online electric vehicle utilizing wireless power transmission technology. IEEE Trans. Intell. Transp. Syst. 2013, 14, 1255–1265. [Google Scholar] [CrossRef]
  26. Leou, R.-C.; Hung, J.-J. Optimal charging schedule planning and economic analysis for electric bus charging stations. Energies 2017, 10, 483. [Google Scholar] [CrossRef] [Green Version]
  27. Li, T.; Zhang, J.; Zhang, Y.; Jiang, L.; Li, B.; Yan, D.; Ma, C. An optimal design and analysis of a hybrid power charging station for electric vehicles considering uncertainties. IEEE Ind. Electron. Soc. 2018, 5147–5152. [Google Scholar] [CrossRef]
  28. Genesis Energy. Available online: https://www.genesisenergy.co.nz/solar (accessed on 2 February 2020).
  29. National Renewable Energy Laboratory Solar Resource Data. Available online: www.pvwatts.nrel.gov/pvwatts (accessed on 20 January 2020).
  30. Ecotricity New Zealand. Available online: https://ecotricity.co.nz/electricvehicles/ (accessed on 20 January 2020).
  31. Electra Electricity Distribution Pricing. Available online: https://electra.co.nz/assets/Prices-Page/Electra-Pricing-Schedule-from-1-April-2019.pdf (accessed on 1 April 2019).
  32. Auckland City Express timetable. Available online: https://www.skybus.co.nz/timetables (accessed on 4 January 2019).
  33. General Depreciation Rates. Available online: https://www.ird.govt.nz/-/media/Project/IR/PDF/IR265.pdf (accessed on 28 April 2020).
  34. Zhang, H.; Hu, Z.; Xu, Z.; Song, Y. An integrated planning framework for different types of PEV charging facilities in urban area. IEEE Trans. Smart Grid 2015, 7, 2273–2284. [Google Scholar] [CrossRef]
  35. Hafez, O.; Bhattacharya, K. Optimal design of electric vehicle charging stations considering various energy resources. Renew. Energy 2017, 107, 576–589. [Google Scholar] [CrossRef]
  36. Cheng, K.W.E.; Divakar, B.; Wu, H.; Ding, K.; Ho, H.F. Battery-management system (BMS) and SOC development for electrical vehicles. IEEE Trans. Veh. Technol. 2010, 60, 76–88. [Google Scholar] [CrossRef]
  37. Sadeghianpourhamami, N.; Deleu, J.; Develder, C. Definition and evaluation of model-free coordination of electrical vehicle charging with reinforcement learning. IEEE Trans. Smart Grid 2019, 11, 203–214. [Google Scholar] [CrossRef] [Green Version]
  38. Ecotricity. Wind Farm Group (Airtricity) and Pioneer Generation. Available online: https://ecotricity.co.nz/electricvehicles/ (accessed on 30 December 2019).
  39. Badawy, M.O.; Arafat, M.N.; Ahmed, A.; Anwar, S.; Sozer, Y.; Yi, P.; De Abreu-Garcia, J.A. Design and implementation of a 75-kW mobile charging system for electric vehicles. IEEE Trans. Ind. Appl. 2015, 52, 369–377. [Google Scholar] [CrossRef]
  40. Yutong Electric Bus Real Time Energy Management Software. Available online: https://yutongev.vehicleplus.net/#/batterySOCManagement (accessed on 30 November 2019).
  41. Baharin, N.; Abdullah, T.A.R.T. Challenges of PHEV penetration to the residential network in Malaysia. Procedia Technol. 2013, 11, 359–365. [Google Scholar] [CrossRef] [Green Version]
Figure 1. A framework of the proposed study.
Energies 13 02139 g001
Figure 2. Bus depot charging ecosystem.
Energies 13 02139 g002
Figure 3. Skybus route between Auckland Airport and Auckland central business district (CBD).
Energies 13 02139 g003
Figure 4. Proposed feed-in tariff (FIT) scheme for bus depot charging ecosystem.
Energies 13 02139 g004
Figure 5. Coordinated and limited charging: (a) state of charge (SOC) of three PEBs; (b) impact of charging three PEBs; and (c) impact of charging 12 PEBs on the low voltage (LV) feeder.
Energies 13 02139 g005
Figure 6. Coordinated and limited charging: (a) SOC of three PEBs; (b) impact of charging three PEBs; and (c) impact of charging 12 PEBs on the LV feeder.
Energies 13 02139 g006
Figure 7. (a) SOC of ESS in a single day; (b) PV generation and supply; and (c) building load demand and supply.
Energies 13 02139 g007
Table 1. Photovoltaic (PV), energy storage system (ESS), and charger total system and recovery costs (NZ$).
System ComponentsPVESSCharger
System Size100 kW500 kWh50 kW
Price per W/Wh0.4110.260N/A
Estimated life span (year)251025
Total system cost41,100130,00045,000
Recovery cost/day 3.674.9862.99
Table 2. Skybus arrival and departure schedule (airport to city only).
Round Trip#PEB#To CityStopoversTo AirportStopovers
DepartureArrivalDepartureArrival
117:00 am7:520:088:008:520:08
27:108:020:088:109:020:08
37:208:120:088:209:120:08
47:308:220:088:309:220:08
57:408:320:088:409:320:08
67:508:420:088:509:420:08
78:008:520:089:009:520:08
88:109:020:089:1010:020:08
98:209:120:089:2010:120:08
108:309:220:089:3010:220:08
118:409:320:089:4010:320:08
128:509:420:089:5010:420:08
219:009:520:0810:010:520:08
3-------
4-------
5-------
615:00 5:520:086:006:520:08
25:106:020:086:107:020:08
35:206:120:086:207:120:08
45:306:220:086:307:220:08
55:406:320:086:407:320:08
65:506:420:086:507:420:08
76:006:520:087:007:520:08
86:107:020:087:108:020:08
96:207:120:087:208:120:08
106:307:220:087:308:220:08
116:407:320:087:408:320:08
126:507:420:087:508:420:08
Table 3. One trip energy consumption for Skybus (airport to city).
Test CasesEnergy Consumption (Yutong)Energy ConsumptionTotal Energy Consumption
(One Trip)
RouteStops
I1.1 kWh/km22.55 kWh5.4 kWh27.95 kWh
II1.0 kWh/km20.5 kWh5.4 kWh25.9 kWh
III0.9 kWh/km18.45 kWh3.6 kWh22.05 kWh