Article

Design, Development and Thermal Analysis of Reusable Li-Ion Battery Module for Future Mobile and Stationary Applications

by
Arun Mambazhasseri Divakaran
1,
Dean Hamilton
2,
Krishna Nama Manjunatha
2 and
Manickam Minakshi
3,*
1
Department of Mechanical Engineering, De Montfort University, Leicester LE1 9BH, UK
2
Emerging Technologies Research Centre, De Montfort University, Leicester LE1 9BH, UK
3
Engineering and Energy, Murdoch University, Murdoch, WA 6150, Australia
*
Author to whom correspondence should be addressed.
Energies 2020, 13(6), 1477; https://doi.org/10.3390/en13061477
Submission received: 17 January 2020 / Revised: 11 March 2020 / Accepted: 17 March 2020 / Published: 20 March 2020

Abstract

:
The performance, energy storage capacity, safety, and lifetime of lithium-ion battery cells of different chemistries are very sensitive to operating and environmental temperatures. The cells generate heat by current passing through their internal resistances, and chemical reactions can generate additional, sometimes uncontrollable, heat if the temperature within the cells reaches the trigger temperature. Therefore, a high-performance battery cooling system that maintains cells as close to the ideal temperature as possible is needed to enable the highest possible discharge current rates while still providing a sufficient safety margin. This paper presents a novel design, preliminary development, and results for an inexpensive reusable, liquid-cooled, modular, hexagonal battery module that may be suitable for some mobile and stationary applications that have high charge and or discharge rate requirements. The battery temperature rise was measured experimentally for a six parallel 18650 cylindrical cell demonstrator module over complete discharge cycles at discharge rates of 1C, 2C and 3C. The measured temperature rises at the hottest point in the cells, at the anode terminal, were found to be 6, 17 and 22 °C, respectively. The thermal resistance of the system was estimated to be below 0.2 K/W at a coolant flow rate of 0.001 Kg/s. The proposed liquid cooled module appeared to be an effective solution for maintaining cylindrical Li-ion cells close to their optimum working temperature.

Graphical Abstract

1. Introduction

Global warming and air pollution are driving the development of new technological innovations that reduce carbon emissions by reducing the world’s dependence and use of fossil fuels. Two of the main ways of realizing this are by the electrification of almost all types of transportation systems and by the implementation of renewable energy generation. Large battery storage systems are key parts of the electrification of transport vehicles and stationary grid-tied and off-grid energy storage systems. The development of lithium-ion batteries, in particular, have paved the way for revolutionary changes in transport system developments, driven by the planned sales ban of new combustion engine vehicles by governments worldwide, in favour of battery-powered battery electric vehicles (BEVs), for example. Among all available electrochemical storage cells, the Li-ion battery (LIB) is favoured for high power-demanding applications [1]. Compared to other types, lithium-ion batteries currently possess the best balance of high-power density, long battery life, fast charging rate, and fast discharging rate. This has made LIBs the technology of choice for large capacity battery systems for road and sea electric vehicles, solar power storage, and wind power storage [1,2]. However, safety, cost, and lifetime are some of the main challenges for many Li-ion battery material chemistries when used in energy storage systems [2]. For solid-state LIB cells and advanced electrode materials, the safety issue is not a major concern as long as they are operated within specification. However, long-term cell performance is very sensitive to the cell operating temperature, and cell storage capacity can degrade quickly if the temperature is not maintained within a narrow range (25–50 °C) during charging and discharging. This degradation is caused primarily by a temperature rise due to electrochemical reactions in the electrolytes used and the degradation of anode materials, cathode materials, and internal short circuits caused by dendrites. The cells generate heat by current passing through their internal resistances. However, chemical reactions can generate additional, sometimes uncontrollable heat if the temperature within the cells reaches a reaction onset temperature. The onset temperatures for these reactions varies for different Li-ion chemistries but is usually in the region of 90–120 °C for common commercially available LIBs [3] but can be as low as 50 °C for some chemistries. Therefore, numerical simulation and finite element analysis (FEA) have become essential tools for studying, developing, and optimizing the electro-thermal behaviour of LIBs [2].
In the present work, the heat generation during the full discharge cycles of individual 18650 Li-polymer cells were investigated by FEA and experimentally for 1C, 2C, and 3C discharge rates. An understanding of the internal heat generation characteristics of LIBs is an important step towards designing and developing an optimal battery thermal management system (BTMS) for a lithium-ion battery [3]. In addition, a hexagonal liquid cooled battery module with six parallel Li-polymer cells was prototyped with the aid of FEA, and it was experimentally evaluated to determine the cell temperature rises for the same 1C, 2C and 3C discharge rates. The hexagonal design enables an optimum packing density of these liquid-cooled modules for any cylindrical battery cells. The main aim was to develop a low cost, lightweight, and scalable liquid cooling system with high cooling performance for cylindrical LIBs. The optimization of the cooling system is required to avoid the LIBs experiencing capacity-degrading high and low temperatures and a destructive thermal runaway to ensure a high performance, a long life, and safe operation [4,5]. Other key design features are the ease of manufacture and assembly, recyclability, serviceability, and re-usability; these latter features reduce the cooling system whole life cost.

1.1. Heat Generation in Li-Ion Batteries (LIBs)

LIBs are energy storage systems that can convert stored chemical energy into electrical energy and vice versa as a result of insertion reactions in the cathode and anode materials, respectively. A lithium-ion battery consists of a positive electrode (cathode), a negative electrode (anode), an electrolyte, a separator, a current collector, and a stainless-steel case. The most commonly used anode materials are carbon or lithium titanate, Si, and Si-composites. The cathode materials are predominantly made of oxides of transition metals such as [6,7]:
LiCoO 2 ,   LiNiO 2 ,   LiMn 2 O 2 ,   LiFePO 4 , LiNiCoAlO 2   and   LiNiMnCoO 2
Typical examples of electrochemical reactions (Equations (1) and (2)) are provided below, and the general construction of a conventional LIB is depicted in Figure 1 [7]. Electrodes are the principal components that determine the capacity and energy density of batteries. An aqueous/non-aqueous solution of lithium-containing salts in an organic liquid mixture is commonly used as the electrolyte [8,9]. A separator is used to separate cathode and anode to prevent internal short circuits [10,11].
Cathode :   Li 0.5 CoO 2 + xLi +   Li 0.5 + x CoO 2
Anode :   LiC 6 Li 1 2 x C 6 + 2 xLi + + 2 xe
Heat generation and temperature non-uniformity in the cells are the main concerns and drawbacks for large battery systems, as required for the propulsion system applications [12]. The internal heat generation is derived from the thermodynamics Equations (3)–(6) [12].
Q = Δ G + T Δ S + W el ,
Δ G = nFE eq
Δ S = nF dE eq dT ,
W el = nFE ,
where Q is the internal heat generation per unit volume (W·m−3), ∆G is Gibbs free energy (KJ), ∆S is the entropy change J·K−1, F is Faraday’s constant C·mol−1, n is the order of electrochemical reaction or the number of electrons involved in chemical reaction, Eeq is the equivalent electromotive force V, and Wel is the electric work J.
The total internal heat generation is given by Equation (7) [13] as the sum of the reversible and irreversible heat:
Q = I × ( V 0 V T V 0 T ) ,
where I is the current density (Am−2), V0 is the open circuit voltage, V is the voltage of the cell at each time interval of the discharge process, T is the temperature (K or °C), and I× (V0 − V) and I × (T V 0 T ) are the irreversible and reversible heat generation terms, respectively.
Irreversible heat generation occurs at high discharge rates due to the cell internal resistance and joule heating. At lower discharge rates, reversible heat generation is caused by entropy changes at the cathode and anode. The methods of the precise determination of internal temperatures at different discharge rates and using the thermo–physical properties are essential for the optimized design of battery thermal management systems [14,15].

1.2. Thermal Runaway

When sufficient heat is generated due to chemical reactions within the batteries, an uncontrolled rise in temperature most commonly known as the thermal runaway can occur. The thermal runaway is one of the major failure mechanisms of Li-ion batteries, and it is a primary safety concern. The electrolytes are extremely flammable and can ignite if there is a sufficient rise in temperature, possibly resulting in an explosion or fire, capacity loss, property change with ageing, and short circuit. Repeated charge discharge cycling ages the lithium ion battery, which loses the capacity and the thermal runaway is one mode of failure in cells. It occurs when the exothermic reaction is uncontrollable, which increases the temperature, thus causing a further increase in temperature and then a further increase in reaction rate. The heat that is generated during an exothermic reaction within the batteries follows exponential functions, while heat removal is a linear function [16]. The onset temperature for a chemical reaction is chemistry-dependent and is usually above 90 °C, which potentially leads to a thermal runaway [3]. However, it can be as low as 50 °C for some chemistries such as Li–S. A thermal runaway occurs when the temperature rises above 130–150 °C, and the internal temperature increases as the exothermic chemical reactions set in between the electrolyte and electrode increases [16].
J Seo et al. [17] investigated the thermal characteristics of Li–sulphur and Li–sulphur composites to calculate the reversible entropy heat and irreversible resistive heat generated over the discharge process of the batteries. The onset temperature for the Li–sulphur and Li–sulphur composites during lithiation and de-lithiation are approximately in the range of 50–60 and 120–180 °C, respectively [17]. Meanwhile, the onset temperature for the LIBs generally ranges between 90 and 120 °C, and it varies with the material chemistry of the cell [18].

2. Battery Thermal Management System (BTMS)

The primary purpose of the BTMS is to maintain LIB temperatures within an optimum operating range during charging and discharging; this is usually between 30 and 50 °C. Doing this avoids safety concerns while improving the performance and lifespan of the LIB’s. An effective BTMS can offer the best balance between ageing and performance [19]. A complete understanding of the real-time thermal response of the LIBs during different application load profiles is important to develop an efficient BTMS [20]. During thermal modelling by computer simulation, the internal heat generation due to electrochemical reactions, heat conduction through the cell, and the thermo-physical properties of the LIBs should all be taken into account [21].

2.1. LIB Cooling Methods

Liquid and forced-air cooling are the two most commonly adopted methods for electric vehicles and other large battery storage applications. Typical air and indirect liquid cooling systems are depicted in Figure 2a,b. Recent studies have mainly been focused on these methods at the cell and multi-cell module levels.
For high discharge rates (≥3C), liquid cooling is generally more effective than air cooling, and it is usually the quietest and most compact solution. However, the leakage of the coolant is possible, and this will drastically reduce cooling performance, so the long-term reliability of liquid cooling systems is seen as a major issue even though they are essential and widely adopted. Complexity and cost are also challenges for very large battery systems [20]. Coolants that have a high thermal conductivity, a good specific heat capacity, and a low viscosity help to improve the cooling system performance. The leakage of some coolant types, e.g., glycol, can cause electrical short circuits and electrochemical corrosion. However, dielectric solutions such as de-ionized water, silicon-based oils, and mineral oils can be used to avoid these issues [20].
At lower discharge rates, forced-air cooling systems are often used because they provide adequate performance for many applications, are relatively low cost, have extremely high reliability, and are simpler to implement than liquid cooling systems. Air cooling works by passing air over the surface of the cells, which absorb heat and exhaust it into the atmosphere. However, the achievable thermal resistance is generally much higher than for liquid cooled systems, so the achievable discharge rate is lower than for liquid cooling [20]. Because the Li-ion cells represent a very high portion of the overall battery system cost, the required maximum discharge rate needs to be realized with the least possible number of parallel cells. For high discharge rate, cost-sensitive applications, such as electric vehicles, liquid cooling would have the best cost versus discharge performance.
Riza et al. [21] demonstrated a passive cooling system for 18650 cell module, and its thermal modelling indicated that phase change material (PCM)-graphite matrix can spread heat very quickly due to its high thermal conductivity. Moreover, the use of this passive cooling with a PCM-graphite matrix helped in achieving a uniform temperature in the cell module during normal and stressed conditions, hence preventing the propagation of the thermal runaway due to defects on the single cell within the module [21]. Such a solution might be used to increase the transient discharge rate performance of air-cooling systems, and liquid cooling may have even prevented the propagation of the thermal runaway due to defects on the single cell within the module.
Air cooling, liquid cooling, and cooling using phase change materials have been studied extensively [21]. Heat pipe (HP) cooling systems have also been experimentally investigated thoroughly, including for hybrid electric vehicles (HEVs) [22]. Heat pipe cooling systems have a high thermal conductivity and are lightweight, which make them a promising candidate for battery cooling. Orientation, the structure of the heat pipe, the filling ratio, the tubes material, the heat input, and the working fluid are the parameters and factors that determine the thermal performance of HP cooling systems. A heat pipe cooling system has three major components; an evaporator zone, an adiabatic zone, and a condenser zone, as shown in Figure 3. The adiabatic zone exists where a gap between the condenser and the evaporator exists, working fluid inside the heat pipe absorbs heat from the heat source, liquid evaporates, and the vapor is transported to the condenser zone where it condenses to liquid and is transported back to the evaporator zone; this cycle is repeated several times for a continuous heat transfer process. This transport of vapor and liquid might be either due to capillary action, gravity-assisted instability, or pressure instability within the HPs. Capillarity-structured HPs, thermosiphon, and pulsating heat pipe are some of the typical HPs that use these phenomena in the transportation of fluid and vapor [23,24].

2.2. Thermal Modelling of LIBs

Emre Gümüsu et al. [25] developed a 3D computational fluid dynamics (CFD) model to predict the temperature variation of LIBs subjected to discharge, using natural convection and electrical performance data. This study demonstrated that their 3D CFD model could solve conduction heat transfer problems within the cell and convection heat transfer between the cell surface and its surroundings when fluid is flowing around the cell. Moreover, this study also proved that among the thermophysical property values of the cell, specific heat values act as the major parameters and thermal conductivity acts as the minor parameter that affects cell temperature [25]. Lip Huat Saw et al. conducted CFD and experimental analysis for a battery pack designed for air cooling [26]. Their simulations predicted the locations of hot spots and cold spots in the battery pack. They also demonstrated that increasing the air flow rate resulted in an increased heat transfer coefficient and pressure drop, which resulted in better heat transfer rate. A correlation with the Nusselt and Reynolds numbers was also developed, and the numerical results showed a close agreement with the experimental results.

3. Design and Thermal Analysis of Prototype Battery Module

The present study mainly focused on the design of a novel reusable Li-ion battery module with integrated liquid cooling tubes. 
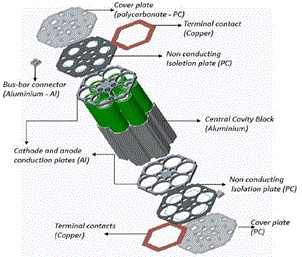
Figure 4 shows the virtual prototype of the module that incorporated six 18650 cells, supplying a nominal voltage of 3.6 V and an overall capacity of 15 Ah. This module was mainly designed for a Formula Student battery electric racing car. However, this design can also be used for stationary storage applications such as solar power and wind power.
This design is highly flexible, scalable, and easy to manufacture, and almost all of the components can be reused and are recyclable. This design is not completely optimized; a slight increase in size radially, for example, would enable one more LIBs to be accommodated at the centre of the module. The cooling tubes are accommodated in the space between adjacent cylindrical cells. The tube diameter can be increased if additional cooling performance is required, though this occurs by increasing the cell spacing and decreasing the power density of the module. The cooling tubes are in close contact with the central cavity block, which is in intimate contact with the surface of each LIB cell. The cavity block holds the cells firmly in position and conducts heat from their surface into the cooling tube and associated liquid coolant. Additionally, conductive plates extract heat from the terminal ends of the module while also holding the cooling tubes in place. Hexagonal copper terminal strips with dimpled surfaces make pressure contact with the positive and negative terminals and connect the cells parallel. There are many alternative connection methods for the electrical connections, including spring contacts and welded contacts. Plates made from insulating materials are used to cover the majority of the contact, but they enable a through-connection between a suitably sized bus-bar connection and the embedded copper terminals at both ends of the module.

3.1. Simulation Analysis of the LIB Cell and the Module

The 18650 LIB was modelled in Creo 3.0 and imported to the Ansys Workbench Fluent finite element simulation software for 2C dry discharge analysis (cooling pump off). The thermo-physical properties, and the values used are shown in Table 1 [25]. 
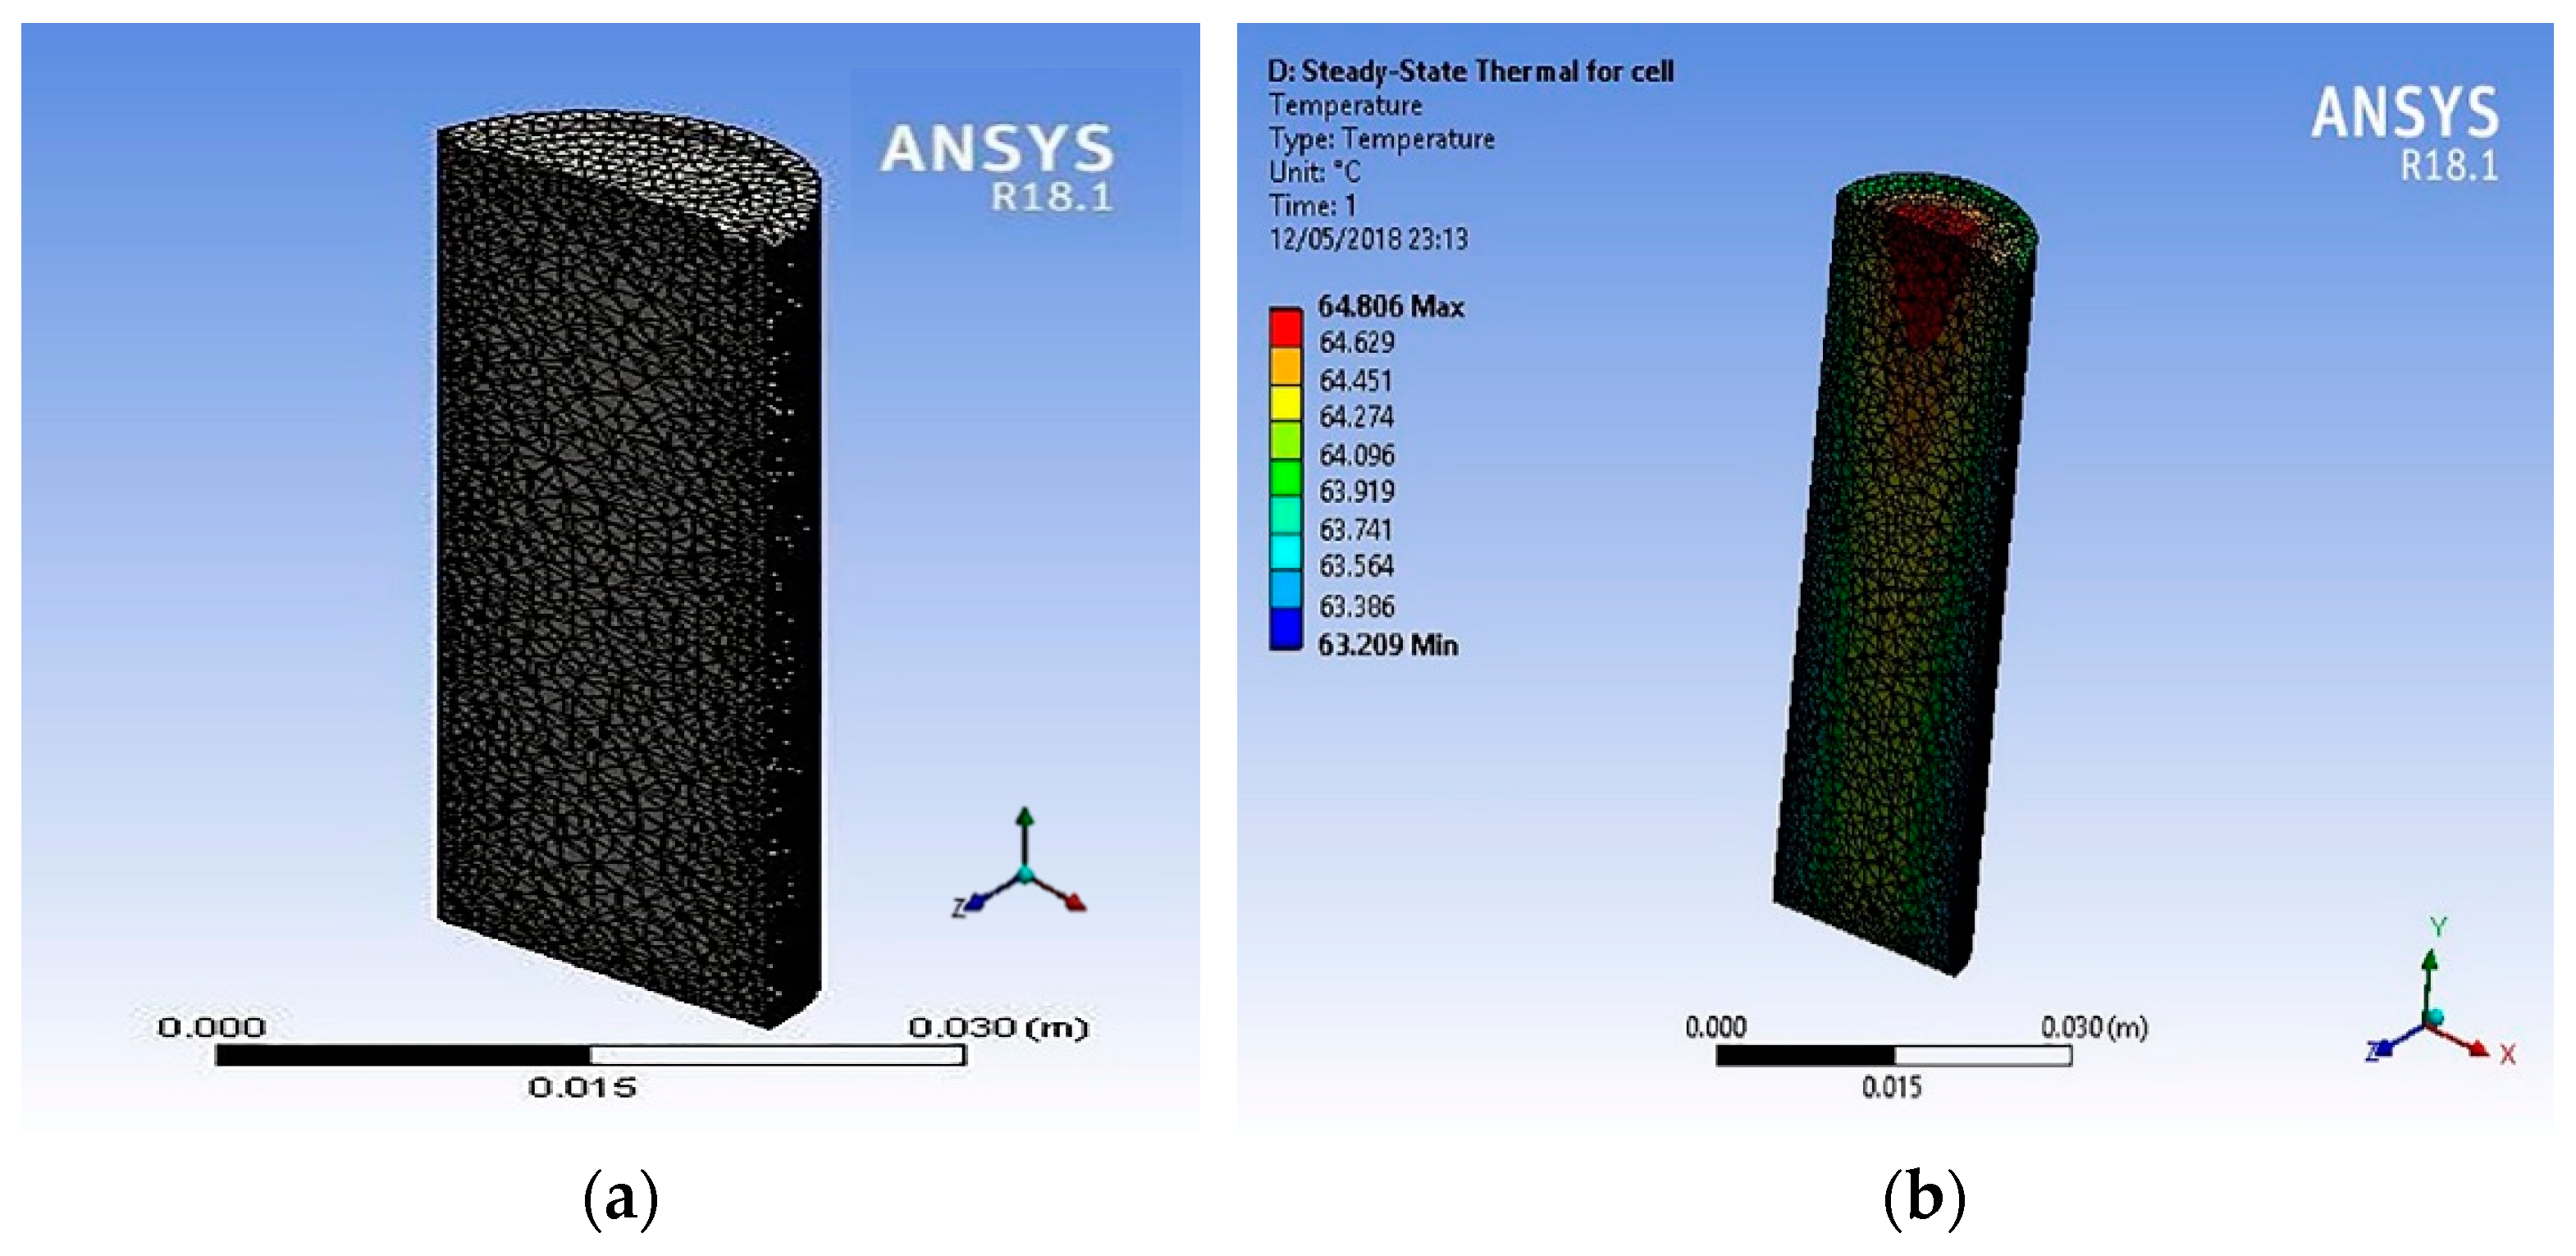
Figure 5 shows the simulation results for the 18650 LIBs as a cell when discharged at 2C rate. The cell model was imported to Ansys, and tetrahedral meshing was used. The internal heat generation values used in these simulation were calculated by using empirical relations Equations (8) and (9) provided for Sony 18650 LIBs [10]. These equations were solved with MATLAB to estimate the heat generation values in W/m3. These values were used for the steady state Ansys thermal analysis of the LIB single 18650 cell model. The simulation results showed that the maximum temperature was ~64 °C at the positive anode terminal end and gave an axial temperature difference of ~1 °C.
q ˙ = R i I 2 IT Δ S nF
R i = { 2.258 × 10 6 SOC 0.3958 ;   T = 20   ° C 1.857 × 10 6 SOC 0.2787 ;   T = 30   ° C 1.659 × 10 6 SOC 0.1692 ;   T = 40   ° C }
SOC = 1 I t C O ,
Δ S = { 99.88 SOC 76.67 0 SOC 0.77 30 0.77 SOC 0.87 20 0.87 SOC 1 } ,
where q ˙ is the heat generation per unit volume W·m−3, Ri is the internal equivalent resistance of the unit volume of the LIB Ω·m−2, SOC is the state of charge, ∆S is the entropy change J·mol−1·K−1, I is the discharging electric current per unit volume A·m−3, t is the time s, Co is the battery capacity A.h, T is the temperature K, and F is Faraday’s constant 96,485 C·mol−1.
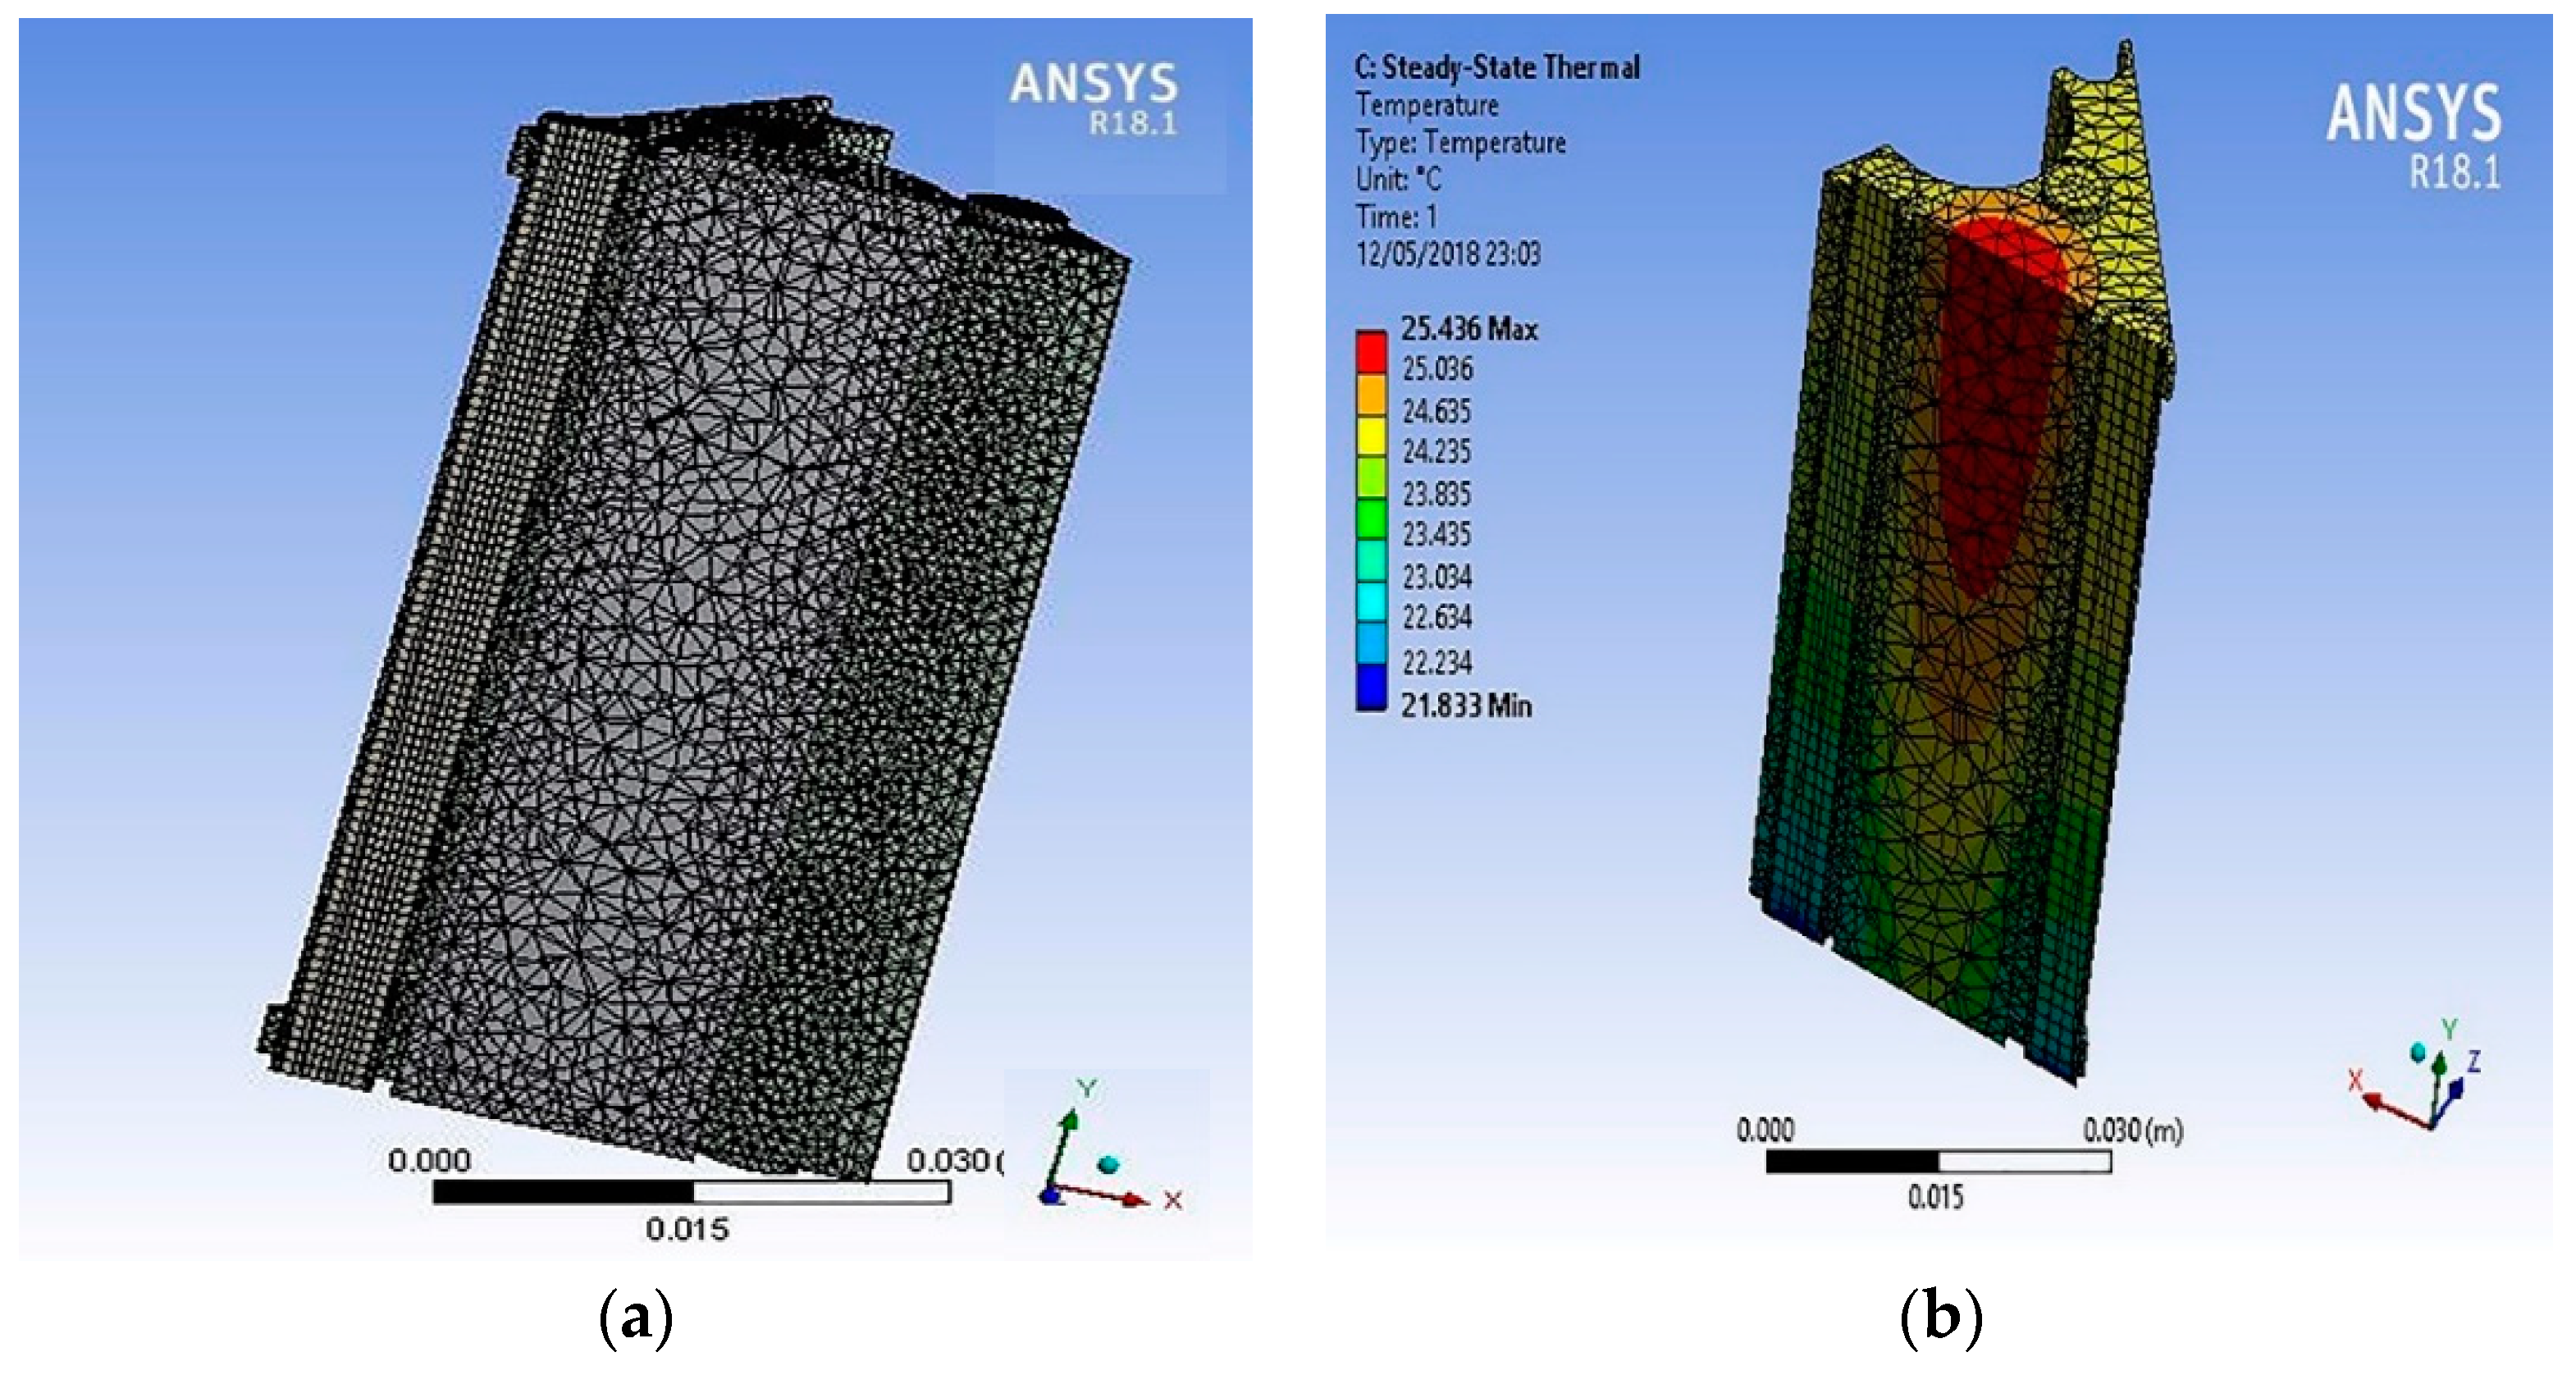
The module 3D-model was also imported to Ansys Fluent for 2C wet discharge (i.e., cooling pump turned on) thermal analysis. The same calculated heat generation values were used for these wet discharge simulations because the 18650 cell model was the same for both the dry and wet discharges. A fluid mass flow rate of 0.001 Kg/s was modelled in the cooling tube for the steady state 2C wet discharge simulation. Instead of optimizing the fluid mass flow rate in the cooling tubes, the values were taken from previous publications [27]. Figure 6 shows the simulation results for the battery module for 2C wet discharge.

3.2. Manufacturing of Prototype LIB Module

Figure 7 shows the manufactured prototype that was used for the experimental work in this research study. The majority of parts for the prototype module were manufactured with a HAAS Automation Inc. using computer numerically controlled (CNC) vertical milling machine.
The manufactured module, as shown in Figure 7, was precisely the same as the modelled version. In addition, cooling tubes, coolant distribution, and collecting tanks were procured or manufactured to assemble a complete liquid cooled battery module for the experimental setup. Figure 8a–c shows the association of the module with the cooling tubes, the cooling liquid distribution, and the collecting tank. The cooling tubes pass through the module that comes in contact with the cavity block and the conduction plates. The top half, bottom half, and the cooling tubes are made leak proof with the O-ring seals. The tanks helped in maintaining a constant pressure and a uniform velocity in each cooling tube.

4. Experimental Setup

Assumptions made in the experimental analysis:
  • Convection and radiation heat transfer were neglected.
  • Before each wet discharge, the cooling fluid temperature was cooled back to the ambient temperature.
  • Before each discharge, the module was charged to a 100% state of charge (SOC).
  • Electrical contact resistance and other resistances in the measurement circuit were neglected.
  • There were no air gaps between the cavity block and the cooling tube.
  • Firm contact between the copper strip plate and cell terminals was assumed to not be deformed or misaligned after each dry and wet discharges due to the effect of the temperature rise.
The equipment used for the experiment;
  • The battery module had a nominal capacity of 3.6 V (4.2 V max) and 15 Ah, comprising six parallel Samsung 24C 18650 Li–Po cells.
  • Cooling fluid was de-ionized water to avoid the chance of electrical conduction.
  • A pump was used to circulate the cooling fluid.
  • Flow sensor was used to measure the fluid flow rate.
  • Thermocouples and readers were used to measure the temperature rise continuously.
  • A heat exchanger (radiator) was used to transfer heat to ambient.
  • Cooling fans were used to cool the heat exchanger.
  • Collection and distribution tanks were used to maintain a uniform flow rate at a constant pressure.
  • Variable power resistors were used to set the discharge rates.
  • Meters were used to measure the voltages and currents.
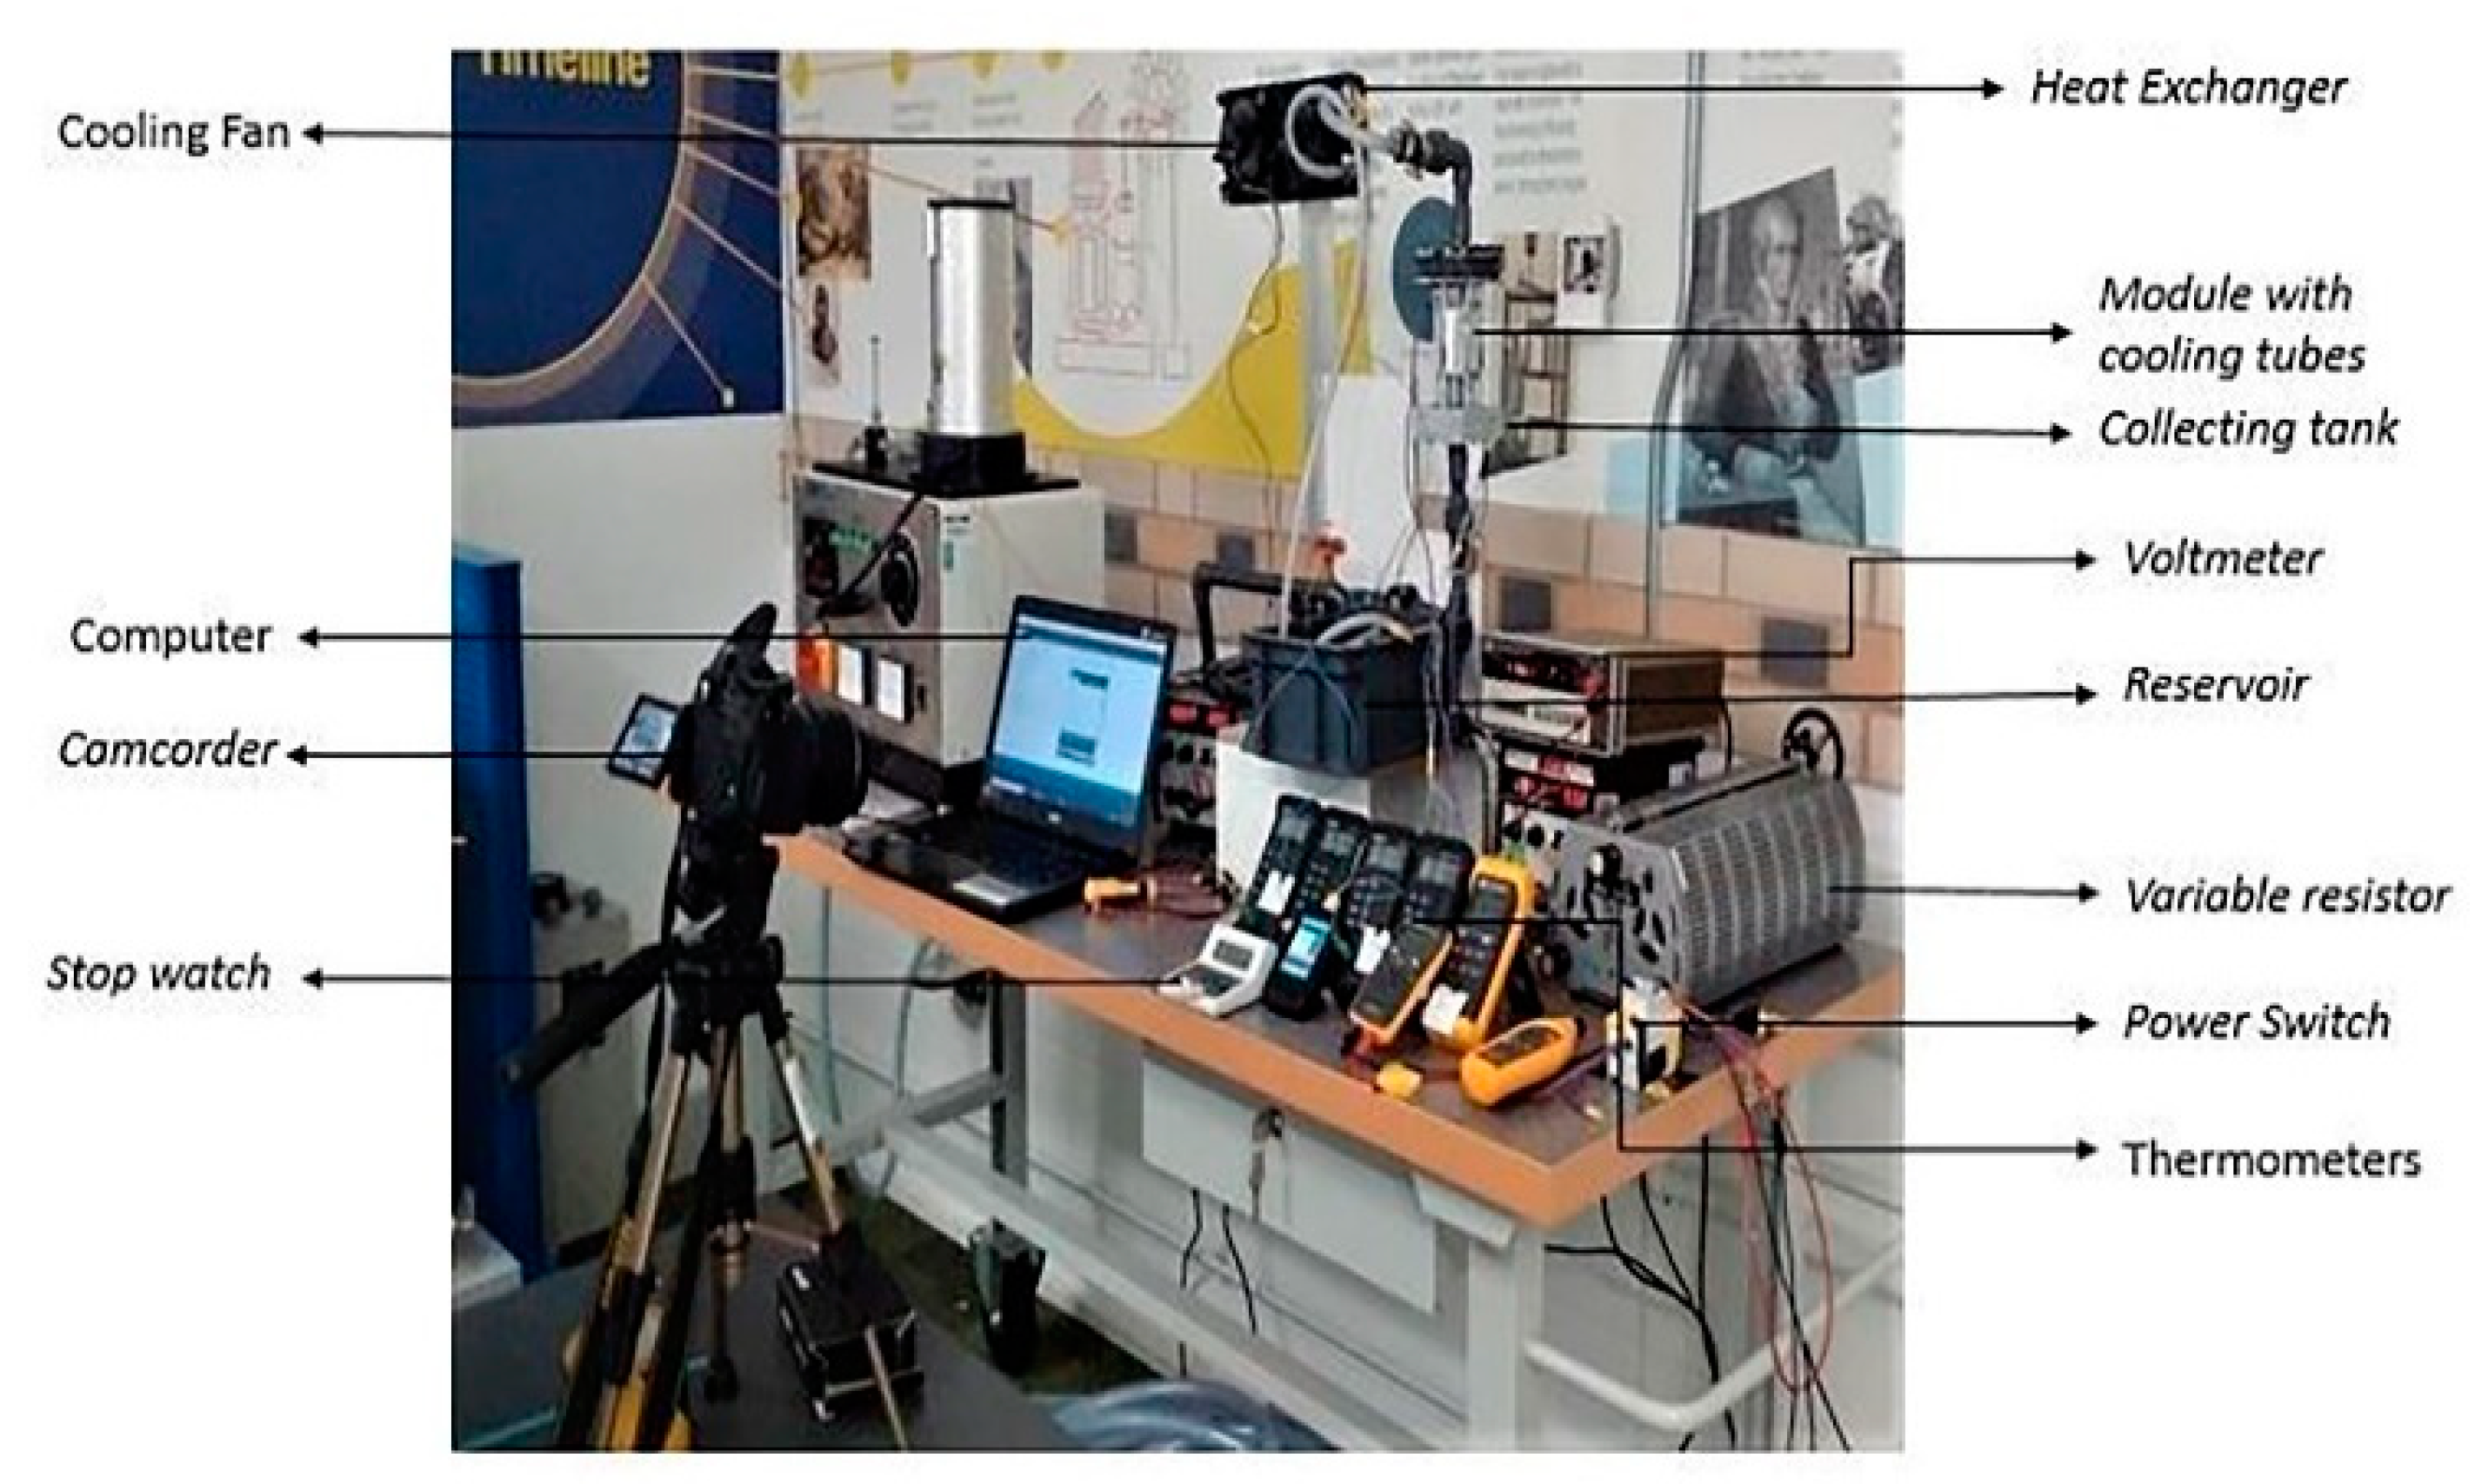
The experimental set up, shown in Figure 9, consisted of electrical, electronic, and hydraulic systems. The hydraulic system consisted of a hydraulic pump, a reservoir, a flow sensor, fluid collecting and distribution tanks, cooling tubes, a heat exchanger, and pipe connections. The electrical system consisted of a power switch, a variable resistor, shunt resistors, and current and voltage measuring devices. The electronic system consisted of a laptop, an Arduino microcontroller, and thermostatically controlled cooling fans. During the dry discharge measurements, the hydraulic system and the electronic system were switched-off, whereas for the wet discharge all systems were on. K-type (nickel/chromium alloy type) thermocouples were attached to the surface of the module, on the conduction plates, and on the common terminal copper strip, as shown in Figure 8c. Thermocouples were also used at the inlet and outlet of the heat exchanger to measure the coolant temperature. Table 2 gives the specification of the test system components.
The module cells were charged to a 100% state of charge (SOC) before the start of the experiment, and, during the dry and wet discharge measurements, a constant current was set by adjusting the variable resistor/rheostat to give galvanostatic discharge rates of 1C, 2C or 3C. During wet discharge, a constant fluid mass flow rate of 0.001 Kg/s was maintained in the cooling tubes. De-ionized water was used as the cooling fluid because it is electrically neutral and safe to handle. A small reservoir was used to store the de-ionized water and for thermal expansion. A small hydraulic pump circulated the coolant from the reservoir to the heat exchanger by passing it through the module unit. Finally, the coolant was collected back to the reservoir from the heat exchanger. The coolant was pumped vertically upwards from the reservoir to eliminate air pockets in the cooling circuit.
The dry cell steady state thermal simulation results, as shown in Figure 5, were used to position the thermocouples in the simulated high temperature zones in the cells. The cell level dry discharge was experimentally carried out for 1C, 2C and 3C. Before the experimental wet discharge measurements, the steady state wet discharge simulation results, shown in Figure 6, were used to find suitable locations for the thermocouples. Then, the module was tested for 1C dry discharge prior to conducting the 2C and 3C discharges in order to check that the discharge time was correct—this gave confidence that the apparatus was set up correctly, including good electrical contact to each and every cell in the module.
An infrared (IR) camera was used to capture the measured temperatures over time, as indicated by multiple desktop and handheld meters, during the discharge experiments.

5. Results

5.1. Single Battery Cell, Dry Discharge

A Samsung 3.6 V 2500 mA 18650 LIB was tested at 1C, 2C and 3C dry discharge rates, and the measurement results were compared with the steady state thermal model simulation results and infrared camera temperature measurements, as shown in Figure 5, Figure 10 and Figure 11. The simulation results in Figure 5 show that the rise in the temperature for the 2C dry discharge was predicted as ~64 °C. This did not correlate with the measured temperature rise of 35 °C, shown by Figure 10. We believe that this large simulation error can be attributed mostly to the heat generation values that were used in the simulation setup, which were derived from empirical relations for Sony 18650 LIBs. This implies that the empirical relations and or constants vary from brand to brand and battery chemistry to battery chemistry, even for seemingly identical electrical specification 18650 cells. This also implies that the accuracy of any finite element thermal simulation depends very heavily on having a suitable formula or other method of deriving extremely accurate heat generation values.
Figure 10 shows the 1C, 2C and 3C dry discharge results. Fully discharging down to 2.5 V at 1C rate took 3300 s (55 mins), which was slightly lower than the expected 1C discharge time of 1 hour or 3600 s. However, the 2C and 3C discharges time did match the expected times of 1800 s (0.5 hrs) and 1200 s (0.33 hrs), respectively. The maximum temperatures reached were 28, 33, and 40 °C for 1C, 2C and 3C discharge rates, respectively. The slope of the temperature curve increased from 3.6 to 14.4 and 43.2 °C/h when the discharge rate increased from 1C to 2C and 3C, respectively, which showed that the cells were long way off steady state temperature.
In order to validate these single 18650 cell dry discharge measurements, an IR camera was used to capture the surface temperatures at the time when the cells had discharged to the cut-off voltage of 2.5 V for the 2C and 3C discharge rates, as shown in Figure 11. These measurements correlated well, within 2 °C of the experimental results at 34 and 41 °C for 2C and 3C dry cell discharge rates, respectively. These IR images also demonstrated that the temperature was quite constant along the sidewall surface and was almost identical to the anode terminal temperature, as measured by thermocouples.

5.2. Battery Module Discharge

The six-cell prototype battery module was tested for 1C, 2C and 3C dry and wet discharge rates. For the wet cell discharges, the cooling fluid mass flow rate was maintained at 0.001 Kg/s in each cooling tube. This rate was set by maintaining a flow rate of 92 L/hr in the main delivery pipe. The coolant entered the battery module at the anode side, and cooling fluid exited the battery module at the cathode side because the simulation result showed that the anode was hotter than the other regions of the cell.

5.2.1. Module Discharge at 1C

The temperature versus discharge time was measured with thermocouples at the 1C (15 A) discharge rate at a number of different positions in the battery module, as shown in Figure 12.
As the results show, during the dry 1C (15 A) discharge (liquid cooling pump turned off), the temperature increased from 19 °C (start temperature) to 41 °C when discharged to 2.5 V—a rise of 22 °C. The discharge process was initiated with a terminal voltage of 4.2 V, as per all of the other discharge tests. This voltage decreased in a short period to 3.6 V; this quick decrease in voltage was due to the internal resistance of the cell and then decreased linearly down to approximately 3.0 V over a period of 40 or 50 minutes (dry and wet) and thereafter dropped suddenly to our cut-off voltage of 2.5 V. During the linear period, the cell voltage decreased 0.5 V over a period of approximately 2000 s, equivalent to 1 V/hr. The slope of the temperature increase was approximately 20 °C/h. The surface temperature of the battery module at the cathode and anode conduction plates reached approximately 41 °C at the cut-off voltage. It is clear from the shape of the temperature increase that the steady-state temperature was not reached. The anode conduction plate temperature initially lagged behind the anode terminal temperature (measured on the copper hexagon part), because the conduction plate (temperature measured on the outer edge) was insulated by the insulation plate (isolation plates) and took longer to heat up. However, the temperature difference decreased over time to almost zero as the conduction plates heated up and stored heat. A constant temperature difference of 4–5 °C was also measured between the anode and cathode conduction plates.
From Figure 12, it can be seen that at the end of the wet galvanostatic discharge experiment (liquid cooling pump turned on), the maximum temperature reached was only 25 °C, a rise of only 6 °C (compared to 22 °C for the dry discharge). The voltage reduction rate was the same as for dry discharge at approximately 1 V/hr. However, it is important to note that the slope of the temperature increase decreased significantly for the wet discharge with the cooling pump turned on down to approximately 4 °C/h. This equated to a five-fold decrease in slope. The surface temperature was maintained well below 23 °C. As occurred for dry discharge, the six-parallel cell module voltage dropped immediately from 4.2 to 3.6 V, then gradually decreased to 3.0 V, and then decreased sharply as it approached the cut-off voltage. The temperature on the conduction plates (anode and cathode) remained equal throughout the experiment (the difference was ~1 °C). During the whole wet discharge process, as shown in Figure 13, the coolant (deionized water) temperature only increased by approximately 1.5 °C, and the difference between the inlet and outlet temperatures at the radiator heat exchanger was only 0.4 °C. It is not clear whether the coolant temperature reached steady-state and therefore whether the measured battery temperatures approached steady-state. However, the temperature slopes are extremely shallow, which implies that the module cooling design had excellent performance.

5.2.2. Module Discharge at 2C

Figure 14shows the results for the 2C (30 A) wet and dry discharges with and without a cooling system pump turned on. A rapid decrease in the terminal voltage was observed at the beginning of the experiment when the load was connected for both dry and wet discharges. The dry discharge voltage reduced linearly at a rate of approximately 1.64 V/hr, which was 64% higher than for the 1C dry discharge (compare in Figure 12). For the wet discharge, the slope of the voltage decrease was similar for the first half of the discharge period. However, there were two sudden voltage decreases, which were coupled with increases in the voltage slope. In addition, the initial volt drop when the load was connected was more extreme at approximately 0.8 V for this wet discharge. Both of these sudden voltage decreases can be attributed to the fact that batteries generally lose capacity and power capability when they are repeatedly cycled or soaked in a cell temperature greater than ~50 °C [3].
For the 2C dry discharge, the anode temperature reached 62 °C after 1600 s from a starting temperature of 18 °C, a rise of 44 °C, and with a slope of approximately 96 °C/h. The cathode and anode conduction plate temperatures reached 54 °C and with a temperature difference of only 1–2 °C. Again, these dry discharge temperatures clearly did not reach steady-state.
For wet discharge, the anode temperature reached a maximum of 35 °C and a steady-state temperature after 200 s, as shown in Figure 14. For a total rise of only 17 °C. Even though the anode terminal of the module reached 35 °C, the surface temperature of the battery module along the axial direction stayed well below 23 °C, which indicates that the surface temperature was uniform and was within the range of the optimum temperature of the lithium ion cell. The surface temperature barely increased, and the anode terminal temperature was approximately 12 °C higher than the surface temperature. The slope of the temperature increase decreased significantly down to approximately 5 °C/h for the wet discharge with the cooling pump turned on. This equated to a nineteen-fold decrease in slope. It also appeared that these wet discharge temperatures quickly reached a quasi-steady-state.
The recorded coolant inlet and outlet temperatures during the wet discharge process are shown in Figure 15. The inlet temperature reached approximately 20.1 °C from a starting temperature of 18 °C, and the outlet temperature stayed below 19 °C and reached its steady-state temperature after 700 s.

5.2.3. Module Discharge at 3C

Figure 16 shows the results for the 3C (45 A) wet and dry discharges with and without a cooling system pump turned on.
Again, there were sudden voltage decreases from the no load voltage of 4.2–3.3 V when the load was turned on, and the voltage decreased quite linearly thereafter until it neared the cut-off voltage. The temperature at the anode of the battery module reached 70 °C from a start temperature of 18 °C in 1100 sec for a total rise of 52 °C for the 3C dry discharge with the pump off. The temperatures on the conduction plates showed the same trend as that of the 1C and 2C discharges; both the conduction plate temperatures increased simultaneously with the anode terminal temperature rise. Again, these temperatures clearly did not reach the steady-state.
For the 3C wet discharge, the temperature reached 40 °C at the anode, which was a rise of 22 °C. The slope of the anode terminal temperature was approximately 13 °C/h. It also appeared that these wet discharge temperatures also quickly reached a quasi-steady-state. The conduction plate temperature reached 25 °C, which indicated the surface temperature and this increase was limited to 25 °C, so an increase in discharge duration was expected; in contradiction, a decrease in discharge duration (~200 s) was observed. An approximate temperature difference of 8 °C was measured between the anode terminal and conduction plates, and the temperature difference between the two conduction plates was ~1 °C, indicating that the surface temperature was uniform and the temperature increase was limited to 25 °C with the cooling pump in the on position.
As shown in Figure 17, the inlet and outlet coolant temperatures both reached 20.2 °C from the start temperature of 18 °C. This proves that there was no heat transfer from the liquid to the surroundings. This could have been because we did not optimize the cooling fluid mass flow rate and the associated heat exchanger cooling tube size and length.

6. Discussion

For the 2C and 3C dry discharges, the batteries discharge period agreed with their Ah rating. However, as shown in Figure 10, the battery discharged 300 s quicker at the 1C rate than the theoretical discharge period of 3600 s. We believe that this difference was due to one or more cells being at a low state of charge at the start of the 1C discharge cycle. The 2C and 3C experimental results correlated with the IR image results shown in Figure 11.
As the discharge rate increased, a sharp increase in the voltage at turn on was observed, and this can mainly be attributed to internal resistance and to the electrical interconnections by lesser amount. This is evidenced by the fact that the voltage drop increased with discharge current increase, as governed by Ohms law, and temperature, as governed by the temperature dependence of the resistivity of all of the materials involved. Furthermore, the sharp voltage decreases approaching cut off is due to the internal resistance and high current draw, as well as to a change in entropy [26]. Considering a higher cut-off voltage (3V), a sudden decrease in voltage and a sudden increase in temperature at the end of each discharge period could be eliminated.
During the cell module discharges, the temperature rise increased with increased discharge rate, as shown in Table 3. The slopes of the temperature rises were estimated after first 100-200s of discharge period. During this initial discharge period, there was a sudden increase in the temperature due to the internal resistance and discharge current rate. During the 3C dry discharge, the temperature rise was 135 °C/h, and during the 3C wet discharge, this rate was reduced to 13 °C/h and the temperature rise was reduced to 22 °C. This 3C wet discharge rise is the same as the 1C dry discharge rise, which demonstrates that our cooling solution enables a three-fold increase in current draw for the same temperature rise, when the coolant is flowing. It can be seen that during the dry discharges, the rate of surface temperature rise was higher than the rate of anode temperature rise, which is because the heat generated at the anode was conducted to the surface in addition to the heat at the surface. However, during the wet discharge, the rate of surface temperature rise was lower than the rate of the temperature rise at the anode; this can be completely attributed to the performance of the module cooling design.
The cooling efficiencies of the cooling system at the anode and the surface of the cell module during the discharges are shown in the Table 4. The anode and surface efficiencies indicates the approximate fraction of heat generated that is absorbed by the coolant. The remaining fraction of the retained heat was the reason for the temperature rise at the anode and on the surface of the cell module during wet discharges. The cooling efficiency was higher on the surface and remained almost same at all three discharge rates, which indicates that, irrespective of the discharge rate and heat generated at the surface, the temperature rise was maintained well within the ideal temperature range. The anode cooling efficiency decreased with the increase in the discharge rate because the current and heat retained increased with the increase of the discharge current, Table 5. The cooling efficiencies at the anode and the surface were used to calculate the heat transfer rate and the heat retaining rate.
The heat transfer rate between the heat exchanger and surrounding is calculated using the Equation (12) assuming no radiation heat transfer between the heat exchanger and surrounding.
Heat transfer rate, Q = mCpdT
where Cp = 4186 J/kg- specific heat capacity of coolant, mass flow rate of coolant-m = 0.001 kg/s, dT = temperature difference between the heat exchanger and surrounding, 0.1 °C, 1 °C and 0 °C for 1C, 2C and 3C respectively from Figure 13, Figure 15 and Figure 17.
The heat transfer rate from the heat exchanger to the surroundings for the 1C, 2C and 3C discharges were approximately 1.6, 4.2 and 0 W, respectively. For the 3C discharge, the heat transfer between the heat exchanger and the surroundings is zero even if 0.446 W of heat was absorbed by the cooling fluid, Table 5. This is a subject of future interest to investigate this behaviour of HXs. The amount of heat taken by the cooling fluid increased with the increase in discharge rate, but the cooling efficiency at the HX was decreased as can be seen in Table 5. The cooling efficiency can be increased with the increase in the discharge rate by optimizing the module and cooling system design.
The internal heat generation and Ohmic heat (Joules heat) generation was calculated with the experimental results, theoretical concepts of heat capacity of materials and Joules law by assuming that the cell module was uniformly heated up and the internal heat generated was stored as the internal energy during all the dry discharges. The total energy, which includes the internal energy and the Joule energy, is responsible for the temperature rise on the surface, and the Joule heating is responsible for the temperature rise at the anode. The internal energy and Joule heating were calculated with Equations (13) and (14). From Table 5, it is clear that theoretically calculated increase in measured temperature is approximately same as the experimental results; see Figure 12, Figure 14 and Figure 16 for the 1C, 2C and 3C discharges. When comparing the theoretical and experimental temperature rise at the anode and surface of the cell module, the difference was only approximately 1 to 2 °C. This difference was due to convection and radiation heat transfer; temperature difference in Table 6.
Q = ( mC p dT ) Al + 2 ( mC p dT ) Cu + 6 ( mC p dT ) cell
Q = I 2 Rt
where Q is the total internal energy J, Cp is the specific heat capacity J/kg·K (for specific heat values, see Table 1), m is the mass of the material Kg, I is the discharge current A, and R is the resistance of the copper hexagonal plate −3.86 × 10⁻⁵ Ω.
Adding this theoretical temperature difference to the ambient temperature gave the measured rise in temperature, which was approximately the same as the experimental temperature rise at the anode and on the surface. This similarity implies that the calculated internal heat generation values and joule heating values were validated with the experimental values. These heat generation values and efficiencies could be used for the further optimization and the accurate numerical analysis of the cell module.
The difference in temperature rise between the theoretical and experimental results were due to convection and radiation heat transfer between the cell module and the atmosphere. The anode was not exposed to the atmosphere. Therefore, the convection and radiation heat transfer at the anode decreased to zero for the 3C discharge because the 3C discharge period was much shorter than for the other discharge rates and the cooling system was not optimized. However, the convection and radiation heat transfer at the surface increased with the increase in the discharge rate, because more heat was generated at higher discharge rates and the higher the temperature difference between the cell module and the surroundings, the larger the convection and radiation heat transfer rate will be.
For all three discharge rates, there was sudden increase in temperature when the discharge duration was close to the cut-off voltage; this rapid increase in temperature can be attributed to the rapid decrease in the terminal voltage, which was most likely due to the entropy change that further depended on the SOC of the cell [26]. This could also be attributed to the decrease in discharge duration when comparing the single 18650 cell dry discharges (Figure 10) and the module dry discharges seen in Figure 12, Figure 14 and Figure 16.
The thermal resistance between the heat source and sink determines the heat transfer rate of a system. The thermal resistance of the battery module for the wet and dry 1C, 2C and 3C discharge rates was calculated with Equations 15 and 16 and captured in the Table 7.
Steady state temperature rise (K/°C) = Power (W) × Rth (thermal resistance in K/W)
Power (W) = average cell voltage (V) × current (A)
The thermal resistance of the cooling system is estimated to be 0.2 K/W, based on the 3C discharge results, which came closest to reaching the steady state temperature.

7. Conclusions

A novel liquid-cooled cylindrical cell battery module design was prototyped and evaluated to measure its ability to control the battery cell temperature rise over complete discharge cycles at rates of 1C, 2C and 3C. Finite element simulations results for 3D modelled 18650 type battery cells and the prototype module were used to find the optimum measurement points for the experimental work and to assist with the results analysis. The module experimental performance was compared to single cells without cooling and the six-cell module with and without the coolant pump turned on. It was shown that temperature rise over the complete discharge period for the cooled six 18650 cell module was only approximately 6, 17 and 22 °C for the 1C, 2C and 3C discharge rates. These systems had not reached the final steady-state temperature by the time the cells reached the cut-off voltage, because the overall cooling system never had time to reach its steady-state temperature. However, under the same circumstances, in comparison, the rise was 22, 44 and 52 °C for the same discharge rates with the cooling pump turned off. These rises were dominated by large temperature rises at the beginning of the discharge cycles because the temperature increase was exponential. With the coolant pump turned off, the slope of temperature increase was still quite steep because the heat generation rate greatly exceeded the heat removal rate. However, with the pump turned on, the effectiveness of our cooling solution could be clearly seen because the temperatures quickly began to approach steady-state, and then the temperature and temperature rises were very low for the entire discharge periods and for all three discharge rates.
Since the wet discharge temperatures were pseudo steady-state, it was possible to estimate the thermal resistance of the entire cooling system based on the average battery voltage, the constant discharge currents, and the final temperatures reached. The estimated thermal resistances were 0.12, 0.17, and 0.146 K/W for the 1C, 2C and 3C discharge rates and a coolant mass flow rate of 0.001 Kg/s. Clearly, these values should all be equal, because the thermal resistance of the cooling system was a constant. The differences in calculated values can mainly be attributed to the fact that the measured temperature values were not true steady-state measurements (the system can never reach steady-state for these high discharge rates). Further work is required to determine the thermal resistance of the module on its own.
Since the long-term cell performance of LIBs is very sensitive to the cell operating temperature and is understood to degrade quickly if the temperature is not maintained within an optimum chemistry-specific narrow range, a high-performance cooling system is essential. The prototype design proposed in this work was shown to maintain the cells close to the optimum temperature range for discharge rates up to 3C. In addition, we discussed the chemistry-specific thermal runaway onset temperature ranges and causes. The cooling performance of the proposed design also provides a greater safety margin and balance between the highest possible discharge rate and the onset temperature for the thermal runaway. This will be especially important for batteries, such as Li–S, whose construction and chemistry feature low onset temperatures; this design helps to address this serious safety issue. The design may be suitable for some mobile and fixed battery energy storage applications that may see either intermittent or continuous high discharging or charging rates, such as electric vehicles or storage for renewable energy sources. It might also be suitable for applications where the batteries need to be pre-heated or maintained at a temperature above or below the ambient temperature. The module design is also simple and lightweight, and its hexagonal design enables it to scale up to produce very large battery systems with exceptional power densities. The design also lends itself to mass production, using casting or extrusion and stamping processes, is made from recyclable materials, and is modular and serviceable.
There still appears to be some margin to increase the discharge rate even further for this design while still maintaining modest temperature increases. In future work, this design will be optimized and evaluated at higher and possibly lower discharge rates, and the whole cooling system will be modelled to support the future experimental work and results analysis. Finally, the module cooling and system cooling will be investigated under real application conditions by using continuously varying load mission profiles such as world-wide harmonized light vehicle test (WLTP) to investigate the temperature profiles and cooling system requirements for different standardized charging and discharge current profiles for cars, trucks, etc. This will provide a clearer understanding about the relationships between the cell’s temperatures and application load profiles. Because an under-sized battery system would see higher than optimum temperatures and therefore have a shorter lifetime, this future work will enable the optimization of the compromise between the battery system capacity and the battery cell lifetime for those load profiles.

Author Contributions

A.M.D.: Designed and fabricated the novel reusable battery module as part of their MSc Thesis for future stationary and mobile applications; designed and fabricated battery testing apparatus; and tested the battery module for different dry and wet discharges, generated the result, and discussed the results. D.H.: Supervised the complete project, assisted in the design of various experiments, managed the complete project, participated in original draft preparation and analysis of collected data, and carried out the final post peer review editing. K.N.M.: Designed experiments for changing and discharging LIBs and associated test procedures, supervised this research project, and participated in original draft preparation and analysis of collected data. M.M.: Participated in original draft preparation and literature review. All authors have read and agreed to the published version of the manuscript.

Funding

This research received no external funding.

Acknowledgments

I would like to thank Mark Cuckow and Paul Dean for manufacturing the battery module and Ashok Karavadra and Prakash Patel for their valuable technical support and use of lab equipment.

Conflicts of Interest

The authors declare that there are no conflicts of interest.

Abbreviations and Symbols

EVsElectric Vehicle
PHEVsPlugged-in Hybrid Electric Vehicles
PCMPhase change materials
CFDComputational Fluid Dynamics
SOCState of Charge of the battery
TTemperature; K or °C
ΔGGibbs free energy; KJ
OVOperating Voltage; V
FFaraday’s constant; C mol−1
nOrder of the electrochemical reaction or no. of electrons involved in a chemical reaction
ƞHeat transfer efficiency
HEVsHybrid Electric Vehicles
BTMSbattery thermal management system
Cthe rate of the battery charging and discharging; Ah
IGalvano-static discharge current; A
RInternal resistance of the battery; mΩ
Eeqthe equivalent electromotive force; V
OCVOpen Circuit Voltage; V
COVCut of Voltage; V
q ˙ or Q ˙ Internal heat generation per unit volume W/m3

References

  1. Abada, S.; Marlair, G.; Lecocq, A.; Petit, M.; Sauvant-Moynot, V.; Huet, F. Safety focused modeling of lithium-ion batteries: A review. J. Power Sources 2016, 306, 178–192. [Google Scholar] [CrossRef]
  2. Bahiraei, F.; Ghalkhani, M.; Fartaj, A.; Nazri, G.-A. A pseudo 3D electrochemical-thermal modeling and analysis of a lithium-ion battery for electric vehicle thermal management applications. J. Appl. Therm. Eng. 2017, 125, 904–918. [Google Scholar] [CrossRef]
  3. Bandhauer, T.M.; Garimella, S.; Fuller, T.F. Temperature-dependent electrochemical heat generation in a commercial lithium-ion battery. J. Power Sources 2014, 247, 618–628. [Google Scholar] [CrossRef]
  4. Basu, S.; Hariharan, K.S.; Kolake, S.M.; Song, T.; Sohn, D.K.; Yeo, T. Coupled electrochemical thermal modelling of a novel Li-ion battery pack thermal management system. J. Appl. Energy 2016, 181, 1–13. [Google Scholar] [CrossRef]
  5. Chacko, S.; Chung, Y.M. Thermal modelling of Li-ion polymer battery for electric vehicle drive cycles. J. Power Sources 2012, 213, 296–303. [Google Scholar] [CrossRef]
  6. Mekonnen, Y.; Sundararajan, A.; Sarwat, A.I. A review of cathode and anode materials for lithium-ion batteries. In Proceedings of the SoutheastCon 2016, Norfolk, VA, USA, 30 March–3 April 2016; IEEE: Piscataway, NJ, USA, 2016; pp. 1–6. [Google Scholar]
  7. Miao, Y.; Hynan, P.; von Jouanne, A.; Yokochi, A. Current Li-ion battery technologies in electric vehicles and opportunities for advancements. Energies 2019, 12, 1074. [Google Scholar] [CrossRef] [Green Version]
  8. Kandhasamy, S.; Nallathamby, K.; Minakshi, M. Role of structural defects in olivine cathodes. Prog. Solid State Chem. 2012, 40, 1–5. [Google Scholar] [CrossRef] [Green Version]
  9. Minakshi, M.; Sharma, N.; Ralph, D.; Appadoo, D.; Nallathamby, K. Synthesis and characterization of Li(Co0.5Ni0.5)PO4 cathode for Li-ion aqueous battery applications. Electrochem. Solid State Lett. 2011, 14, A86–A89. [Google Scholar] [CrossRef]
  10. Liu, H.; Wei, Z.; He, W.; Zhao, J. Thermal issues about Li-ion batteries and recent progress in battery thermal management systems: A review. Energy Conver. Manag. 2017, 150, 304–330. [Google Scholar] [CrossRef]
  11. Zhu, C.; Li, X.; Song, L.; Xiang, L. Development of a theoretically based thermal model for lithium ion battery pack. J. Power Sources 2013, 223, 155–164. [Google Scholar] [CrossRef]
  12. Al Hallaj, S.; Maleki, H.; Hong, J.S.; Selman, J.R. Thermal modeling and design considerations of lithium-ion batteries. J. Power Sources 1999, 83, 1–8. [Google Scholar] [CrossRef]
  13. Jeon, D.H.; Baek, S.M. Thermal modeling of cylindrical lithium ion battery during discharge cycle. J. Energy Conver. Manag. 2011, 52, 2973–2981. [Google Scholar] [CrossRef]
  14. Xia, G.; Cao, L.; Bi, G. A review on battery thermal management in electric vehicle application. J. Power Sources 2017, 367, 90–105. [Google Scholar] [CrossRef]
  15. Inui, Y.; Kobayashi, Y.; Watanabe, Y.; Watase, Y.; Kitamura, Y. Simulation of temperature distribution in cylindrical and prismatic lithium ion secondary batteries. Energy Conver. Manag. 2007, 48, 2103–2109. [Google Scholar] [CrossRef]
  16. Wang, Q.; Ping, P.; Zhao, X.; Chu, G.; Sun, J.; Chen, C. Thermal runaway caused fire and explosion of lithium ion battery. J. Power Sources 2012, 208, 210–224. [Google Scholar] [CrossRef]
  17. Seo, J.; Sankarasubramanian, S.; Kim, C.S.; Hovington, P.; Prakash, J.; Zaghib, K. Thermal characterization of Li/sulfur, Li/S–LiFePO4 and Li/S–LiV3O8 cells using isothermal micro-calorimetry and accelerating rate calorimetry. J. Power Sources 2015, 289, 1–7. [Google Scholar] [CrossRef]
  18. Abada, S.; Petit, M.; Lecocq, A.; Marlair, G.; Sauvant-Moynot, V.; Huet, F. Combined experimental and modeling approaches of the thermal runaway of fresh and aged lithium-ion batteries. J. Power Sources 2018, 399, 264–273. [Google Scholar] [CrossRef] [Green Version]
  19. Xu, J.; Lan, C.; Qiao, Y.; Ma, Y. Prevent thermal runaway of lithium-ion batteries with minichannel cooling. J. Appl. Therm. Eng. 2017, 110, 883–890. [Google Scholar] [CrossRef] [Green Version]
  20. Shah, K.; Chalise, D.; Jain, A. Experimental and theoretical analysis of a method to predict thermal runaway in Li-ion cells. J. Power Sources 2016, 330, 167–174. [Google Scholar] [CrossRef] [Green Version]
  21. Kizilel, R.; Sabbah, R.; Selman, J.R.; Al-Hallaj, S. An alternative cooling system to enhance the safety of Li-ion battery packs. J. Power Sources 2009, 194, 1105–1112. [Google Scholar] [CrossRef]
  22. Tran, T.H.; Harmand, S.; Sahut, B. Experimental investigation on heat pipe cooling for hybrid electric vehicle and electric vehicle lithium-ion battery. J. Power Sources 2014, 265, 262–272. [Google Scholar] [CrossRef]
  23. Nazari, M.A.; Ahmadi, M.H.; Sadeghzadeh, M.; Shafii, M.B.; Goodarzi, M. A review on application of nanofluid in various types of heat pipes. J. Cent. South Univ. 2019, 26, 1021–1041. [Google Scholar] [CrossRef]
  24. Wu, W.; Wang, S.; Wu, W.; Chen, K.; Hong, S.; Lai, Y. A critical review of battery thermal performance and liquid based battery thermal management. Energy Conver. Manag. 2019, 182, 262–281. [Google Scholar] [CrossRef]
  25. Gümüşsu, E.; Ekici, Ö.; Köksal, M. 3-D CFD modeling and experimental testing of thermal behavior of a Li-Ion battery. J. Appl. Therm. Eng. 2017, 120, 484–495. [Google Scholar] [CrossRef]
  26. Saw, L.H.; Ye, Y.; Tay, A.A.; Chong, W.T.; Kuan, S.H.; Yew, M.C. Computational fluid dynamic and thermal analysis of Lithium-ion battery pack with air cooling. J Appl. Energy 2016, 177, 783–792. [Google Scholar] [CrossRef]
  27. Zhao, J.; Rao, Z.; Li, Y. Thermal performance of mini-channel liquid cooled cylinder based battery thermal management for cylindrical lithium-ion power battery. Energy Conver. Manag. 2015, 103, 157–165. [Google Scholar] [CrossRef]
Figure 1. A schematic diagram of a lithium-ion battery (LIB). Adapted from reference [7].
Energies 13 01477 g001
Figure 2. (a) Examples of a cylindrical cell air cooling system and (b) a cylindrical LIBs liquid cooling methods.
Energies 13 01477 g002
Figure 3. The heat pipe working principle.
Energies 13 01477 g003
Figure 4. (a) Virtual prototype of the battery module with components and its materials. (b) Assembled view of the cell module. (c) Cross sectional view of cell module with semi-circular holes and a top view of the cell module with a copper strip (with dimples), bus bars, a cover plate, and cooling tube holes.
Energies 13 01477 g004
Figure 5. (a) Tetrahedral meshing and (b) steady-state thermal analysis result showing the temperature gradient along the 18650 LIB for 2C dry discharge current (5 A).
Energies 13 01477 g005
Figure 6. (a) Tetrahedral meshing for the module section and (b) steady-state thermal analysis simulation result for 2C wet discharge.
Energies 13 01477 g006
Figure 7. Battery module prototype used for experimental work.
Energies 13 01477 g007
Figure 8. (a) The bottom half, (b) the top half, and (c) the fully assembled module test setup of coolant collection tank, including temperature measurement and electrical connections.
Energies 13 01477 g008
Figure 9. The experimental set up for the wet and dry cell module discharges.
Energies 13 01477 g009
Figure 10. Measured single-cell battery voltage and terminal temperature versus time for 1C, 2C, and 3C dry discharge rates.
Energies 13 01477 g010
Figure 11. IR camera thermal images of sidewall surface and terminal temperatures of the battery when discharged to the 2.5 V cut-off voltage for (a) the 2C discharge rate and (b) the 3C discharge rate.
Energies 13 01477 g011
Figure 12. Measured voltage and temperature versus time for the six-cell battery module at the 1C discharge rate, measured at various points in the module.
Energies 13 01477 g012
Figure 13. The coolant temperature variation measured at the inlet and outlet of the heat exchanger during the 1C wet discharge of the battery module.
Energies 13 01477 g013
Figure 14. Measured voltage and temperature versus time for the six-cell battery module for the 2C wet and dry discharge rates, measured at various points in the module.
Energies 13 01477 g014
Figure 15. The coolant temperature variation measured at the inlet and outlet of the heat exchanger during the 2C wet discharge of the battery module.
Energies 13 01477 g015
Figure 16. Measured voltage and temperature versus time for the six-cell battery module for the 3C wet and dry discharge rates, measured at various points in the module.
Energies 13 01477 g016
Figure 17. The coolant temperature variation measured at the inlet and outlet of the heat exchanger during 3C wet discharge of the battery module.
Energies 13 01477 g017
Table 1. Properties of the materials used in the LIB cell modelling.
MaterialsSpecific Heat Capacity (J/Kg·K)Density (Kg/m3)Thermal Conductivity, W/mK
Aluminium8712719202.4
Lithium-Ion cell1108.424503.917
Copper3858960360
De-ionized Water4128998.20.6
Poly Carbonate110011900.65
Table 2. Specifications of the devices and instruments used in the experimental setup.
Devices or InstrumentsSpecification
Thermo-couplesK-type
Variable resistor25 A, 2.5 Ohm
Pump with Motor12 V DC brushless motor; maximum flow rate 800 L/Hr; maximum head 5 m, Inlet and outlet ½” male thread; power 19 W; maximum operating temperature 100 °C, and the flow rate was regulated with a flow control valve
Flow SensorsMinimum working voltage 4.5 V DC; maximum current 15 mA; voltage range 5–24 V DC; maximum operating temperature 80 °C; maximum fluid temperature 120 °C; and maximum pressure 1.75 MPa.
Shunt Resistors4, 0.005 Ohm each
RadiatorCentral Processing Unit (CPU) cooling radiator; 18 aluminium tubes; Size 275 × 120 × 32 mm; weight 382 g
Thermostat Fans4-pin aluminium heat sink CPU cooler fan, 12 V DC, 5 V PWM
Table 3. The summary of measured temperature increase over the discharge periods and cooling efficiency on the cell module.
Discharge RateSingle Cell
(Anode Temperature °C, Slope °C/h)
Module (Dry)
(Temperature °C, Slope °C/h)
Module (Wet)
(Temperature °C, Slope °C/h)
At AnodeOn SurfaceAt AnodeOn Surface
1C8 °C, ~3.2 °C/h22 °C, ~20 °C/h20 °C, ~22 °C/h6 °C, ~4 °C/h2 °C, ~2.4 °C/h
2C13 °C, ~21 °C/h44 °C, ~75 °C/h33 °C, ~76 °C/h17 °C, ~5 °C/h4 °C, ~4.5 °C/h
3C20 °C, ~51 °C/h52 °C, ~135 °C/h42 °C, ~140 °C/h22 °C, ~13 °C/h4°C, ~10 °C/h
Note: Ambient temperature was 18 °C for module discharge and 20 °C for single cell discharge.
Table 4. The cooling efficiencies at the anode and on the surface of the cell module during discharges.
DischargesAt AnodeOn Surface
1C78.2%87%
2C61.3%88.8%
3C57.6%86.3%
Table 5. The theoretical results for the internal energy, joules heat, efficiency of the heat exchanger (HX), and increase in measured temperature during discharges.
DischargesInternal Energy, WJoules Heat, W (at Anode)Temperature Difference, ∆T °CEfficiency of HX, ƞ
At AnodeOn Surface
1C2.480.086530.71
Heat transferred to liquidHeat retainedHeat transferred to liquidHeat retained
2.180.30.0670.019
2C7.780.344716.634.160.59
Heat transferred to liquidHeat retainedHeat transferred to liquidHeat retained
6.91.010.2110.133
3C15.560.774225.750
Heat transferred to liquidHeat retainedHeat transferred to liquidHeat retained
13.432.130.4460.328
Note: The ambient temperature was 18 °C, and experimentally estimated temperatures and discharge duration were used to calculate Internal energy and joules heat, respectively.
Table 6. The increase in measured temperature and its error in comparing the experimental and theoretical results.
Temperature Increase, from Results (°C)Temperature Increase, Theoretical (°C)Error in Temperature
At anodeOn surfaceAt anodeOn surfaceAt anodeOn surface
62531 °C−1 °C
17316.634.160.37 °C−1.16 °C
224225.750 °C−1.75 °C
Table 7. The thermal resistance of battery module during the dry and wet 1C, 2C and 3C discharges, as well as the thermal resistance of cooling system.
DischargesDry DischargeWet DischargeThermal Resistance of the Cooling System (K/W)
Power (W)Thermal Resistance (K/W)Power (W)Thermal Resistance (K/W)
1C50.250.4450.250.120.32
2C100.50.44100.50.170.27
3C150.750.35150.750.1460.2
Note: The coolant mass flow rate was 0.001 Kg/s.

