1. Introduction
The relevance of solar radiation on the energy consumption and natural lighting levels of a building is well-known [
1]. The scientific literature about the energy impact of shading devices [
2] on buildings is quite large. Although it not the aim of the present work, by way of illustration, the studies by Tzempelikos et al. [
3,
4] and Mettanant et al. [
5] can be highlighted. They show that suitable control strategies on shading elements in buildings (overhangs, louvers, blinds, etc.) lead to energy savings greater than 75% in lightning and 20% in air conditioning, respectively. Furthermore, a cooling potential of up to 8.5 °C has been estimated by using appropriate shading methods in arid climates [
6]. In addition to energy savings, some authors have also focused their attention on the improvement in comfort conditions. Thus, Choi et al. [
7] quantified parameters such as the productivity, concentration and relaxation levels of the occupants in offices with dynamic shading devices, reporting an increase in the so-called “positive emotional responses” of 26%.
Shin et al. [
8] state that Building Energy Performance Simulation (BEPS) programs are widely used as a support for building design and systems. Crawly et al. [
9] provide a comprehensive review of the most relevant BEPS programs, in which EnergyPlus [
10], DOE2 [
11] and TRNSYS [
12] could be highlighted for their recognized standing. EnergyPlus, which has been developed in collaboration with the National Renewable Energy Laboratory (NREL) from the United States, is based on the building energy balance with adjustable time steps. DOE2, financed by the Energy Department of the US, uses the well-known transfer functions for the calculation of thermal loads within one-hour time steps. Finally, TRNSYS is a general-purpose application software developed by the Solar Energy Laboratory at the University of Wisconsin-Madison, for the transient simulation of thermal systems with a module called TrnBuild for building thermal simulations.
Building energy performance simulation (BEPS) programs include algorithms to calculate sunlit surfaces from the geometric pattern of the building and its shading elements. Kirimtat et al. [
1] undertake an interesting review in which, from the works published from 1996 to 2015, different existing methodologies of shading calculation are analysed. The methodologies used in BEPS could be classified into two groups [
13]: on the one hand, those known as ray tracing methods, which consist in generating a finite number of rays from the light source to the surface and, on the other hand, those based on the projection of polygons in the path of a solar ray and their subsequent intersection or clipping, called Projection and Clipping Methods (P&C Methods). Recently, De Almeida et al. [
14] have used a pixel-counting method as an additional method within BEPS, achieving an improvement of up to ten times in computing time compared with P&C methods, although it has not been extended to the main BEPS programs.
BEPS programs usually develop annual simulations with hourly time steps or smaller, conducting shading calculations for each single time step. Traditionally, due to the high computational cost of this demanding process, BEPS programs often use an approximation in which shading calculations are made for one representative day of the month (DPM Methods). The study carried out by Maestre et al. [
15] shows that DPM methods obtain errors of up to 26% in the estimation of incident total solar radiation for different geometric configurations of overhangs and sidefins. EnergyPlus [
10] allows the user to adjust both the period (20 days by default) and the time-step (15 min by default).
Jones, Greenberg and Pratt [
16], in a study of the advantages of computer graphics rendering methods compared with analytical methods, show errors on incident beam radiation and the corresponding computing time when the frequency of the representative days (7, 14 and 28 days) and the angle of discretization are changed. Error values of 5% (for 7 days and 1°) and 55% (for 28 days and 20°) were found.
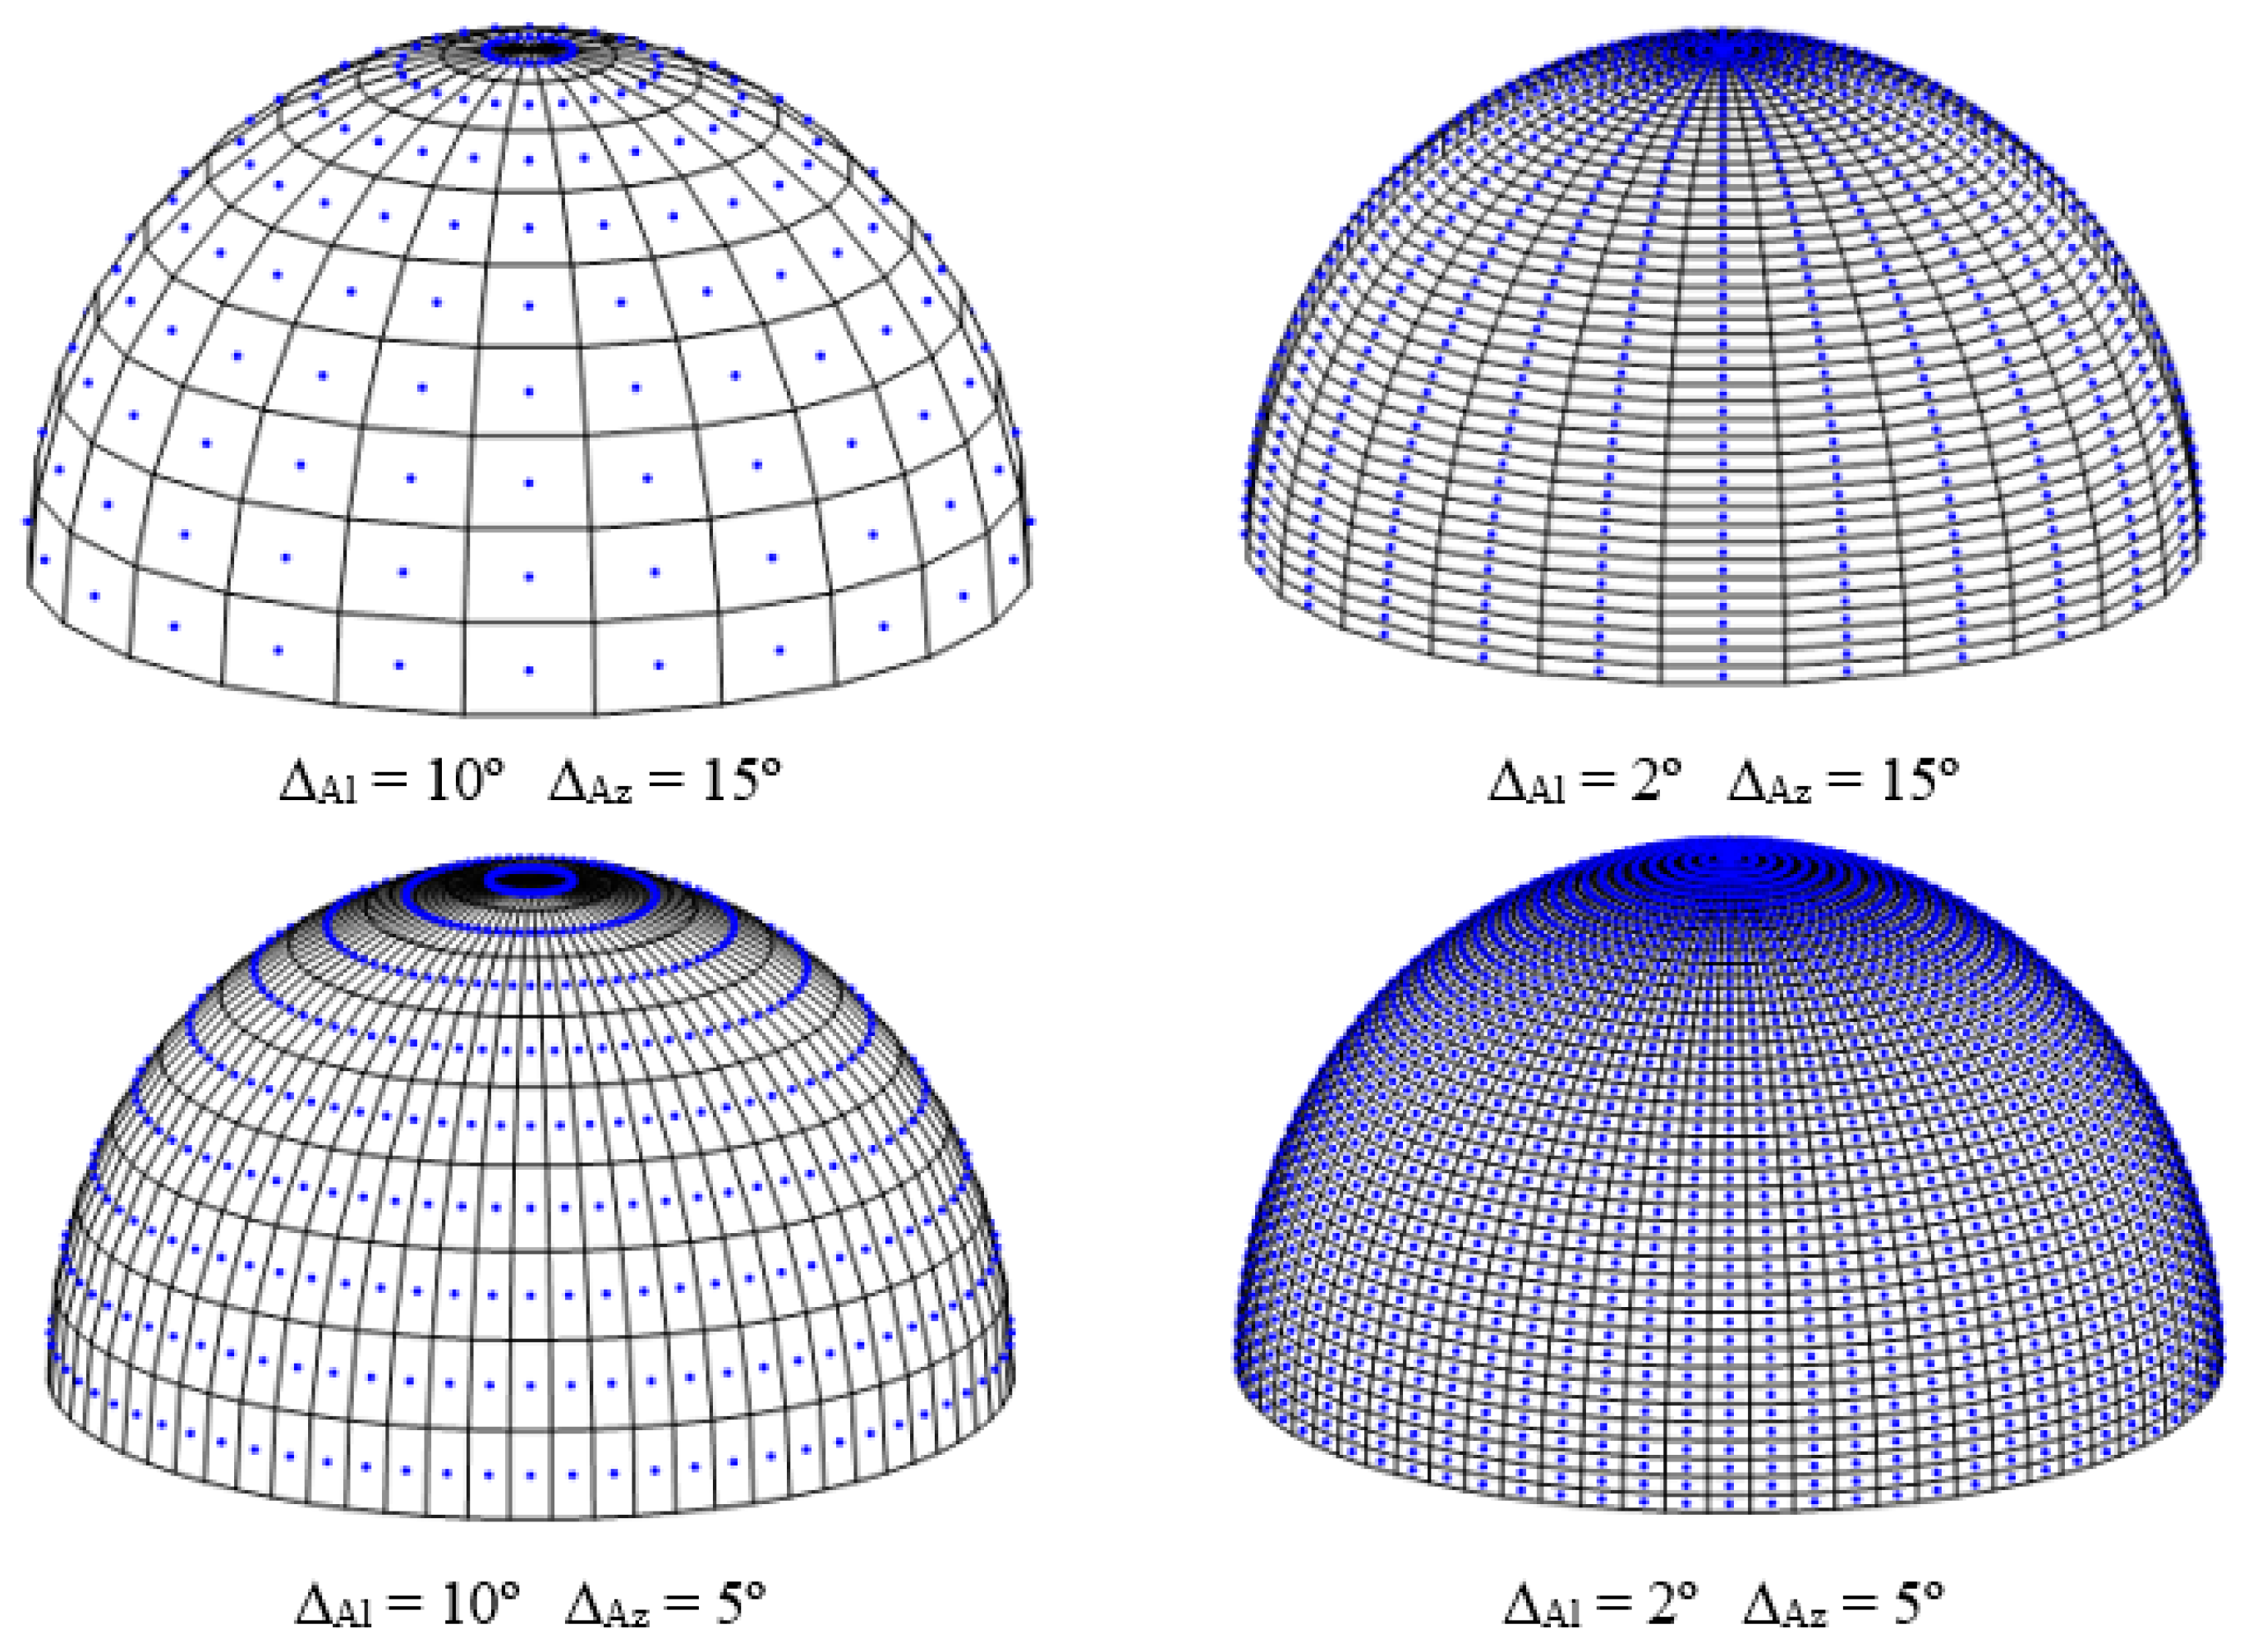
An option to avoid the former DPM approximation and to have shading calculations for every time step of an annual simulation is to calculate beforehand (precalculate) and store shading surfaces for a set of specific sun positions. The methods based on this precalculation process are called Hemispherical Sky Discretization (HSD) Methods. They are predicated on the repetition of solar positions throughout the year, which allows the reduction in the number of calculations needed.
The accuracy of HSD methods obviously depends on the number of positions selected to do shading calculations. Thus, Cheung and Chung [
17] apply an angular discretization of the hemispherical sky with 5° azimuth and altitude divisions, for the calculation of the probable sunlight duration used by British Standards [
18]. This calculation can be accelerated with some preprocessing of the feasible solar positions. In this sense, Sánchez de la Flor et al. [
19] propose the use of a non-dimensional altitude and azimuth, which assures the calculation in the former positions.
Some BEPS already incorporate these methods in order to reduce the computing time. For instance, TRNSYS [
12] uses an HSD method based on a Tregenza discretization [
20] with the improvement proposed by Bourgeois [
21], in which a scaling factor is used to increase the number of direct solar positions, achieving a higher resolution. DOE-2 applies this technique only for the calculations of natural lighting, using twenty preset positions [
22].
There is a great number of studies related to shading calculation in buildings that can be found in the scientific literature about the influence of typology and control of shading elements, comparison of different methods, etc. However, none of the consulted works show a clear relationship between the degree of accuracy achieved in shading calculations and computational cost when HSD methods are applied in the energy simulation of buildings.
The present work focuses on the influence of discretization used in HSD methods applied to beam radiation calculation on shading devices. This influence has not been studied yet, despite the fact that these methods are currently used by the most common BEPS programs. The study assesses the error made in the estimation of direct solar radiation on external building surfaces due to the uncertainty in the so-called shading factor and the computational effort associated with the shading calculation process.
First of all, the developed study cases are defined, as well as different indicators used to measure the accuracy and computational cost of each discretization. Then, a deep analysis of the influence of the discretization of hemispherical sky on incident radiation and computing times based on latitude, the typology of shading devices and orientation is carried out. Finally, the main conclusions of the present study are drawn.
3. Results
Table 2,
Table 3,
Table 4,
Table 5 and
Table 6 show the overall results obtained for the different discretization levels considered in the present study. For reasons of symmetry, only the results for five orientations have been shown. The results have been divided into three groups: average
, maximum
and maximum
. For each group, the weighted relative error (
), annual solar radiation on the window (
) and absolute error of incident energy (
), all of them as a function of the discretization level.
Thus, for the first group and for each azimuth and solar altitude discretization level, the average values of all geometrical configurations and sites considered have been shown. As is the exact value of the incident solar energy on the window, it will not depend on the discretization level but on the orientation. For the second group, the maximum values of () for each configuration are shown, together with the corresponding indicators and . Finally, the third group shows the and values associated with the cases with maximum ().
It should be stressed that, for each discretization level, the configuration with the highest value of () will not necessarily be the one with the highest () value. For instance, it can be seen that for the South orientation and 2°Al-5°Az discretization, is 0.72 with an associated value of 1.41, which corresponds to the following configuration: London, 1 × 1 m2 window and 100% shading. However, the value for that configuration is not the maximum one (), which is 2.25 and corresponds to the following configuration: Seville, 1 × 1 m2 window and 25% shading. equals 0.33 in this case.
From a preliminary analysis, it can be seen that
is about 17.91 kWh/m² (
Table 2) for the South orientations, representing 3.6% of its associated
value. Likewise, for the Southeast orientation,
is 15.42 kWh/m² (
Table 3) (3% of its corresponding
). For the North orientation, the highest value of
amounts to 3.35 kWh/m² (
Table 6), representing 22.6% of the total incident energy.
Next, a careful analysis of the influence of the differing variants studied is developed.
3.1. Influence of the Solar Altitude and Azimuth Discretization
Figure 3 shows the variation in the
average values for changes of 10° and 8° in solar altitude and azimuth discretization levels, respectively, for the different orientations. It is noted that error is more sensitive to altitude discretization level than to azimuth discretization level for the South orientation. Thus, for that orientation, an increase of 10° of the azimuth discretization level (from 2°Al-5°Az to 2°Al-15°Az) leads to an increase in the
average values from 0.19% to 0.79%, that is, more than four times greater. Similarly, from 2°Al-5°Az to 10°Al-5°Az (with an increase of 8ᵒ in solar altitude and a 5° azimuth discretization),
changes from 0.19% to 1.6%, more than eight times greater. However, the increase in
for the North orientation is even greater than for the South orientation, where changes of 10° and 8° in azimuth and solar altitude discretization levels lead to
values 9 and 5 times greater, respectively.
The maximum absolute error (
) is about 17.91 kWh/m², which corresponds to the least accurate discretization: Seville, 1 × 1 m
2 window, 50% shading and the South orientation.
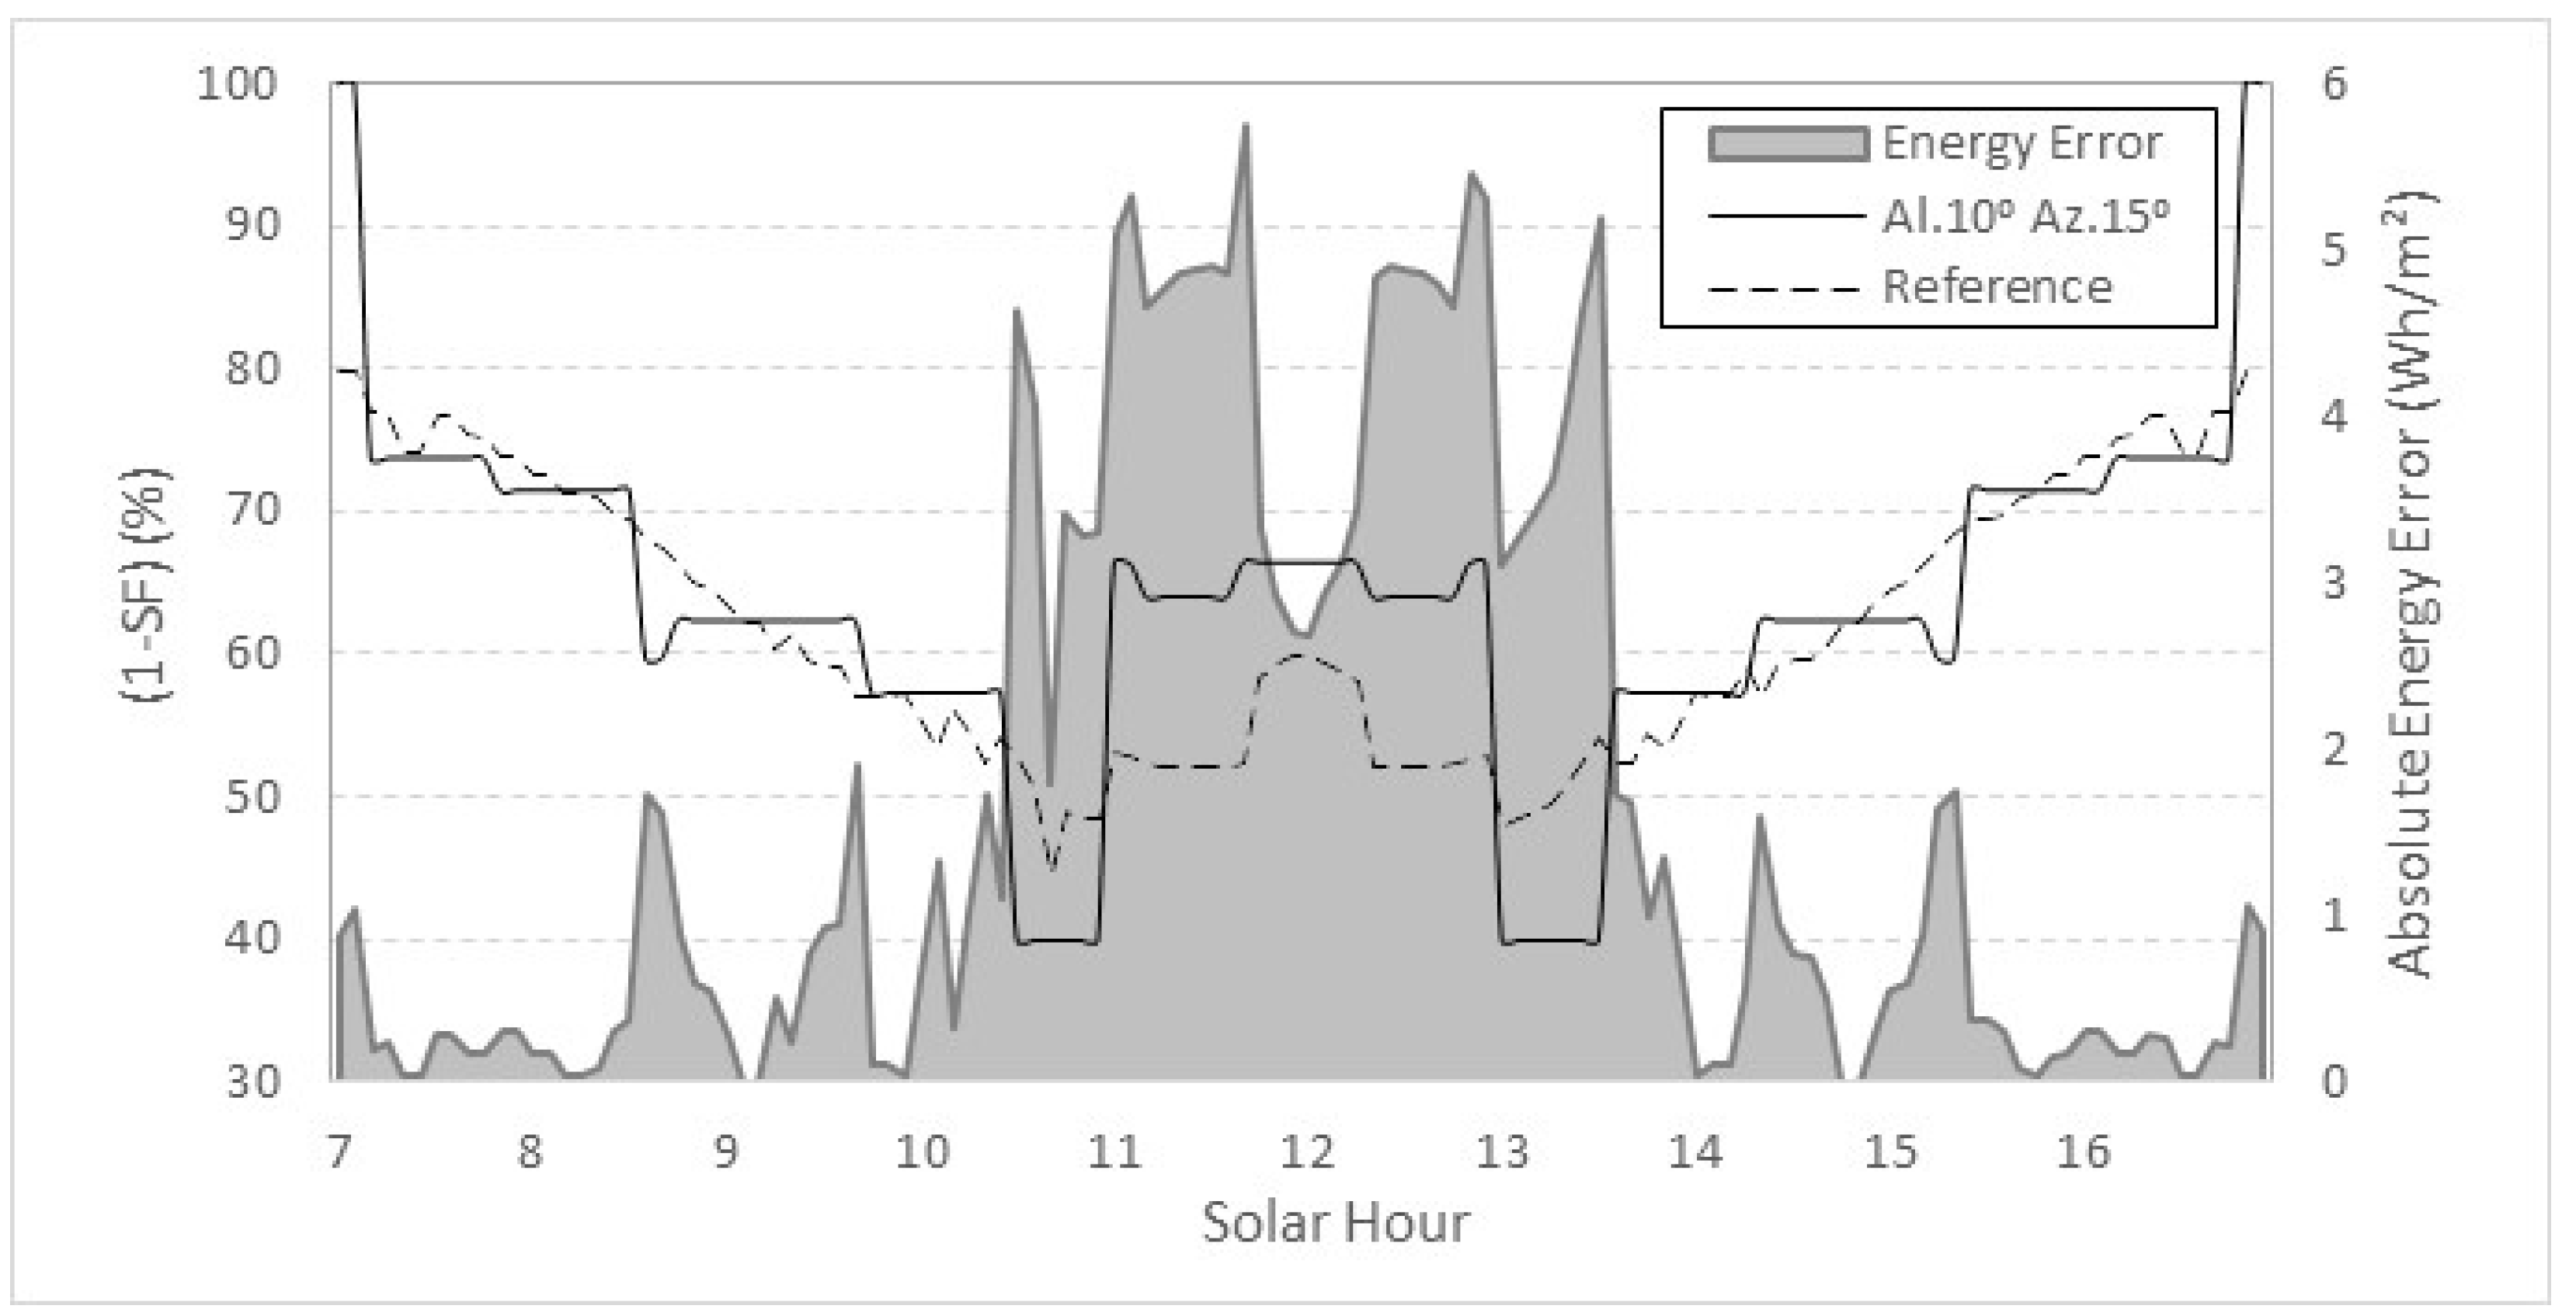
Figure 4 shows the shade fraction (1-SF) on the window for that day considering 10°Al-15°Az discretization, together with the exact value (called reference) which is calculated from the actual sun position. Sudden changes in the sunlit surface fraction can be observed due to the effect of angular discretization, that is, to the discrete variation in solar position. The associated absolute error of incident energy is also shown. In this case, the time with the highest absolute error (5.76 Wh/m²) is 4 April, 11:40 a.m. local time.
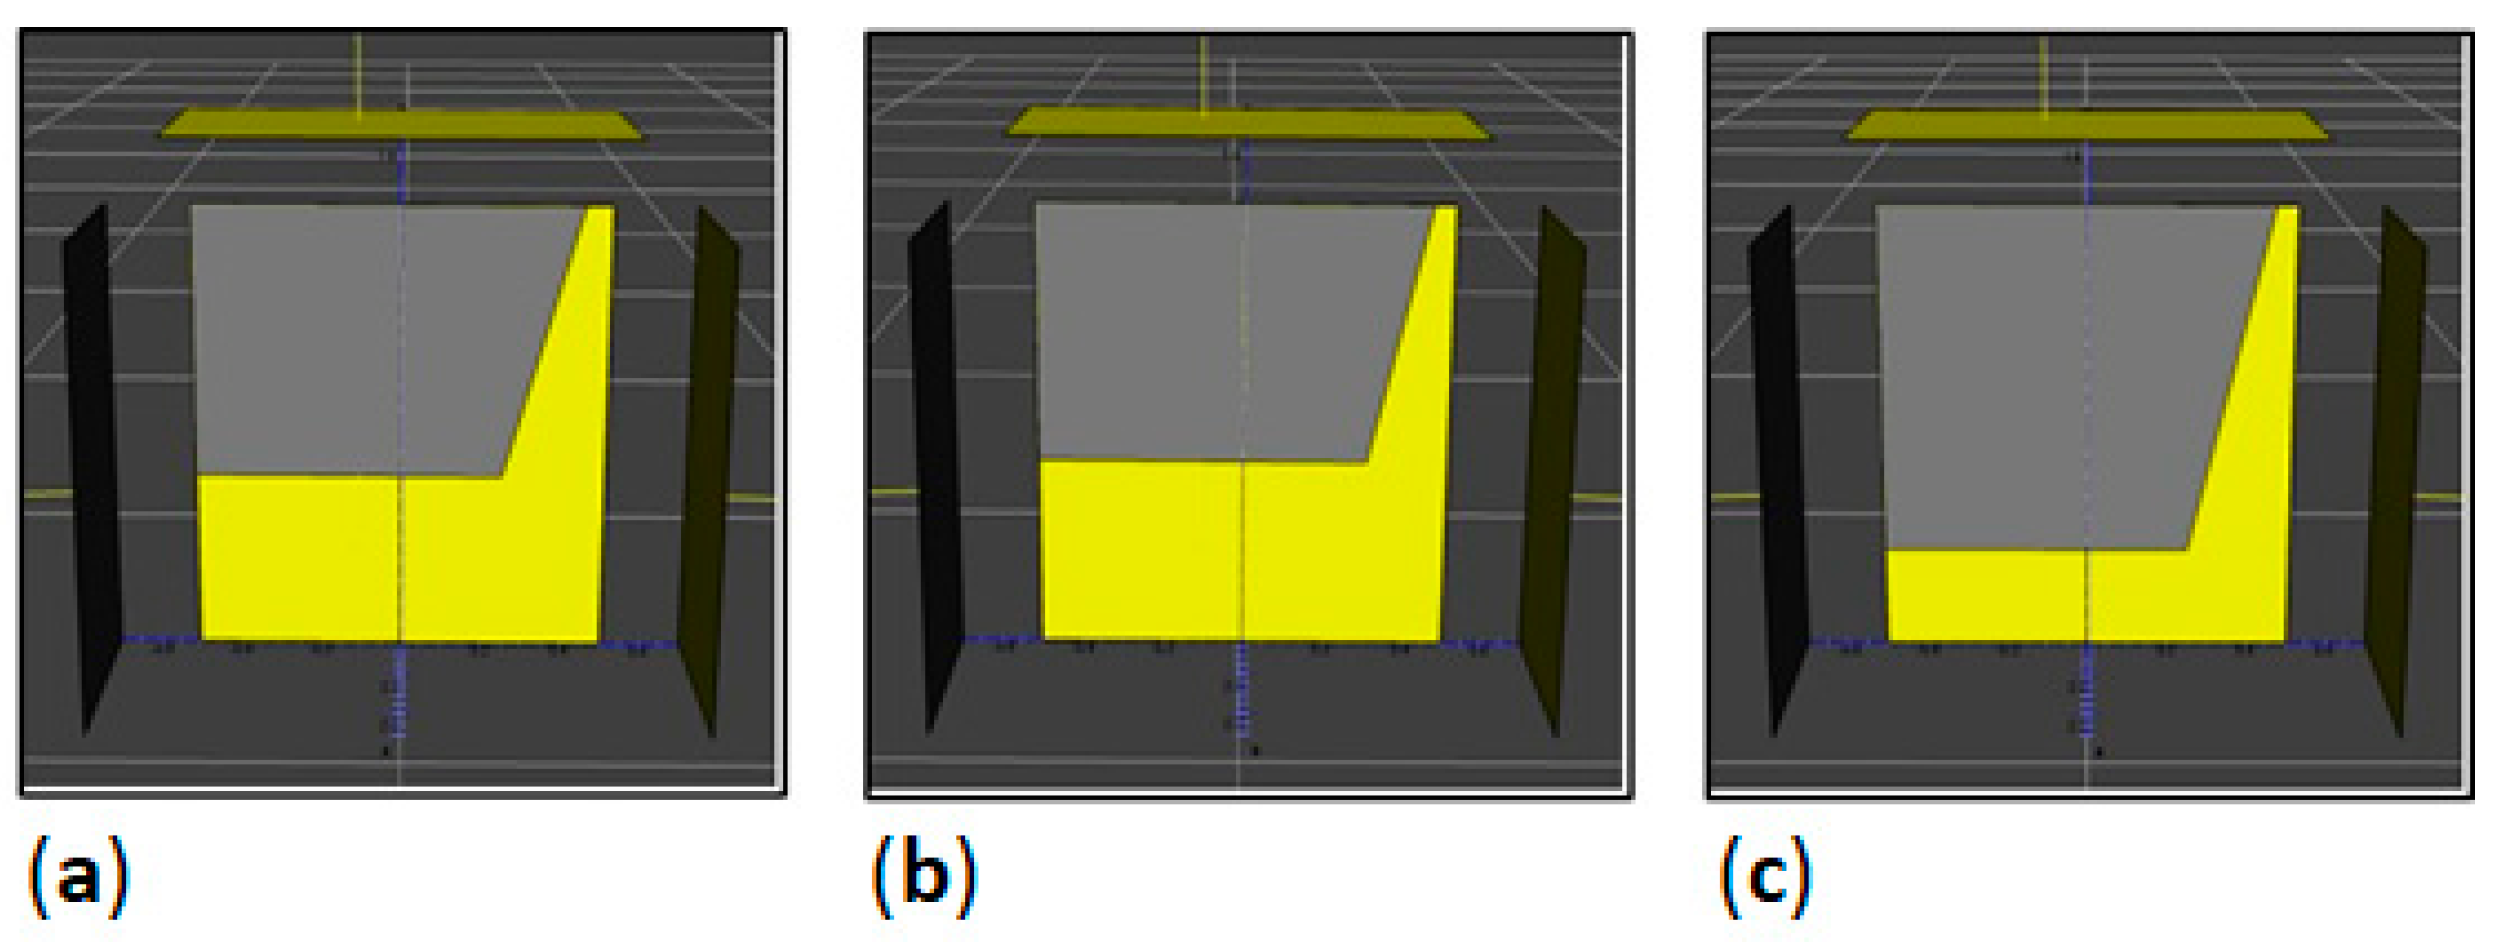
For this case, the shading factor at 11:00 a.m. is 0.51 (azimuth and solar altitude are 26.82° and 55.16°, respectively). The corresponding projected shade can be seen in
Figure 5.
Figure 5b shows the projected shade when an increase of 5° in the previous azimuth value is considered, obtaining a value of 0.50 for the shading factor (1.96% of error). Analogously, the effect on the projected shade due to the same angular increase (5ᵒ) in solar altitude is shown in
Figure 5c, leading to a shading factor of 0.66 (29.4% of error).
For the sun positions in which sidefin devices lead to shades over the window (e.g., at 16:00 local time; azimuth 75.13° and solar altitude 26.83°), the same angular variation in azimuth (5ᵒ) leads to an error of 1.37% in SF, while a similar variation in solar altitude leads to a 4% error. Thus, the projected shading calculations from sidefins are less sensitive to the discretization level. This is mainly due to the fact that sidefins are not influenced by solar altitude because they are upright.
3.2. Influence of the Shading Device Typology
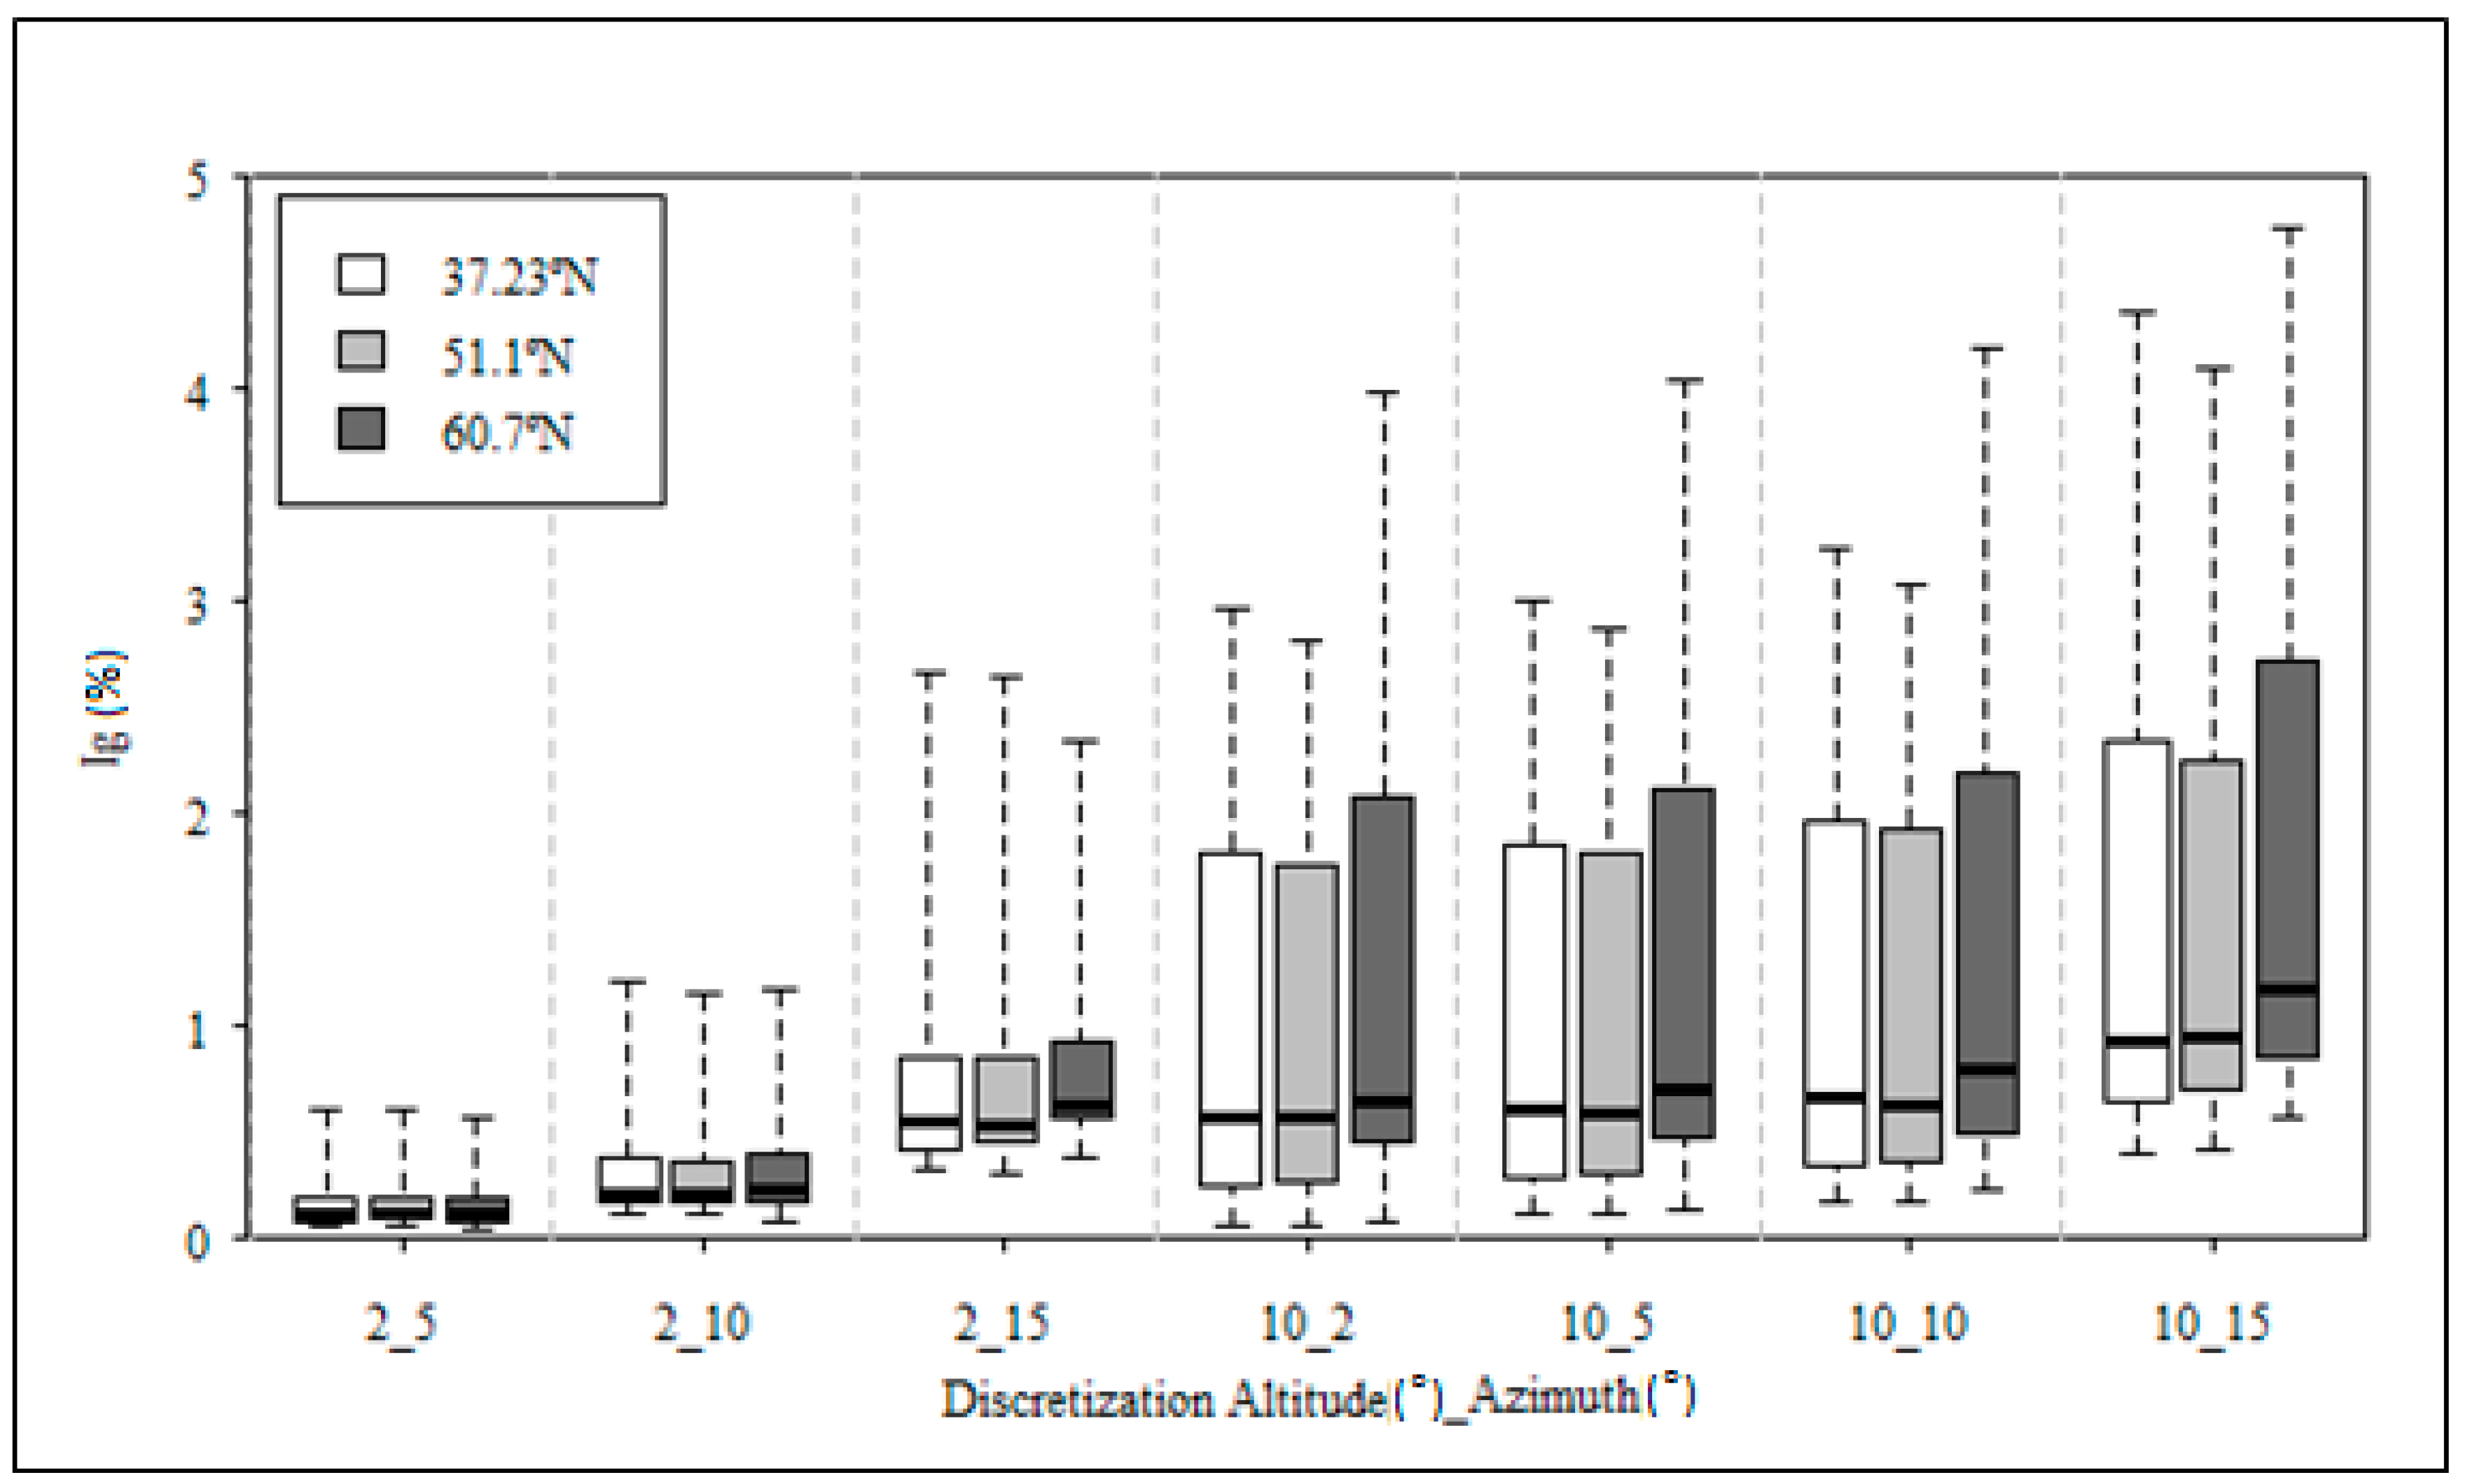
The global distribution of
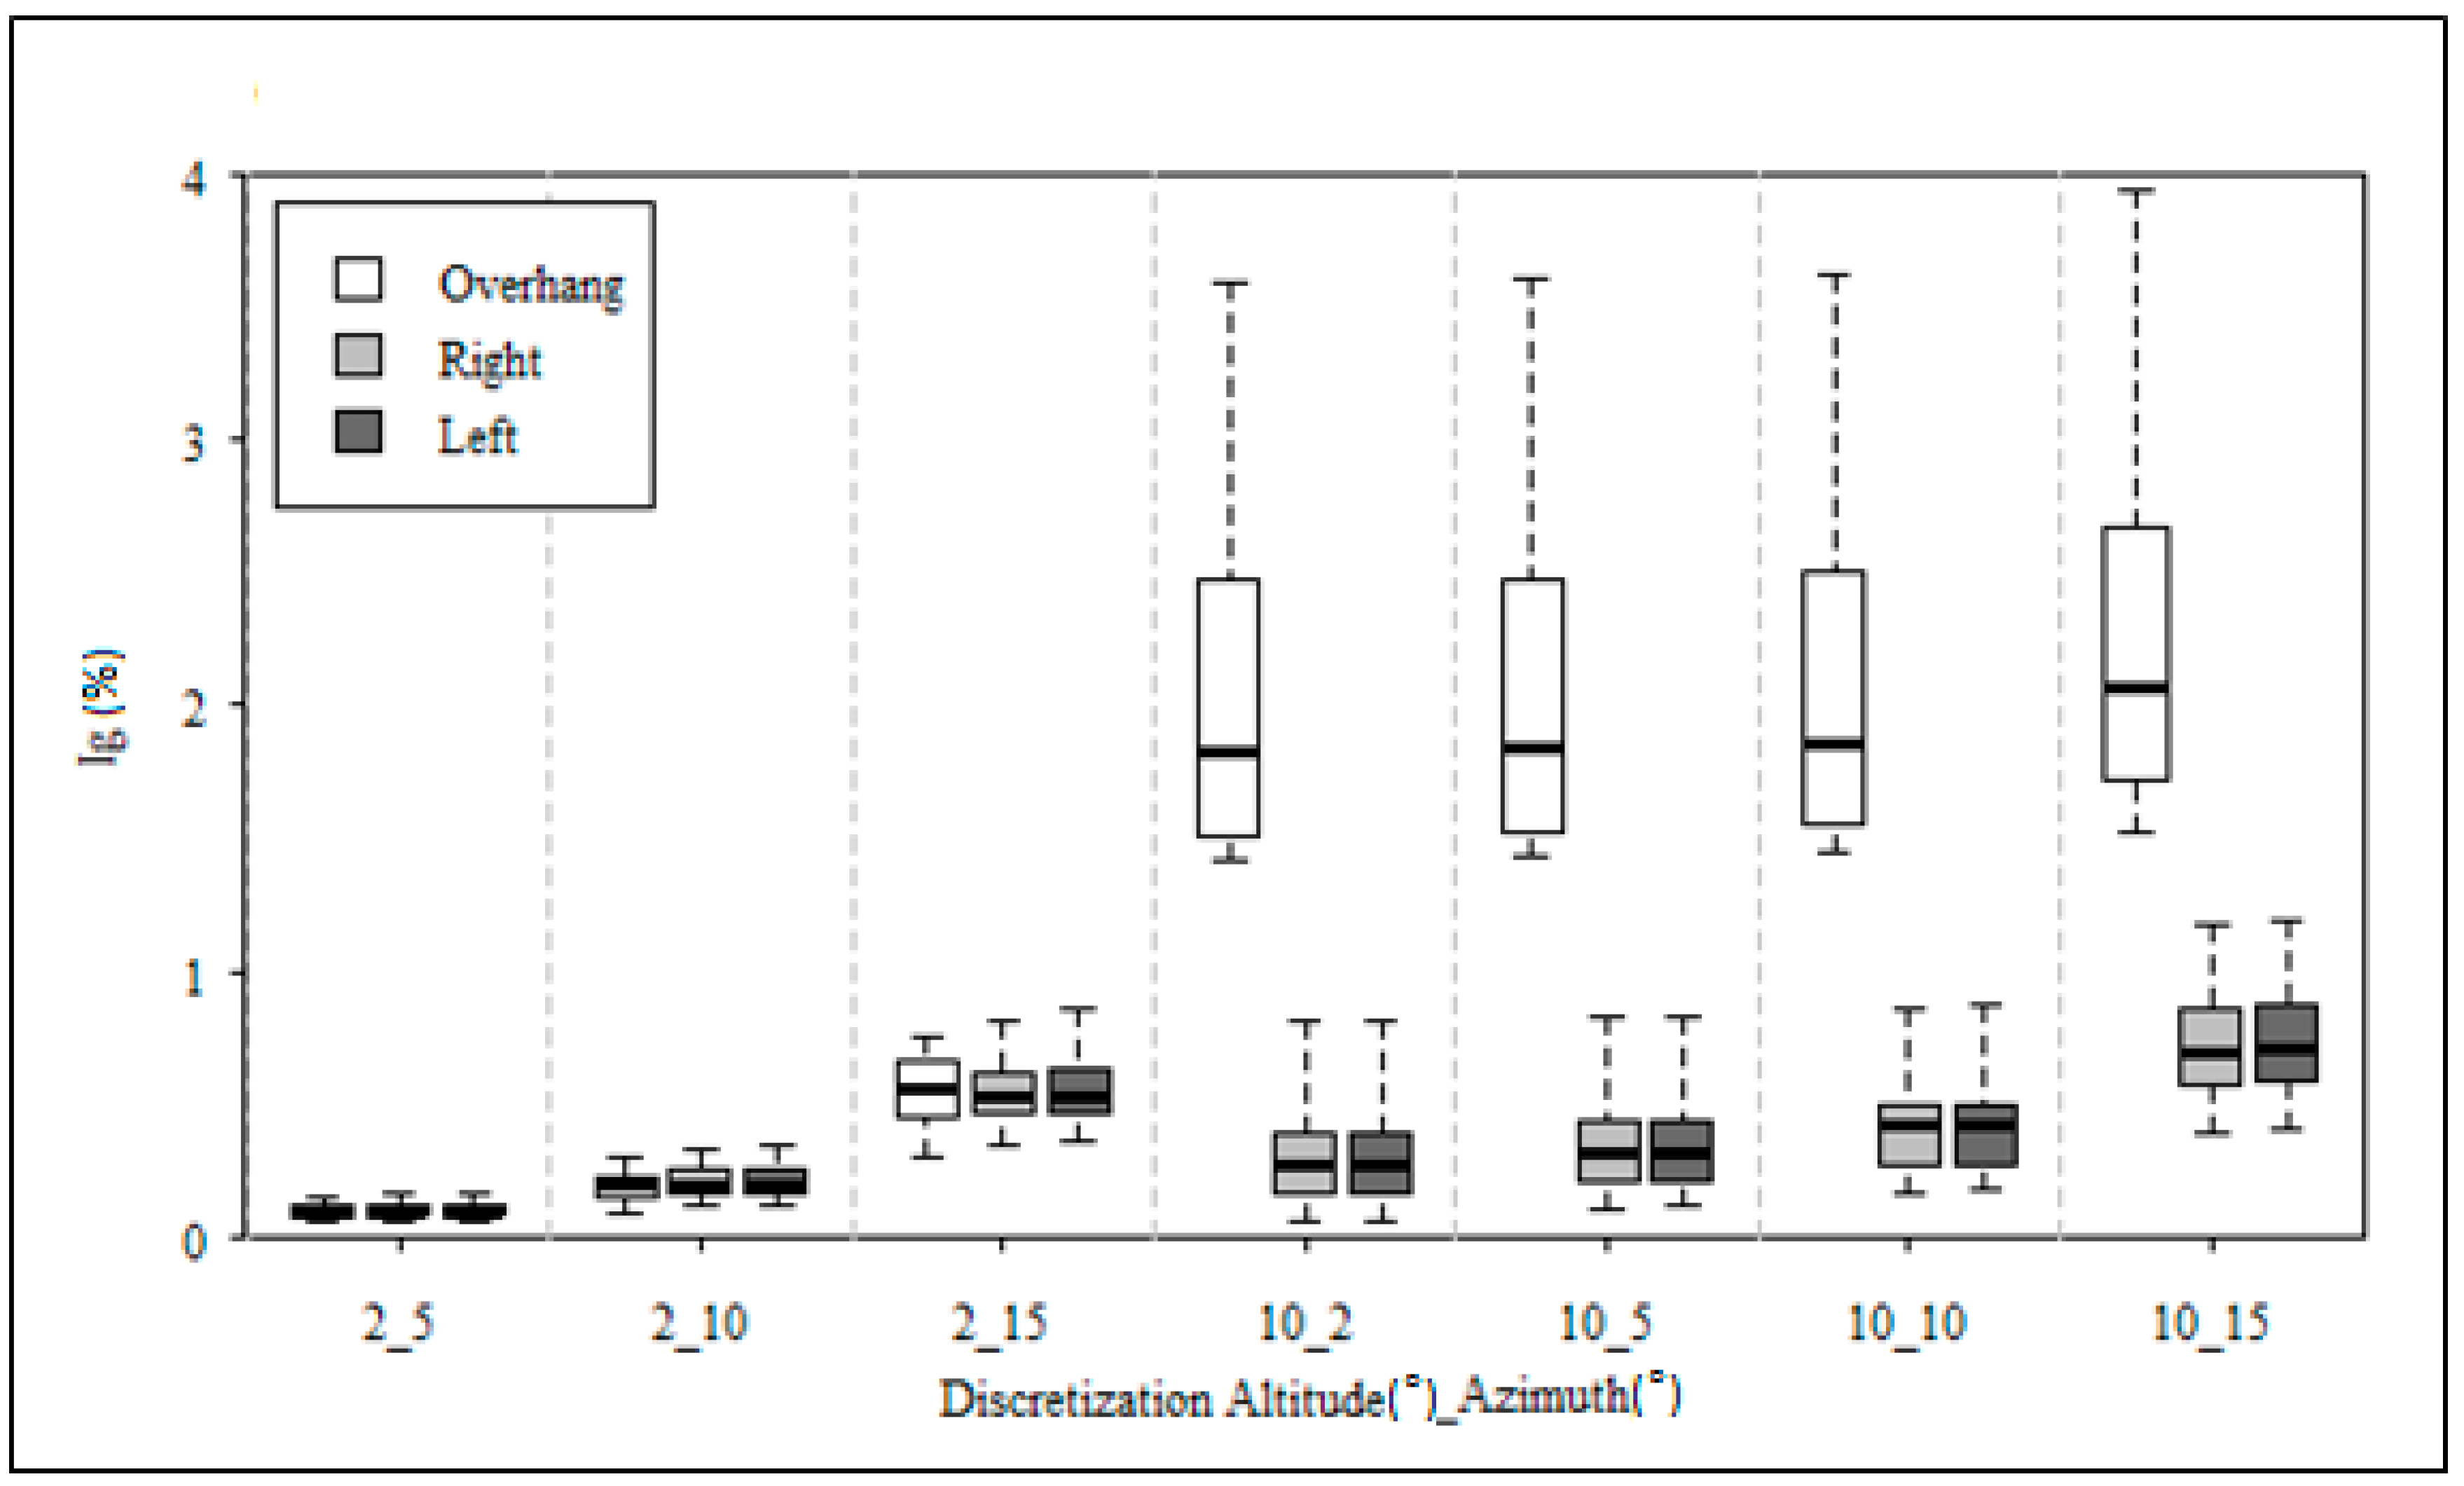
for all cases, in terms of discretization level and shading devices, is shown as a box plot in
Figure 6. According to Tukey [
24] definitions, a thin box marks out the 25th to 75th percentiles, a line within the box marks the median, and a line marks the outer part of the distribution.
It can be seen that the type of shading device does not impact on values for configurations with 2° azimuth discretization levels, since distributions are very similar. dispersion slightly increases with the increase in azimuth discretization, with a median value of about 0.4% for the three types of shading device. However, unsurprisingly, altitude discretization has a more significant influence on overhangs than on sidefins, where the former trend caused by the change in azimuth discretization still remains. Thus, for overhangs, the situation changes from a maximum error smaller than 1% for 2° discretization, to errors up to 4% for 10° altitude discretization. The results for left and right sidefins are almost identical and the small differences are due to the dependence of radiation on cloud cover.
3.3. Influence of Latitude and Orientation
Figure 7 shows the variation in
as a function of location. Although a deeper study that included more locations at a given latitude would be necessary to draw firm conclusions, it seems there is no significant influence of latitude on the median values of this indicator for the three locations considered. However, an increase of maximum values is observed, reaching a value of 4.74% for Whitehorse (60.7° N), 10° and 15° altitude and azimuth discretization, respectively, 2 m² window and 100% shading.
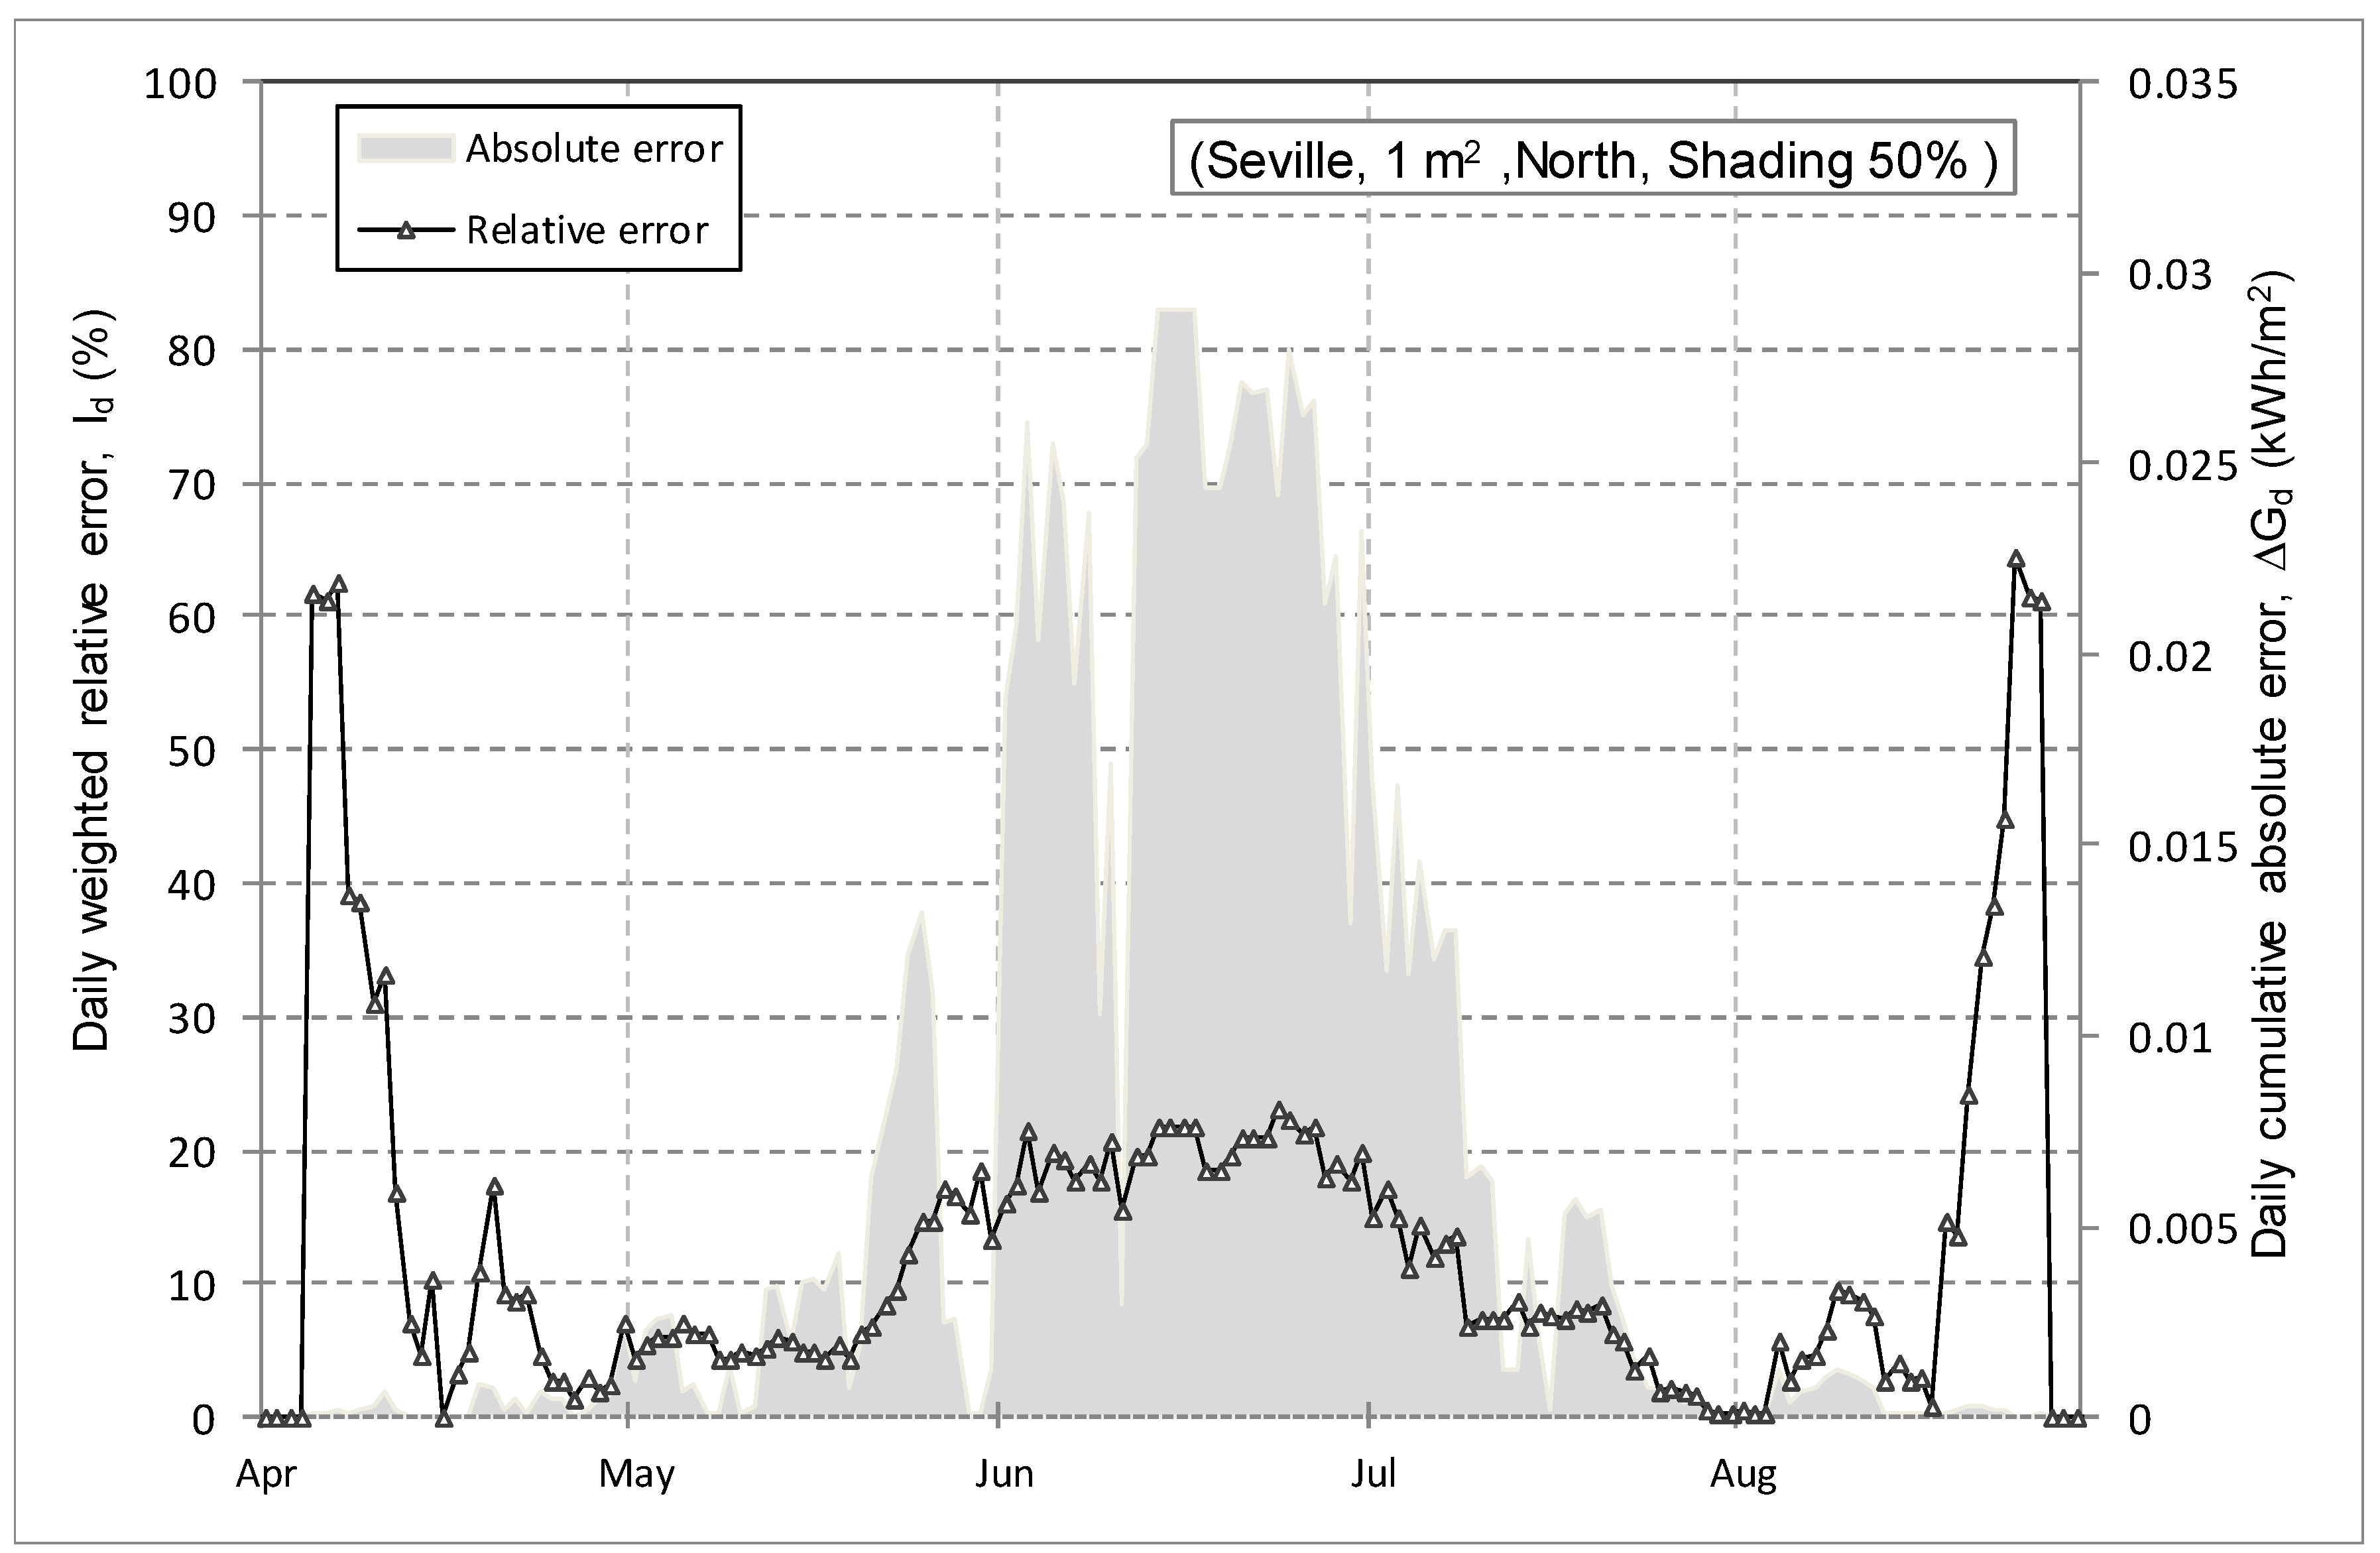
The highest value of
(23.87%) is found for the North orientation. However, the high relative errors are associated with small incident energies. Thus, the corresponding absolute energy error is 2.11 kWh/m², in contrast to the value of 16.12 kWh/m² obtained for the South orientation and its maximum
value. In this respect, it is observed that
for the North orientation is 3.35 kWh/m², much less than for the South, with a value of 17.91 kWh/m². However, the relative error associated with these values is 22.60% for the North orientation in contrast to the 3.61% for the South.
Figure 8 shows the daily variation in
calculated for one day (
) and the absolute error of the daily incident energy (
) for the Seville, 1 × 1 m
2 window and 50% H overhang and 50% W sidefins, illustrating the amplification of relative error due to small quantities of incident energy on the window for a particular case.
3.4. Influence on CPU Time
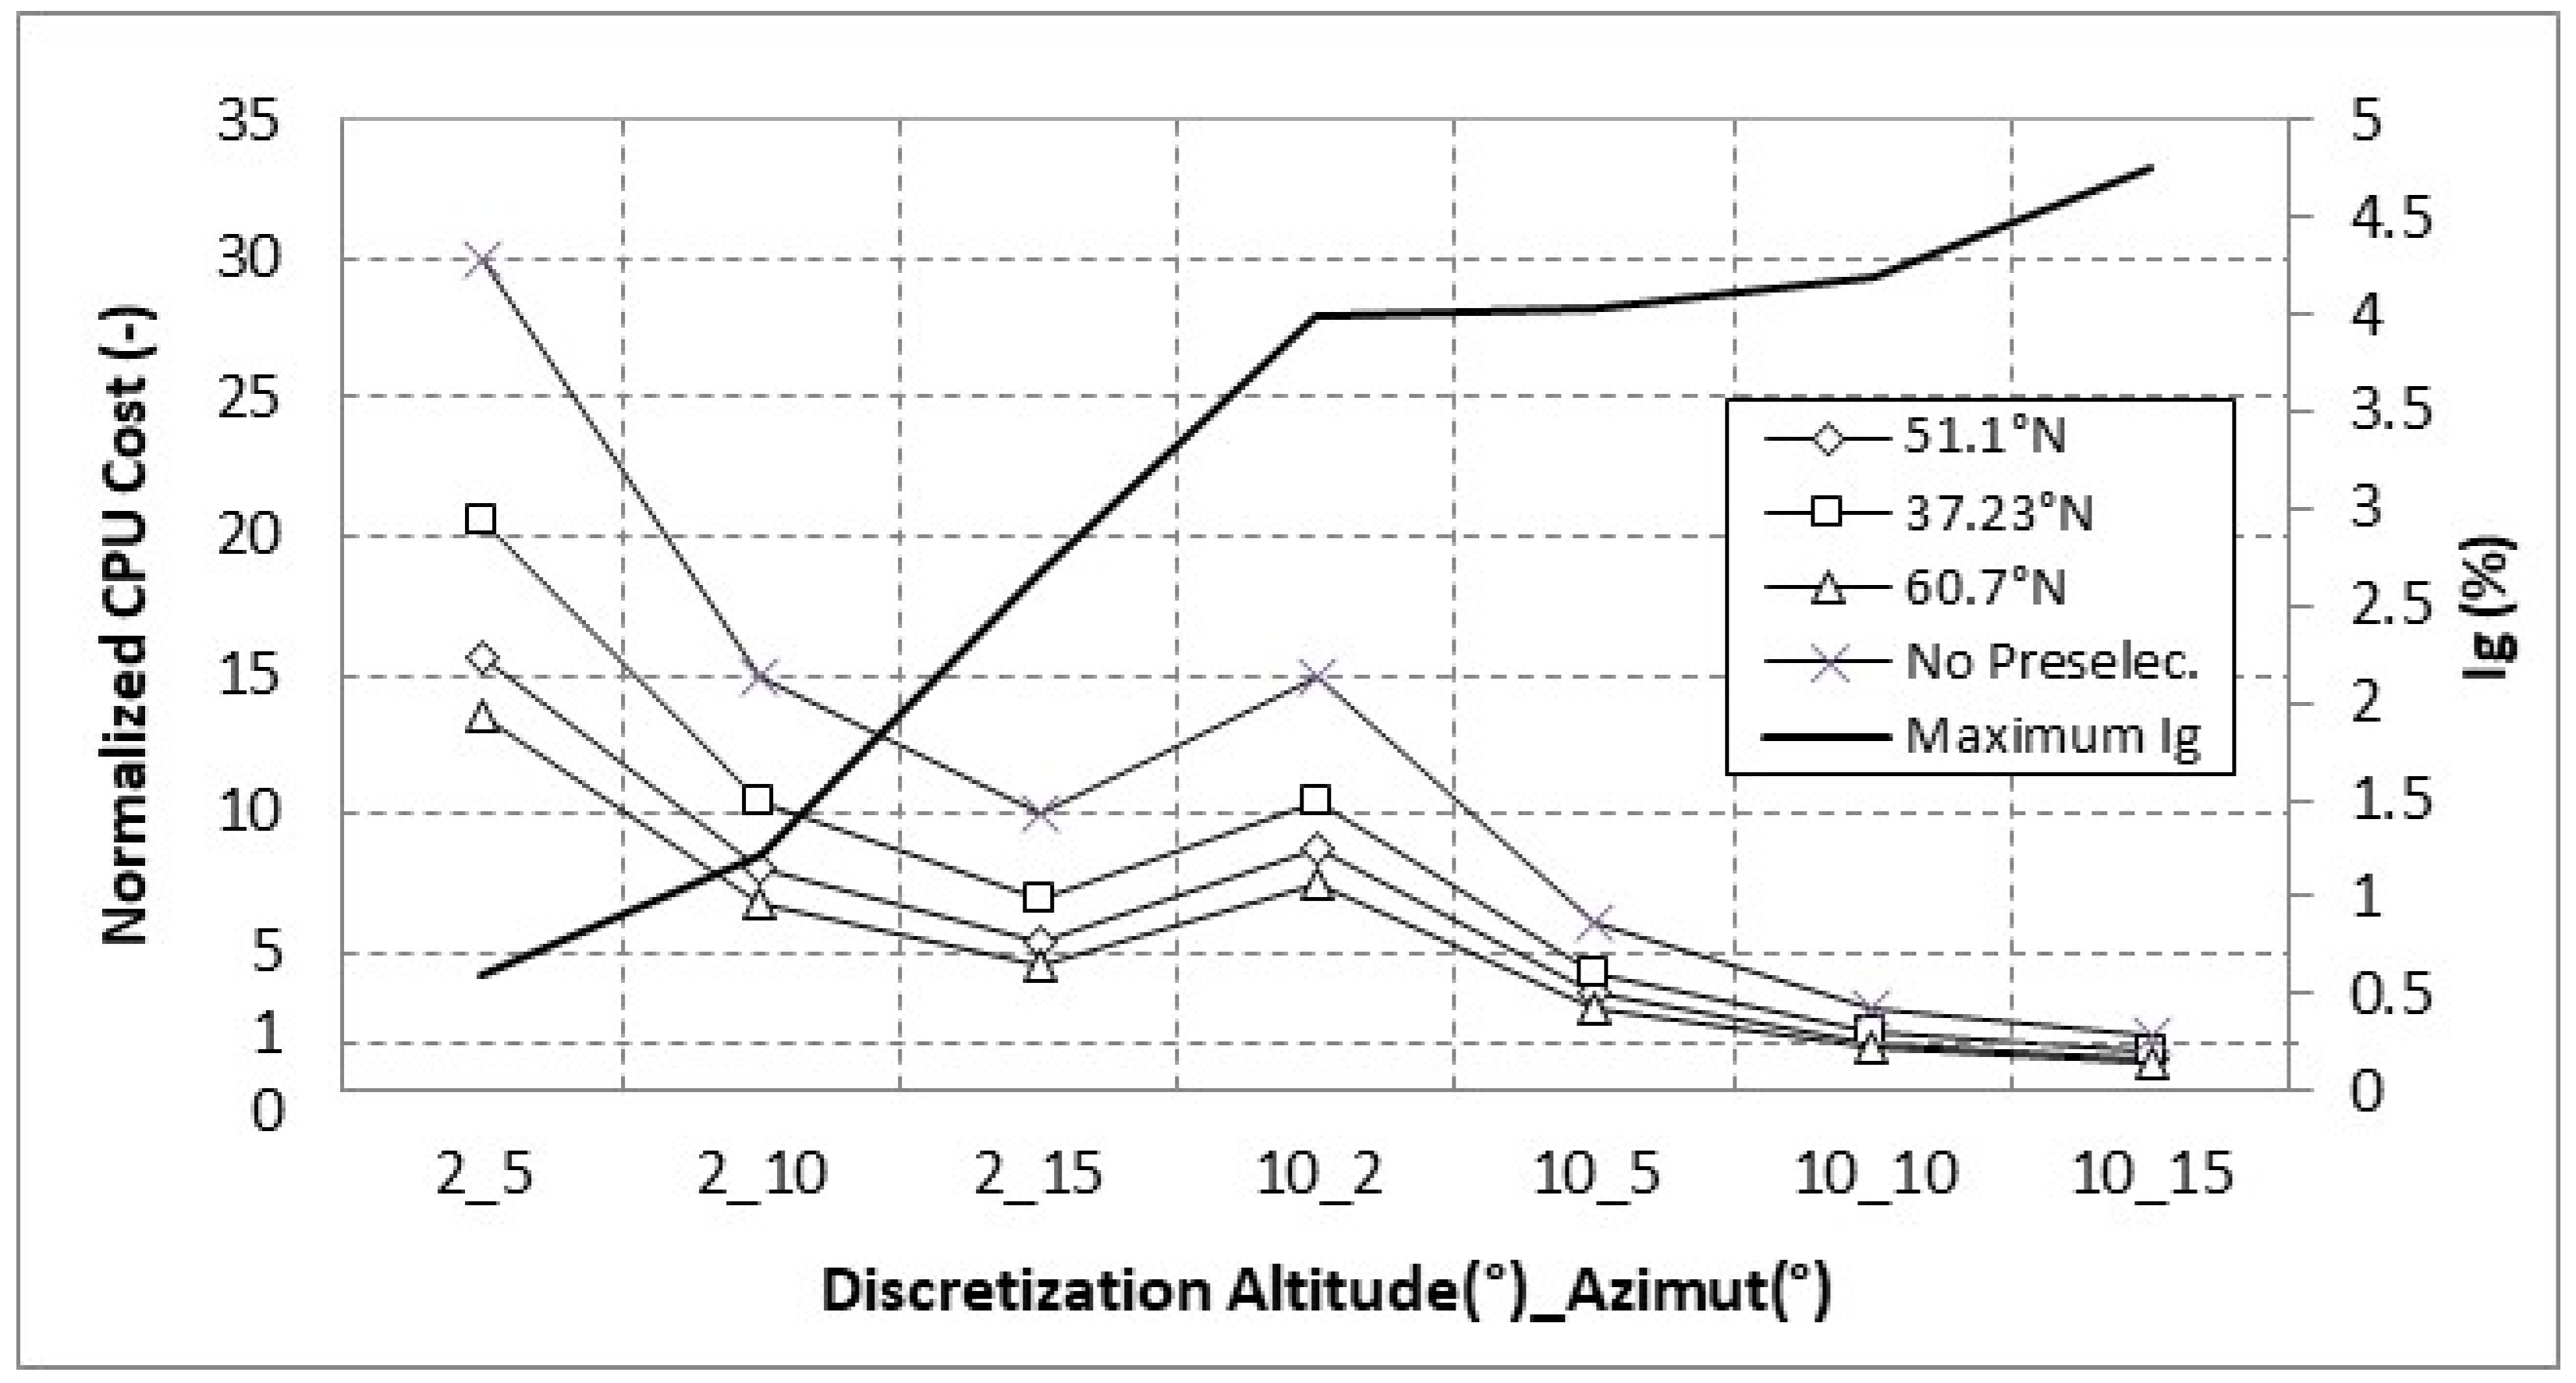
Figure 9 shows the Normalized CPU Cost and maximum
values obtained in all simulations. Computational cost will depend on location because, during the shading calculation process, it is possible to exclude discrete positions where the sun will never be and to select only the right ones in advance.
Figure 9 also shows the computational cost when that selection is not taken into account. It is known that the associated computational cost is directly proportional to the number of positions in each level of angular discretization. Thus, it is observed that the computational cost associated with the most accurate discretization is about 20 times the one obtained with the least one, on average. Furthermore, the maximum error of
associated with the least accurate discretization increases about eight times with respect to the most accurate one.
On average, maximum values increase by 1.6 and four times for each 5° and 8° azimuth and altitude increase, respectively. This result suggests that the maximum values are more sensitive to altitude than to azimuth variations. Thus, for a 2° altitude discretization, average indexes of normalized CPU cost and values are 10 and 1.49, respectively, while for a 10° altitude discretization, the former variables are 2.2 and 4.3, respectively.
Moreover, the average increase in the normalized CPU cost is about 3.6 for a 5° azimuth increase.
The average saving obtained after a preliminary selection (pre-selection) is up to 50%, approximately. However, in terms of absolute values, saving is greater for more accurate discretization levels, achieving a value of 13.4, while it is about 2 for 10°Al-15°Az. Then, the pre-selection process is more justified for the most accurate discretizations.
The required computational effort increases by 1 and 0.7 points, on average, for every 1° increase in altitude and azimuth discretization level, respectively, due to the higher number of hemispherical sky divisions. However, maximum decreases by 27% on average for a given altitude variation with respect to the same azimuth variation.
By way of illustration, in a building with a geometry defined by 177 polygons, 99 ms would be necessary to obtain the corresponding shades for each solar position [
25]. Considering the results shown in
Figure 9, the number of sun positions required, after the pre-selection process and by using 2°Al-5°Az instead of 10°Al-5°Az, would increase from 376 to 1692. This would allow for reducing the error of incident solar radiation from 4% to 0.6%, with an increase of only 2.2 min in an annual simulation. Obviously, this increase in absolute computational time will become smaller as computer capacity improves and the viability of its application will depend on the type of ongoing study (design, optimization, parametric analysis, energy labelling, etc.).
4. Conclusions
The most widespread building energy performance simulation programs still have some simplified strategies that were developed to reduce the computation time associated with the algorithms used for shading calculations. Some of these simplifications are to calculate shades during a representative day of a certain period of time (twenty or thirty days) or to make shading calculations only for some solar positions after a discretization process of the hemispherical sky.
The present work studies the influence of the discretization level of the hemispherical sky on the estimation of incident direct radiation on building surfaces and also on the required computation time. Different window sizes, overhang and sidefins typologies, latitudes and shading devices orientations, which have led to more than 6000 configurations, have been analysed. A weighted average value considering the eight main orientations has been used in order to measure the error for incident radiation.
In terms of annual incident solar energy, the results show that the maximum error values are about 5% if a low level of angular discretization (altitude, 10°; azimuth, 15°) is used. These error values are smaller than 1% for all configurations when a more accurate discretization (altitude, 2°; azimuth, 5°) is considered. Although annual average errors seem to be not significant, a great number of the configurations analysed show errors of shading factor on a window up to 30% in solar positions with high values of incident radiation, if a low level of angular discretization is taken into account.
From a study of computation time, it is estimated that an increase of only two minutes is required in order to achieve a correct shading calculation in building energy simulation programs. Thus, considering the continuous evolution of computation capacity, it seems unreasonable to keep the current error associated with the algorithms used in this kind of simulation program.
Authors think that a future development would be the optimisation of the hemispherical sky mesh by applying a previous algorithm which is able to decide on the local discretization level depending on location and orientation.

