Article

Application of VMD and Hilbert Transform Algorithms on Detection of the Ripple Components of the DC Signal

1
College of Electrical and Information Engineering, Hunan University, Changsha 410082, China
2
Zhejiang Institute of Metrology, Hangzhou 310018, China
3
School of Electronic Information, Wuhan University, Wuhan 430072, China
4
State Grid Yangzhong County Electric Power Supply Company, Yangzhong 212200, China
*
Author to whom correspondence should be addressed.
Energies 2020, 13(4), 935; https://doi.org/10.3390/en13040935
Submission received: 1 January 2020 / Revised: 13 February 2020 / Accepted: 15 February 2020 / Published: 19 February 2020

Abstract

:
Accurate detection of ripple components of the direct-current (DC) signals is essential for evaluating DC power quality. In this study, the combination algorithm based on variational mode decomposition (VMD) and Hilbert transform (HT) is applied to detect and analyze the characteristics of the ripple components of the DC disturbance signals. Firstly, the optimal modal number of VMD algorithms is comprehensively determined by observing the center frequencies of the mode components and the Index of Orthogonality (IO) of mode components. Through utilizing the VMD algorithm, the DC disturbance signal is accurately decomposed into a series of amplitude modulation-frequency modulation (AM-FM) functions. Then, the HT algorithm is applied to each AM-FM function to obtain the corresponding instantaneous amplitude and frequency, and the characteristics of DC disturbance signal are determined. Some case studies are implemented to analyze the ripple components of the DC disturbance signal with the VMD-HT and empirical mode decomposition (EMD) algorithm. Finally, the experiment results of Gree Photovoltaic Cabin have verified the feasibility and effectiveness of the proposed combination VMD-HT algorithm by comparison with EMD and the window interpolation fast Fourier transform (WIFFT) algorithms.

1. Introduction

With the development of distributed energy such as PV systems, wind generation, or battery storage, and the increase of user-side direct-current (DC) loads, DC transmission, and distribution systems have been widely concerned due to their convenient access and low conversion losses [1,2,3,4]. The DC distribution systems become more attractive in industrial plants [5], which usually include various DC loads and AC loads, and use power electronic converters to realize AC and DC power conversion. These power converters provide fast response capability and effective filtering against power disturbances [6,7,8]. However, compared to the study on power quality (PQ) factors of AC power systems, many PQ issues have not been explicitly resolved or studied [9,10,11], including harmonics, interharmonics, sag, swell, interruptions, transients, and notch, which are mainly caused by load changes, switching phenomena, power electronic equipment, transformer charging, non-linear loads and environmental factors [12]. In order to ensure reliable, secure and quality supply of power, it has it has become an urgent task for distribution system operator to continuously monitor these disturbances. In these disturbances, the ripple is a very complex subject, and the ripple detection in DC links is critical for the evaluation of PQ of DC systems, because evaluating PQ reasonably and effectively is the first step in improving power supply quality [13], the quantification for ripple are convenient for the construction of DC PQ evaluation model.
Currently, many methods for ripple detection of AC signal have been proposed [14,15,16,17,18,19,20,21,22,23,24,25,26,27,28,29,30,31,32], such as Hilbert-Huang transform (HHT) [14,15], fast Fourier transform (FFT) [16,17,18], empirical mode decomposition (EMD) [19,20] and variational mode decomposition (VMD) [21,22] etc. The FFT algorithm is broadly utilized in industrial applications because of its fast and efficient advantages [16]. In order to avoid energy leakage and improve the detection accuracy, the window interpolation fast Fourier transform (WIFFT) algorithm is presented [23,24]. However, the WIFFT algorithm is constrained by the performance of window functions [25,26]. Especially, the mutual interference between harmonics has great influence on the accuracy of harmonic analysis when the selected window function has the poor ability of the spectrum leakage suppression. Therefore, the WIFFT is not effective to detect and analyze the non-stationary ripple components, where the accuracy is determined by the fixed size of analysis window [26]. In order to analyze the non-stationary ripple components, the HHT algorithm is widely used [27,28]. In addition, the EMD algorithm is one of the most well-known methods and has shown promising results in various application areas [29]. The basic idea of EMD is to decompose time domain signals into several modes with different frequency characteristics according to different frequency components. However, the EMD algorithm is sensitive to the noise, suffers from the modal aliasing and lacks the mathematical theory [28]. It is worth noting that the VMD algorithm is firstly proposed in [21], which improves the modal aliasing and the noise robustness of the EMD algorithm. In the early stage, the VMD algorithm was widely utilized in rotating machinery fault diagnosis, transformer fault diagnosis, lightning fault location of high voltage transmission lines [30]. Recently some VMD algorithms focused on the disturbances signal of AC PQ are reported in [31,32]. The VMD and decision tree are utilized to detect and classify the disturbance signals of AC PQ, which performs good performance in detecting and analyzing the non-stationary disturbance signals of AC signal, including the fundamental, harmonics, interharmonics [32]. Therefore, the VMD algorithms is promising in detecting the real-life non-stationary signals of DC links. There are only a few articles on the ripple detection of DC signal [33]. The discrete Fourier transform (DFT) algorithm for ripple evaluation in DC Low Voltage networks are presented in [33], which exhibits similar performance with the analog bandpass filter. However, it is limited for the random noise and the effective signal in the low-frequency band [34].
In this paper, a combination algorithm based on VMD and Hilbert Transform (HT) is proposed to detect the ripple components of DC signals for the first time, which makes use of the advantages that the VMD algorithm is well processing densely distributed signals and the HT can accurately describe the characteristics of non-stationary signal transient parameters [35]. In the VMD algorithm, the Alternate Direction Method of Multipliers (ADMM) is utilized to iteratively solve the optimal solution of the variational model, and the optimal mode number is comprehensively determined by observing the center frequencies of the mode components of the input DC signals and the Index of Orthogonality (IO) of mode components, then each modal component is closely around the corresponding central frequency. Thus, the VMD algorithm theoretically overcomes the modal aliasing, moreover, the VMD method essentially behaves as a wiener filtebank with adaptive center frequencies, which is robust to noise. Finally, the comparative experiments with EMD and WIFFT algorithm are performed to prove the effectiveness of the proposed VMD and HT(VMD-HT) algorithm. All experiments are carried in the Gree photovoltaic cottage.

2. Definition of DC Signals

In this section, the compositions of DC signals are defined and analyzed.
Referring to the AC signal, the DC signal mainly includes three parts and it can be defined as follows.
F ( t ) = D + i = 1 m X i ( t ) + N ( t )
where D is the main DC component, i = 1 m X i ( t ) represents the ripple component, and N ( t ) represents the noise interference, respectively. m is the number of ripple components of input DC signals. Besides, the sag/swell components may exist in the input DC signals, while this study mainly focusses on the detection and analysis of the ripple component.
The ripple component of the DC signal can be further defined as follows
i = 1 m X i ( t ) = 2 X 1 cos ( ω t + ϕ 1 ) + 2 X 2 cos ( 2 ω t + ϕ 2 ) + + 2 X m cos ( m ω t + ϕ m )
where ϕ i represent the initial phase angle of the i-th ripple component, respectively.
Then, the RMS (Root Mean Square) value of DC signal ripple is obtained:
X M = X 1 2 + X 2 2 + + X m 2
From (1) and (3), the ripple coefficient of the DC signals can be obtained as,
μ = X M D × 100 %
As one important power quality index, the ripple coefficient μ can also be utilized to assess the PQ of the DC signals. In addition, the noise interference of DC signals is represented by random noise and can be measured by signal-to-noise ratio.

3. The Proposed Detection Algorithms of DC Signals Based on VMD-HT

In this section, the detection algorithms of the DC signals are proposed, including VMD and HT algorithms. Firstly, the principle of VMD algorithm is analyzed in detail, where the complex DC signals can be decomposed into K modes. Next, the HT algorithm is utilized to obtain the instantaneous amplitude, frequency and start-stop time of each mode. Finally, the selection of preset decomposition scale K is also presented.

3.1. Variational Mode Decomposition

In general, the VMD algorithm is an adaptive, quasi-orthogonal and completely non-recursive decomposition method, consisting of classical Wiener Filtering, Hilbert Transform and frequency mixing. It decomposes the input signals composed of multi-components into several inherent modes with limited bandwidth, and most of these modes are closely around their corresponding central frequencies, which meet the definition of intrinsic mode functions (IMFs) [31].
Unlike the cyclic sieving decomposition used by EMD algorithm, the VMD algorithm transfers the signal decomposition process to the variational framework and achieves adaptive signal decomposition by searching the optimal solution of the constrained variational model. By solving the variational model iteratively, the adaptive decomposition of the signal frequency band can be completed according to the frequency domain characteristics of the decomposed signal, and several band-limited intrinsic mode functions (BLIMFs) components can be obtained, where the sum of estimated bandwidth of each BLIMFs is the smallest and equals to the decomposed signal [36]. For the original signal f, the corresponding constrained variational model expression [31] is
{ min { u k } , { ω k } { k t [ ( δ ( t ) + j π t ) u k ( t ) ] e j ω k t 2 2 } s . t . k u k = f
where { u k } ( k = 1 , 2 , , K ) represents the k-th mode component obtained by decomposition, { ω k } represents the corresponding central frequencies of the k-th mode component,   2 2 represents the square of norm-2. The first expression of Equation (5) is the optimization objective, and “s.t.” is the abbreviation of “subject to”, which means the constraints of the related optimization problem.
To obtain the optimal solution of the constrained variational problem, an augmented Lagrange function is introduced to transform the constrained variational problem into a non-constrained variational problem [31], which can be expressed as follows:
L ( { u k } , { ω k } , { λ } ) = α k t [ ( δ ( t ) + j π t ) u k ( t ) ] e j ω k t 2 2 + f ( t ) k u k ( t ) 2 2 + λ ( t ) , f ( t ) k u k ( t )
where α represents the quadratic penalty factor, which can guarantee the accuracy of signal reconstruction in the presence of Gauss noise, and λ represents the Lagrange operator, which can be used to maintain the strictness of constraints. The first term of the augmented Lagrange function represents the quadratic penalty term, and the last one is the Lagrangian multipliers term.
To seek for the optimal solution of the constrained variational problem (the saddle point of the augmented Lagrange function), the alternating direction multiplier method (ADMM) is utilized. By calculation, the expression of u k n + 1 can be given as follows:
u k n + 1 = arg min u k X { α t [ ( δ ( t ) + j π t ) u k ( t ) ] e j ω k t 2 2 + f ( t ) i u i ( t ) + λ ( t ) 2 2 2 }
where X represents all desirable sets of u k . The Equation (7) can be transformed into the frequency domain by utilizing the Parseval/Plancherel Fourier equidistant transformation, it will lead to
u ^ k n + 1 = arg min u ^ k , u k X { α j ( ω ω k ) [ 1 + sgn ( ω ) ] u ^ k ( ω ) 2 2 + f ^ ( ω ) i u ^ i ( ω ) + λ ^ ( ω ) 2 2 2 }
where sgn ( ω ) = ( ω ) / | ω | , x ^ ( ω ) represents the Fourier transformation of signal x ( t ) , ω is random frequency.
In the reconstructed approximation term, the conjugate symmetry characteristics of real signals can be used to transform Equation (8) into a half-space integral form of non-negative frequencies, which can be obtained as,
u ^ k n + 1 = arg min u ^ k , u k X { 0 [ 4 α ( ω ω k ) 2 | u ^ k ( ω ) | 2 + 2 | f ^ ( ω ) i u ^ i ( ω ) + λ ^ ( ω ) 2 | 2 ] d ω }
For positive frequencies, it is easy to get the solution of this quadratic optimization problem if making u ^ ( k ) = 0 as follows:
u ^ k n + 1 ( ω ) = f ^ ( ω ) i k u ^ i ( ω ) + λ ^ ( ω ) 2 1 + 2 α ( ω ω k ) 2
From (10), u ^ k n + 1 ( ω ) can be equivalent to the Wiener filter of the current residual signal, and the full spectrum of the real mode can be obtained by conjugate symmetry. Thus, the real part { u k ( t ) } can be achieved through utilizing the inverse Fourier transform of { u ^ k n + 1 ( ω ) } .
Similarly, to obtain the minimum value of ω k n + 1 , the central frequency updating problem can be transformed into the corresponding frequency domain, which can be expressed as follows,
ω k n + 1 = arg min ω k { 0 ( ω ω k ) 2 | u ^ k ( ω ) | 2 d ω }
By calculations, the solutions of the central frequencies can be given,
ω k n + 1 = 0 ω | u ^ k ( ω ) | 2 d ω 0 | u ^ k ( ω ) | 2 d ω
Therefore, the new value of ω k can be set to the center of gravity of the corresponding modal power spectrum.
To update the Lagrange operator λ [31], the following expression is given,
λ ^ n + 1 ( ω ) λ ^ n ( ω ) + τ [ f ^ ( ω ) k u ^ k n + 1 ( ω ) ]
where τ represent Lagrange multipliers updating parameters.
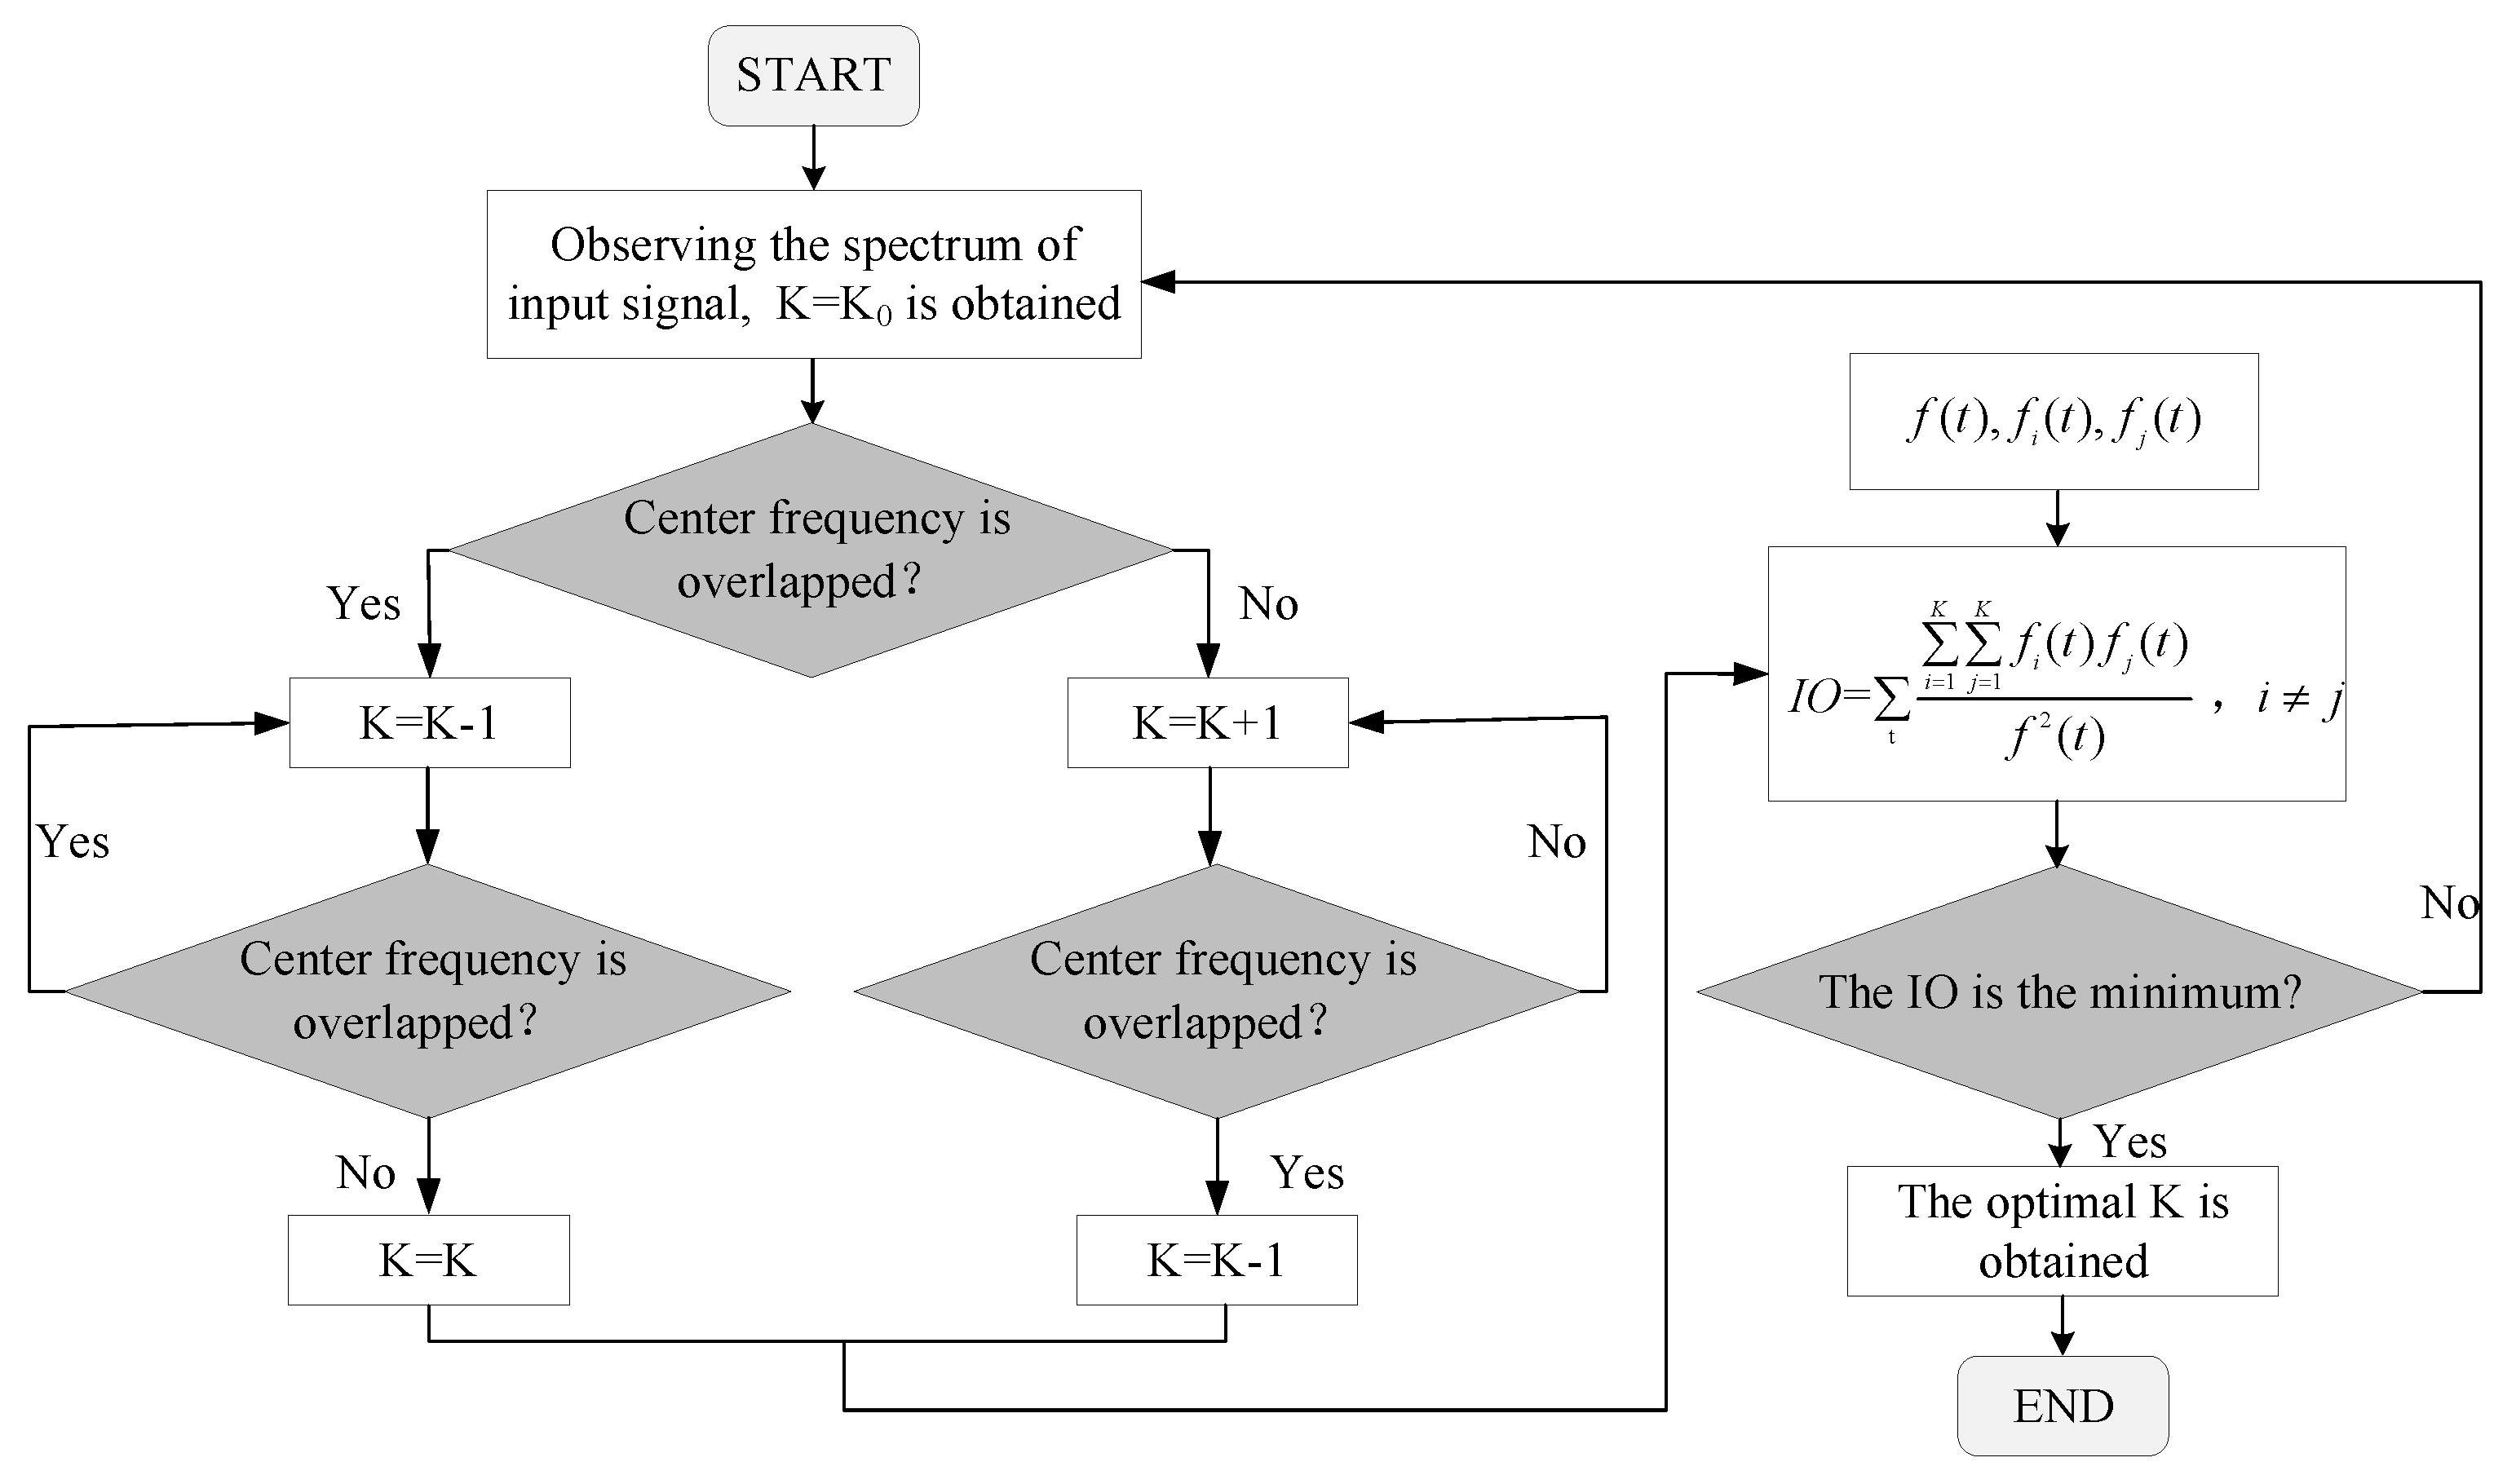
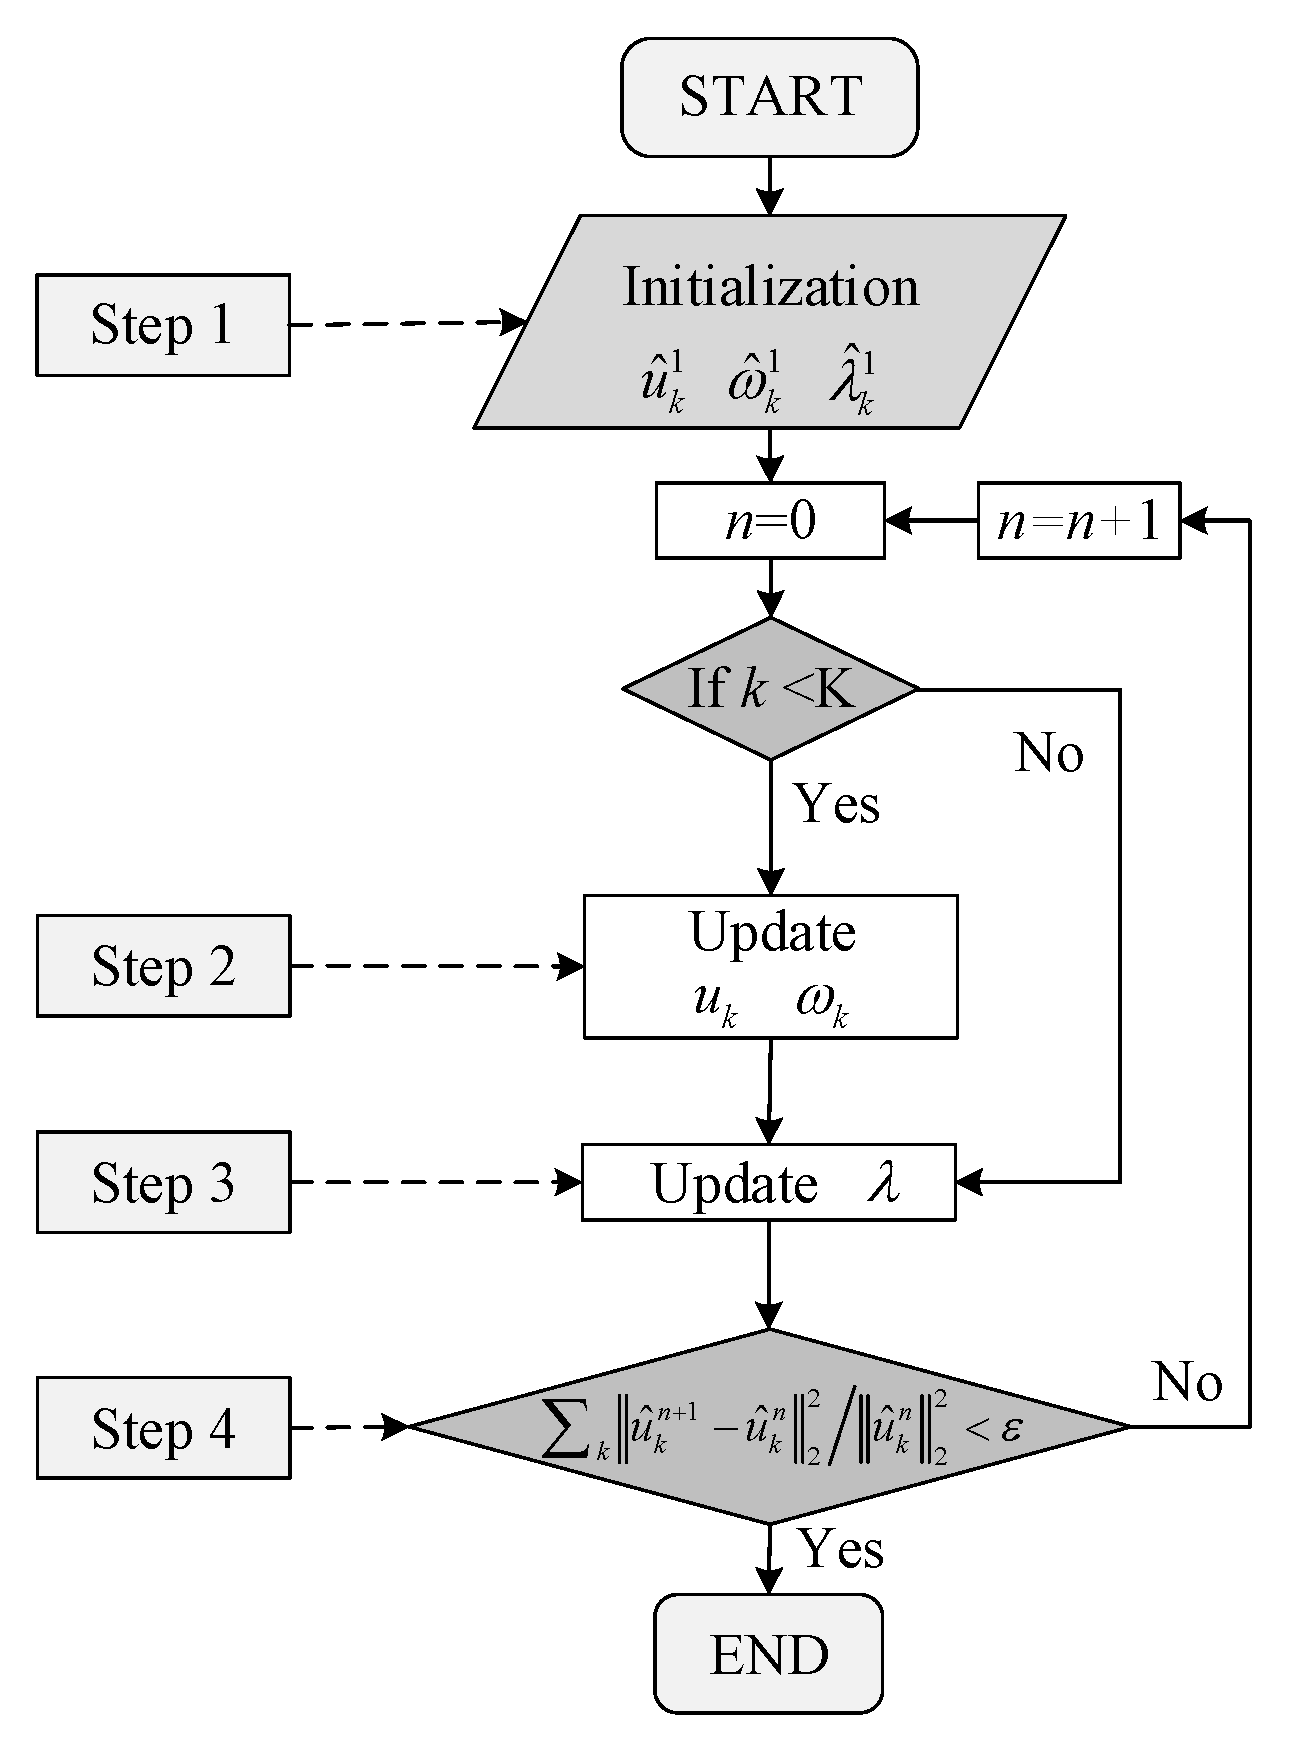
According to the above analysis, the detailed procedures of VMD algorithm are given as follows.
(1) Initialize parameters { u ^ k n + 1 } , { ω ^ k n + 1 } and { λ ^ k n + 1 } ;
(2) Update u k and ω k according to Equations (10) and (12);
(3) Update λ according to Equation (13);
(4) Set the error ε > 0 , If the inequality ( k u ^ k n + 1 u ^ k n 2 2 / u ^ k n 2 2 < ε ) holds, then the iteration stops, else go back to step (2).
According to the above analysis, a finite number of IMFs u k with specific sparsity properties can be obtained non-recursively. The VMD algorithm is more robust to noise, because wiener filter is embedded to update the modes. Flow chart for solution of VMD is shown in Figure 1.

3.2. Hilbert Transform

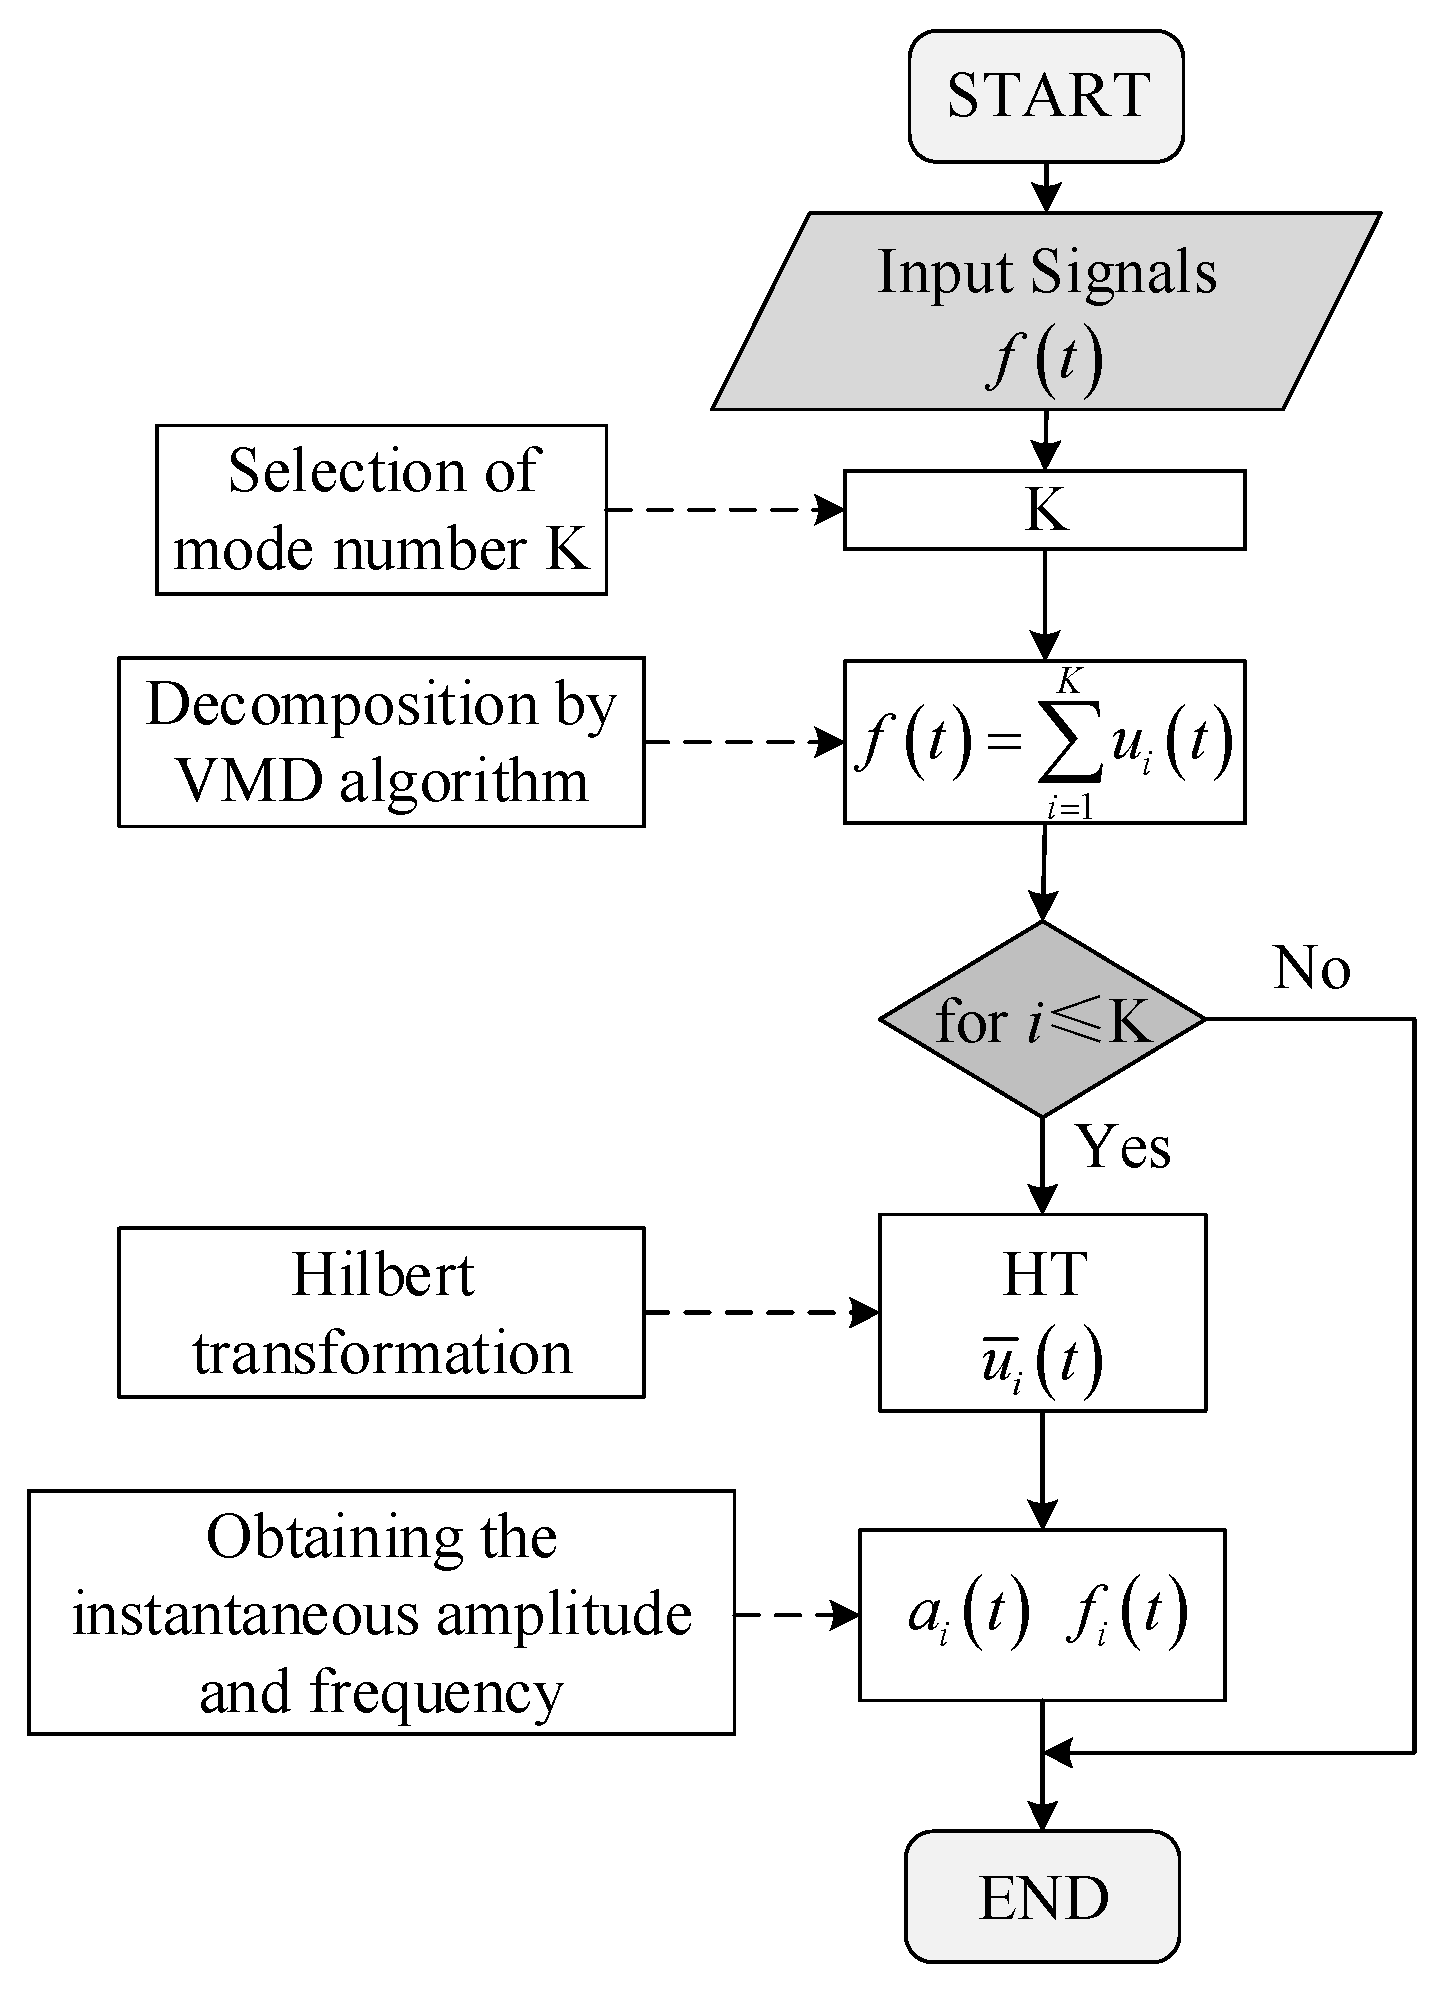
Firstly, the preset decomposition scale K of input signals should be determined through utilizing the Fourier transformation. Then, the PQ disturbance signals can be decomposed into the sum of a series of mode functions with VMD algorithm, and each mode is a FM and AM function. Finally, the instantaneous amplitude and frequency of the corresponding modes are obtained by Hilbert demodulation. The specific steps can be given as follows.
(1) Determine the preset decomposition scale K of input signals.
(2) Decompose f ( t ) into K modes, which can be expressed as follows:
f ( t ) = u 1 ( t ) + u 2 ( t ) + u K ( t )
(3) Obtain the corresponding instantaneous amplitude a i ( t ) and frequency f i ( t ) of mode u i ( t ) through utilizing the Hilbert transformation.
u ¯ i ( t ) = 1 π + u i ( τ ) t τ d τ
The corresponding analytical signal can be given by
u A ( t ) = u i ( t ) + j u ¯ i ( t ) = a i ( t ) e j ϕ i ( t )
Define ϕ i ( t ) as the phase function of u i ( t ) , then it will lead to
{ a i ( t ) = [ u i ( t ) + j u ¯ i ( t ) ] 1 2 ϕ i ( t ) = arctan [ u ¯ i ( t ) / u i ( t ) ]
The instantaneous frequency f i ( t ) of mode u i ( t ) can be obtained through gaining the derivation of phase function ϕ i ( t ) .
f i ( t ) = 1 2 π d ϕ i ( t ) d t
As shown in Figure 2, the instantaneous amplitude, frequency and start-stop time of disturbance signal will be detected by utilizing the VMD and HT algorithms.

3.3. The Selection of Preset Decomposition Scale K

Before processing the DC signals with VMD-HT algorithm, the optimal modal number K should be determined in advance. Whether the set of modal components is reasonable directly affects the final decomposition results. If the presupposed K value is less than the number of useful components in the processed signal, it will cause inadequate decomposition, so that some BLIMFs cannot be decomposed; if the presupposed K value is larger than the number of useful components in the processed signal, it will cause excessive decomposition, resulting in some useless false components, interfering with the original signal. Once the modal number K is known, the detection of the amplitudes and frequencies of these mode components becomes easier and more accurate. Therefore, the determination of mode number K plays an important role in VMD-HT algorithm.
As reported in [31,32], the optimal mode number K can be chosen mainly through observing the central frequencies of the decomposed modes, and then the correctness of the selected K can be determined by using the orthogonal index (IO) [27], which is defined as,
I O = t i = 1 K j = 1 K u i ( t ) u j ( t ) f 2 ( t ) ,   i j
where f ( t ) is the input signal, u i ( t ) and u j ( t ) are the i and j modes, respectively. IO denotes the degree of orthogonality between all modes.
The flowchart of mode number determination is shown in Figure 3. For the VMD-HT algorithm, the different values of K correspond to different IO. The mode number K is initially determined by observing the central frequencies of the decomposed modes. When IO is the minimum value, that is, whether K decreases or increases, IO will increase, then the corresponding K value is optimal, and the VMD-HT algorithm has the highest decomposition accuracy at the moment. Therefore, combined with the observation of central frequencies of the decomposed modes and the value of IO, the mode number K can be determined accurately, the under-decomposed or over-decomposed can be avoided.
4. Simulation Results

In this section, some case studies are implemented to elaborate the proposed detection algorithm based on VMD-HT algorithm, where both the noise-free and noisy condition are considered. The sampling frequency is 1 KHz. Besides, the simulation comparison between VMD-HT and EMD algorithm is conducted in this section.

4.1. DC Voltage Ripple Component without Noise

Assuming that the DC bus voltage is consisted of the main DC component and the ripple components, which can be given as follows,
V d c = D + X 1 cos ( 2 π f 1 t ) + X 2 cos ( 2 π f 2 t ) + X 3 cos ( 2 π f 3 t )
where D = 200 , f 1 = 50 Hz, f 2 = 150 Hz, f 3 = 250 Hz and X 1 = 2 2 , X 2 = 2 and X 3 = 2 / 2 .
The amplitude and spectrum of simulation signal V d c are illustrated in Figure 4. According to the VMD-HT algorithm, the mode number K needs to set before running. As can be seen in the spectrum, the frequency of the ripple components mainly contains 50 Hz, 150 Hz and 250 Hz. Thus, the mode number K is initially selected as 4. In order to better describe the selection process of K, as described in Section 3.3, the center frequency under different K is observed firstly and recorded it in Table 1. As seen in Table 1, when the mode number K is smaller than 4, some modes is missed. However, when the mode number K is bigger than 4, the modes with approximate center frequencies occur, such as 150 Hz and 161 Hz, which means that the over-decomposition of modes may exist. The spectrum of VMD-HT algorithm under K = 4 is shown in the Figure 5, where the ripple components are clearly revealed. Additionally, the IO of VMD-HT algorithm decomposition under different K is shown in Table 2. As can be seen, the IO is the minimum when the mode number K = 4. Therefore, the mode number K is optimal to 4.
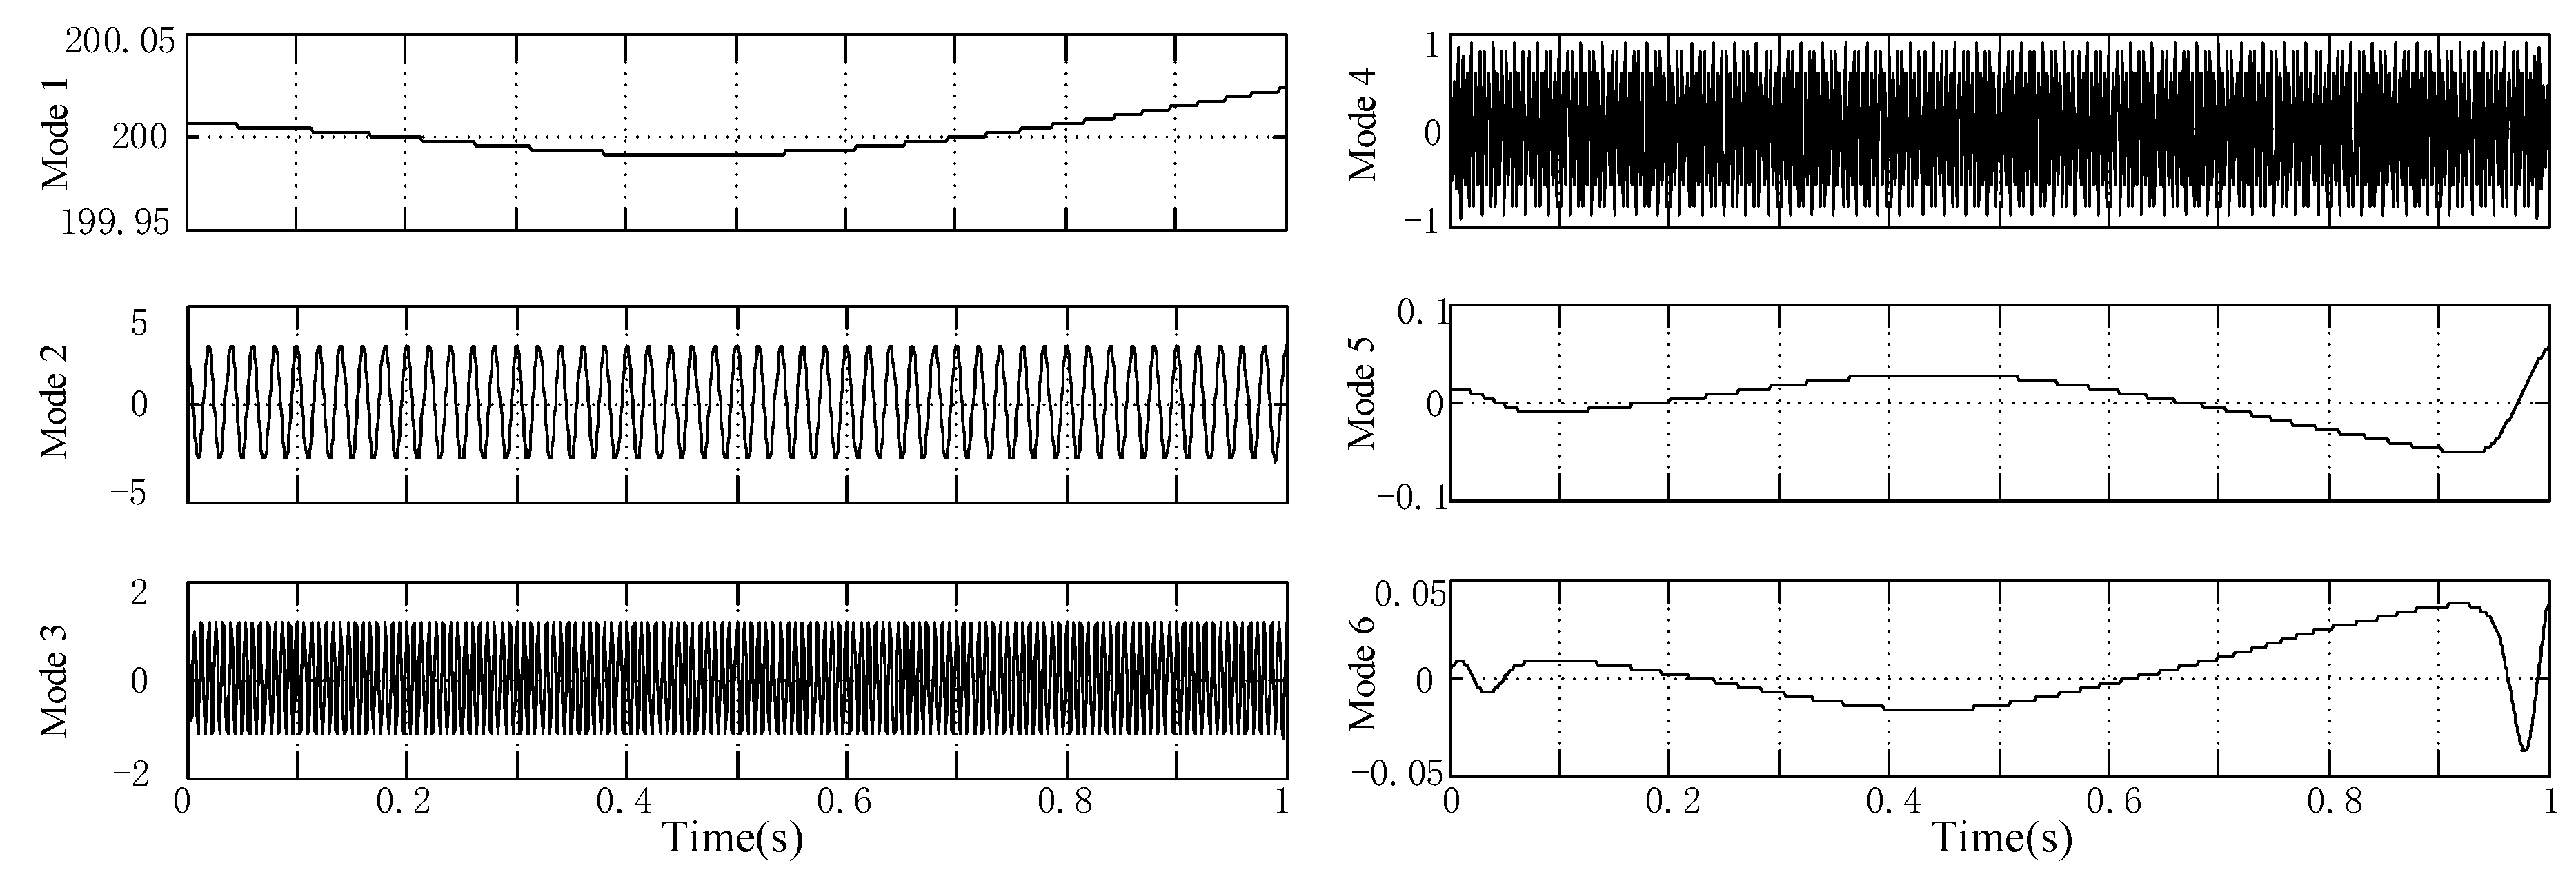
The VMD-HT and EMD algorithms are utilized to decompose the input DC bus voltage. Figure 6 and Figure 7 show the decomposed modes of the corresponding algorithms. By utilizing the VMD algorithm, the complex DC bus voltage is decomposed into 4 modes, including the main DC component and three ripple components. However, the input DC voltage is decomposed into 6 modes when utilizing the EMD algorithm, because the EMD algorithm is a recursive screening mode, and it is essentially a binary filter bank. Therefore, the EMD algorithm belongs to the adaptive decomposition, where its mode number is determined adaptively instead of manually. However, the VMD algorithm employs a non-recursive algorithm framework to adaptively estimate all the signal components, it essentially behaves as a wiener filtebank with adaptive center frequencies. In addition, in the EMD algorithm, the upper and lower envelopes inevitably have errors due to spline interpolation, which causes modal aliasing [19], and the last two modes of Figure 7 are aliasing modes. Although the over-decomposition occurs in the EMD algorithm, the ripple components are still detected accurately with the EMD and VMD algorithm under the noise-free condition.
To further verify the correctness and effectiveness of the proposed VMD algorithms, some case studies are carried out, including (1) X 1 = 2 2 , X 2 = 2 , X 3 = 2 / 2 , (2) X 1 = 2 , X 2 = 2 / 2 , X 3 = 2 / 4 , (3) X 1 = 2 2 , X 2 = 2 2 / 3 , X 3 = 2 / 2 . Other parameters keep constant.
As seen in Table 3, the ripple coefficients of DC voltage are calculated when utilizing the VMD-HT and EMD algorithms. As shown, both the ripple coefficients with VMD and EMD algorithm are close to the actual value, which means that the ripple components can detected and analyzed accurately by utilizing both the two algorithms under the noise-free condition.
Next, the condition that the amplitude of the ripple components of simulation signal is time-variant is considered, where only X 2 of Equation (20) is time-variant. Figure 8 shows the amplitude and spectrum of the input DC voltage.
As shown in Figure 9 and Figure 10, the input DC bus voltage is decomposed different modes by utilizing the VMD-HT and EMD algorithm. With the VMD-HT algorithm, the ripple components with constant and time-variant amplitude are extracted accurately, while the modal aliasing problem will occur when utilizing the EMD algorithm.

4.2. DC Voltage Ripple Component with Noise

To verify the noise robustness of VMD-HT algorithm, the simulation signal with noise is given as (21), the corresponding amplitude and spectrum of input signal can be shown in Figure 11.
V d c = D + X 1 cos ( 2 π f 1 t ) + X 2 cos ( 2 π f 2 t ) + X 3 cos ( 2 π f 3 t ) + r a n d n
where D = 200 , f 1 = 50 Hz, f 2 = 150 Hz, f 3 = 250 Hz and X 1 = 2 2 , X 2 = 2 and X 3 = 2 / 2 .”randn” represents the noise interference, its amplitude sets to 0.4.
Comprehensive utilizing that the observation of center frequency and the IO value of VMD-HT algorithm under different K, the mode number K is selected as 4, and the spectrums of VMD-HT algorithm under K = 4 is illustrated in Figure 12.
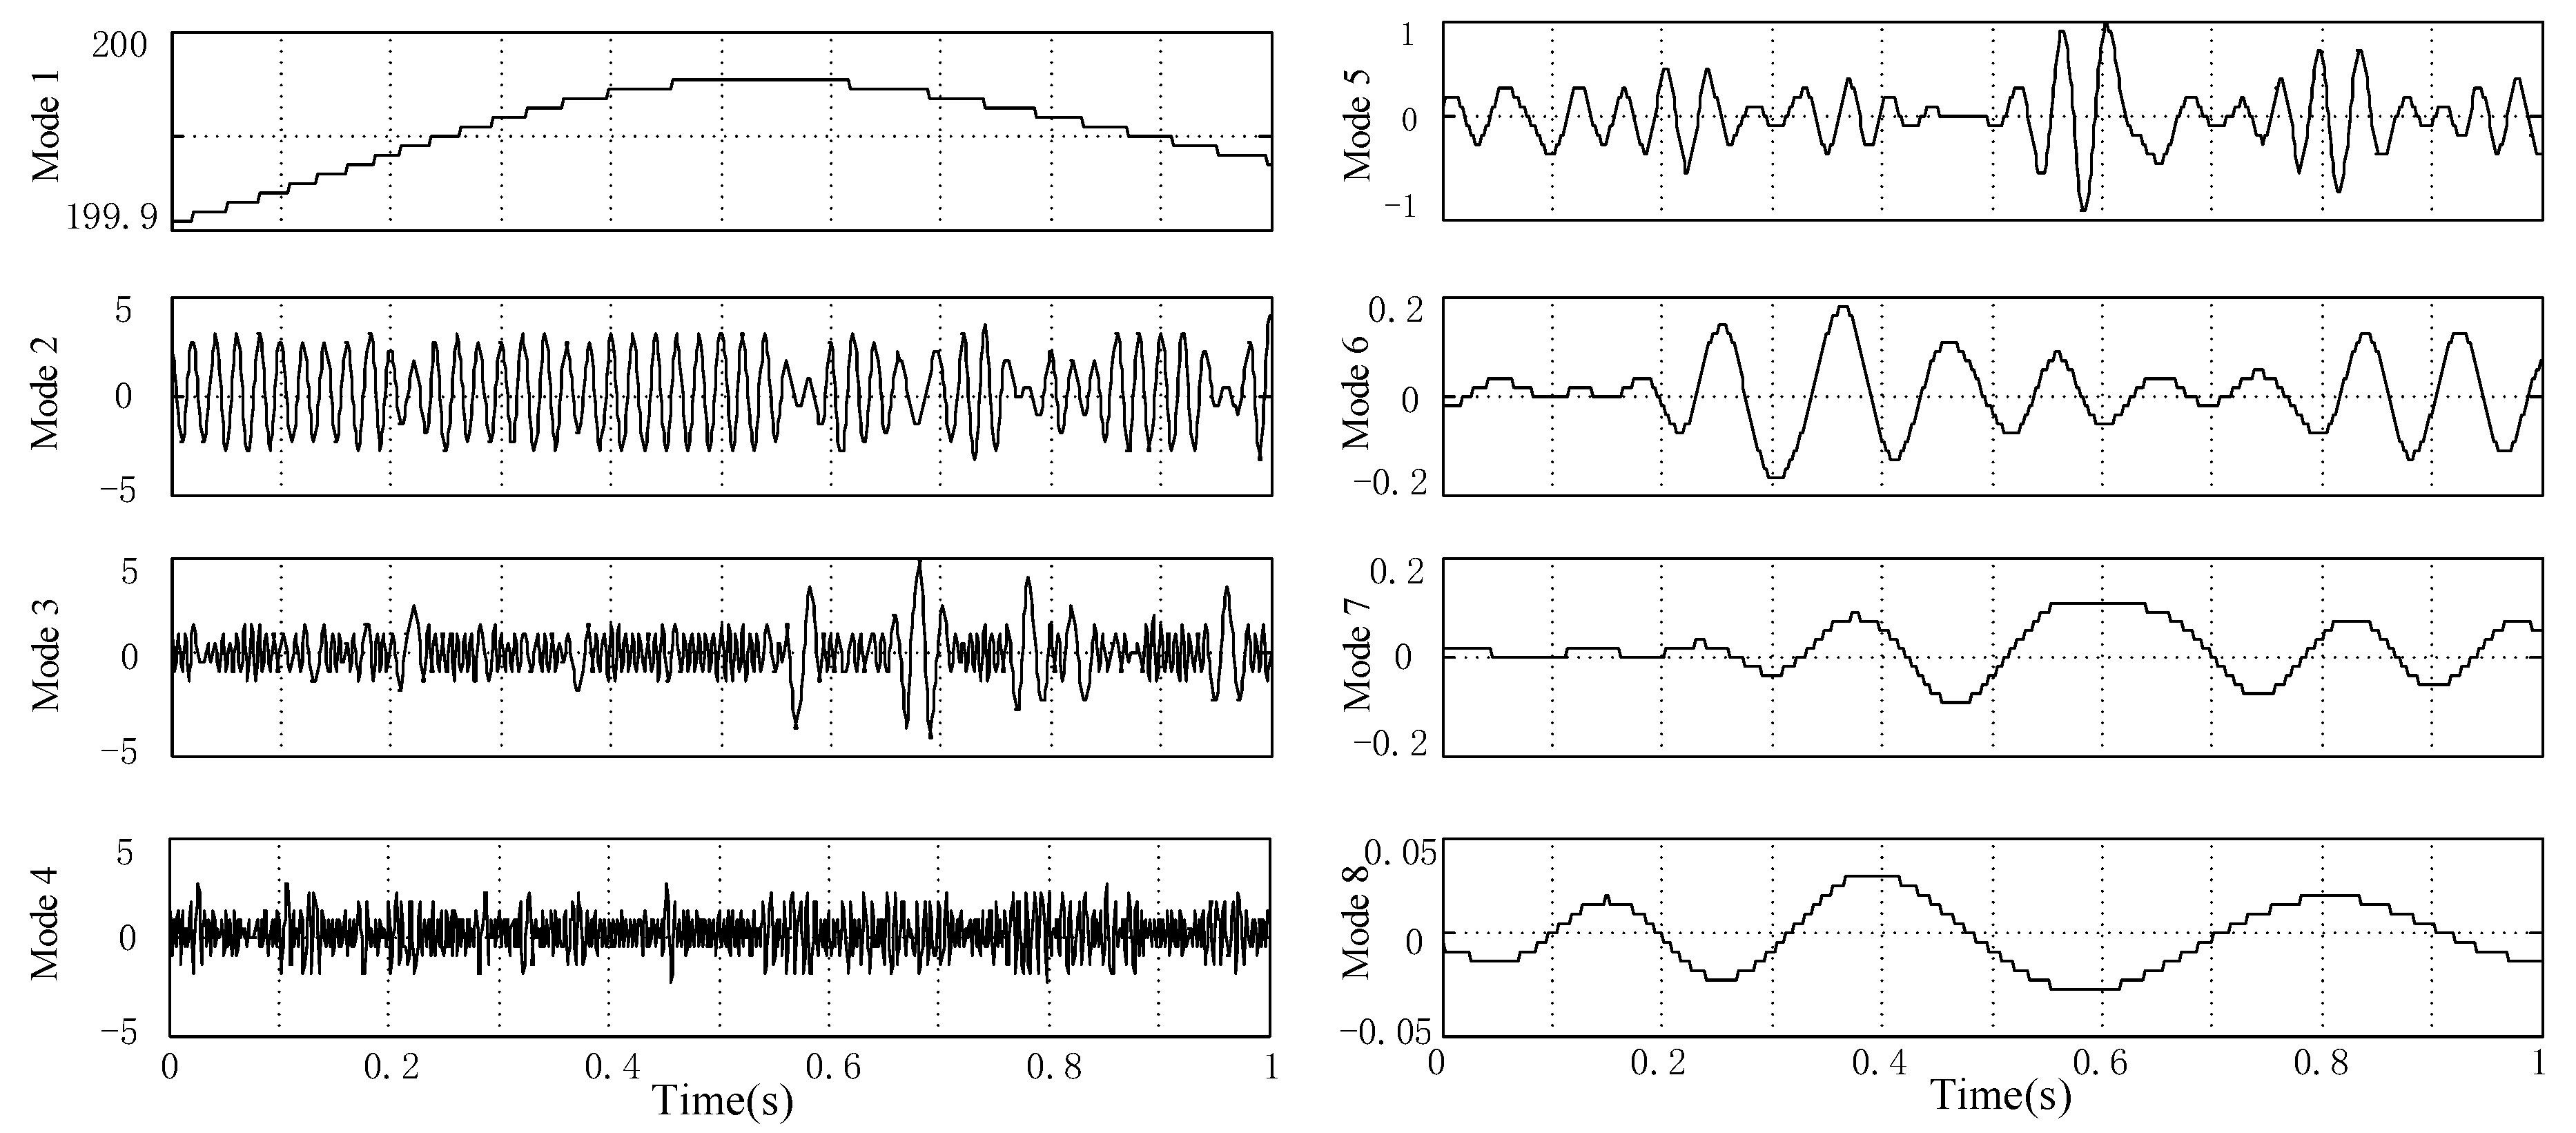
Figure 13 and Figure 14 show the decomposed modes of the corresponding VMD-HT and EMD algorithms. As seen, the input DC bus voltage is decomposed into 4 modes with the VMD-HT algorithm, including the main DC component and three ripple components. However, the input DC bus voltage is decomposed into 8 modes with the EMD algorithm, where the over-decomposition problem occurs and is even worse. Thus, the VMD-HT algorithm can realize the decomposition of complex DC bus voltage more accurately than the EMD algorithm under the noise condition.
To further verify the correctness and effectiveness of the proposed VMD-HT algorithms, some case studies are carried out, including X 1 = 2 2 , X 2 = 2 , X 3 = 2 / 2 , (2) X 1 = 2 , X 2 = 2 / 2 , X 3 = 2 / 4 , (3) X 1 = 2 2 , X 2 = 2 2 / 3 , X 3 = 2 / 2 and other associated frequencies remain constant.
Table 4 shows the ripple coefficients and associated RMS value of DC bus voltage under noise condition by utilizing the VMD-HT and EMD algorithms. As shown, the ripple coefficients with VMD-HT algorithm are closer to the actual value, while the ripple coefficients with EMD algorithm has some difference from the actual value. Moreover, as mentioned before, the EMD algorithm suffers from modal aliasing for that the upper and lower envelopes have errors due to spline interpolation. Thus, the amplitude of modes loses practical meaning, the “x” denotes the useless modes. Due to mode mixing problems, the EMD algorithm cannot realize the accurate detection of complex DC signals with noise, and its ripple coefficients are also not accurate.
Finally, the condition that X 2 of Equation (21) is a time-variant is considered. Figure 15 shows the amplitude and spectrum of the input DC bus voltage with noise. The decomposed modes with VMD-HT and EMD algorithms are shown in Figure 16 and Figure 17. As seen, the VMD algorithm can achieve the goal of decomposing the input DC bus voltage with noise. While the EMD algorithm cannot reach the decomposition goal, where the severe modal aliasing problem occurs.

5. Experiment Results

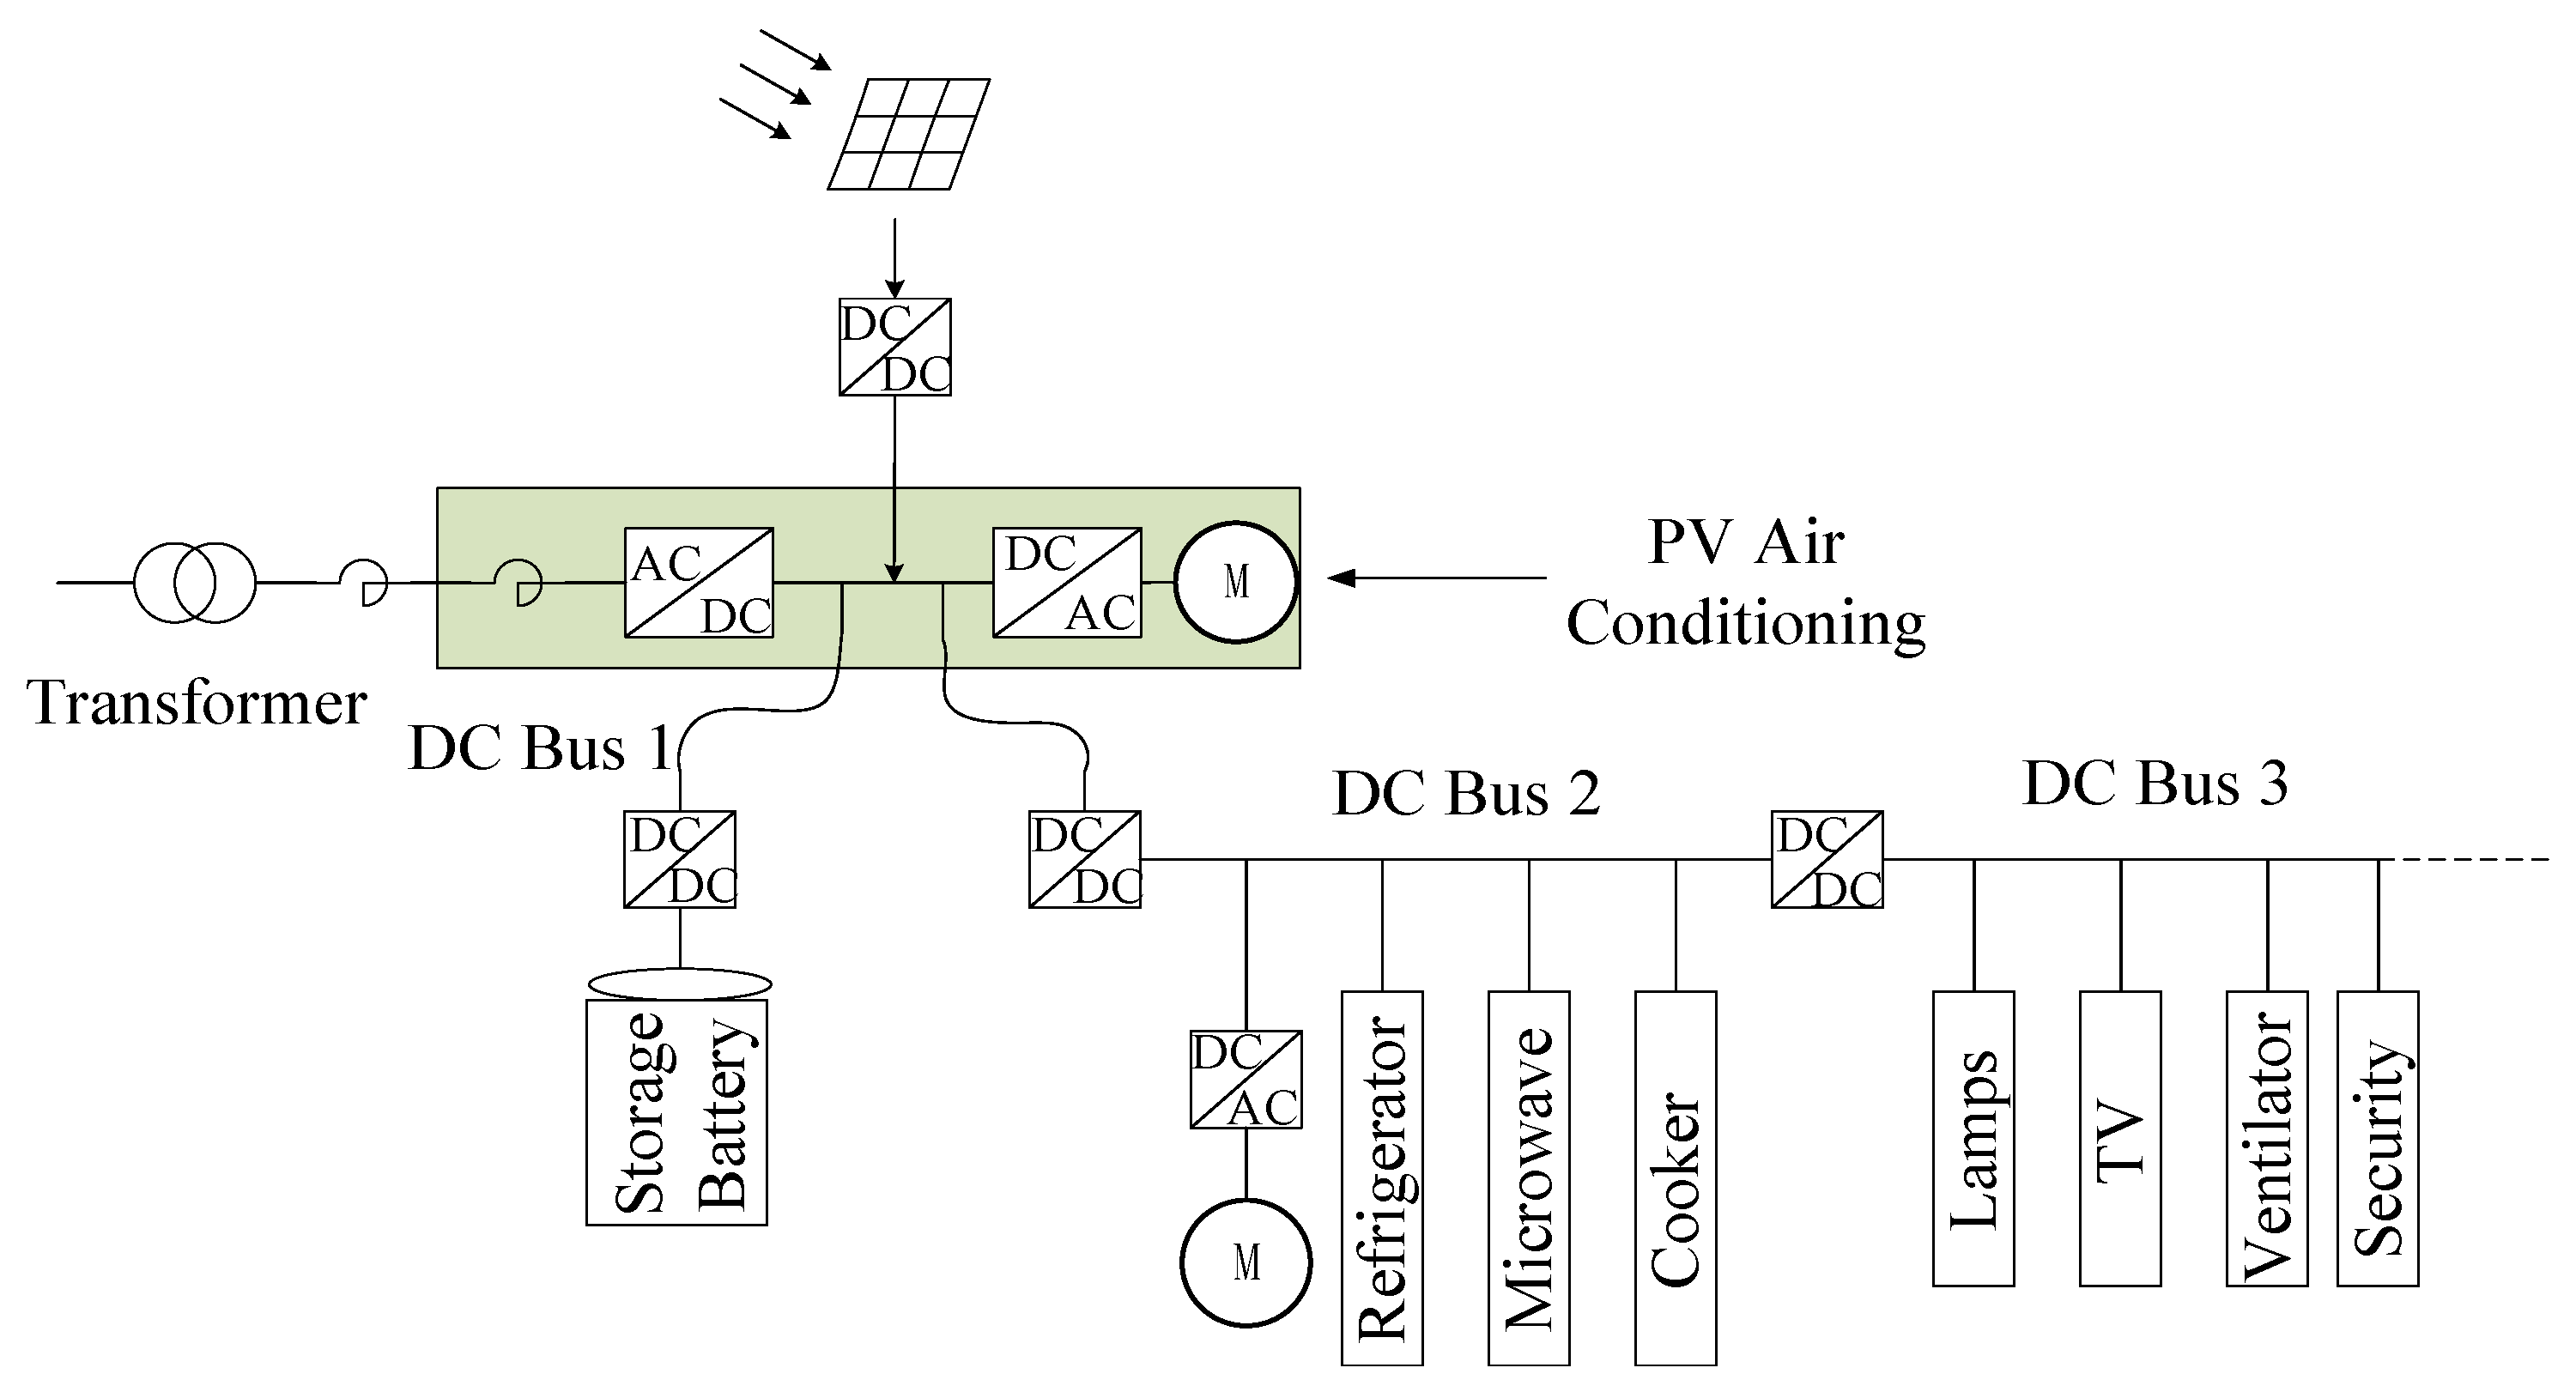
In this section, the experiment results with VMD-HT, EMD and WIFFT algorithms are presented. The DC power data is provided by Gree Photovoltaic Cabin at Gree company. Figure 18 and Figure 19 show the Gree Photovoltaic Cabin and its corresponding system configuration. As seen, the system mainly consists of four parts: the AC system, the photovoltaic panels, the PV air conditioning framework and DC loads. The PV air conditioning framework can absorb power from the photovoltaic panels through the DC/DC converter or absorb/support power from AC system through the AC/DC converter and the transformer, and it will support the main DC loads and AC loads through the DC/DC and DC/AC converter. In the DC distributed system, there are three DC buses. The experiment data is sampled from DC bus 1, where the sampling frequency is 10 kHz and the rated voltage is 620 V.
The equipment used for data acquisition is the Hioki PW3390 high-precision power analyzer with a voltage measurement range of 15–1500 V. The parameters collected on the DC side mainly include: DC voltage, voltage ripple rate, and so on. The range of voltage ripple coefficient of the DC buses 1 is 0.08%~1.05% under excellent power quality level, and 1.61%~3.53% under the poor power quality level, respectively. The average value of voltage ripple coefficient under excellent and poor power quality level is 0.54% and 2.88%, respectively. This information obtained by the power analyzer used as a reference for comparison with the voltage ripple coefficient obtained by the proposed detected algorithm, the smaller value of ripple coefficient deviation indicates the higher accuracy of the detected algorithm.

5.1. DC Voltage Ripple Detection under Excellent Power Quality Level

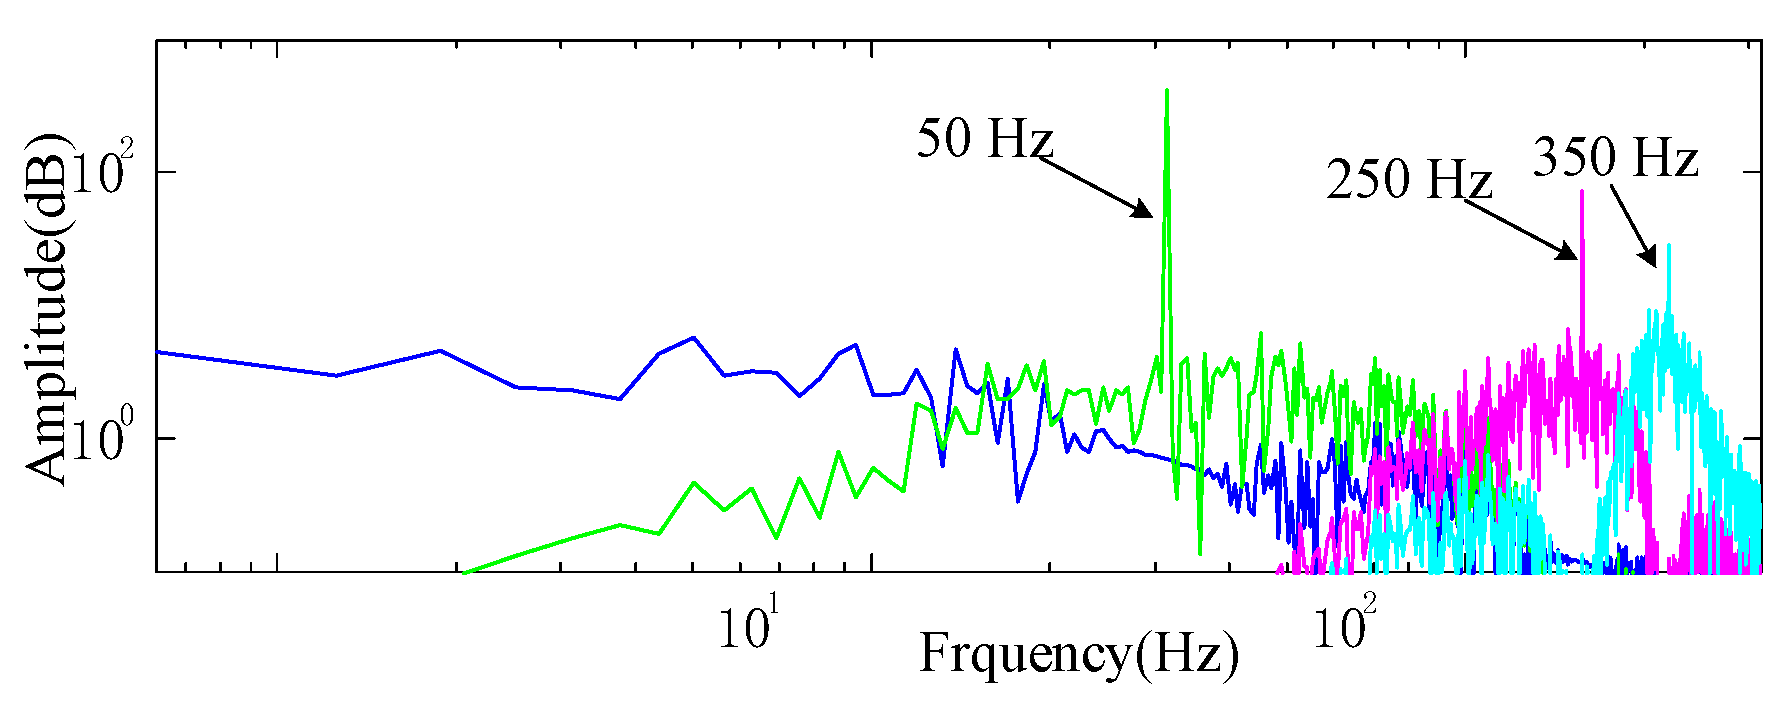
The DC bus voltage is generated by the AC/DC and DC/AC devices. The magnitude and spectrum of the sampled voltage signal under excellent power quality level are seen in Figure 20, observing that the spectrum decomposed by FFT mainly contains 50 Hz, 250 Hz and 350 Hz, the modal number K is firstly selected as 4. The corresponding spectrums of different modes can be obtained in Figure 21, where the center frequencies are also 50 Hz, 250 Hz and 350 Hz, respectively. At the same time, the IO values are illustrated in Table 5. As can be seen, when the K increases from 2 to 4, the IO becomes smaller; when the K increases from 4 to 6, the IO becomes larger. Thus, comprehensively, the optimal K is selected to 4.
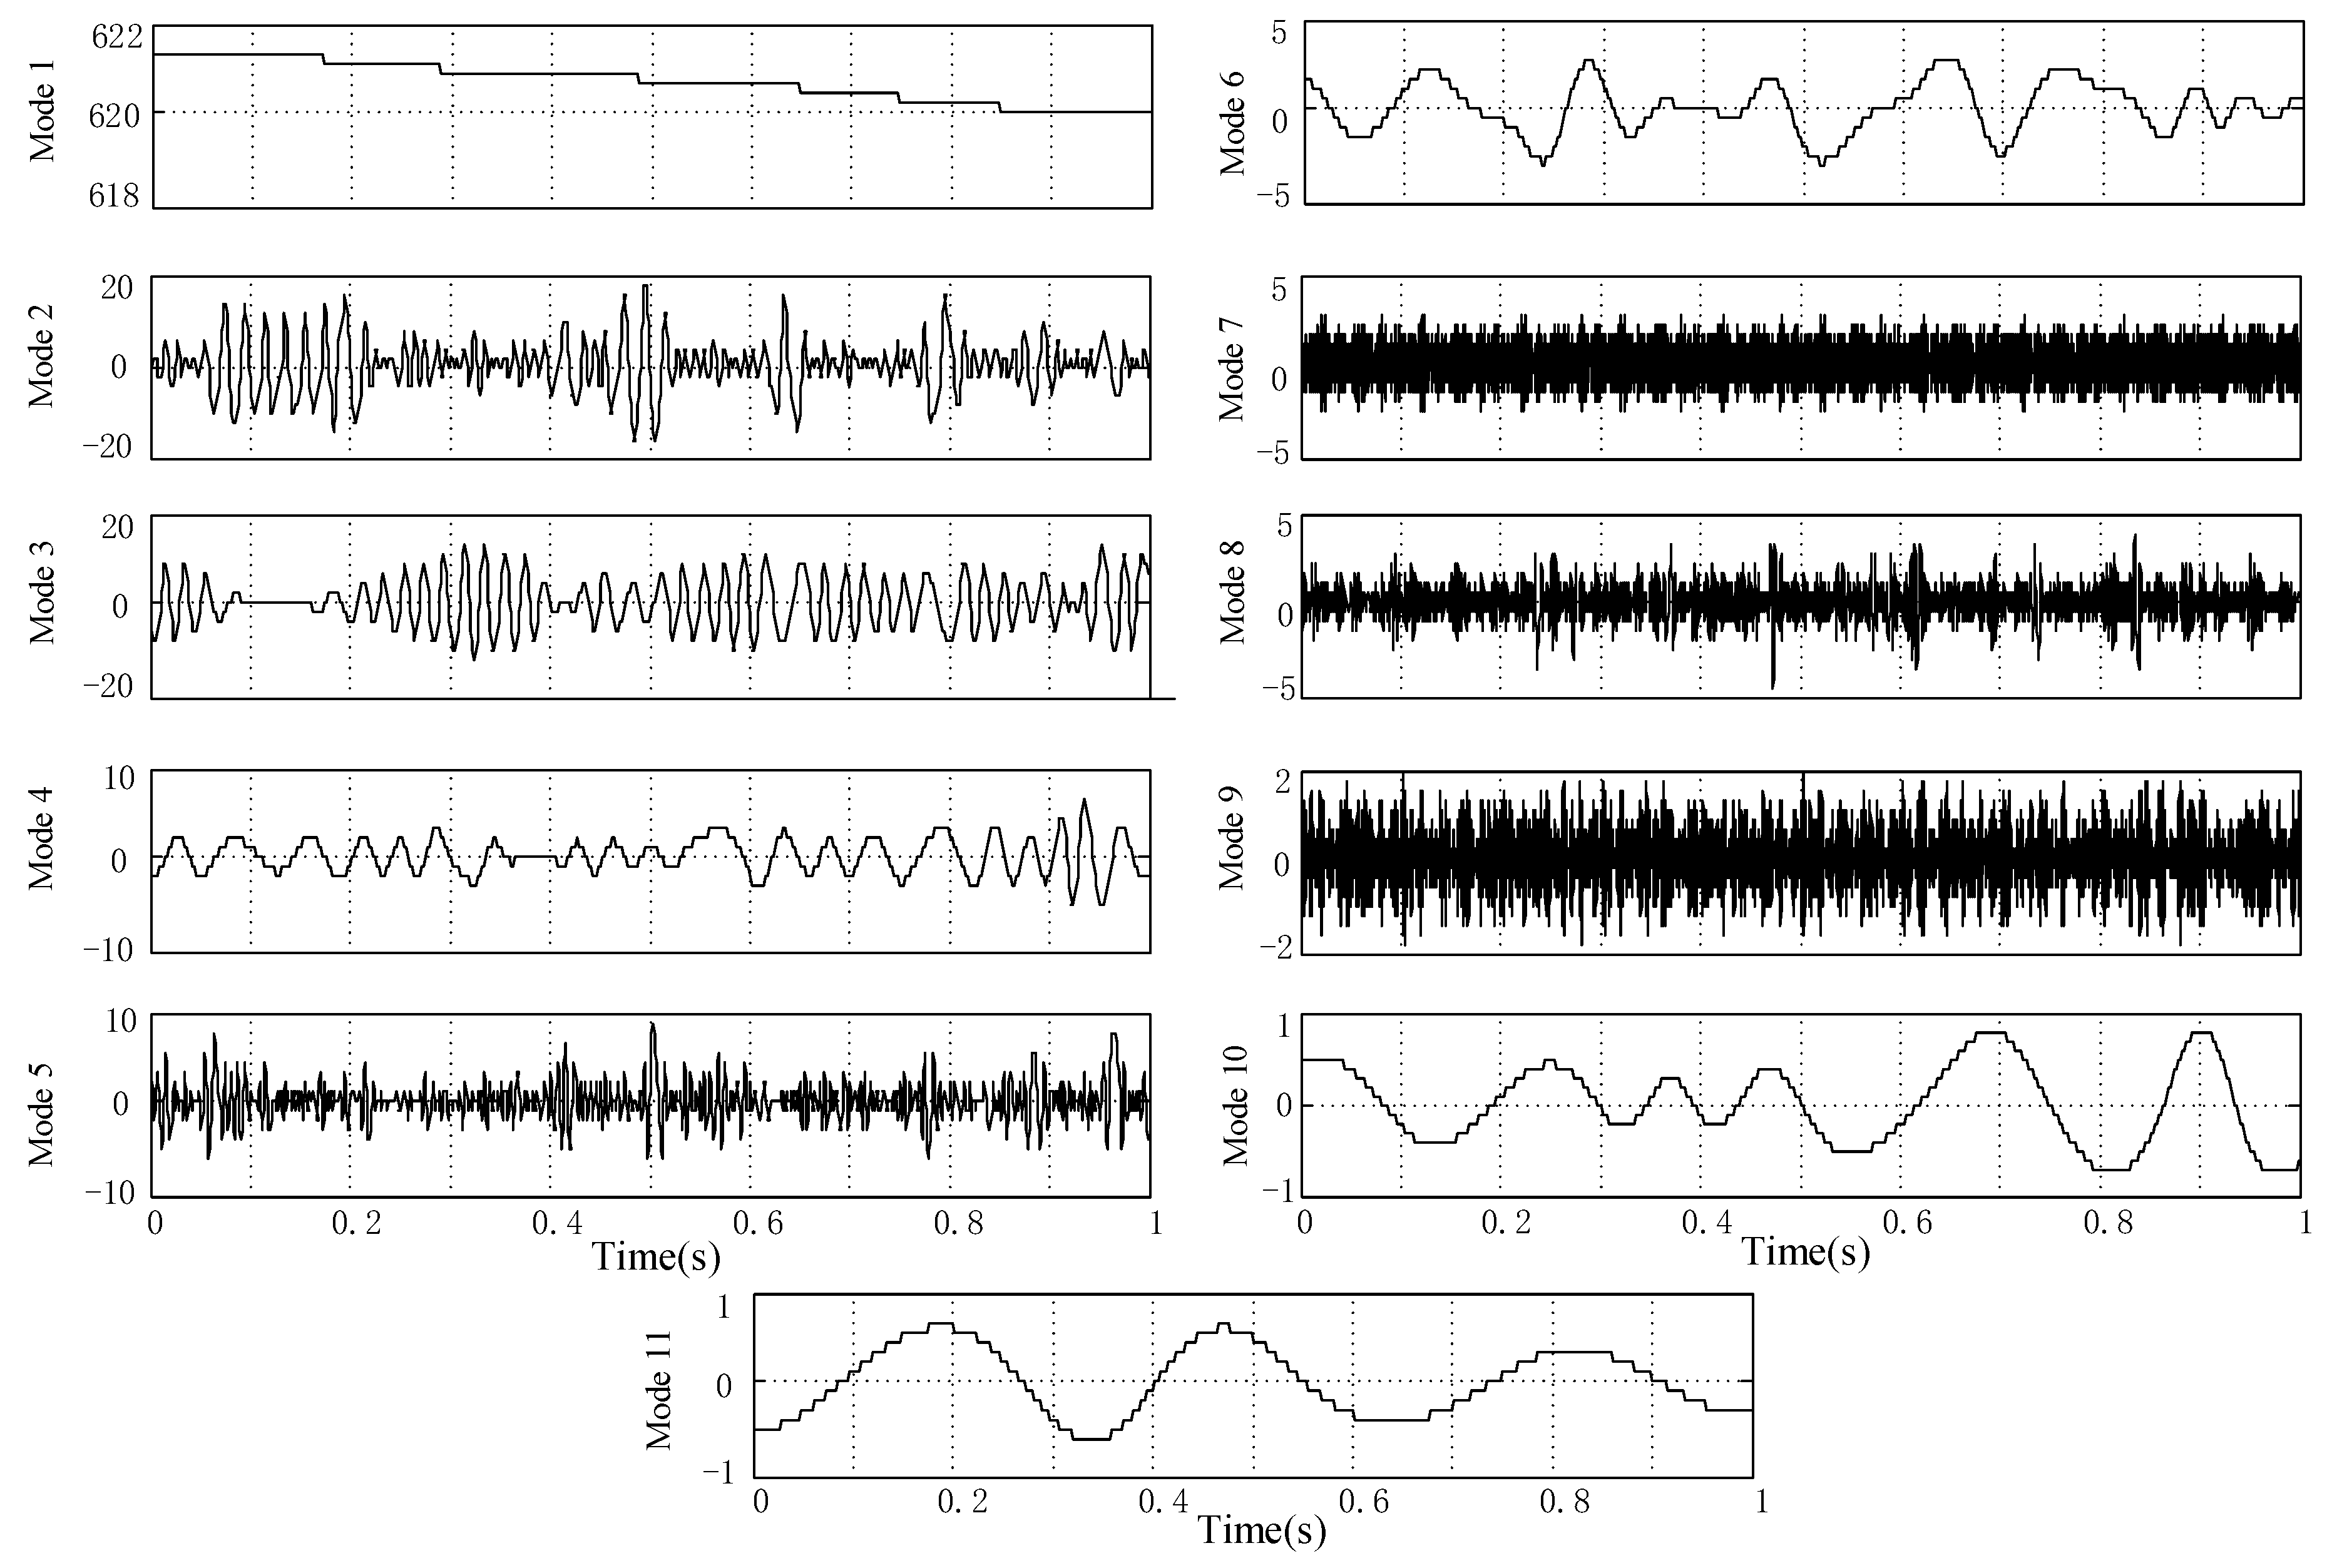
Next, by utilizing the EMD and VMD-HT algorithm, the DC bus voltage signal is decomposed. Figure 22 and Figure 23 show the decomposed modes of the corresponding algorithms. As can be seen, the VMD-HT algorithm decomposes the input DC bus voltage signal into 4 modes, including the main DC component and three ripple components. While the EMD algorithm decomposes the DC bus voltage signal into 7 modes. Intuitively, there will be the over-decomposition problem.
In order to compare the ripple detection accuracy between the VMD-HT and the EMD algorithms, the RMS of the 1st-3th ripple components and ripple coefficients of input DC bus voltage are calculated and three groups data are shown in Table 6. As seen in Table 6, the ripple coefficient of both algorithms is very small because of good performance of DC bus voltage. However, the EMD algorithm suffers from the mode mixing, it cannot detect the ripple components of complex DC signals. Thus, the VMD-HT algorithm is superior to the EMD algorithm when decomposing the complex DC signals.

5.2. DC Voltage Ripple Detection under Poor Power Quality Level

To further verify the effectiveness of the proposed algorithm, the experiment data are sampled when the nonlinear loads is applied in the system. Three methods including VMD-HT algorithm, EMD, and WIFFT algorithm are compared in this section. The waveforms of input signal and spectrum are illustrated in Figure 24.
For VMD-HT algorithm, the mode number K should be determined in advance. In Figure 24, observing that the spectrum of input signal is mainly composed by 8 frequency components, and the mode number K is initially selected as 8. The corresponding spectrums of VMD-HT algorithm decomposition under different modes can be seen in Figure 25. Meanwhile, the IO in Table 7 has the minimum at K = 8. In summary, the optimal mode number K is 8.
Figure 26 and Figure 27 show the decomposed modes of the corresponding algorithms. As seen, the VMD-HT algorithm decomposes the input DC bus voltage signal into 8 modes, including the main DC component and seven ripple components. While the EMD algorithm decomposes the DC bus voltage signal into 11 modes. Intuitively, there will be the over-decomposition problem.
The ripple estimation results of the WIFFT method based on hanning window [24] is illustrated in Table 8, where “/” denotes the amplitude of DC component cannot obtained by the WIFFT method for the application of interpolation algorithm [21]. In this method, the sample length is set as N = 1000. It can be seen that the 1st–7th ripple parameters are obtained and the frequency deviation is within 4 Hz.
In order to compare the ripple detection accuracy of complex DC signals based on the VMD-HT, EMD and WIFFT method, the RMS values X m of the 1st–7th ripple components and the calculated ripple coefficient μ under the poor power quality level are given in Table 9. According to the range of voltage ripple coefficient in Gree Photovoltaic Cabin, namely, 1.61%~3.53%, the value of μ based on VMD-HT and WIFFT method is within a reasonable range. However, the μ of EMD method is out of the correct range because of the mode mixing. Thus, the EMD algorithm cannot detect the ripple accurately.
In addition, compared to the average value of voltage ripple coefficient (2.88%) in Gree Photovoltaic Cabin, the ripple coefficient deviation of VMD-HT method is smaller than that of the WIFFT method. The WIFFT algorithms based on the classic windows relay on nonlinear least-square approach for harmonic frequency estimation, for complex DC signals, weak harmonic components can easily be obscured by nearby strong harmonics due to the spectral leakage and picket fence effect [24]. Therefore, the ripple detection accuracy of proposed VMD-HT algorithm is higher than the WIFFT method.

6. Conclusions

In this paper, a combination algorithm based on VMD-HT algorithm is presented to detect and analyze the ripple components of the complex DC signals. Before decomposing the input DC bus voltage, the optimal mode number is determined by comprehensively observing the center frequencies of mode components and the IO. By utilizing the VMD-HT algorithm, the input DC signals are accurately decomposed into the main DC component and ripple components. From the comparison with EMD and WIFFT algorithm, the ripple coefficients with VMD algorithm can be calculated more accurately under the noise condition. Besides, in future work, our research mainly focuses on the following two points: (1) adaptive section of the optimal mode number of the input DC disturbance signal; (2) the research of sag/swell component of input DC signals.

Author Contributions

Conceptualization, D.L.; Data curation, M.L.; Formal analysis, M.L.; Funding acquisition, D.L. and B.Y.; Investigation, B.Y.; Methodology, B.Y.; Project administration, D.L.; Software, T.W.; Supervision, H.Z.; Visualization, T.W.; Writing—original draft, M.L. and H.Z.; Writing—review & editing, H.Z. All authors have read and agreed to the published version of the manuscript.

Funding

This research was funded by the National Key Research and Development Program of China, grant number 2018YFF0212903.

Conflicts of Interest

The authors declare no conflict of interest.

References

  1. Serban, I.; Marinescu, C. Power quality issues in a stand-alone microgrid based on renewable energy. Revue Roumaine Des Sci. Tech.-Électrotech. Et Énergétique 2008, 53, 285–293. [Google Scholar]
  2. Chen, Z.; Spooner, E. Grid power quality with variable speed wind turbines. IEEE Trans. Energy Convers. 2001, 16, 148–154. [Google Scholar] [CrossRef]
  3. Chicco, G.; Schlabbach, J.; Spertino, F. Experimental assessment of the waveform distortion in grid-connected photovoltaic installation. Sol. Energy 2009, 83, 1026–1039. [Google Scholar] [CrossRef]
  4. Suryadevara, R.; Parsa, L. Full-bridge ZCS-converter-based high-gain modular DC-DC converter for PV integration with medium-voltage DC grids. IEEE Trans. Energy Convers. 2019, 34, 302–312. [Google Scholar] [CrossRef]
  5. Baran, M.E.; Mahajan, N.R. DC distribution for industrial systems: Opportunities and challenges. IEEE Trans. Ind. Appl. 2003, 39, 1596–1601. [Google Scholar] [CrossRef]
  6. Sacasqui, M.; Luyo, J.; Delgado, A. A Unified Index for Power Quality Assessment in Distributed Generation Systems Using Grey Clustering and Entropy Weight. In Proceedings of the 2018 IEEE ANDESCON, Santiago de Cali, Colombia, 22–24 August 2018; pp. 1–4. [Google Scholar]
  7. Mesbah, M.; Moses, P.S.; Islam, S.M.; Masoum, M.A.S. Digital implementation of a fault emulator for transient study of power transformers used in grid connection of wind farms. IEEE Trans. Sustain. Energy 2014, 5, 646–654. [Google Scholar] [CrossRef]
  8. Mohanty, S.R.; Kishor, N.; Ray, P.K.; Catalao, J.P.S. Comparative study of advanced signal processing techniques for islanding detection in a hybrid distributed generation system. IEEE Trans. Sustain. Energy 2015, 6, 122–131. [Google Scholar] [CrossRef]
  9. Whaite, S.; Grainger, B.; Kwasinski, A. Power Quality in DC Power Distribution Systems and Microgrids. Energies 2015, 8, 4378–4399. [Google Scholar] [CrossRef] [Green Version]
  10. Gendeel, M.; Yuxian, Z.; Aoqi, H. Performance comparison of ANNs model with VMD for short-term wind speed forecasting. IET Renew. Power Gener. 2018, 12, 1424–1430. [Google Scholar] [CrossRef]
  11. Lima, M.A.A.; Cerqueira, A.S.; Coury, D.V.; Duque, C.A. A novel method for power quality multiple disturbance decomposition based on independent component analysis. Int. J. Elect. Power Energy Syst. 2012, 42, 593–604. [Google Scholar] [CrossRef]
  12. Masoum, M.A.S.; Jamali, S.; Ghaffarzadeh, N. Detection and classification of power quality disturbances using discrete wavelet transform and wavelet networks. Sci. Meas. Technol. 2014, 62, 531–544. [Google Scholar] [CrossRef]
  13. Viswanath, A.; Jose, K.J.; Krishnan, N.; Kumar, S.S.; Soman, K.P. Spike Detection of Disturbed Power Signal Using VMD. Procedia Comput. Sci. 2015, 46, 1087–1094. [Google Scholar] [CrossRef] [Green Version]
  14. Ray, P.K.; Kishor, N.; Mohanty, S.R. Islanding and power quality disturbance detection in grid-connected hybrid power system using wavelet and S-transform. IEEE Trans. Smart Grid 2012, 3, 1082–1094. [Google Scholar] [CrossRef]
  15. Santoso, S.; Grady, W.M.; Powers, E.J.; Lamoree, J.; Bhatt, S.C. Characterization of distribution power quality events with Fourier and wavelet transforms. IEEE Trans. Power Deliv. 2000, 15, 247–254. [Google Scholar] [CrossRef]
  16. Gramacki, A.; Gramacki, J. FFT-based fast bandwidth selector for multivariate kernel density estimation. Comput. Stat. Data Anal. 2017, 106, 27–45. [Google Scholar] [CrossRef] [Green Version]
  17. Yonemoto, A.; Hisakado, T.; Okumura, K. Accuracy improvement of the FFT-based numerical inversion of Laplace transforms. IEE Proc. Circuits Devices Syst. 2003, 10, 399–404. [Google Scholar] [CrossRef] [Green Version]
  18. Chintakindi, S.R.; Varaprasad, O.V.S.R.; Siva Sarma, D.V.S.S. Improved Hanning window based interpolated FFT for power harmonic analysis. In Proceedings of the TENCON 2015—2015 IEEE Region 10 Conference, Macao, China, 1–4 November 2015. [Google Scholar]
  19. Huang, N.E.; Shen, Z.; Long, S.R.; Wu, M.L.C.; Shih, H.H.; Zheng, Q.; Yen, N.C.; Tung, C.-C.; Liu, H.H. The empirical mode decomposition and the Hilbert spectrum for nonlinear and non-stationary time series analysis. Proc. R. Soc. Lond. A Math. Phys. Eng. Sci. 1998, 454, 903–995. [Google Scholar] [CrossRef]
  20. Shukla, S.; Mishra, S.; Singh, B. Empirical-mode decomposition with Hilbert transform for power-quality assessment. IEEE Trans. Power Deliv. 2019, 24, 2159–2165. [Google Scholar] [CrossRef]
  21. Dragomiretskiy, K.; Zosso, D. Variational mode decomposition. IEEE Trans. Signal Process. 2014, 62, 531–544. [Google Scholar] [CrossRef]
  22. Zhao, C.; Li, K.; Li, Y.; Wang, L.; Luo, Y.; Xu, X.; Ding, X.; Meng, Q. Novel method based on variational mode decomposition and a random discriminative projection extreme learning machine for multiple power quality disturbance recognition. IEEE Trans. Ind. Inform. 2019, 15, 2915–2926. [Google Scholar] [CrossRef]
  23. Selva, J. FFT Interpolation from Nonuniform Samples Lying in a Regular Grid. IEEE Trans. Signal Process. 2015, 63, 2826–2834. [Google Scholar] [CrossRef] [Green Version]
  24. Wen, H.; Zhang, J.; Meng, Z.; Guo, S.; Li, F.; Yang, Y. Harmonic Estimation Using Symmetrical Interpolation FFT Based on Triangular Self-Convolution Window. IEEE Trans. Ind. Inform. 2015, 11, 16–26. [Google Scholar] [CrossRef]
  25. He, S.; Li, K.; Zhang, M. A real-time power quality disturbances classification using hybrid method based on S-transform and dynamics. IEEE Trans. Instrum. Meas. 2013, 62, 2465–2475. [Google Scholar] [CrossRef]
  26. Xue, C.; Hui-Jin, L.; Quan-Ming, Z.; Li-Ming, Y.; Qing-Fen, L. Power quality disturbances detection and location using mathematical morphology and complex wavelet transformation. In Proceedings of the 3rd IEEE 2008 3rd IEEE Conference on Industrial Electronics and Applications (ICIEA), Singapore, 3–5 June 2008; pp. 2263–2268. [Google Scholar]
  27. Xu, M.; Shang, P.; Lin, A. Cross-correlation analysis of stock markets using EMD and EEMD. Phys. A Stat. Mech. Appl. 2016, 442, 82–90. [Google Scholar] [CrossRef]
  28. Achlerkar, P.D.; Samantaray, S.R.; Manikandan, M.S. Variational Mode Decomposition and Decision Tree Based Detection and Classification of Power Quality Disturbances in Grid-Connected Distributed Generation System. IEEE Trans. Smart Grid 2018, 6, 3122–3132. [Google Scholar] [CrossRef]
  29. Chen, S.; Yang, Y.; Dong, X.; Xing, G.; Peng, Z.; Zhang, W. Warped Variational Mode Decomposition With Application to Vibration Signals of Varying-Speed Rotating Machineries. IEEE Trans. Instrum. Meas. 2018, 68, 2755–2767. [Google Scholar] [CrossRef]
  30. Wang, C.; Li, H.; Huang, G.; Ou, J. Early fault diagnosis for planetary gearbox based on adaptive parameter optimized VMD and singular kurtosis dfference spectrum. IEEE Access 2019, 7, 31501–31516. [Google Scholar] [CrossRef]
  31. Satija, U.; Trivedi, N.; Biswal, G.; Ramkumar, B. Specific Emitter Identification Based on Variational Mode Decomposition and Spectral Features in Single Hop and Relaying Scenarios. IEEE Trans. Inform. Forensics Secur. 2019, 14, 581–591. [Google Scholar] [CrossRef]
  32. Ray, P.K.; Mohanty, S.R.; Kishor, N.; Catalao, J.P.S. Optimal feature and decision tree-based classification of power quality disturbances in distributed generation systems. IEEE Trans. Sustain. Energy 2014, 5, 200–208. [Google Scholar] [CrossRef]
  33. Mariscotti, A. Methods for ripple index evaluation in DC low voltage distribution networks. In Proceedings of the IEEE Instrumentation & Measurement Technology Conference, Warshaw, Poland, 1–3 May 2007; pp. 1–4. [Google Scholar]
  34. Ma, H.; Yan, J.; Li, Y. Low-Frequency Noise Suppression of Desert Seismic Data Based on Variational Mode Decomposition and Low-Rank Component Extraction. IEEE Geosci. Remote Sens. Lett. 2020, 17, 337–341. [Google Scholar] [CrossRef]
  35. Önal, Y.; Ece, D.G.; Gerek, Ö.N. Hilbert–Huang transform based approach for measurement of voltage flicker magnitude and frequency. Elect. Power Compon. Syst. 2015, 43, 167–176. [Google Scholar] [CrossRef]
  36. Si, W.; Li, S.; Xiao, H.; Li, Q. PD characteristics and development degree assessment of oil-pressboard insulation with ball-plate model under 1:1 combined AC-DC voltage. IEEE Trans. Dielectr. Electr. Insul. 2017, 24, 3677–3686. [Google Scholar] [CrossRef]
Figure 1. Flowchart of the variational mode decomposition (VMD) algorithm.
Energies 13 00935 g001
Figure 2. Flowchart of the VMD-HT (Hilbert Transform) algorithm.
Energies 13 00935 g002
Figure 3. Flowchart of the optimal selection of mode number K of VMD-HT algorithm.
Energies 13 00935 g003
Figure 4. Performance of input DC voltage under noise-free condition: (a) amplitude, (b) spectrum.
Energies 13 00935 g004
Figure 5. Spectrums of VMD-HT algorithm under K = 4 under noise-free situation.
Energies 13 00935 g005
Figure 6. The decomposed modes of VMD-HT algorithms.
Energies 13 00935 g006
Figure 7. The decomposed modes of empirical mode decomposition (EMD) algorithms.
Energies 13 00935 g007
Figure 8. Waveforms of input DC voltage under noise-free condition: (a) amplitude, (b) spectrum.
Energies 13 00935 g008
Figure 9. The decomposed modes of VMD-HT algorithms.
Energies 13 00935 g009
Figure 10. The decomposed modes of EMD algorithms.
Energies 13 00935 g010
Figure 11. Performance of input signals under noise condition: (a) amplitude, (b) spectrum.
Energies 13 00935 g011
Figure 12. Spectrums of VMD-HT algorithm under K = 4 under noise situation.
Energies 13 00935 g012
Figure 13. The decomposed modes of VMD-HT algorithm.
Energies 13 00935 g013
Figure 14. The decomposed modes of EMD algorithm.
Energies 13 00935 g014
Figure 15. Performance of input signals under noise condition: (a) amplitude, (b) spectrum.
Energies 13 00935 g015
Figure 16. The decomposed modes of VMD-HT algorithm.
Energies 13 00935 g016
Figure 17. The decomposed modes of EMD algorithm.
Energies 13 00935 g017
Figure 18. Gree Photovoltaic Cabin.
Energies 13 00935 g018
Figure 19. Configuration of Gree Photovoltaic Cabin.
Energies 13 00935 g019
Figure 20. Performance of input signals with noise: (a) magnitude, (b) spectrum.
Energies 13 00935 g020
Figure 21. Spectrums of different modes.
Energies 13 00935 g021
Figure 22. The decomposed modes of VMD-HT algorithm (mode1: DC value 620 V, mode 2: 50 Hz, mode 3:250 Hz, mode 4: 350 Hz).
Energies 13 00935 g022
Figure 23. The decomposed modes of EMD algorithm.
Energies 13 00935 g023
Figure 24. Waveforms of input signal with noise: (a) magnitude, (b) spectrum.
Energies 13 00935 g024
Figure 25. Spectrums of VMD-HT algorithm decomposition under different modes.
Energies 13 00935 g025
Figure 26. The decomposed modes of VMD-HT algorithm. (mode1: DC value 620 V, mode 2: 50 Hz, mode 3:100 Hz, mode 4: 150 Hz, mode 5:200 Hz, mode 6:250 Hz, mode 7: 300 Hz, mode 8: 350 Hz).
Energies 13 00935 g026
Figure 27. The decomposed modes of EMD algorithm.
Energies 13 00935 g027
Table 1. Center frequency corresponding to different K.
ModesCenter Frequency
20250
30150250
4050150250
5050136150250
6050136150161250
Table 2. IO of VMD-HT algorithm decomposition under different K.
ModesK = 2K = 3K = 4K = 5K = 6
IO1.506e−61.254e−71.554e−92.775e−97.817e−9
Table 3. Ripple components of direct-current (DC) voltage without noise.
Case 1Case 2Case 3
RippleActualVMD-HTEMDActualVMD-HTEMDActualVMD-HTEMD
X m (V)
DC value200.00200.00200.00200.00200.00200.01200.00200.00200.00
1st2.00001.99992.03511.00001.00011.01752.00001.99982.0614
2nd1.00000.99900.84290.50000.49950.42150.66670.66600.5271
3th0.50000.49900.53420.25000.24950.26710.50000.49900.0246
μ1.15%1.15%1.13%0.57%0.57%0.57%1.09%1.08%1.06%
Table 4. Ripple components of DC signals with noise.
Case 1Case 2Case 3
RippleActualVMD-HTEMDActualVMD-HTEMDActualVMD-HTEMD
X m (V)
DC value200.00200.00200.00200.00200.00200.01200.00200.00200.00
1st2.00001.9954x1.00001.0071x2.00001.9968x
2nd1.00001.0009x0.50000.5219x0.66670.6721x
3th0.50000.5170x0.25000.3010x0.50000.5285x
μ1.15%1.15%1.17%0.57%0.59%0.61%1.09%1.09%1.15%
Table 5. Index of Orthogonality (IO) of VMD-HT algorithm decomposition under different K.
ModesK = 2K = 3K = 4K = 5K = 6
IO1.764e−86.205e−91.506e−91.307e−85.617e−8
Table 6. Ripple components comparison among two methods.
Group 1Group 2Group 3
RippleVMD-HTEMDVMD-HTEMDVMD-HTEMD
X m (V)
DC value620.00620.00620.00620.0620.00620.00
1st0.6046x0.5992x0.5997x
2nd0.1122x0.1075x0.1112x
3th0.0693x0.0892x0.0754x
μ0.09%0.12%0.10%0.12%0.10%0.13%
Table 7. IO of VMD-HT algorithm decomposition under different K.
ModesK = 4K = 5K = 6K = 7K = 8K = 9K = 10
IO8.767e−85.924e−94.866e−91.906e−91.552e−92.807e−93.548e−9
Table 8. Measured ripple components based on window interpolation FFT (WIFFT) algorithm.
RippleAmplitude (V)Frequency (Hz)Phase (rad)
DC value///
1st9.416550.12161.3125
2nd3.442299.8489−2.8849
3th2.0455150.8191−1.4951
4th1.2022200.9208−0.3612
5th0.8051250.09631.5785
6th0.9446300.2550−1.6007
7th0.6408353.6539−1.3300
Table 9. Ripple components comparison among three methods.
RippleVMD-HTEMDWIFFT
X m ( V )
DC value619.8712620.6774/
1st10.679x9.4165
2nd4.2546x3.4422
3th3.7142x2.0455
4th2.6954x1.2022
5th1.3837x0.8051
6th0.9171x0.9446
7th0.4531x0.6408
μ2.02%1.36%1.68%