A National Strategy Proposal for Improved Cooking Stove Adoption in Honduras: Energy Consumption and Cost-Benefit Analysis

 ,
,
Abstract
:
1. Introduction
2. Material and Methods
2.1. Current Status of Improved Stoves Delivery for a National Strategy Adoption in Honduras
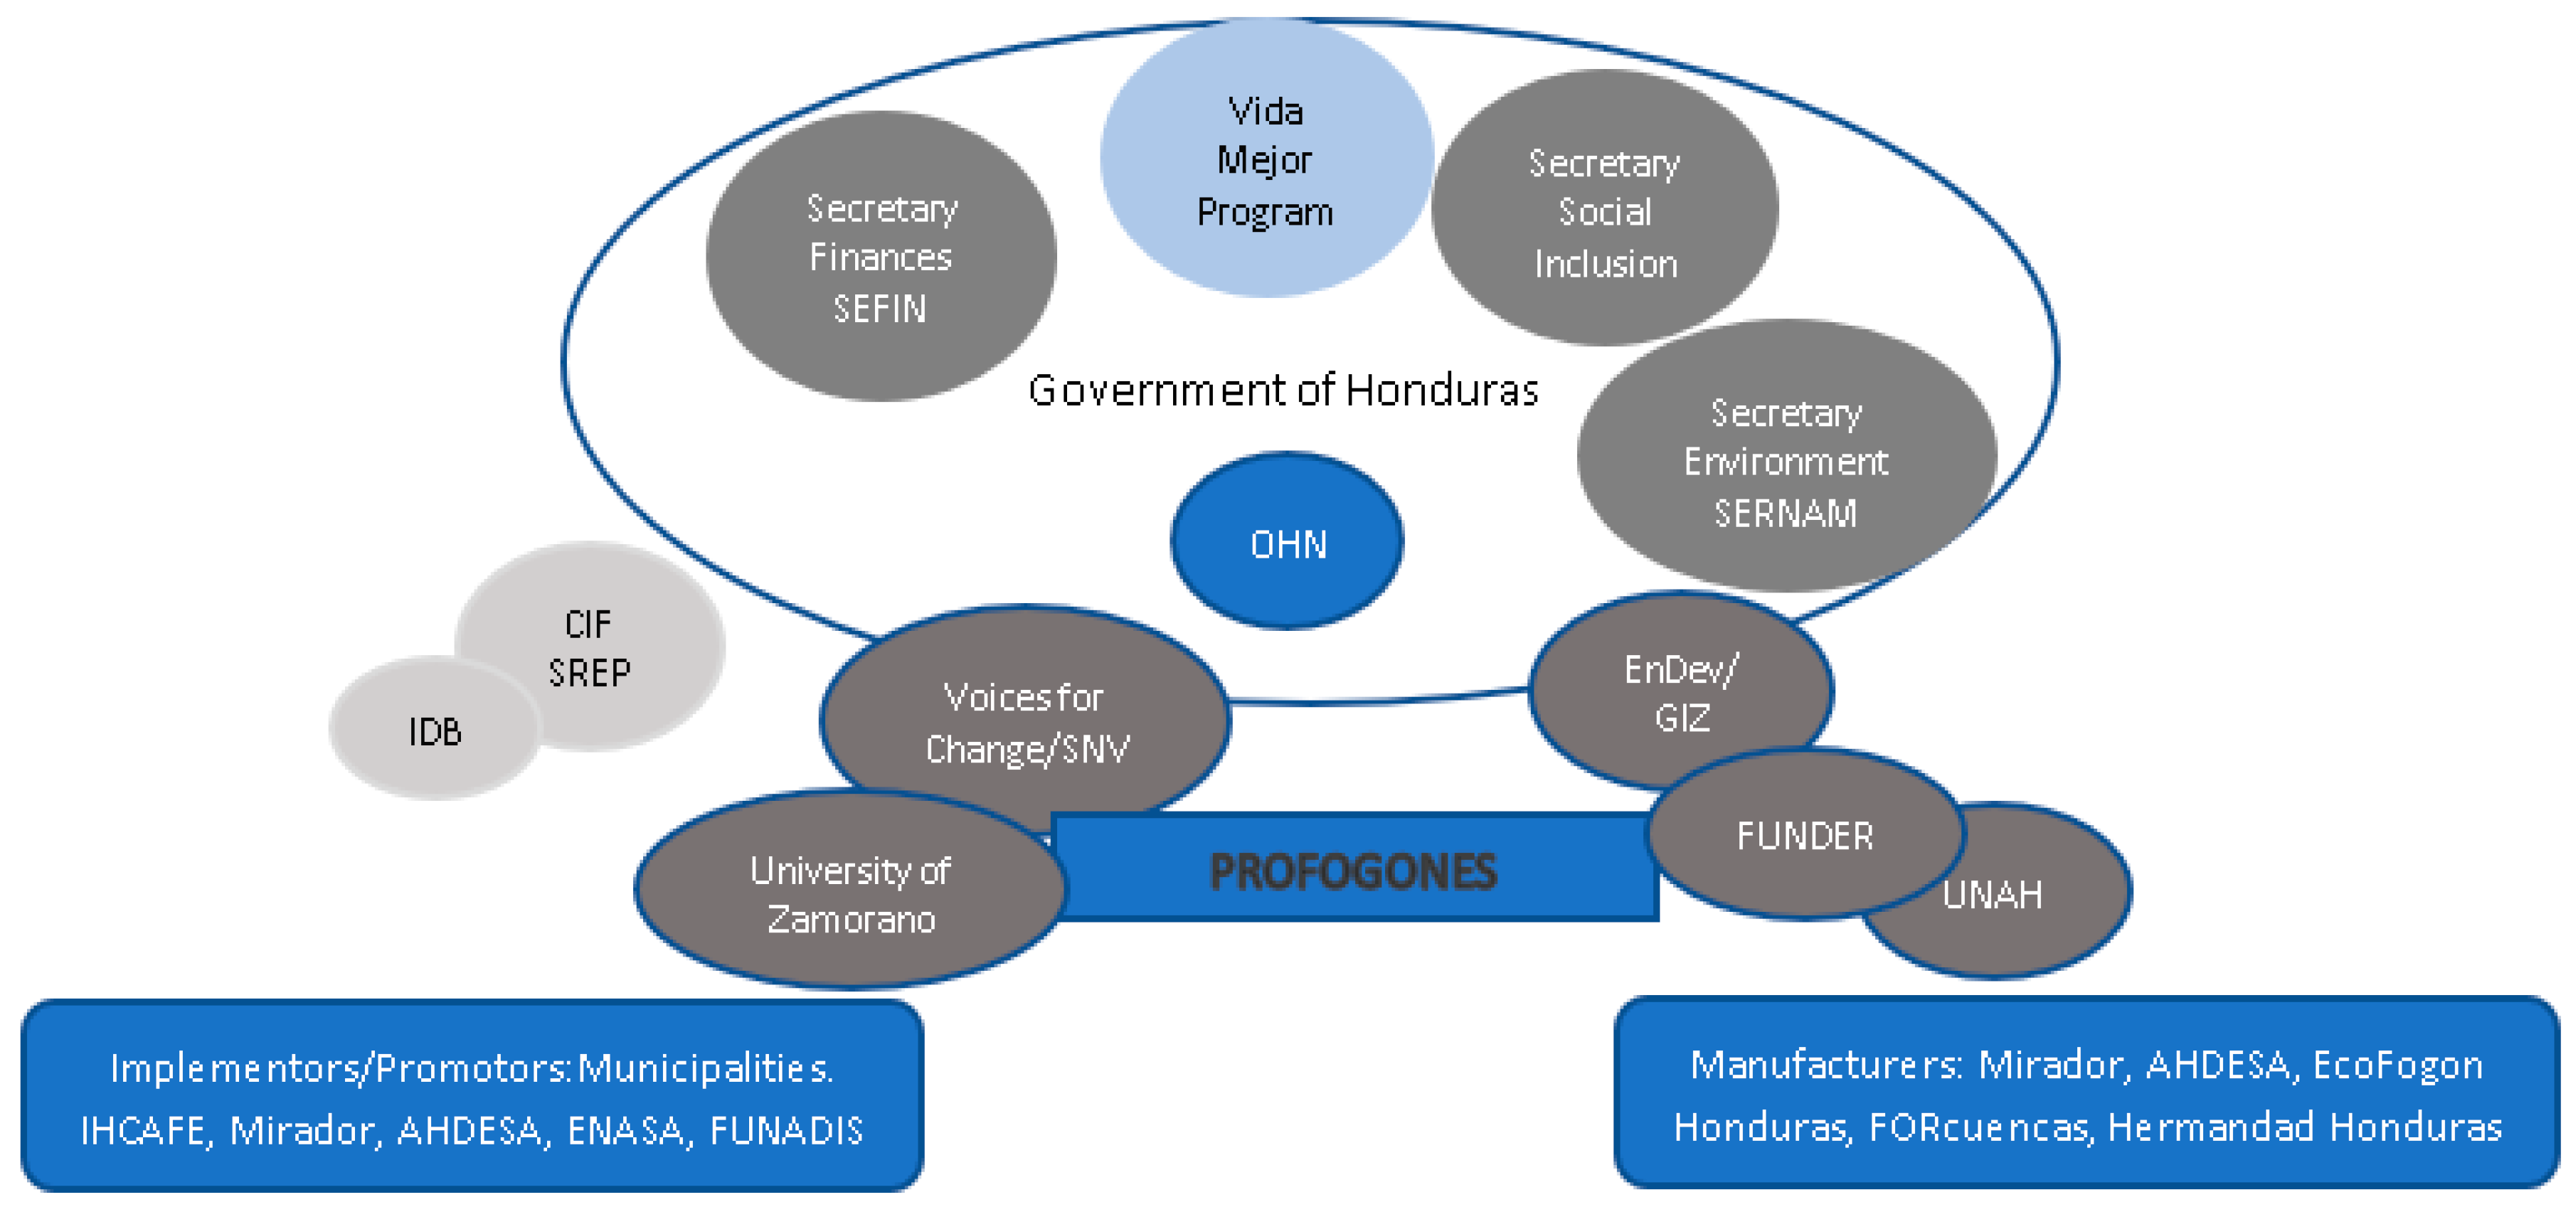
2.1.1. Stakeholders and Projects
2.1.2. Nationally Appropriate Mitigation Actions (NAMA)
2.2. Methodology and Data Used in the Cost-Benefit Analysis of a Strategy for Adoption of Improved Stoves in Honduras
2.2.1. Scenarios
- ○
- Business as Usual (BAU)—a scenario in which the strategy is not implemented. This scenario does not consider the implementation of measures to adopt the new technology. Under this scenario, the government continues giving away the improved stove as it was mentioned in the previous section.
- ○
- The scenario with a strategy. Under this scenario, improved stoves are introduced in the urban and rural households.
- ○
- The final scenario analyzed is the introduction of improved stoves plus LPG.
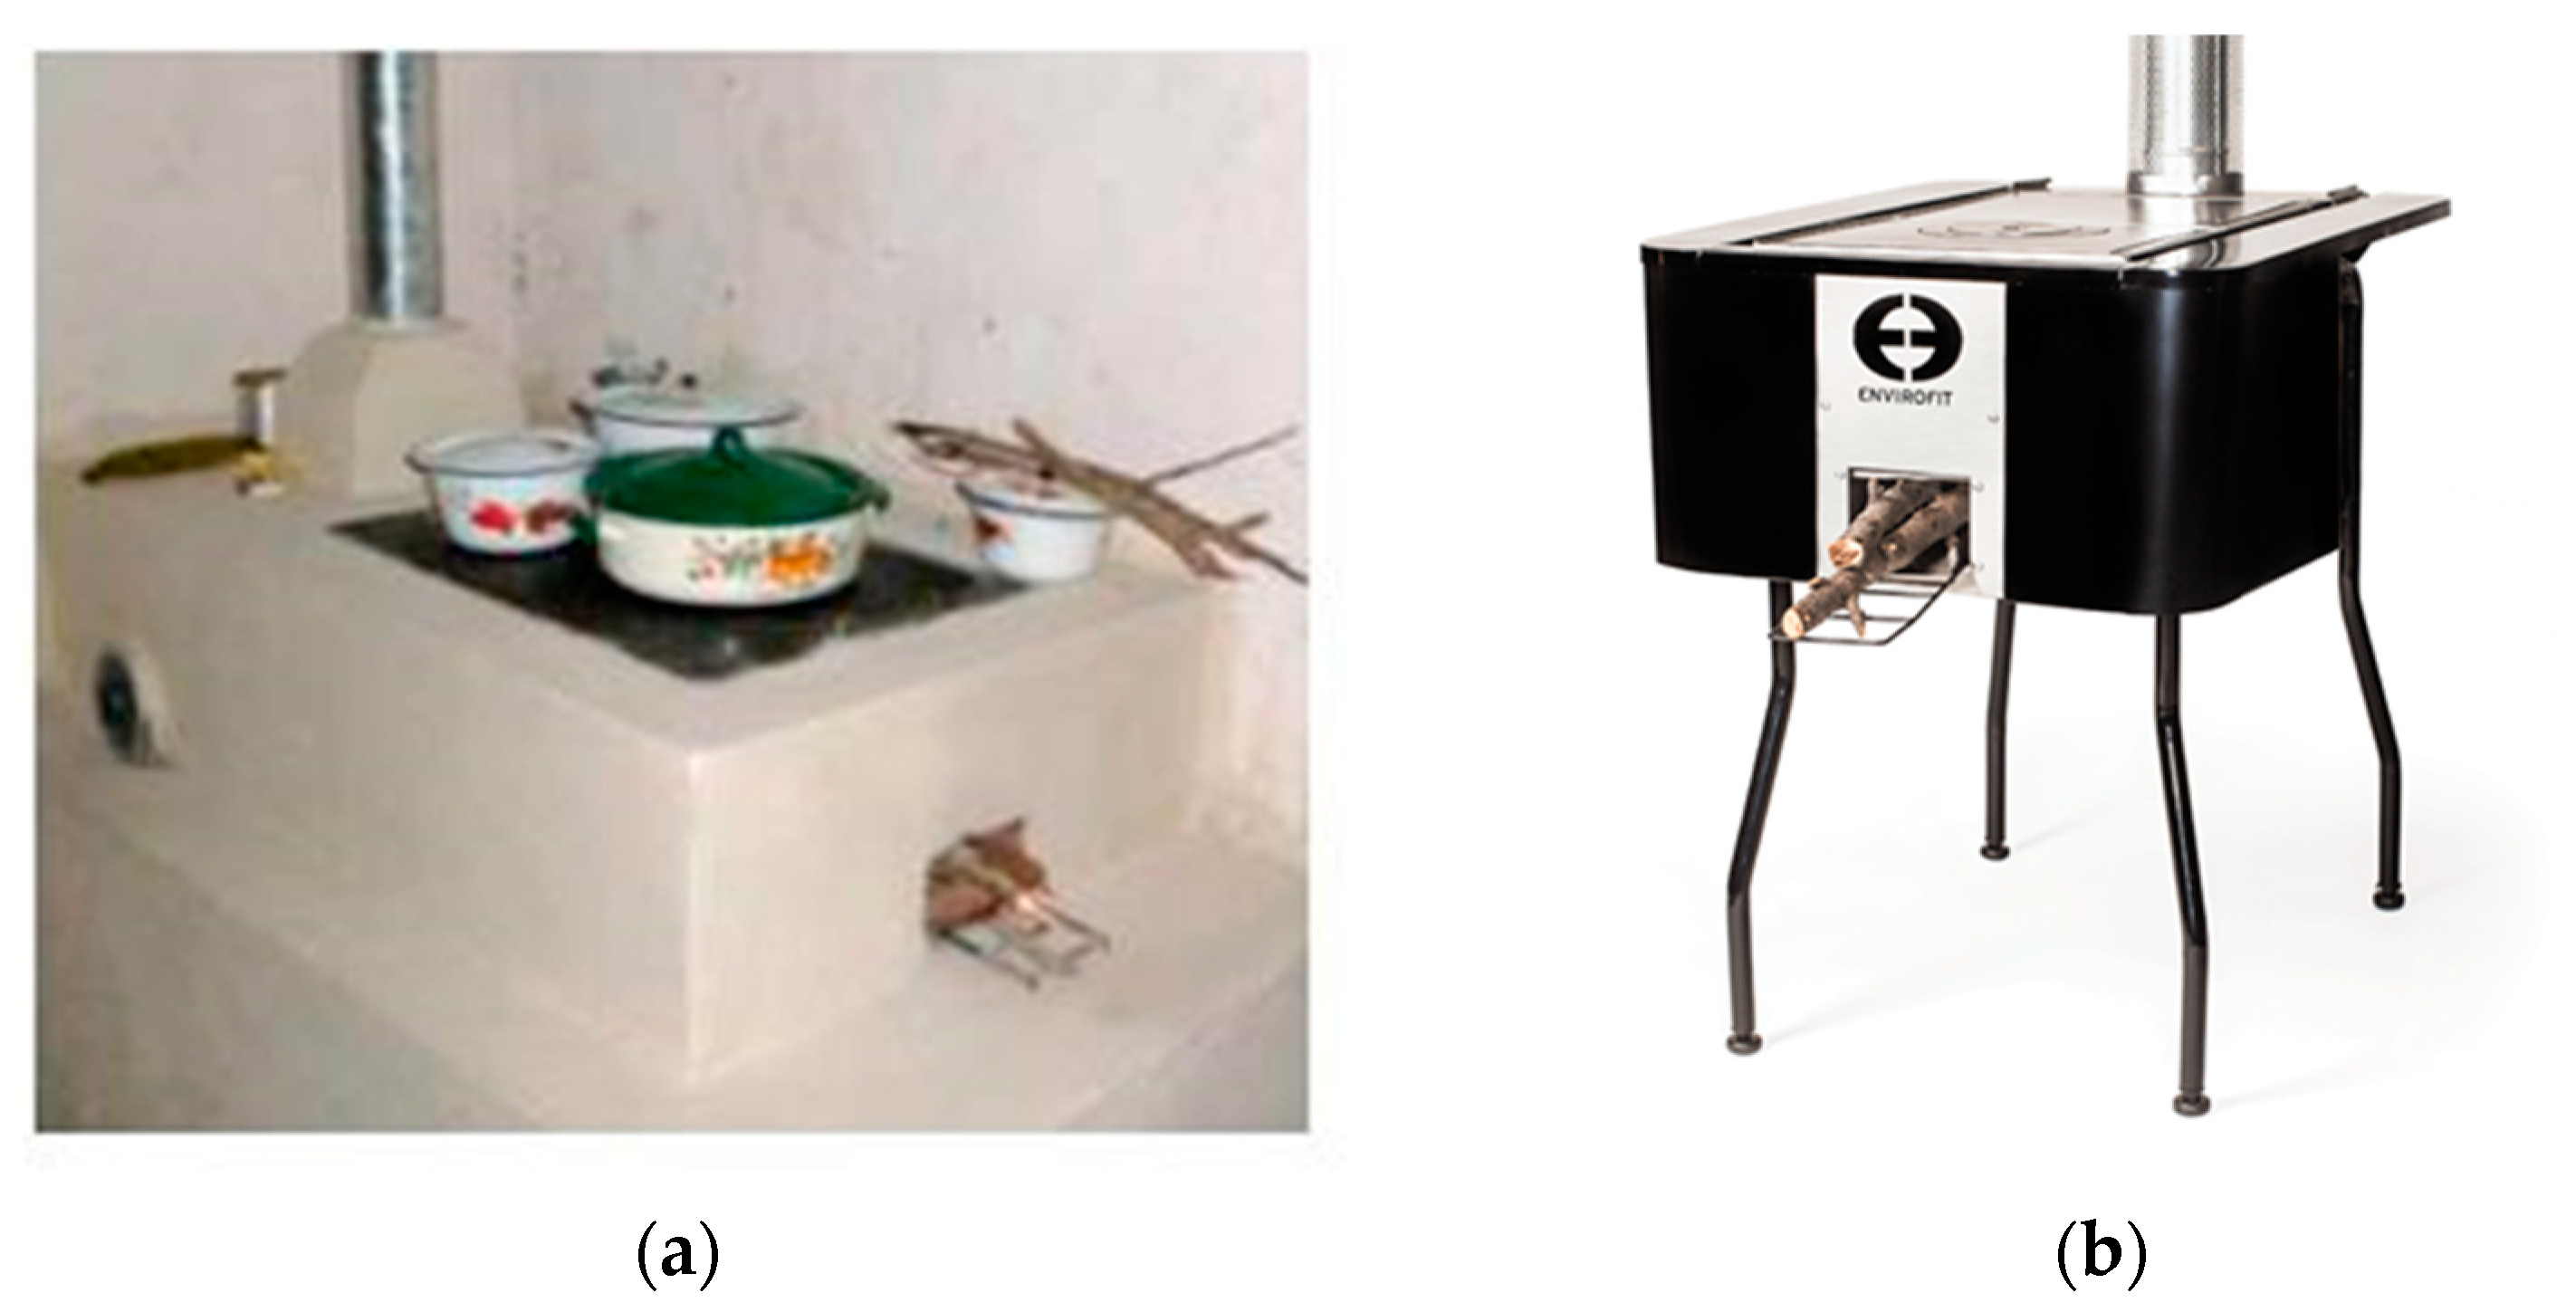
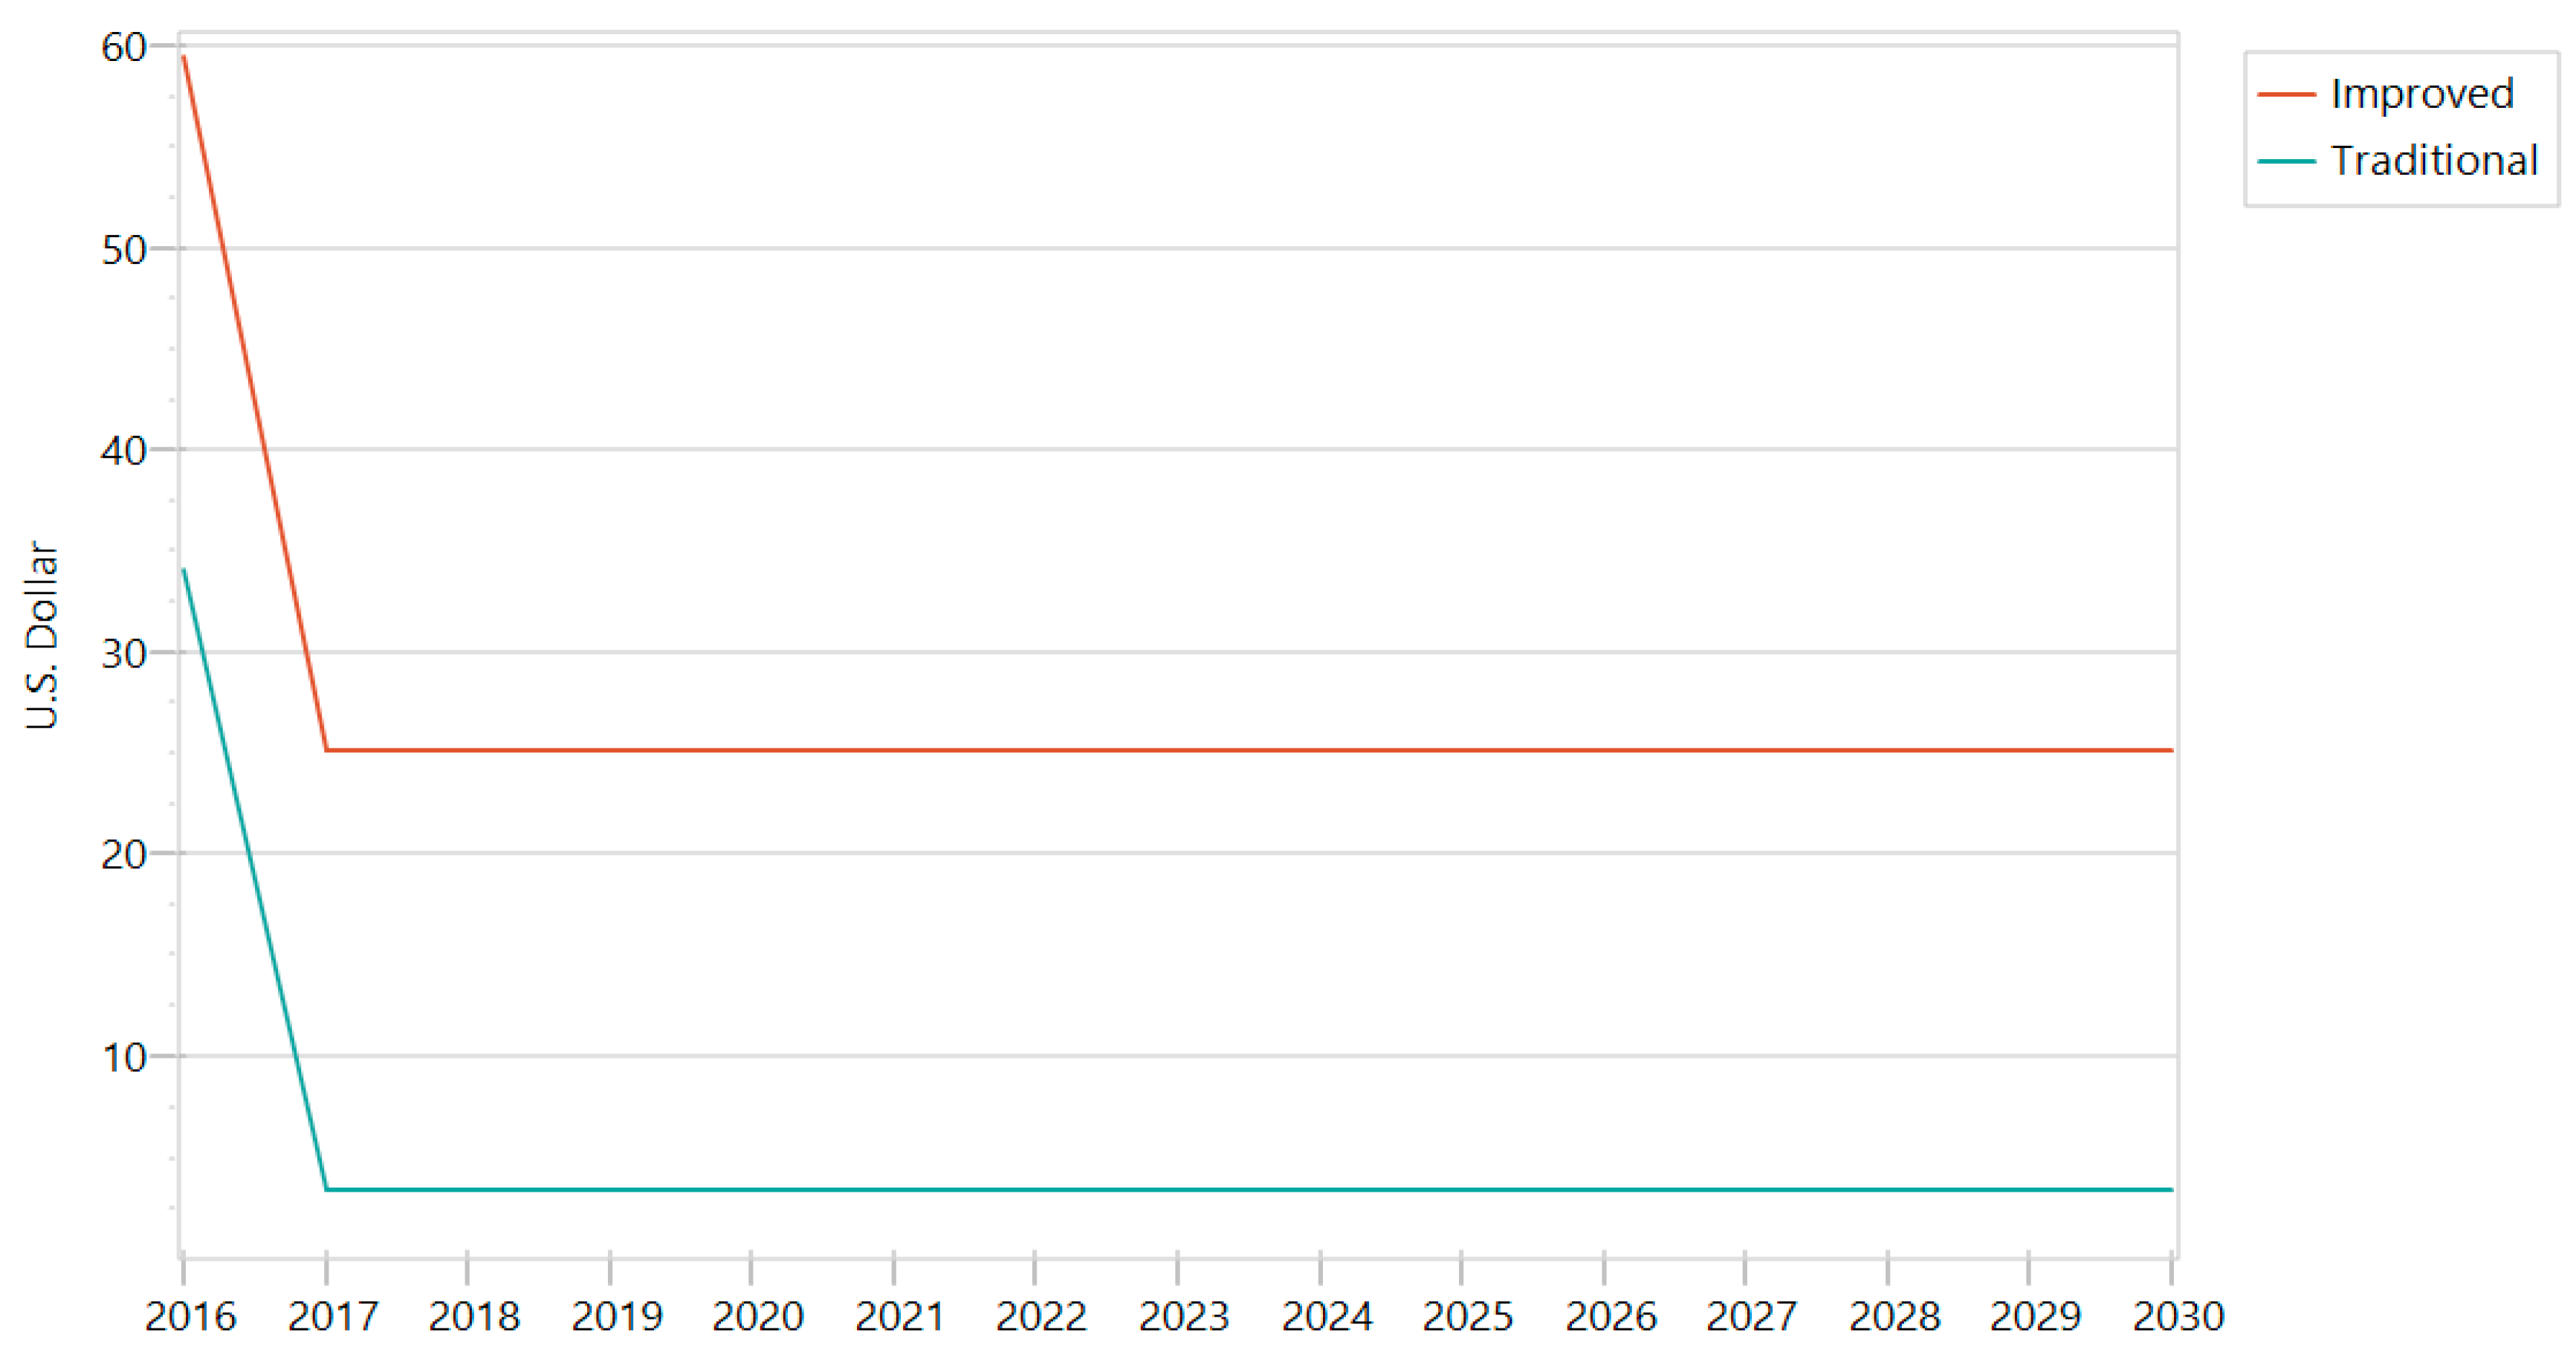
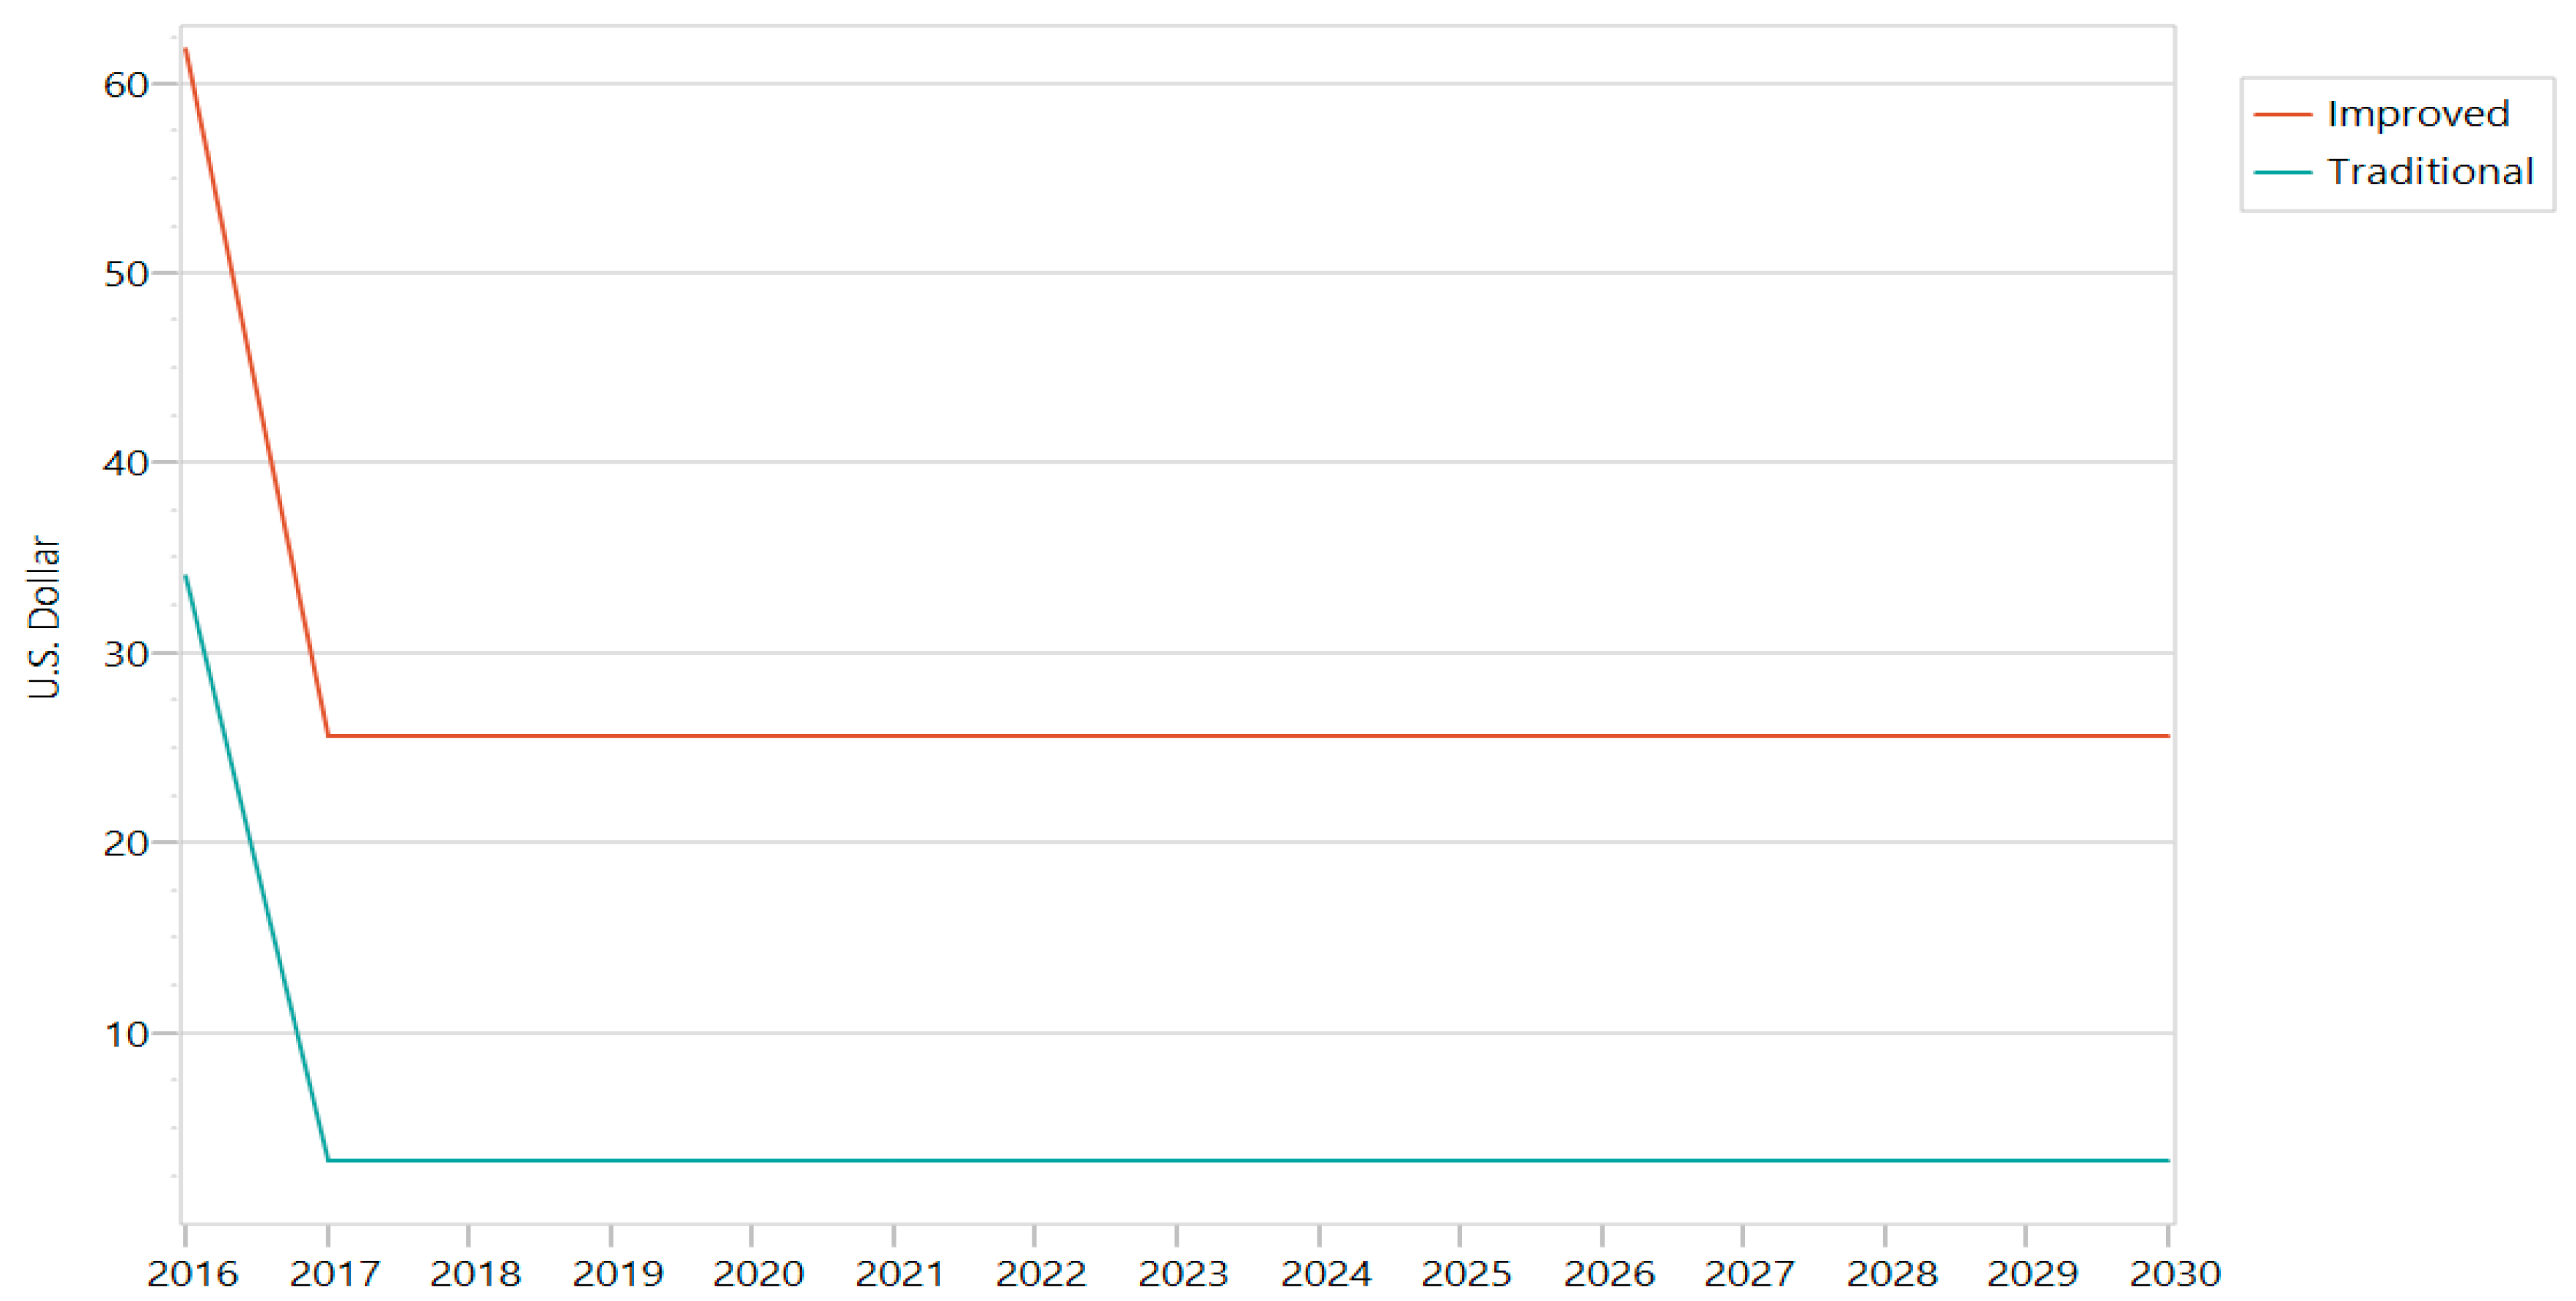
2.2.2. Manufacture Costs
- ○
- Urban households: Justa portable stove, USD 61.78.
- ○
- Urban households: Justa 2 × 3 stove, USD 59.50.
- ○
- Commercial: Justa 22 × 22 stove with flatiron, USD 108.16.
- The improvement of air quality—a reduction in particulate emissions (black carbon) and smoke.
- Reduction in fuel needs (saving time and money), particularly benefiting women and children who traditionally collect firewood.
- The creation of new jobs in production, sales, marketing and distribution of improved stoves.
- Reduction in pressure on the forest.
- Health benefits as a result of the reductions in household air pollution.
- Others.
3. Strategy Implementation Results
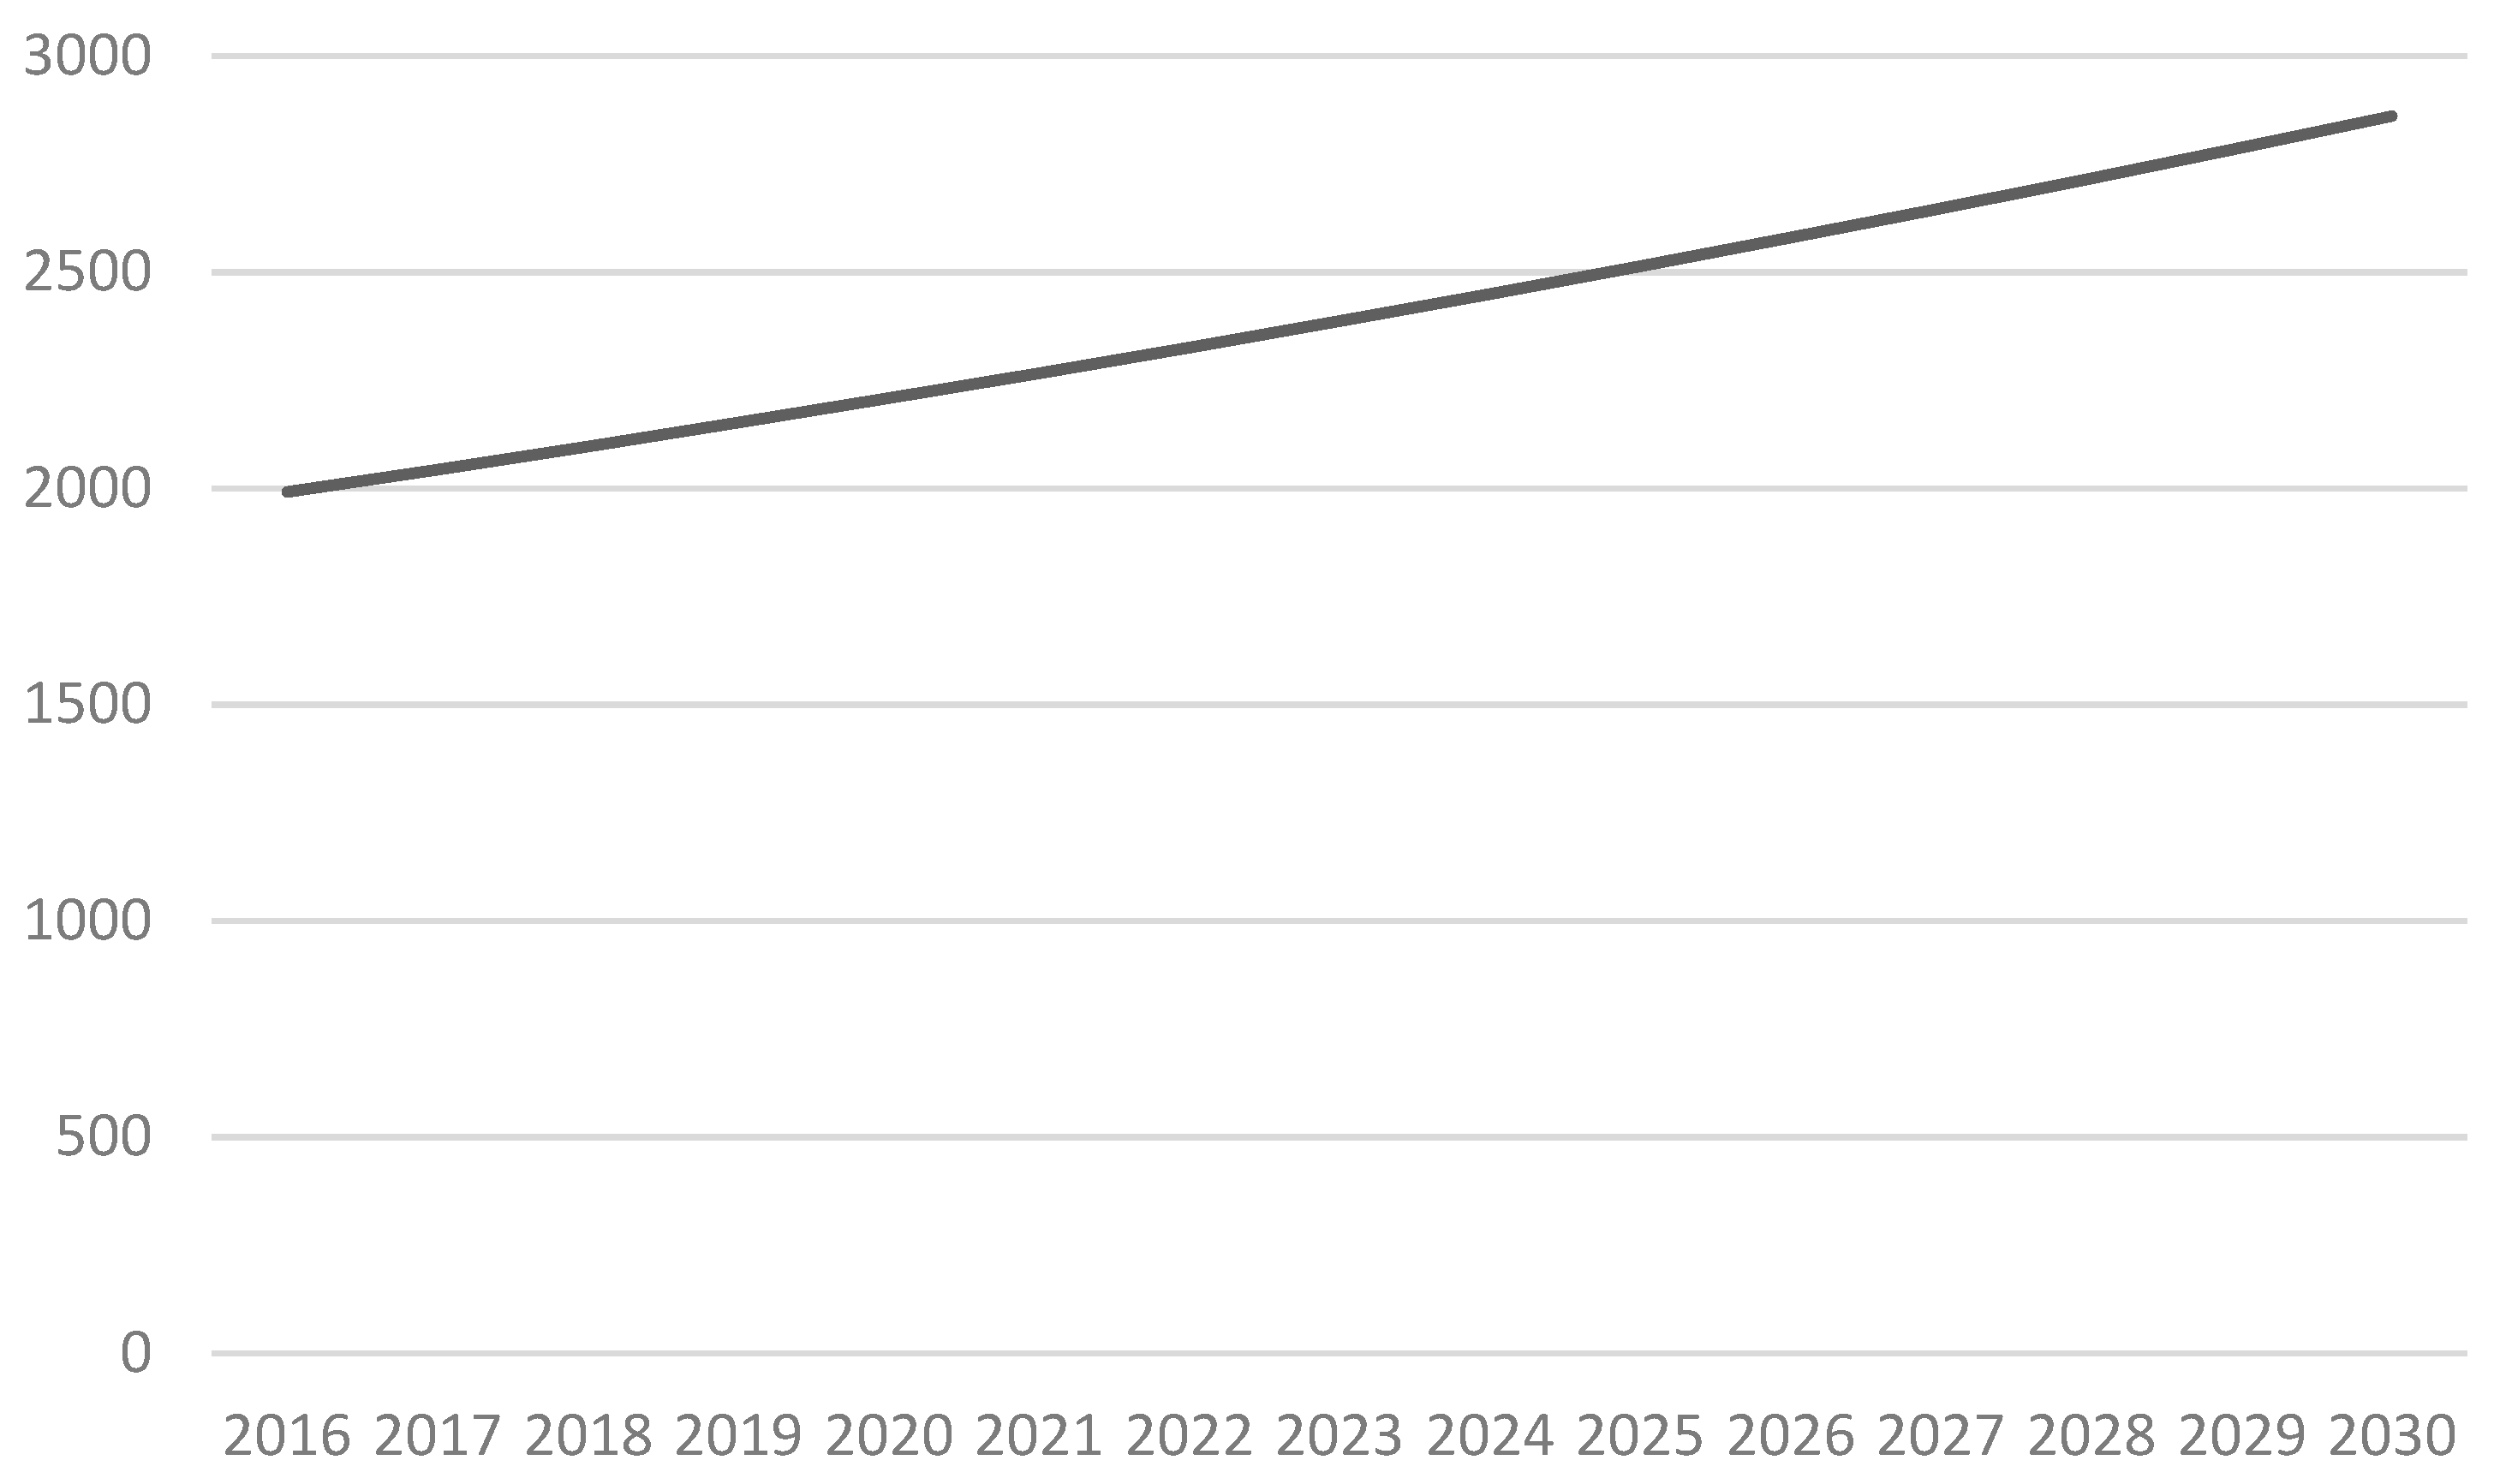
3.1. BAU Scenario
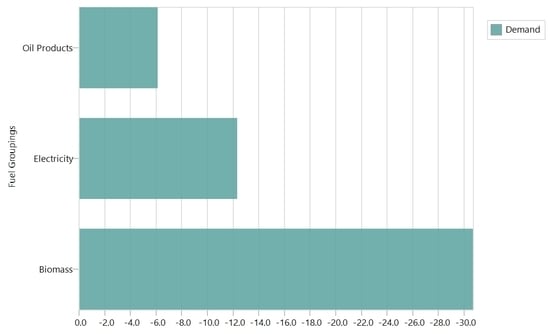
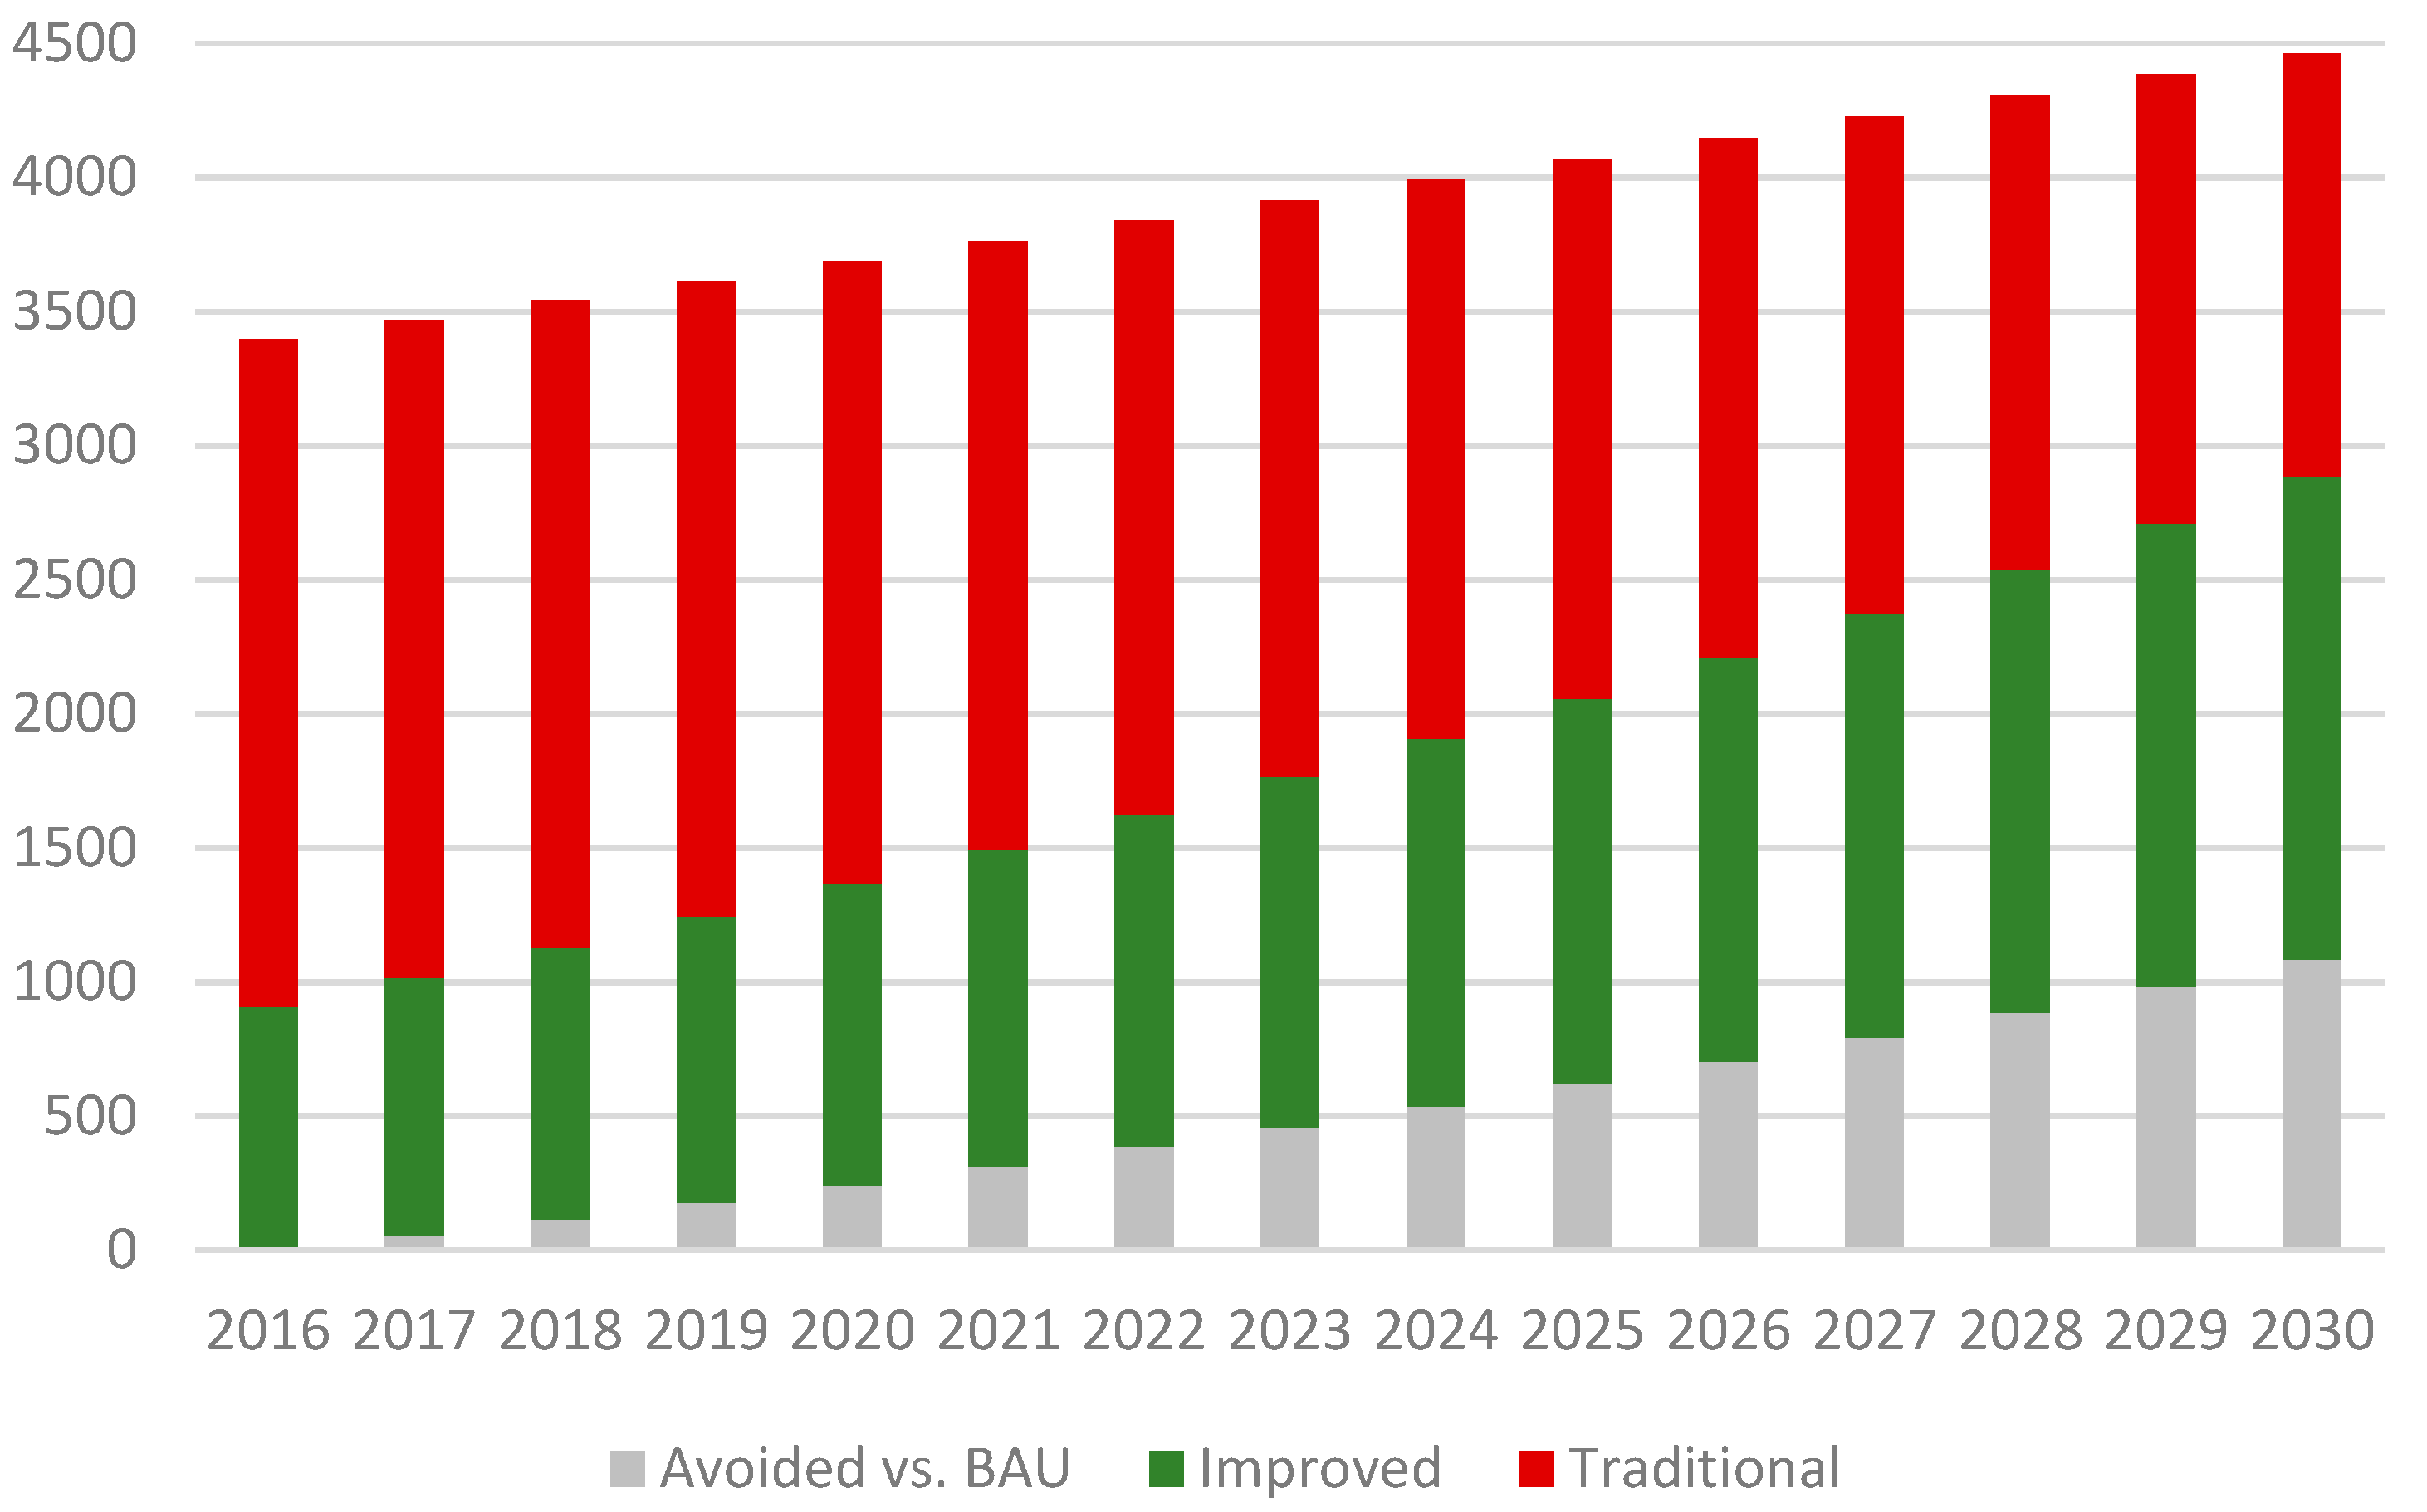
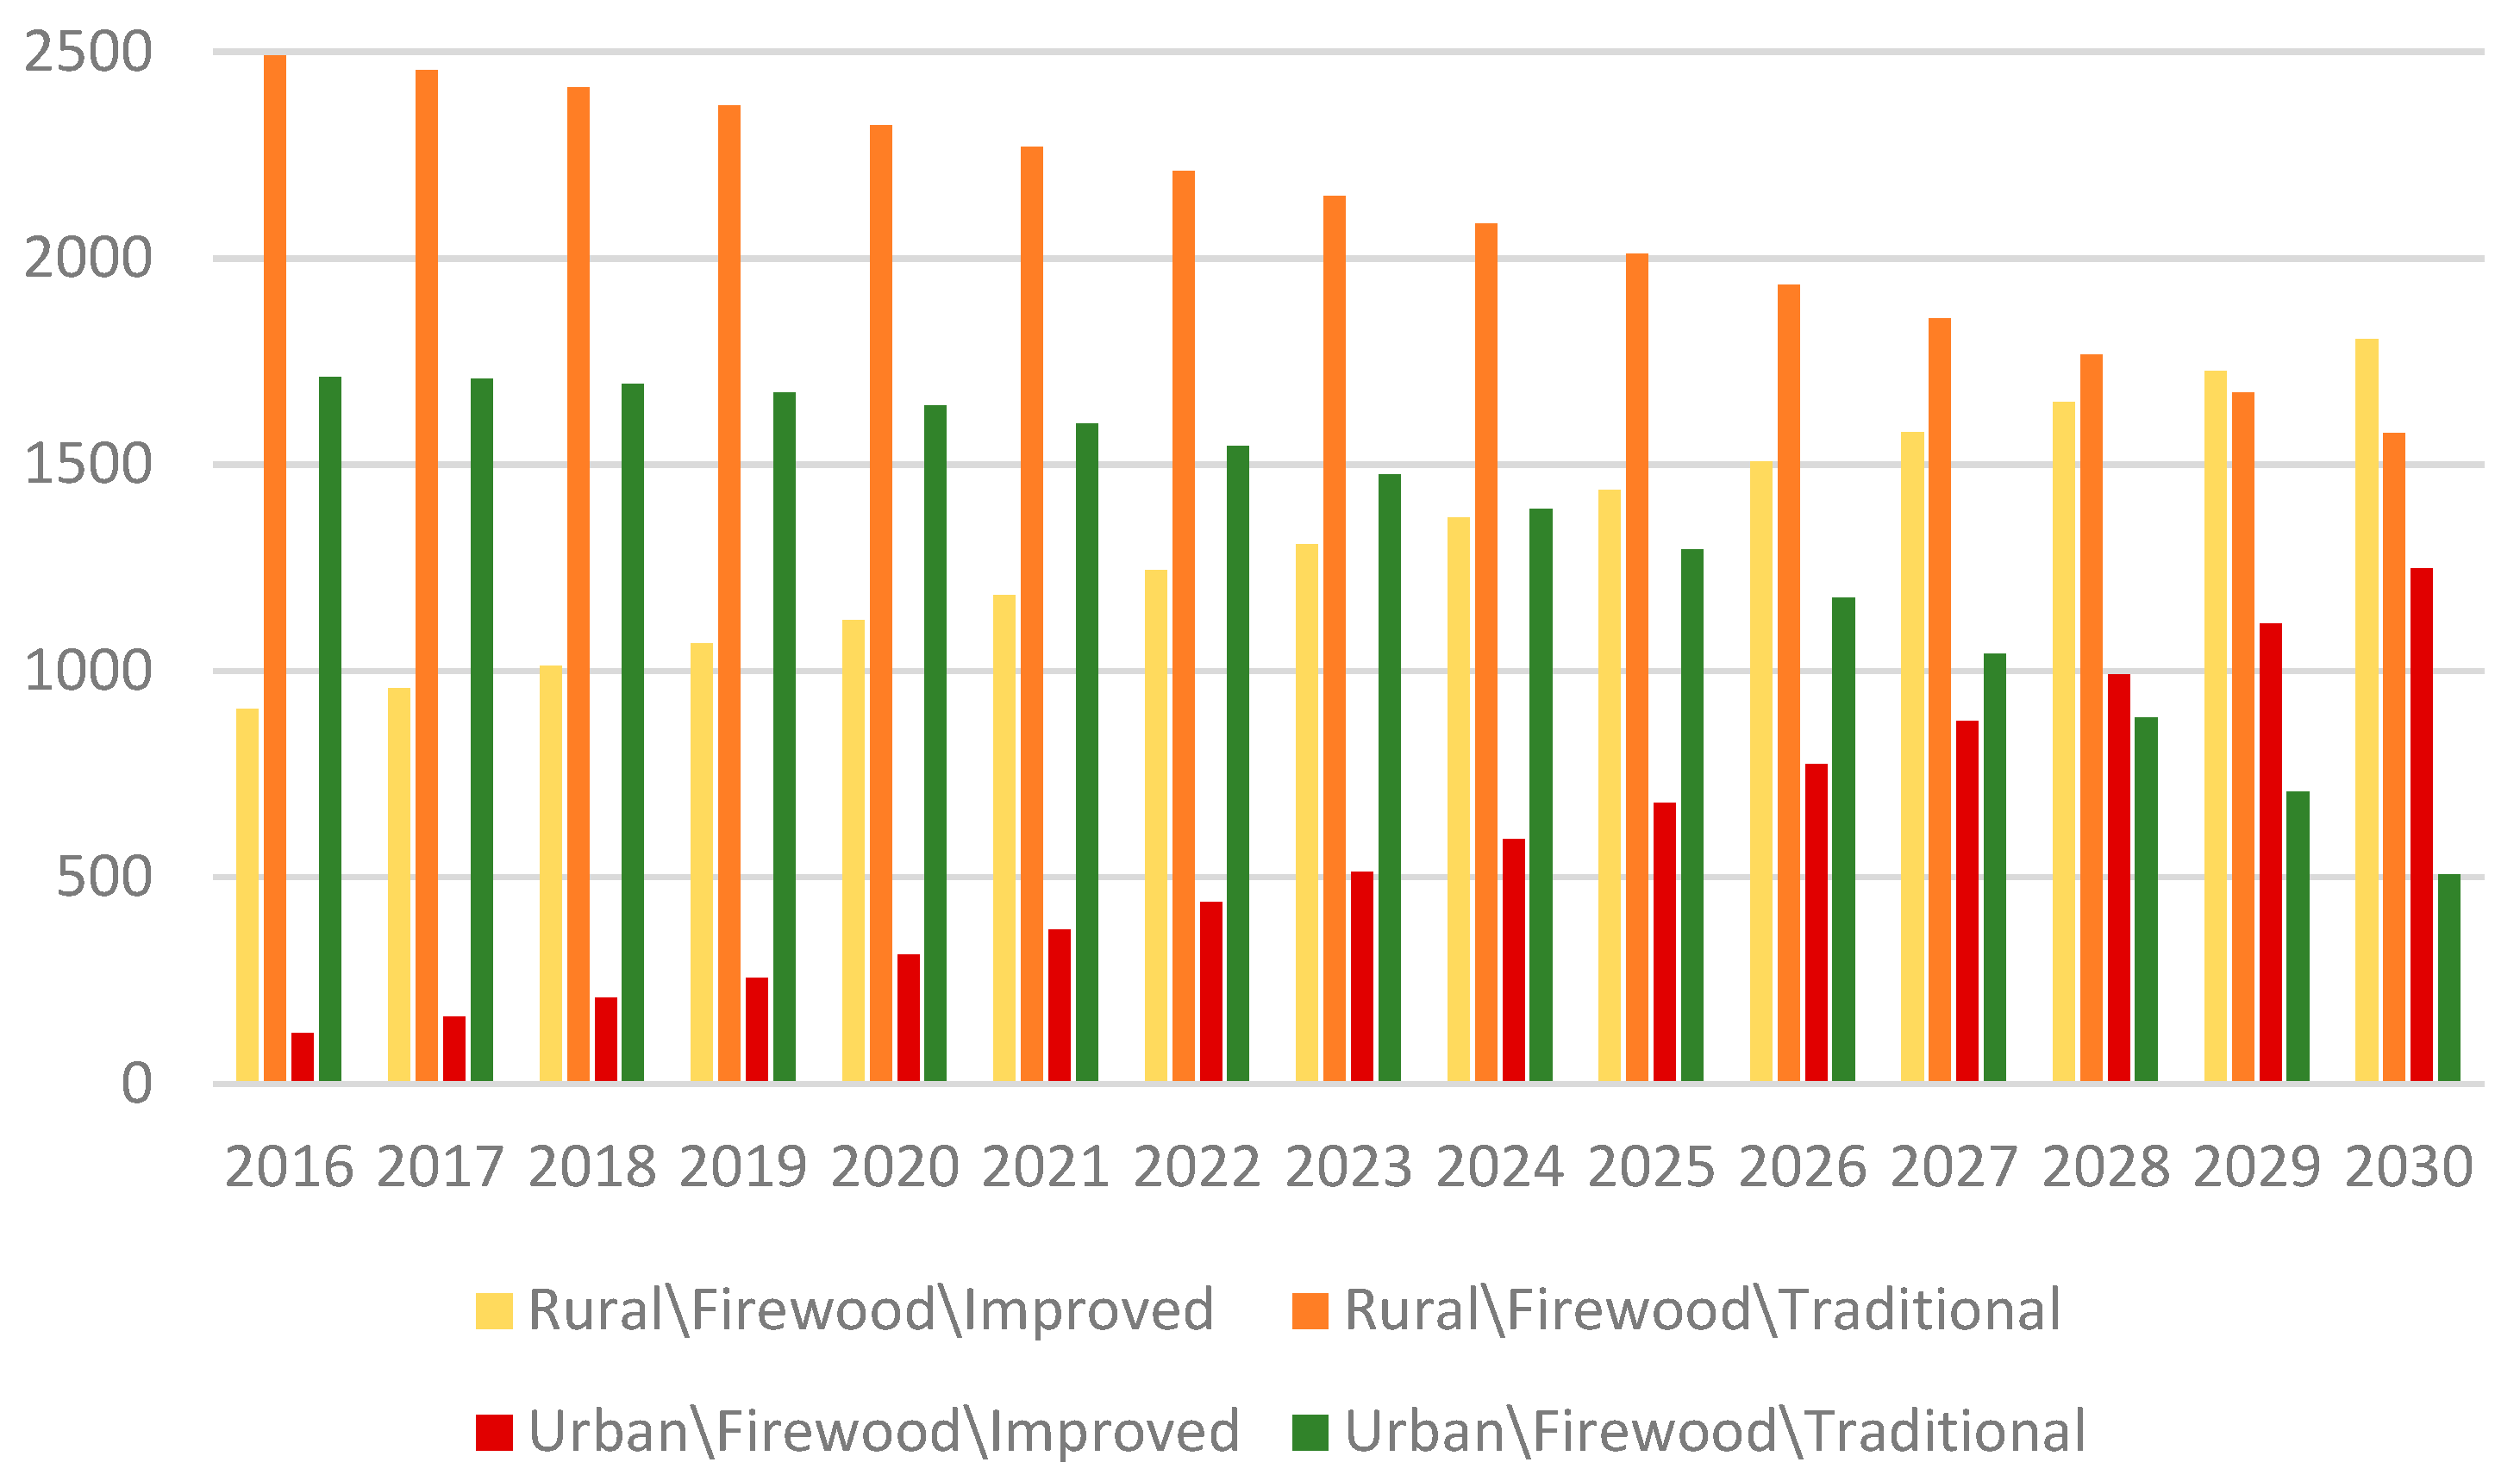
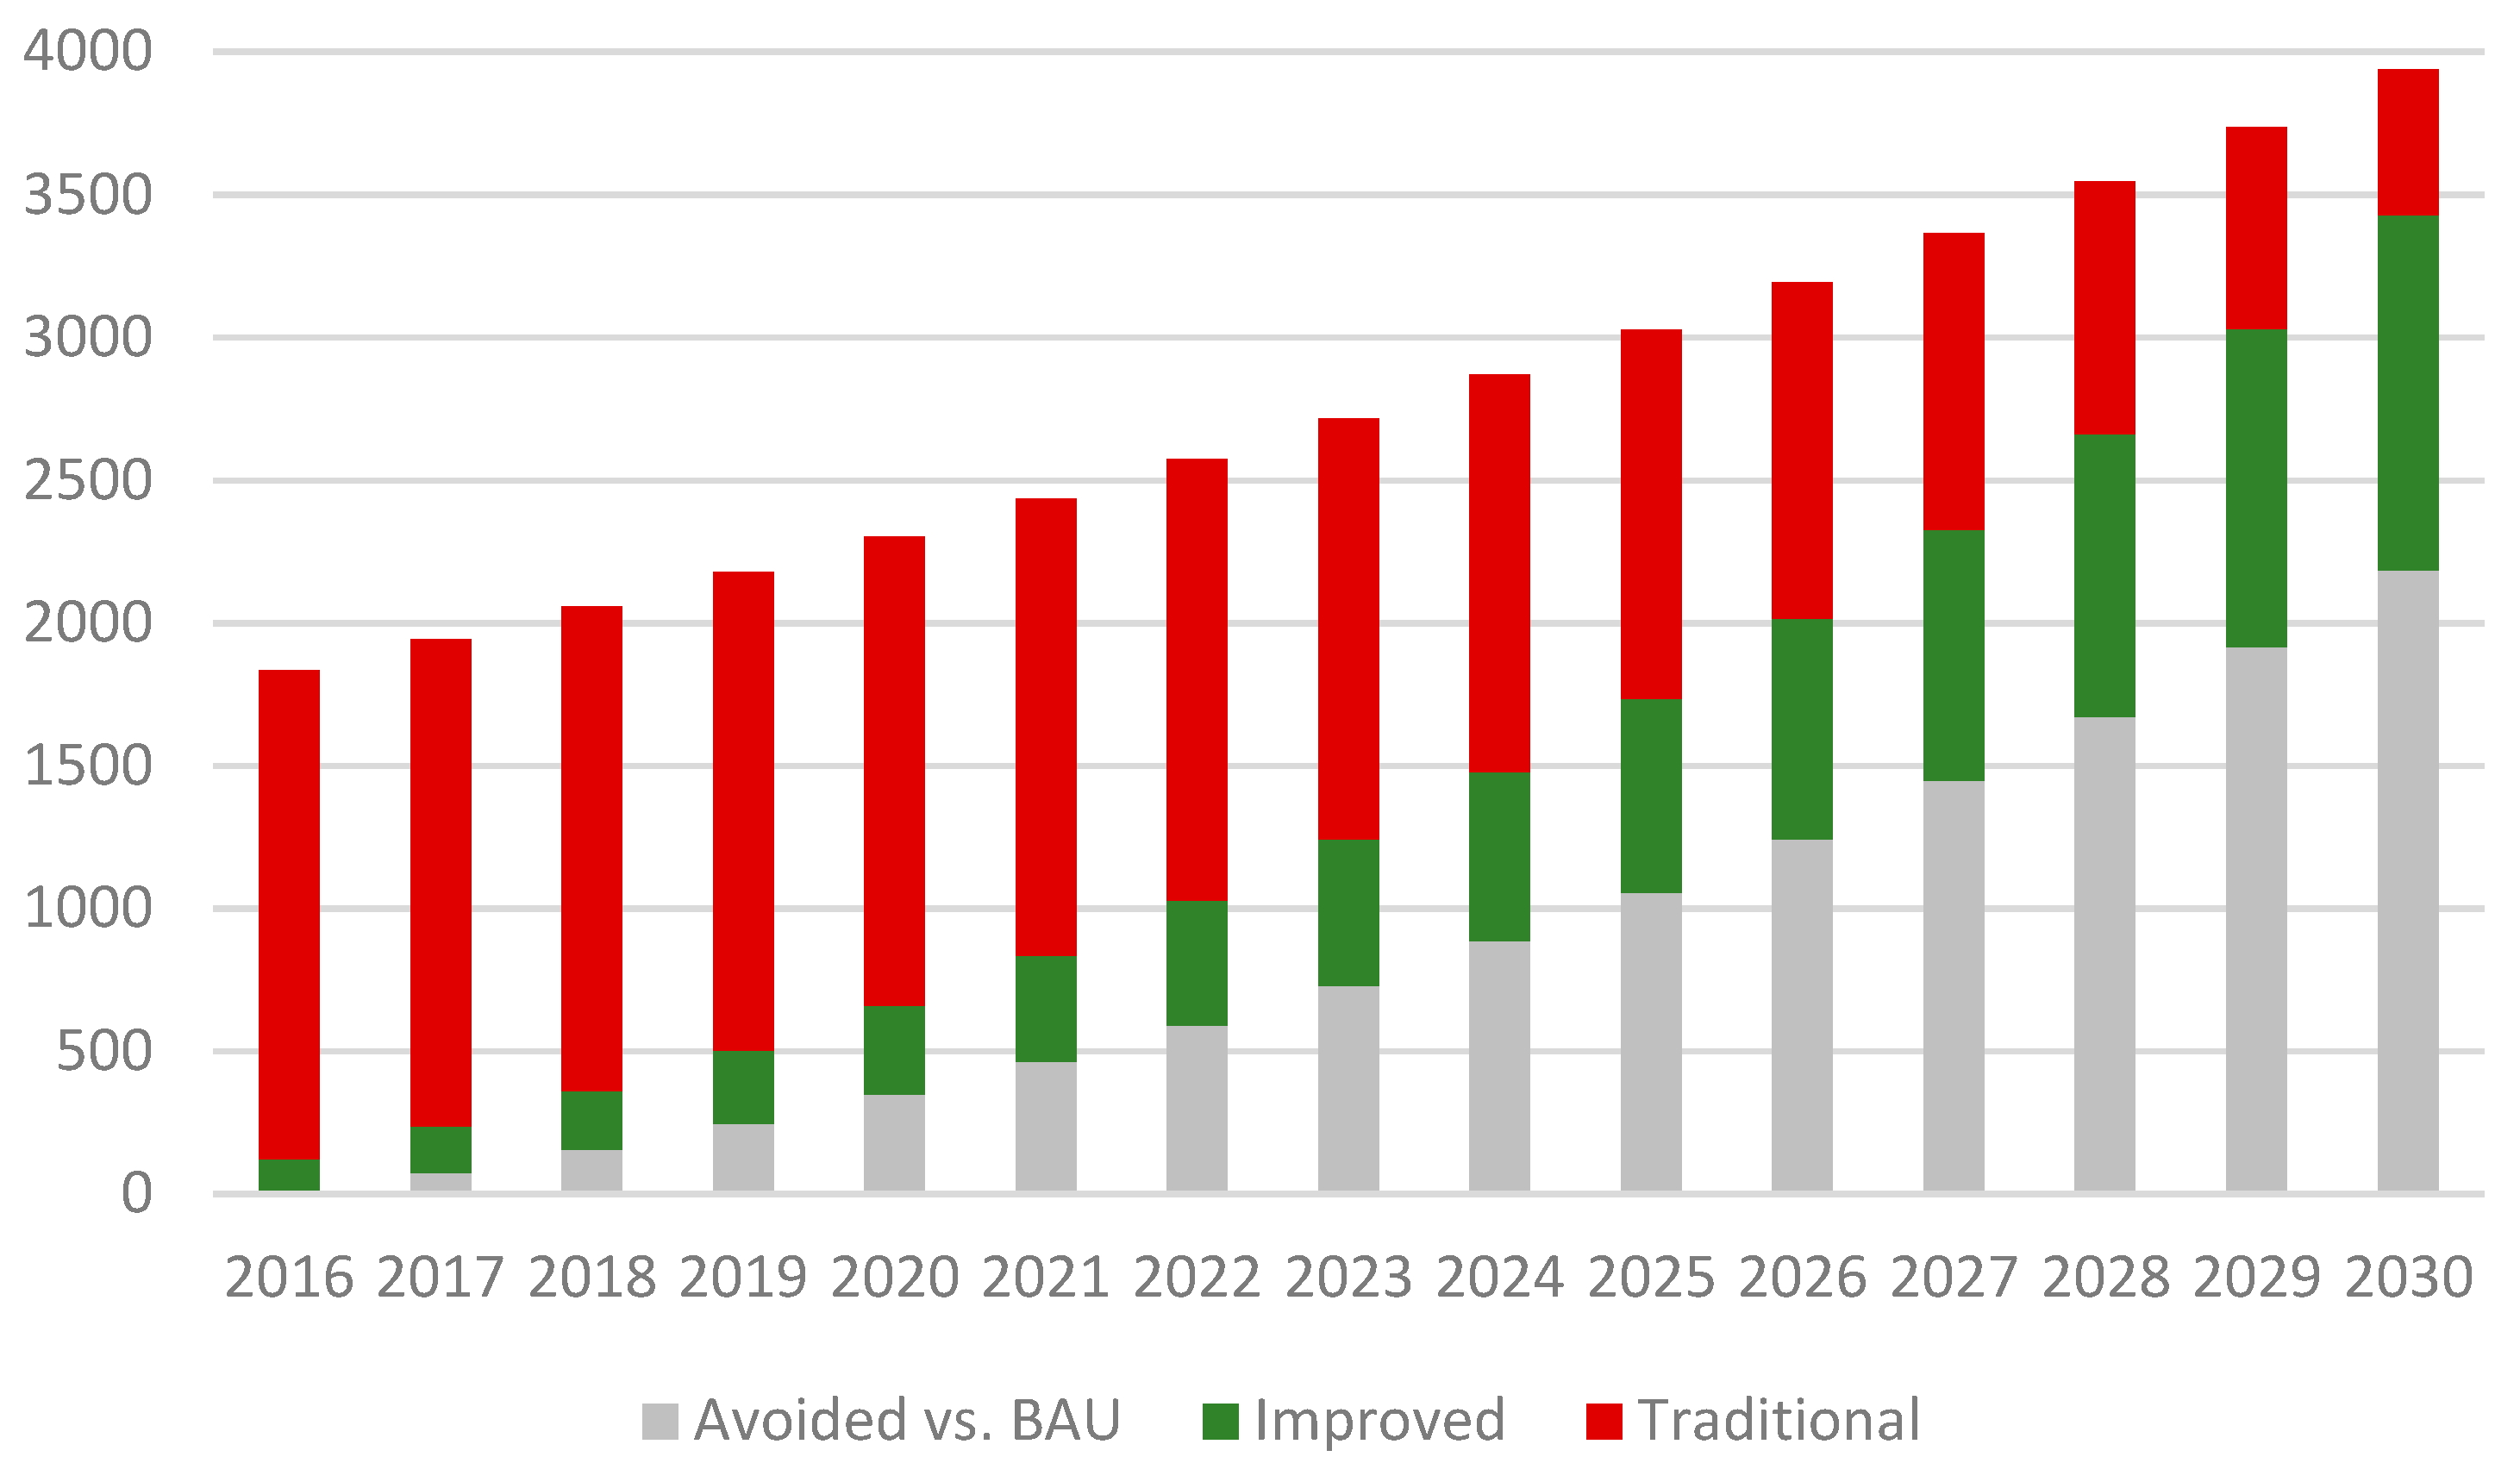
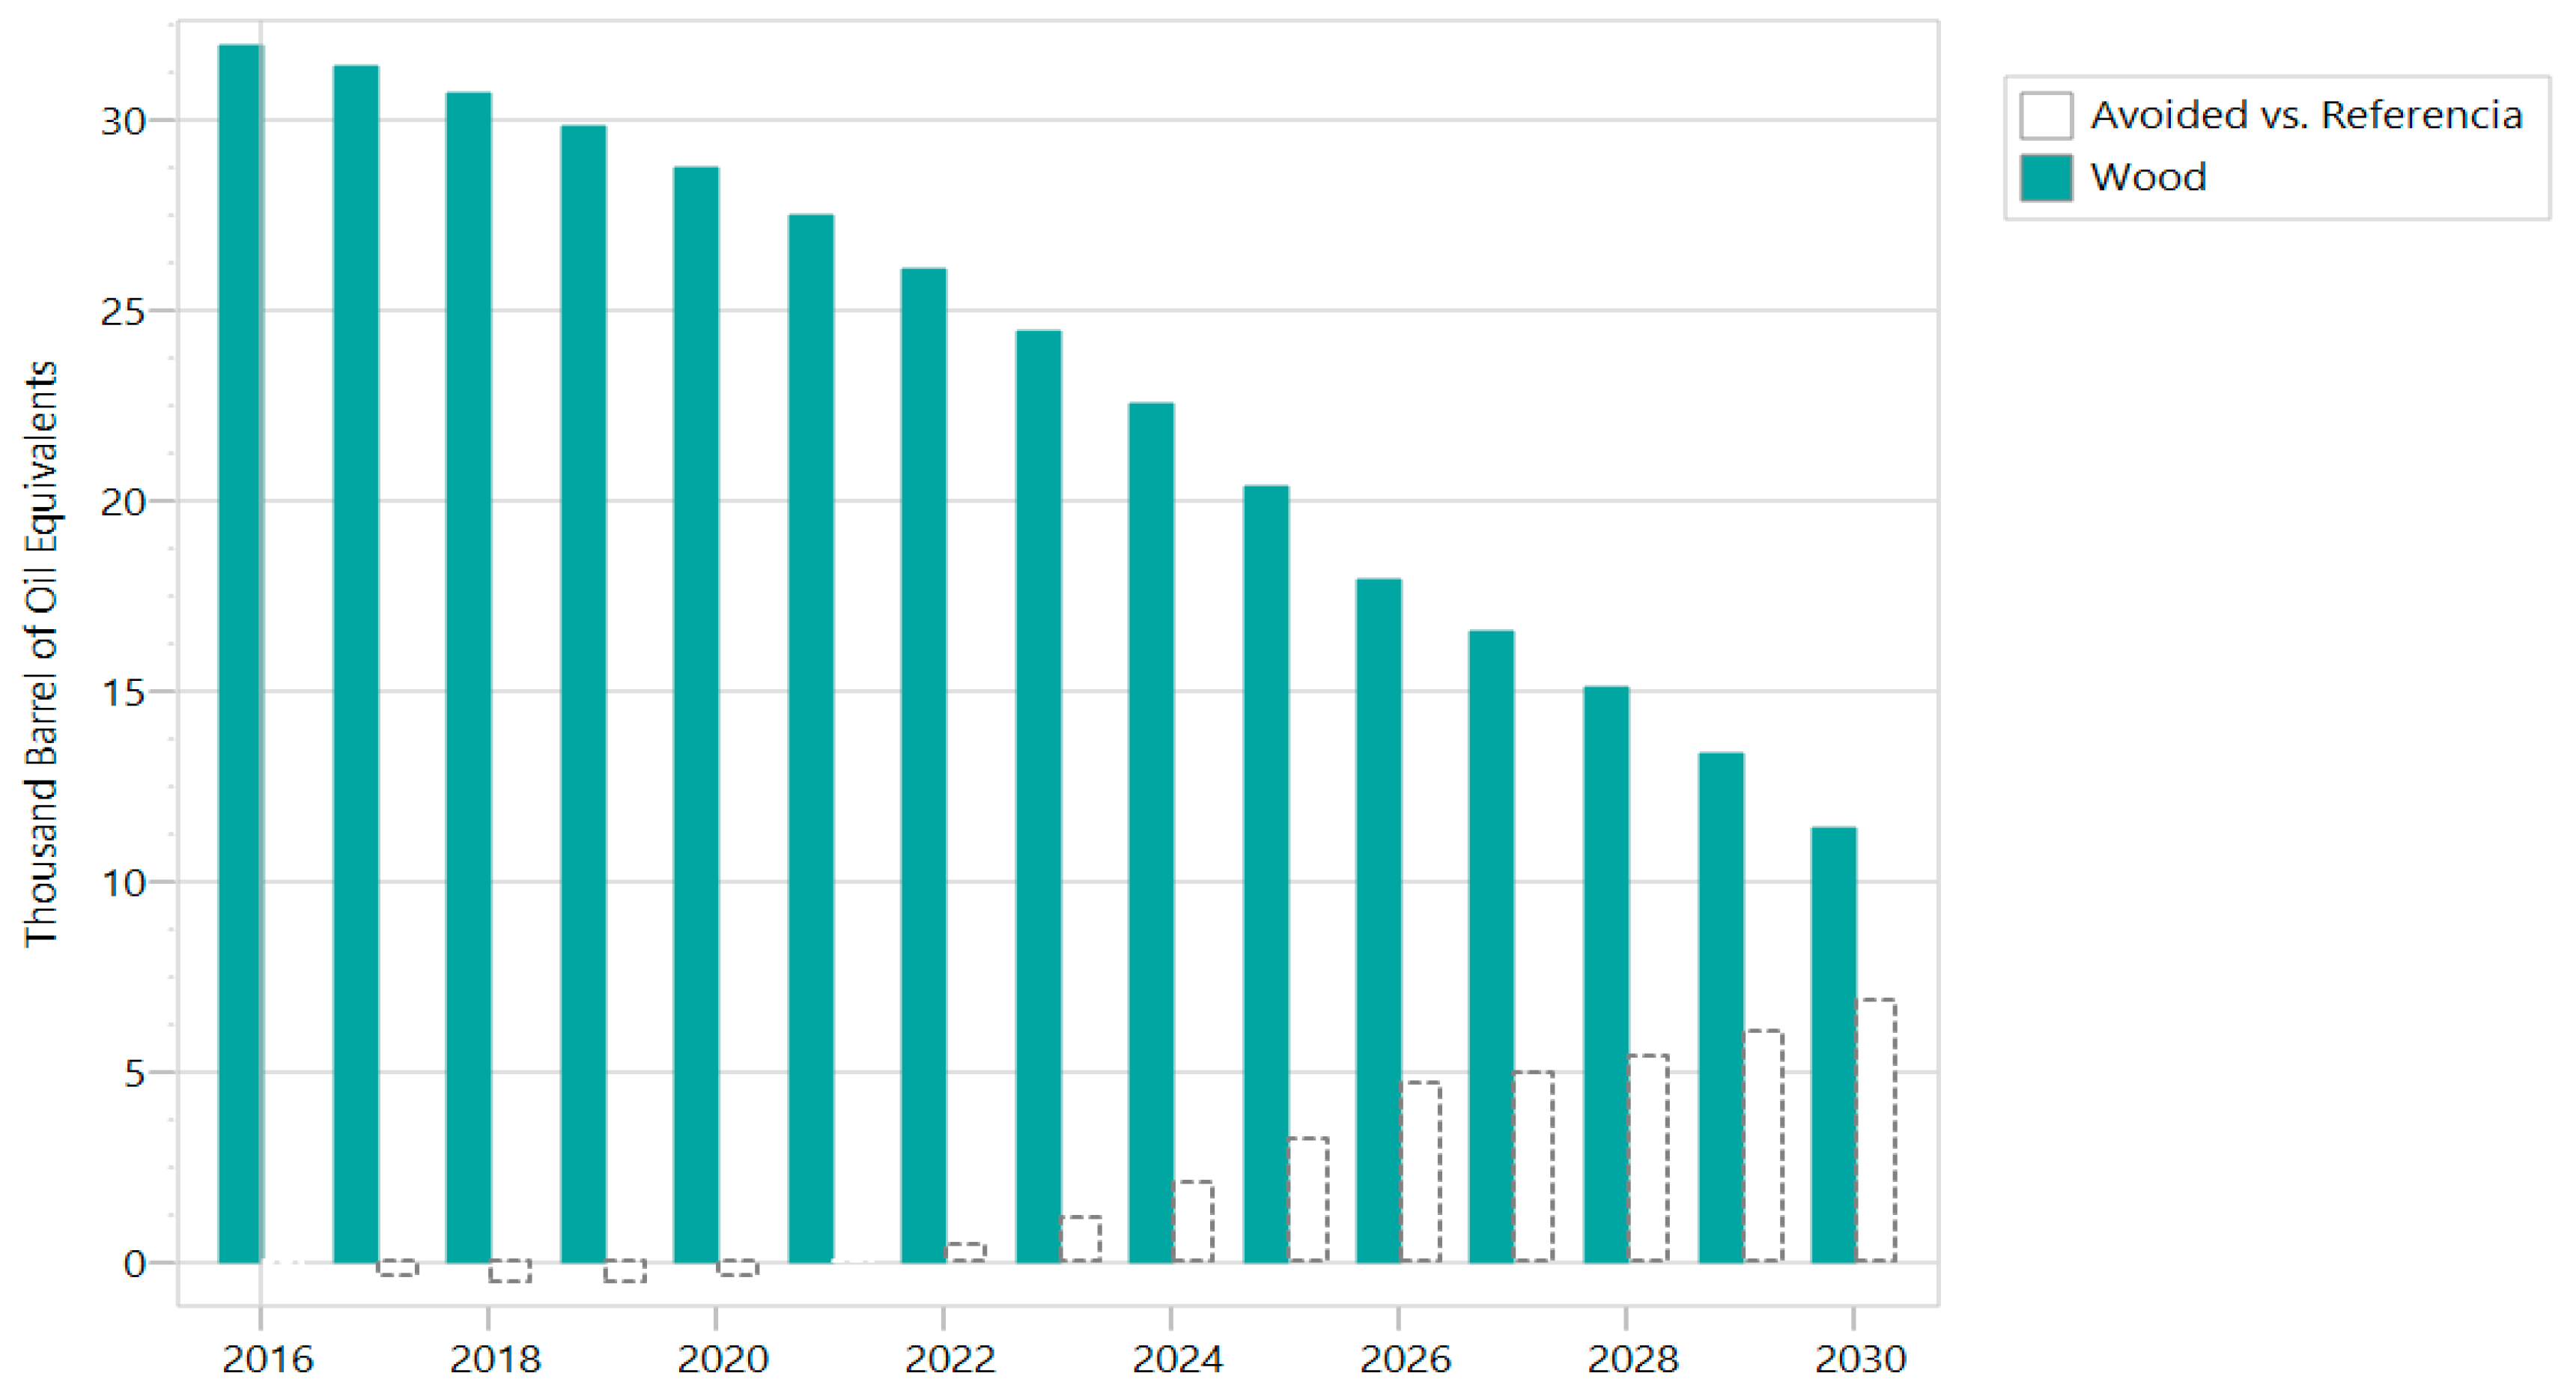
3.2. Introduction of Improved Stoves vs. BAU Reference Scenario
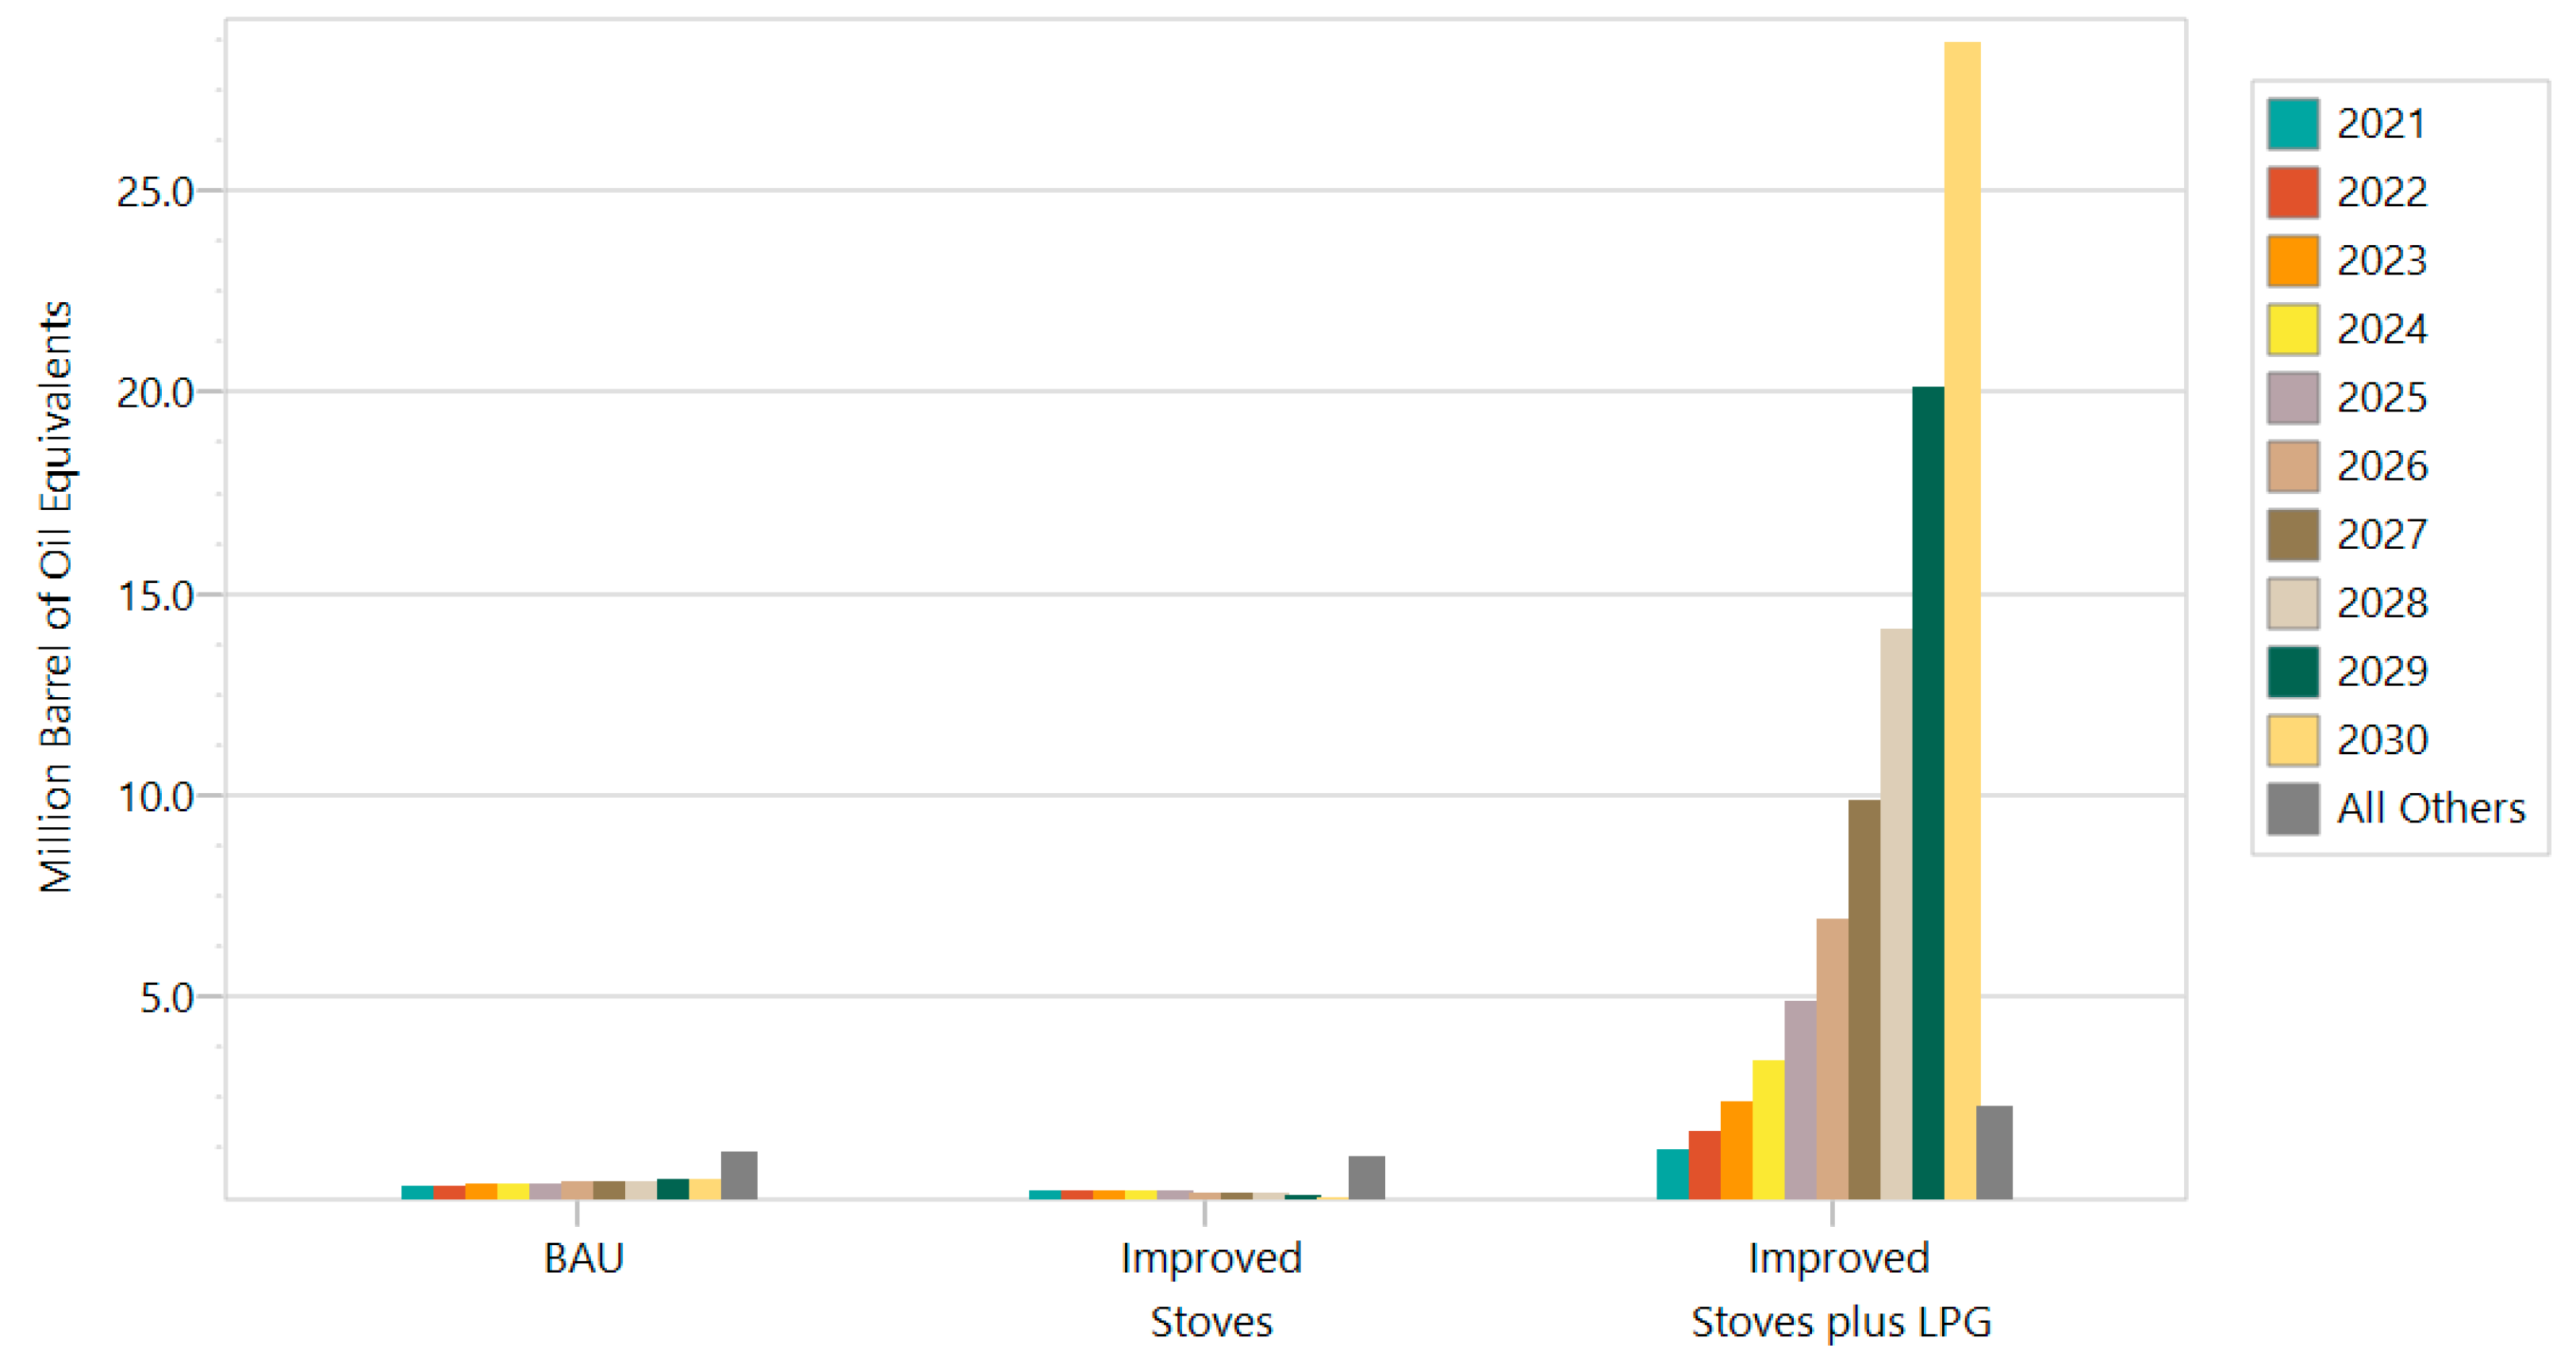
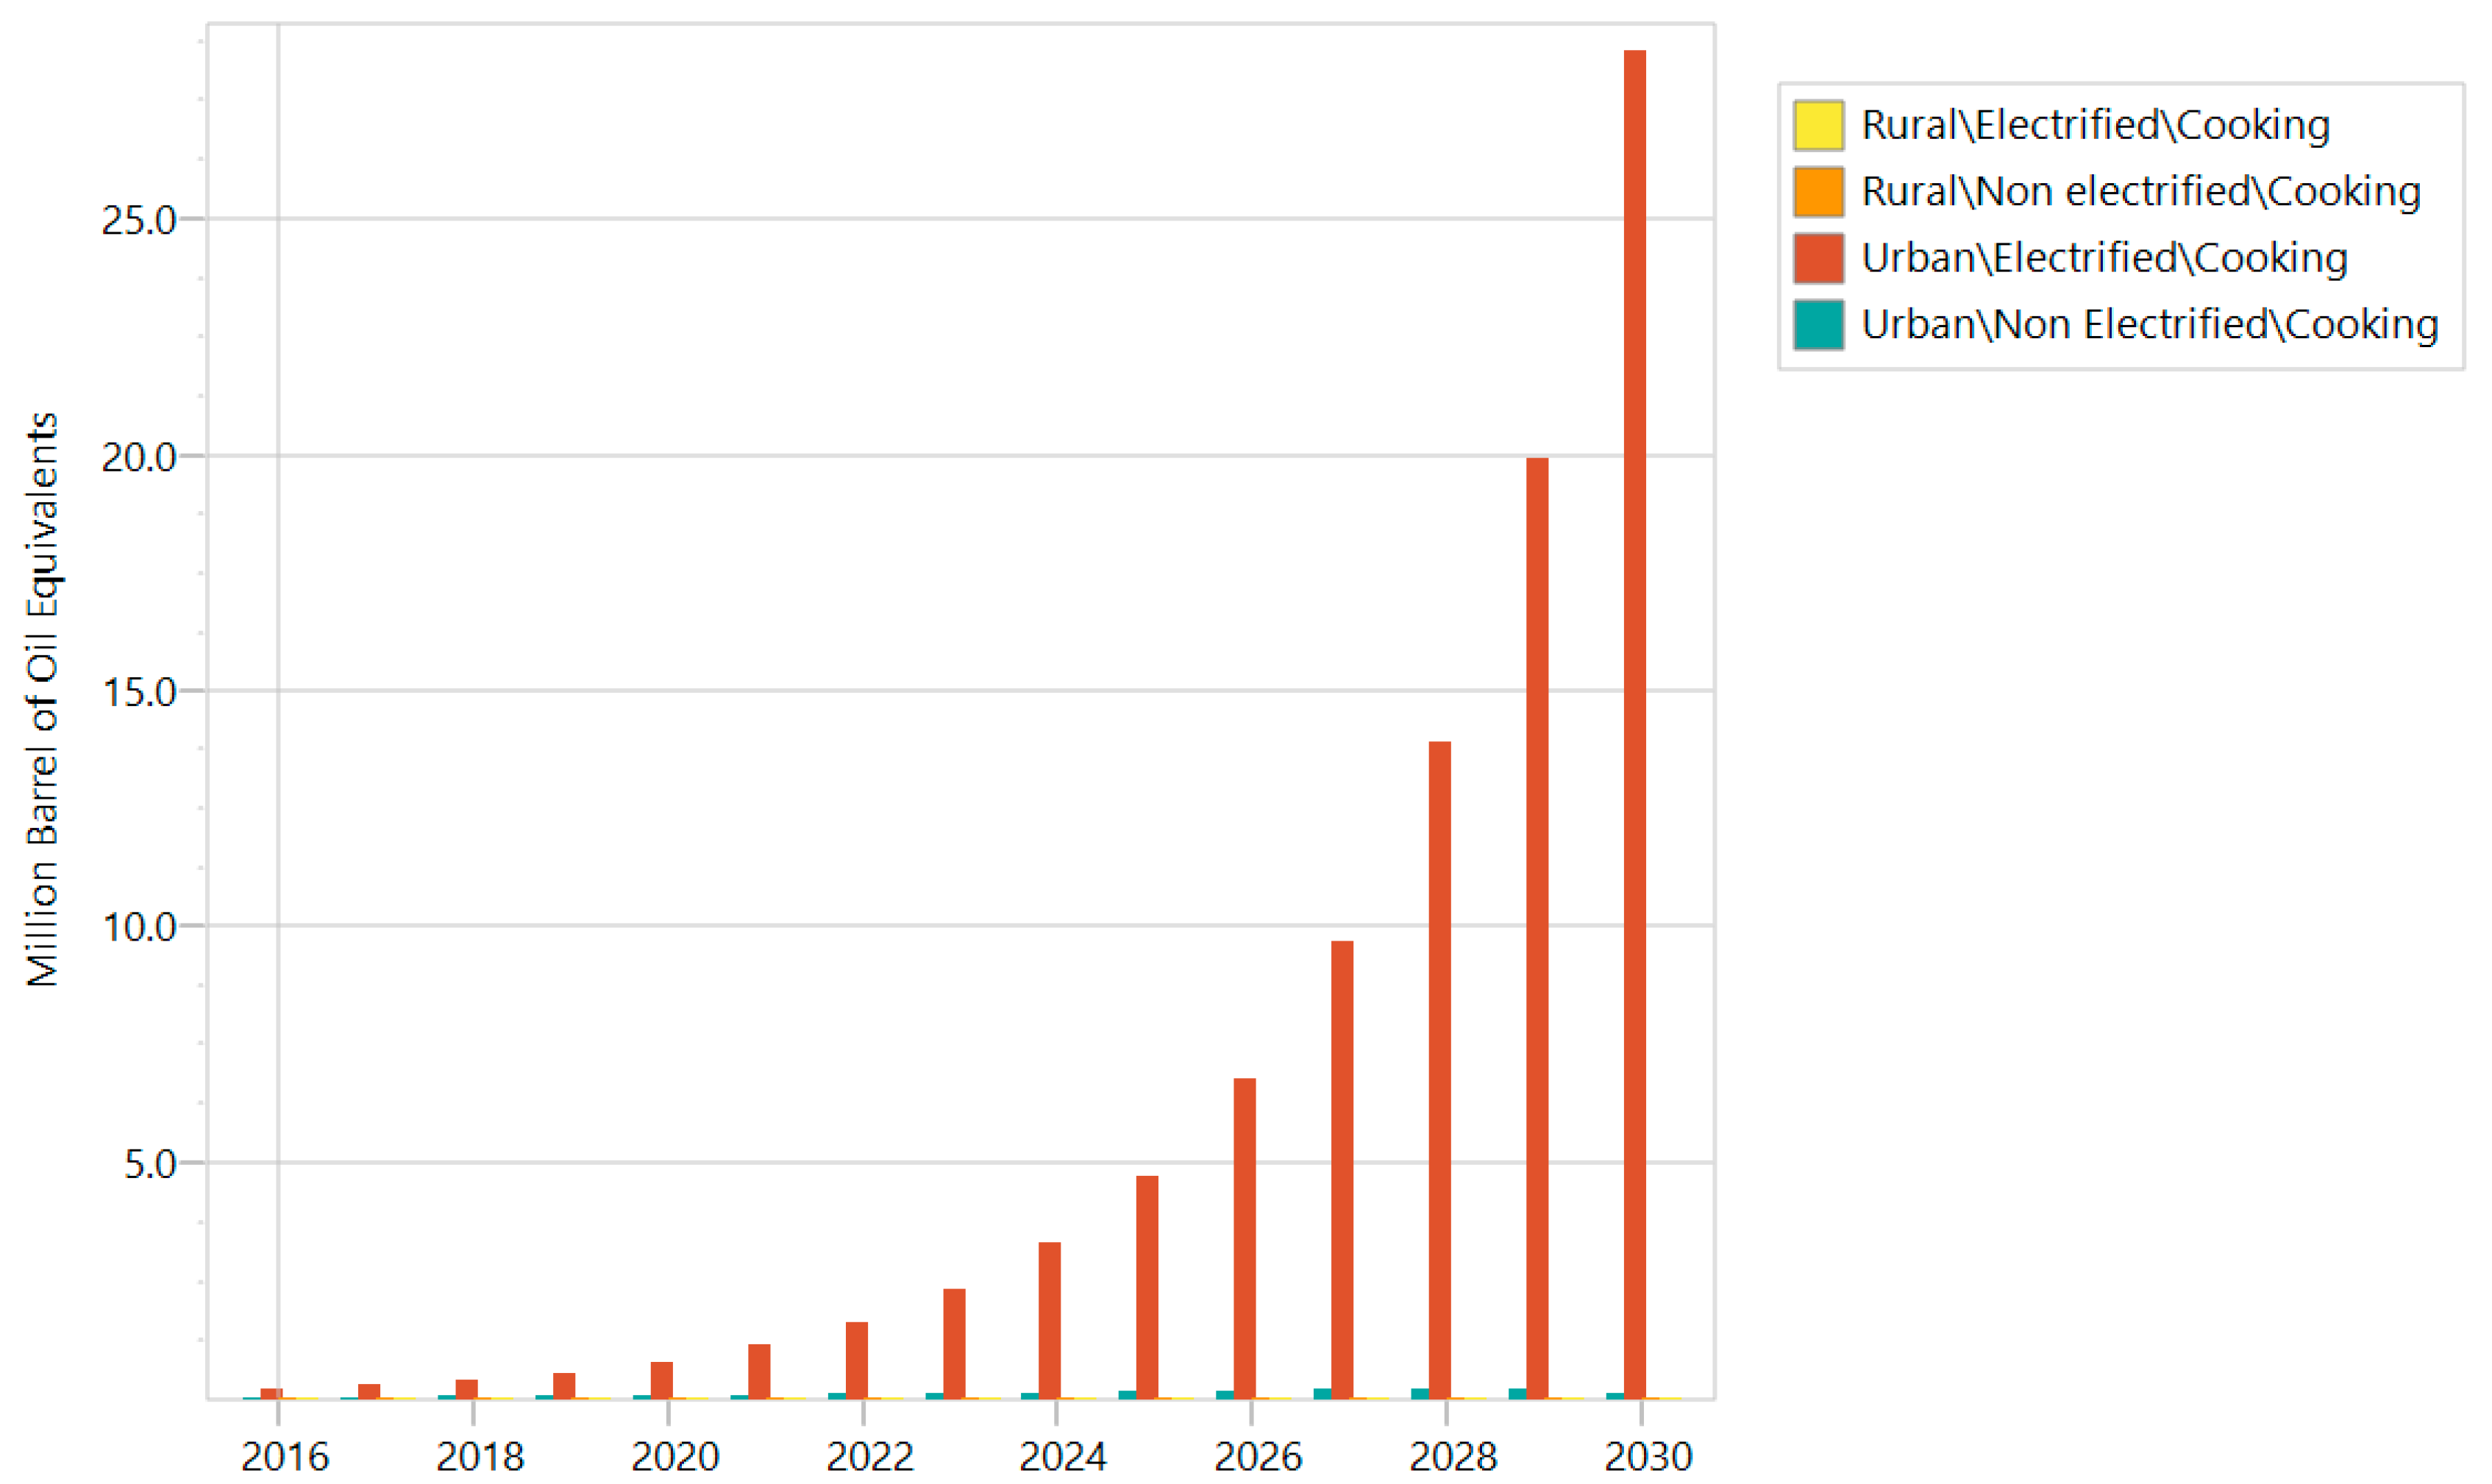
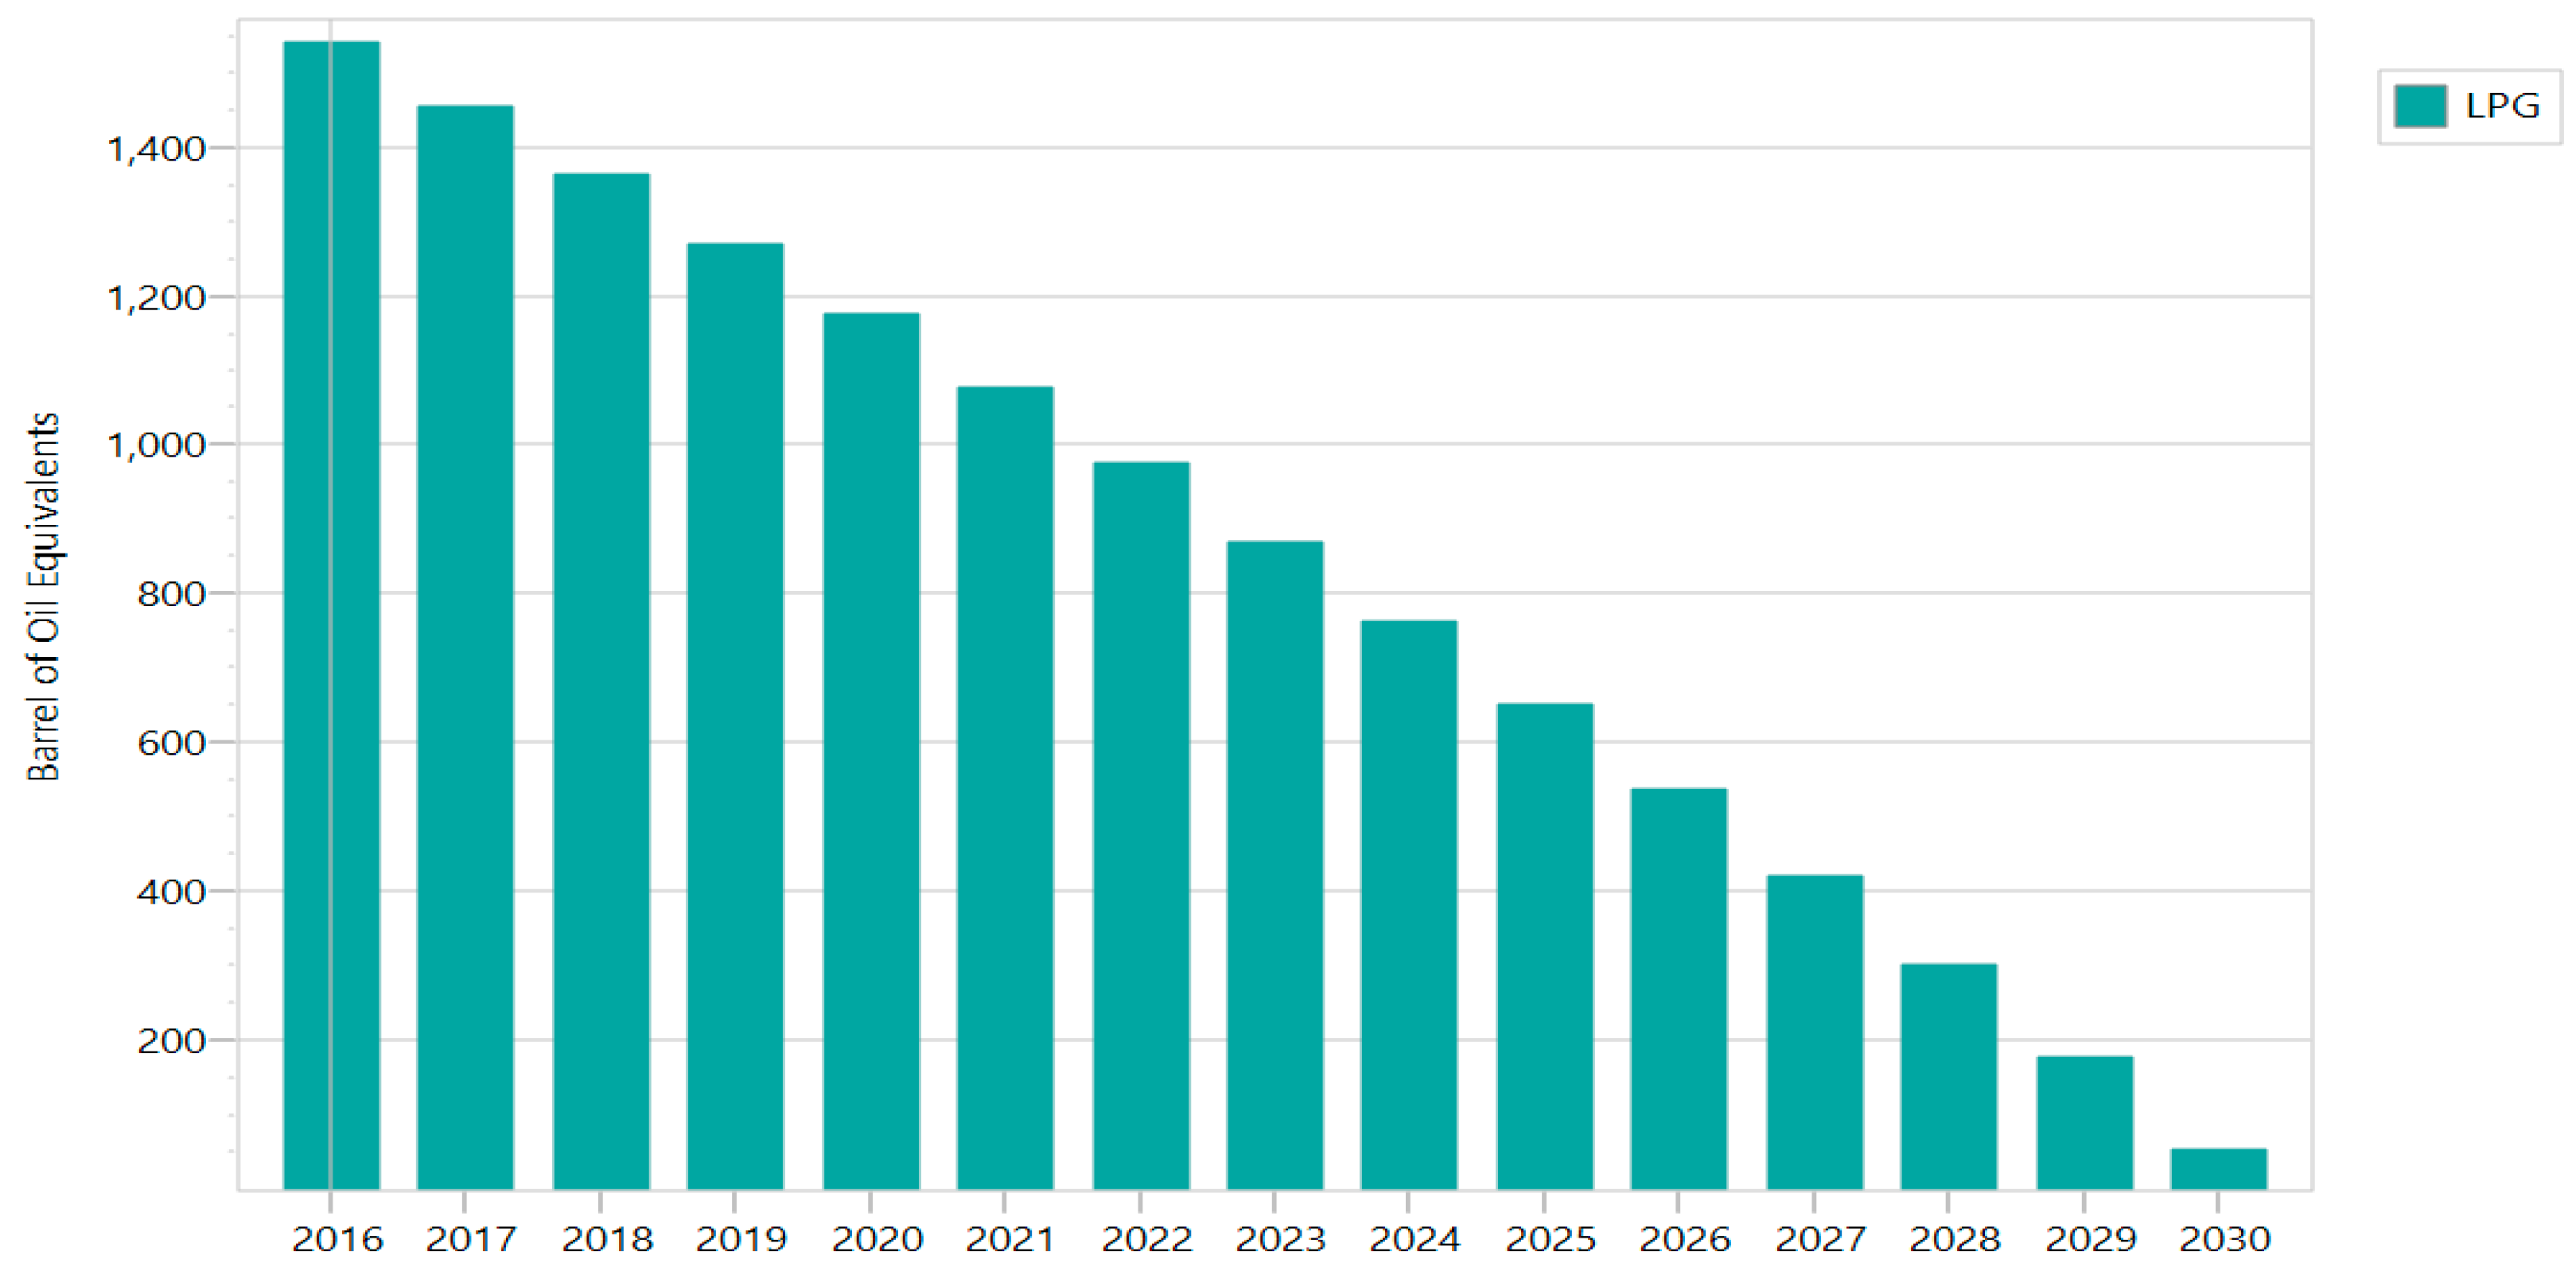
3.3. Introduction of Improved Stoves and LPG vs. BAU Scenario
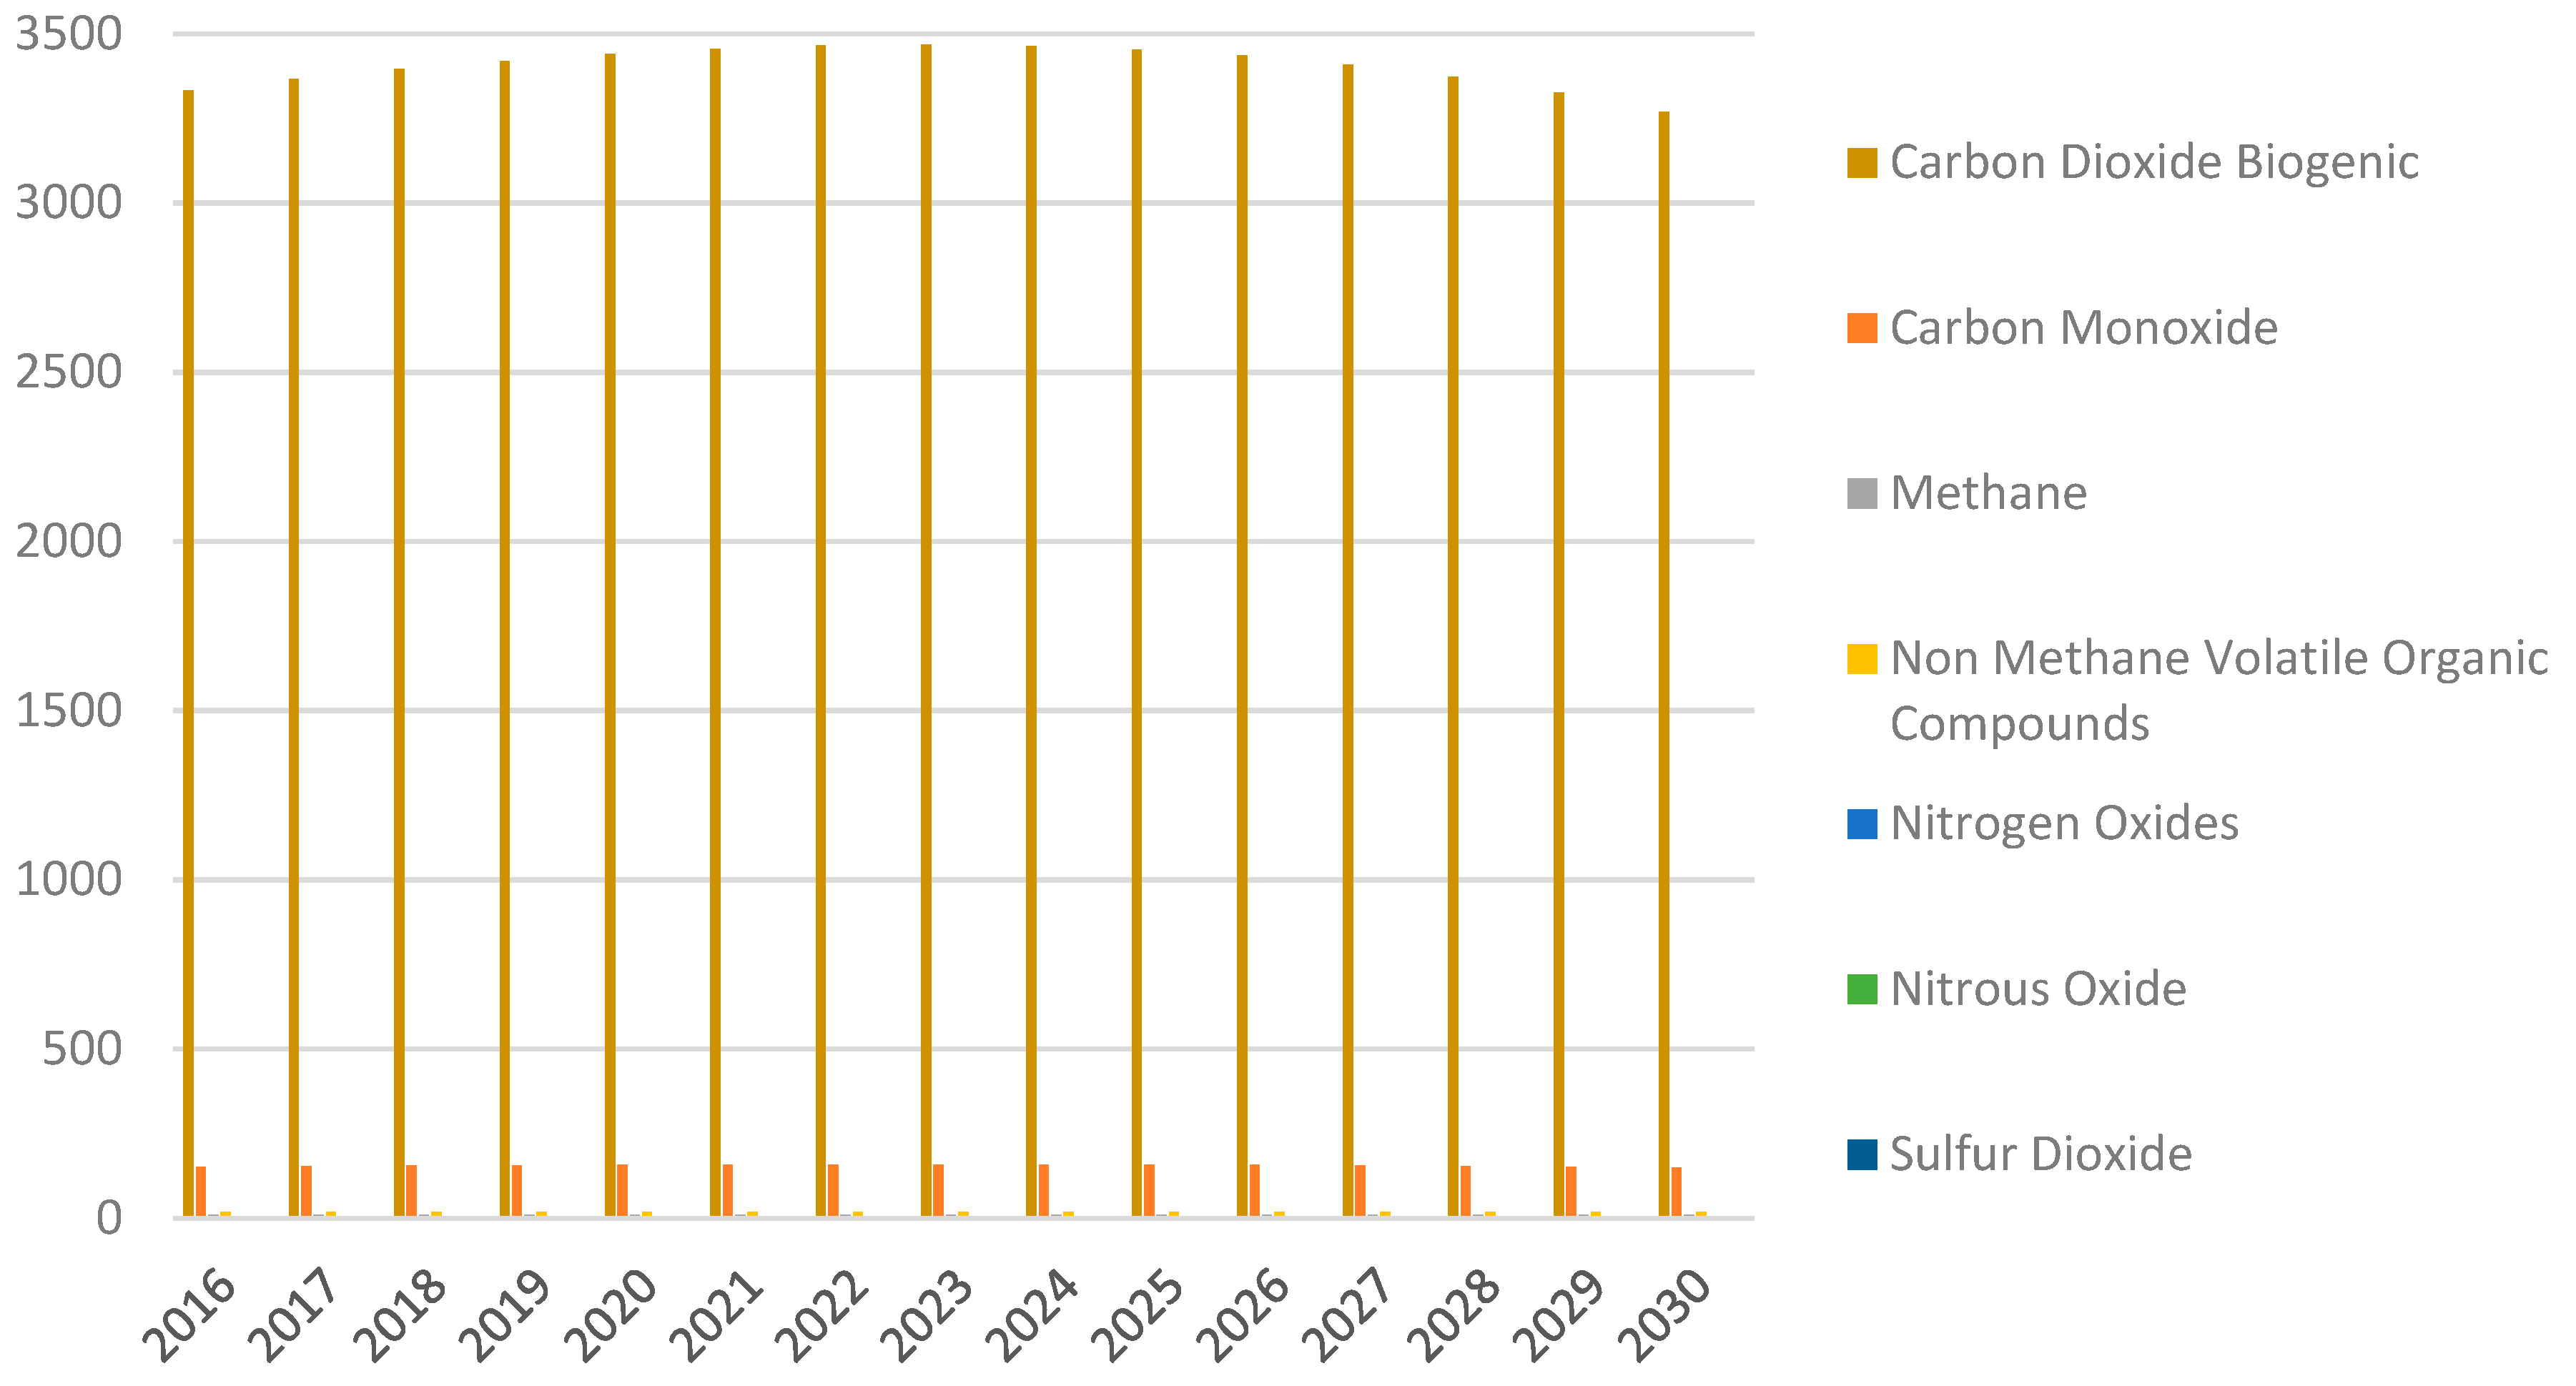
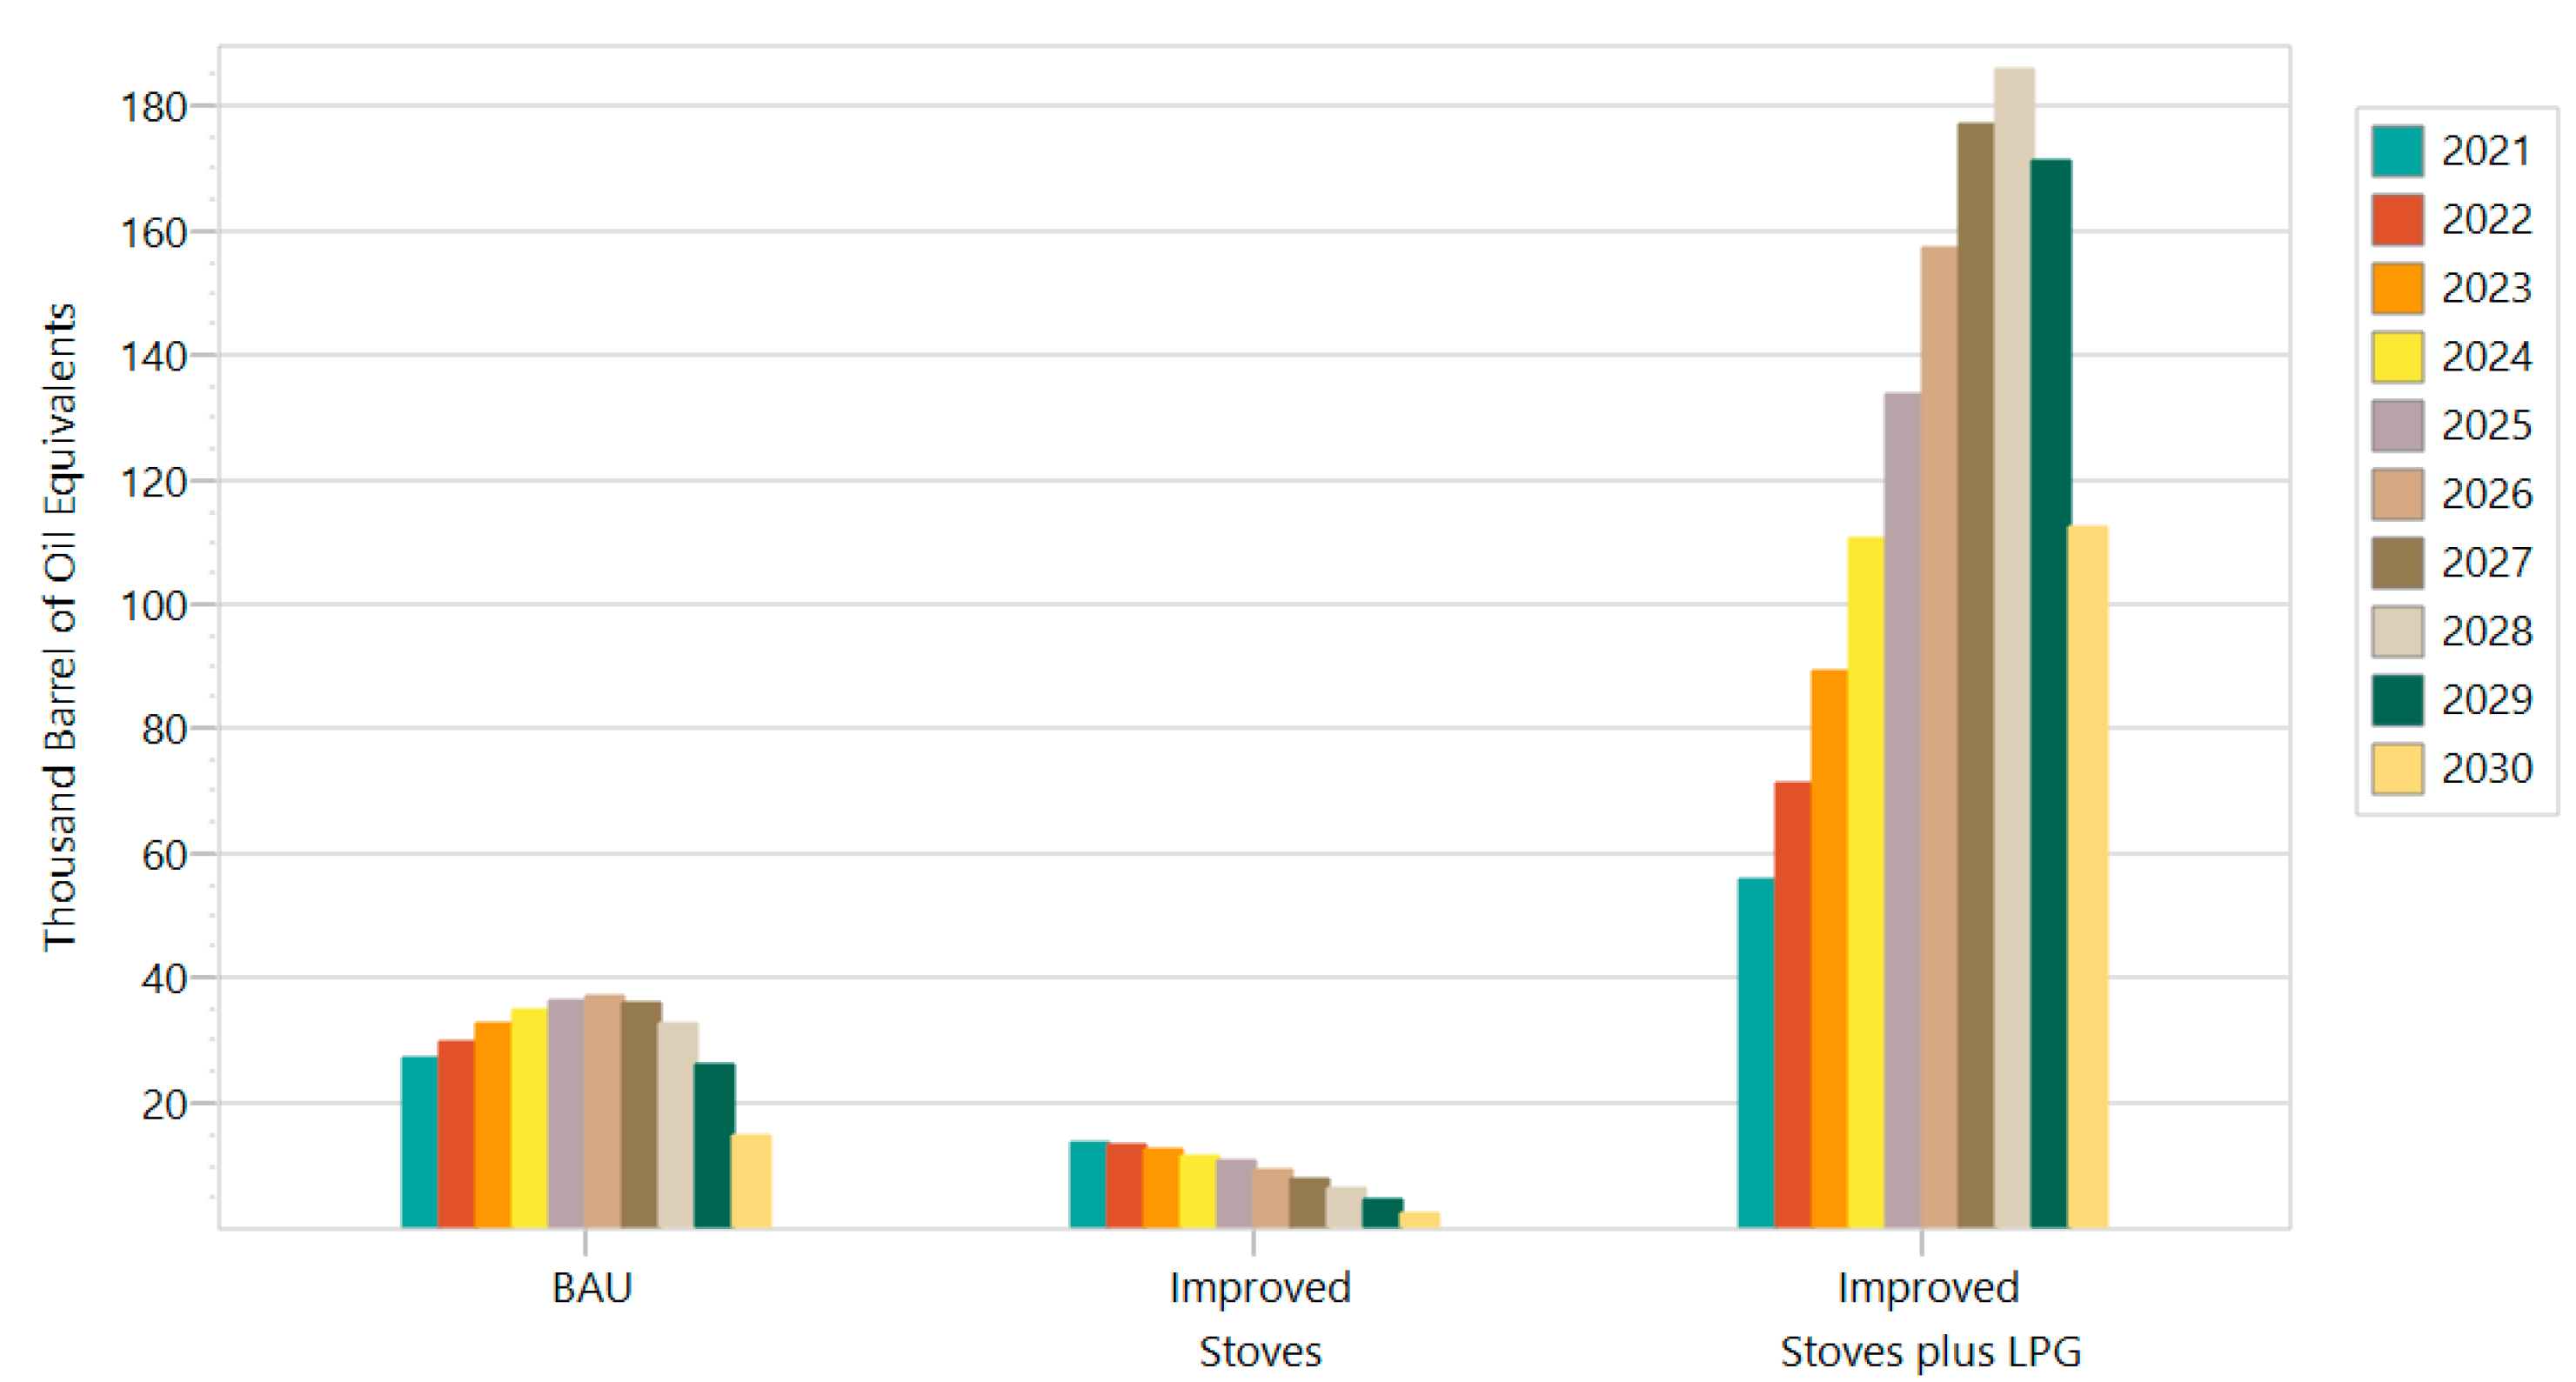
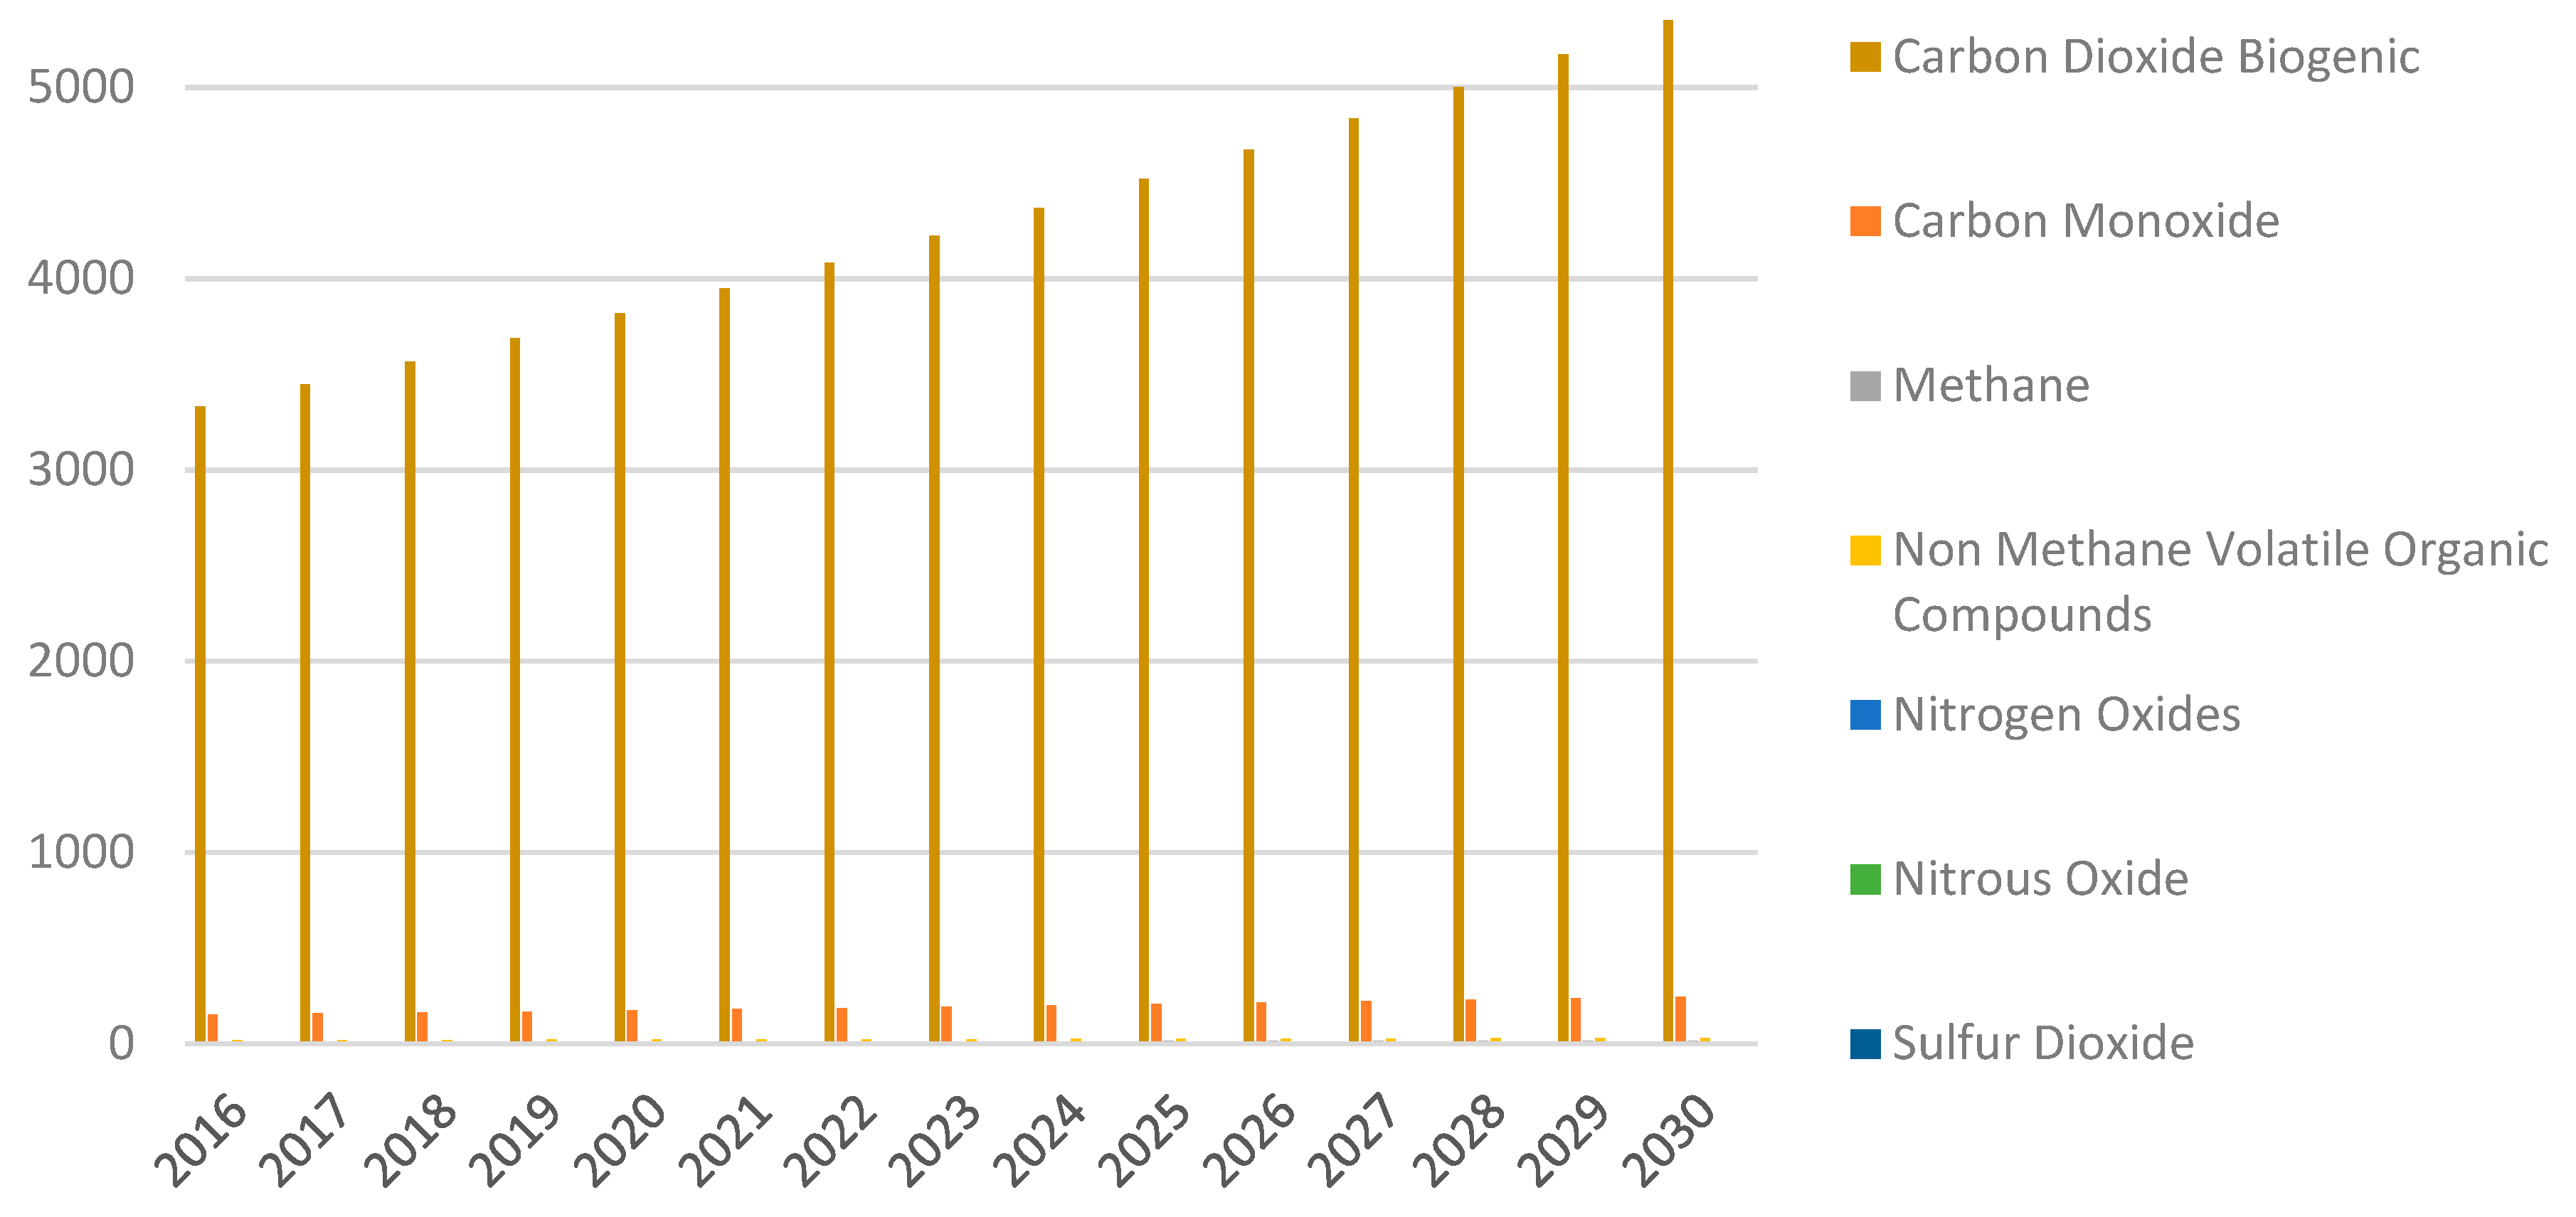
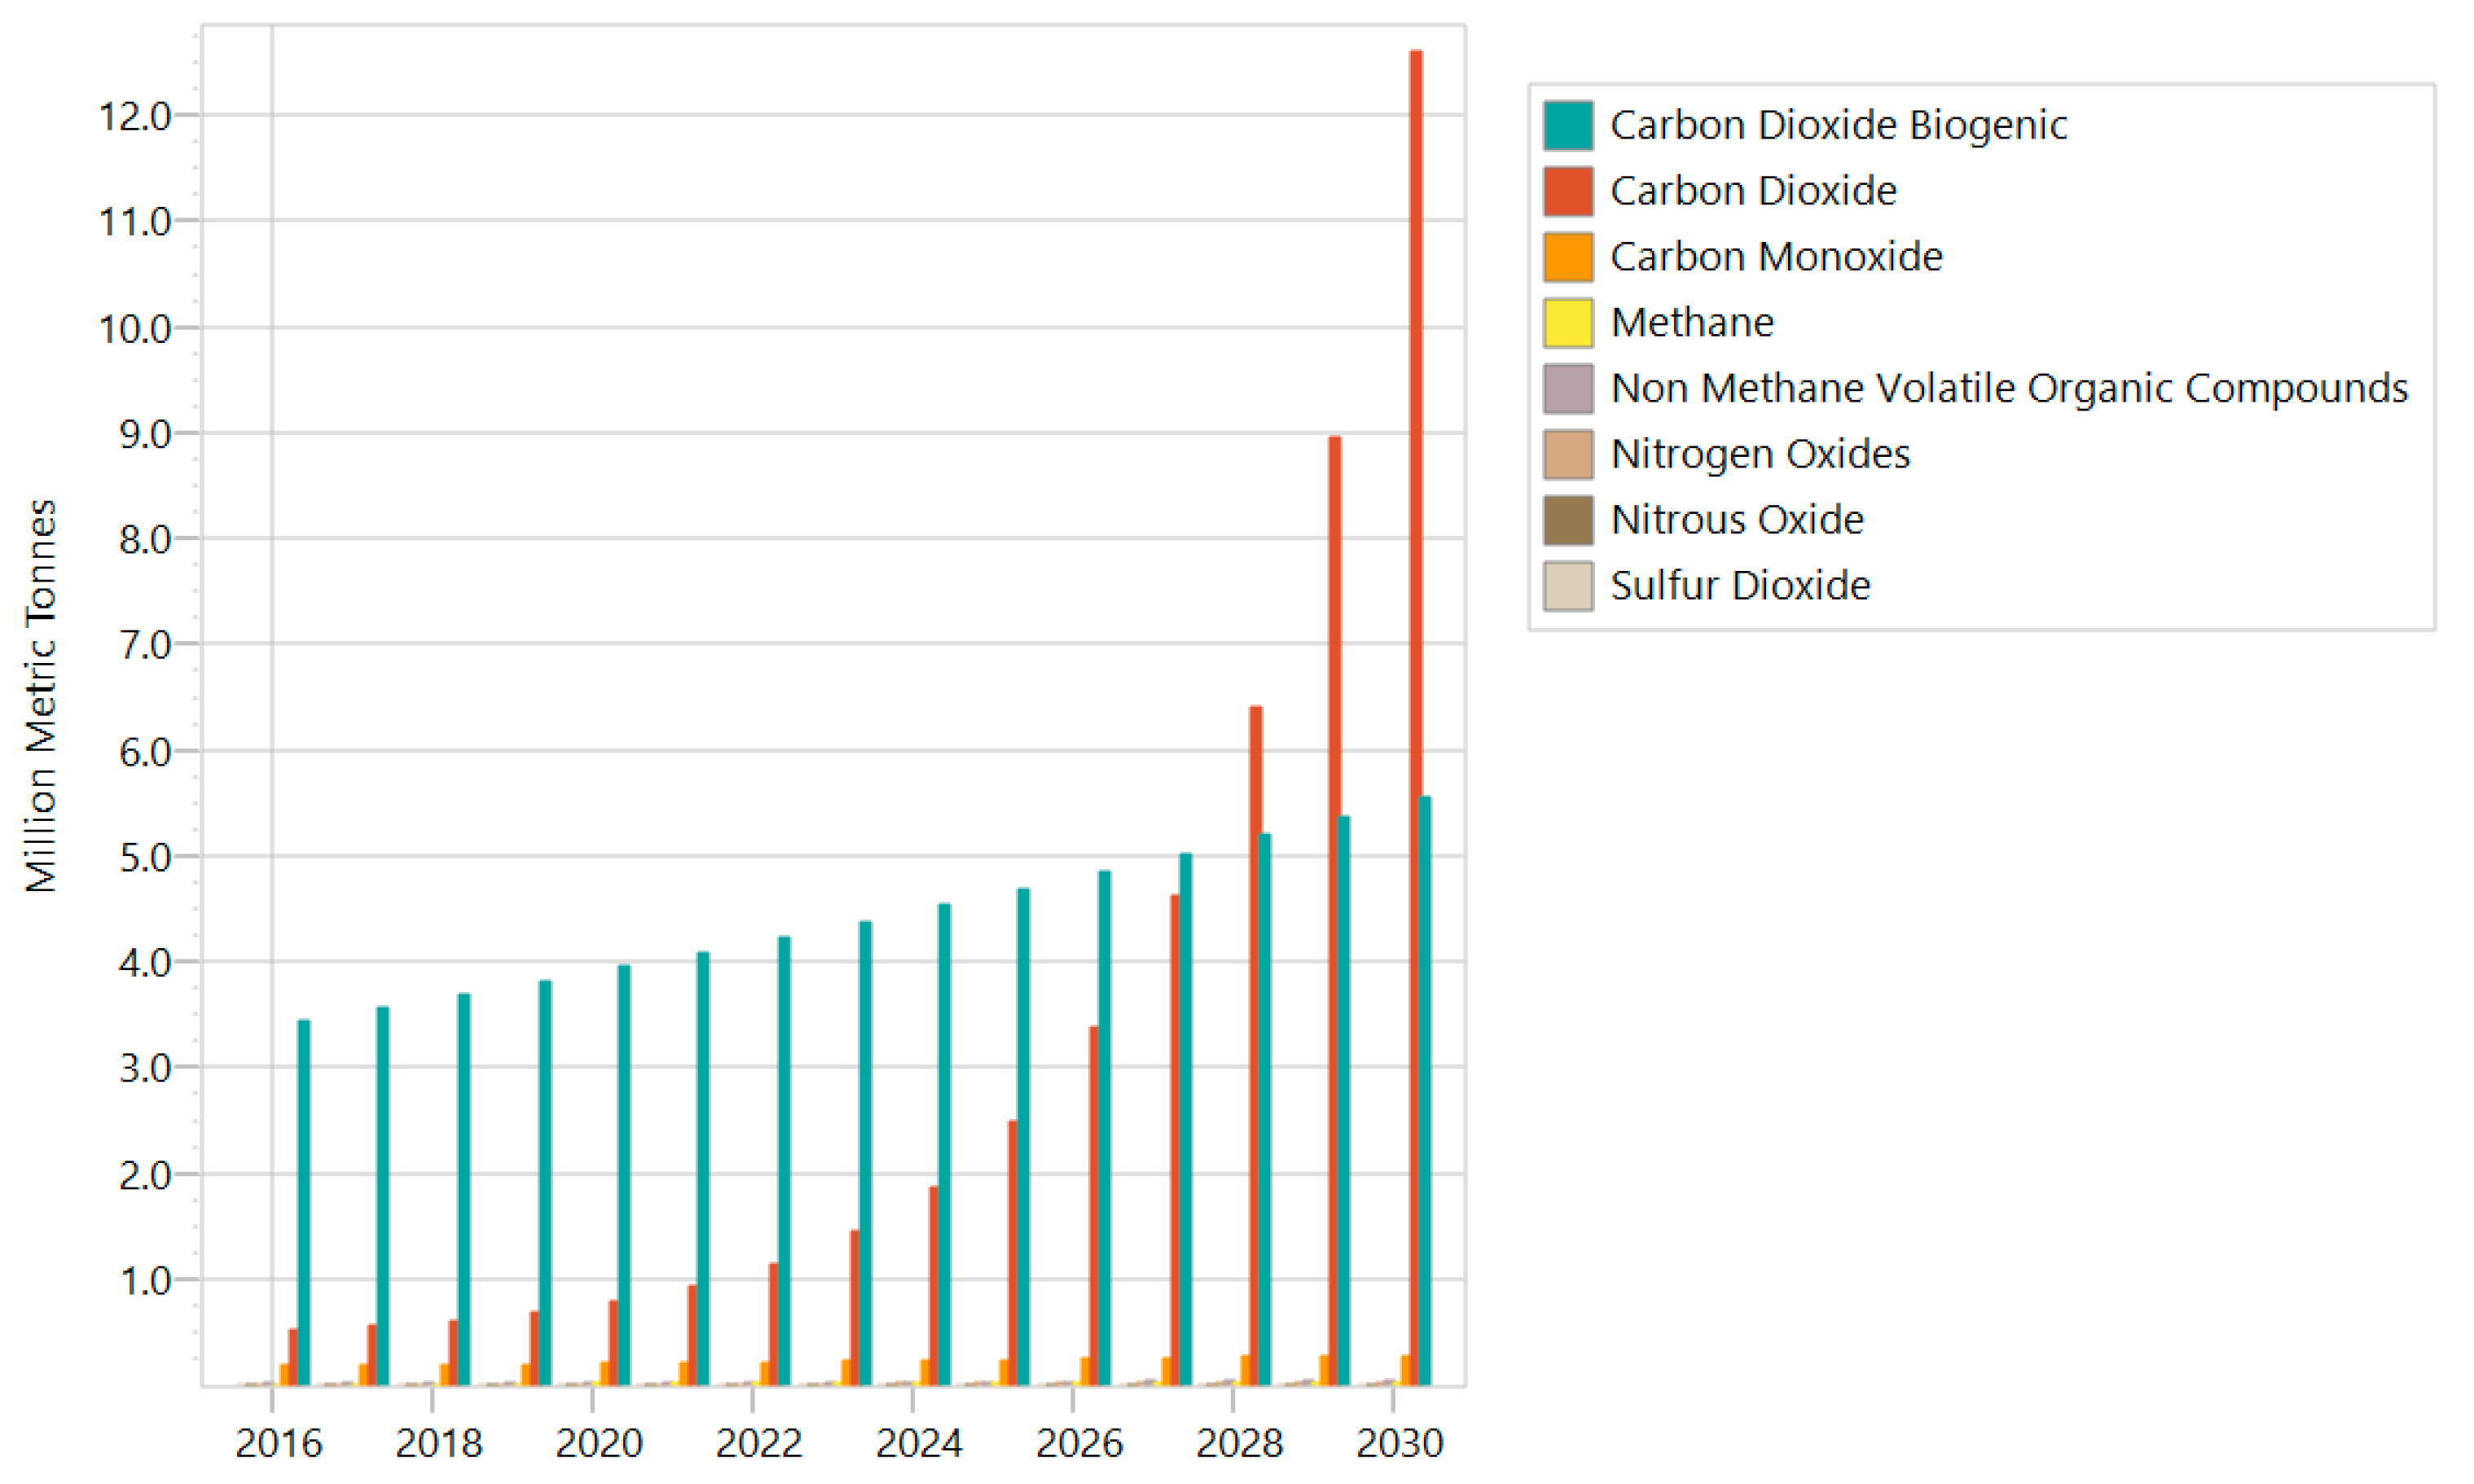
3.4. Environmental Burden for the Different Scenarios
3.5. Cost-Benefit of the Implementation of a Strategy for the Adoption of Improved Stoves in Honduras
4. Discussion: Towards a National Strategy for the Adoption of Improved Stoves
5. Conclusions and Policy Implications
- ○
- A strategy for the introduction of improved stoves benefits the energy sector, since the consumption of firewood would be reduced.
- ○
- Implementation of an improved stoves strategy would be cheaper than continuing with the current scenario.
- ○
- The cost of avoiding emissions is lower if an improved stove strategy is implemented, compared to continuing with the current scenario of improved stove delivery.
- It is necessary to have an institutional leader in order to obtain improved results.
- Funds used in these projects must be clearly audited.
- Rural cooperatives have shown good performances in the manufacture and distribution of improved stoves in Honduras.
- In order to create value in the manufacturing process, the manufacturer must be trained.
- Different universities and educational institutes must be involved to improve the research and development process.
Author Contributions
Funding
Acknowledgments
Conflicts of Interest
References
- INE, National Institute of Statistics (Honduras). Available online: https://www.ine.gob.hn (accessed on 14 February 2020).
- CESPAD. La Deforestación del Bosque en Honduras: Entre Tala Ilegal y una Endeble Institucionalidad. 2015. Available online: http://cespad.org.hn/wp-content/uploads/2017/06/Monitoreo-RRNN-oct-2.pdf (accessed on 14 February 2020).
- Jebaraj, S.; Srinivasa, P. High-Efficiency Solar Oven for Tropical Countries, ARPN. J. Eng. Appl. Sci. 2015, 10, 10213–10317. [Google Scholar]
- Flores, W.; Ojeda, O.; Flores, M.; Rivas, F. Sustainable energy policy in Honduras: Diagnosis and challenges. Energy Policy 2011, 39, 551–562. [Google Scholar] [CrossRef]
- Wilfredo, F.C. El Sector Energía de Honduras: Aspectos Necesarios Para su Comprensioón y Estudio; Library of U.S. Congress: Comayaguela, Honduras, 2016; ISBN 978-99926-52-78-7. Available online: https://lccn.loc.gov/2018407916 (accessed on 14 February 2020).
- García-Frapolli, E.; Schilmann, A.; Berrueta, V.; Riojas-Rodríguez, H.; Edwards, R.; Johnson, M.; Guevara-Sanginés, A.; Armendariz, C.; Masera, O. Beyond fuelwood savings: Valuing the economic benefits of introducing improved biomass cookstoves in the Purépecha region of Mexico. Ecol. Econ. 2010, 69, 2598–2605. [Google Scholar] [CrossRef]
- Pino, H.; Benjamin, B. Estudio del Impacto de la Exoneración del Impuesto Sobre Venta a las Estufas Mejoradas y el Impuesto de Importación a las Láminas y Otras Partes Importadas para la Fón de Estufas Mejoradas en Honduras; Voz para el Cambio, SNV: Tegucigalpa, Honduras, 2018. [Google Scholar]
- Heaps, C.G. Long-range Energy Alternatives Planning (LEAP) System; Software Version: 2018.1.27; Stockholm Environment Institute: Somerville, MA, USA, 2016. [Google Scholar]
- GDI. Promoting Sustainable Business Models for Clean Cookstoves Dissemination in Honduras, Global Delivery Initiative; GDI, 2018. Available online: https://globaldeliveryinitiative.org/sites/default/files/case-studies/cif-gdi-_honduras_case_study_-final.pdf (accessed on 20 December 2019).
- Ludeña, C.E.; Salomon, M.; Cocco, M.; Dannecker, C.; Grütter, J.; Zelaya, S. Identificación y priorización de Acciones Nacionales Apropiadas de Mitigación (NAMA) en los sectores de agricultura, transporte y eco-fogones en Honduras; Banco Interamericano de Desarrollo: Washington, DC, USA, 2015. [Google Scholar]
- OHN 97001:2017. Estufas Mejoradas—Requisitos y Métodos de Ensayo para la Clasificación y Categorización; OHN: Tegucigalpa, Honduras, 2017; Organismo Hondureño de Normalización. [Google Scholar]
- OLADE. Uso Racional y Sostenible de la Leña en los Países de SICA. 2013. Available online: http://www.olade.org/wp-content/uploads/2015/08/UsoLe%C3%B1a_OLADE-SICA-2013.pdf (accessed on 20 December 2019).
- Minister of Environment and Natural Resources of Mexico. Comparative Study of Improved Stoves to Sustain an Intervention Program Massive in Mexico. September 2009. Available online: https://www.cleancookingalliance.org/resources_files/estudio-comparativo-de.pdf (accessed on 29 December 2019).
- Hafner, J.; Magenau, H.; Uckert, G.; Sieber, S.; Graef, F.; König, H. Four years of sustainability impact assessments accompanying the implementation of improved cooking stoves in Tanzania. Environ. Impact Assess. Rev. 2020, 80, 221–236. [Google Scholar] [CrossRef]
- Adrianzén, M. Improved cooking stoves and firewood consumption: Quasi-experimental evidence from the Northern Peruvian Andes. Ecol. Econ. 2013, 89, 135–143. [Google Scholar] [CrossRef]
- Kedir, M.; Bekele, T.; Feleke, S. Problems of Mirt, and potentials of improved Gonzie and traditional open cook stoves in biomass consumption and end use emission in rural wooden houses of Southern Ethiopia. Sci. Afr. 2019, 3, e00064. [Google Scholar]


| No | Producer | Quantity of Improved Stoves | % of Share |
|---|---|---|---|
| 1 | Enviroeit (GoH) | 256,679 | 44.0 |
| 2 | Proyecto Mirador | 170,767 | 29.3 |
| 3 | Ahdesa | 50,000 | 8.6 |
| 4 | Fundeih (GoH) | 34,407 | 5.9 |
| 5 | EnDev/Focaep | 33,000 | 5.7 |
| 6 | Profogones | 11,346 | 1.9 |
| 7 | Proparque | 7404 | 1.3 |
| 8 | Ornader | 6030 | 1.0 |
| 9 | Funda Ahprocafe | 6000 | 1.0 |
| 10 | Gema/Usaid | 4270 | 0.7 |
| 11 | Acceso | 2240 | 0.4 |
| 12 | Clifor | 1152 | 0.2 |
| Total | 583,295 | 100 |
| Improved Stoves | LPG Plus Improved Stoves | |
|---|---|---|
| Demand | −1253.8 | 376.7 |
| Primary Energy | −844.3 | −185.9 |
| Secondary Energy | −409.5 | 562.6 |
| Net Present Value | −1253.8 | 376.7 |
| GHG Savings (Mill Tonnes CO2e) | 2.5 | −38.8 |
| Cost of Avoiding GHGs (U.S. Dollar/Tonne CO2e) | −496.7 |
© 2020 by the authors. Licensee MDPI, Basel, Switzerland. This article is an open access article distributed under the terms and conditions of the Creative Commons Attribution (CC BY) license (http://creativecommons.org/licenses/by/4.0/).
Share and Cite
Flores, W.C.; Bustamante, B.; Pino, H.N.; Al-Sumaiti, A.; Rivera, S. A National Strategy Proposal for Improved Cooking Stove Adoption in Honduras: Energy Consumption and Cost-Benefit Analysis. Energies 2020, 13, 921. https://doi.org/10.3390/en13040921
Flores WC, Bustamante B, Pino HN, Al-Sumaiti A, Rivera S. A National Strategy Proposal for Improved Cooking Stove Adoption in Honduras: Energy Consumption and Cost-Benefit Analysis. Energies. 2020; 13(4):921. https://doi.org/10.3390/en13040921
Chicago/Turabian StyleFlores, Wilfredo C., Benjamin Bustamante, Hugo N. Pino, Ameena Al-Sumaiti, and Sergio Rivera. 2020. "A National Strategy Proposal for Improved Cooking Stove Adoption in Honduras: Energy Consumption and Cost-Benefit Analysis" Energies 13, no. 4: 921. https://doi.org/10.3390/en13040921
APA StyleFlores, W. C., Bustamante, B., Pino, H. N., Al-Sumaiti, A., & Rivera, S. (2020). A National Strategy Proposal for Improved Cooking Stove Adoption in Honduras: Energy Consumption and Cost-Benefit Analysis. Energies, 13(4), 921. https://doi.org/10.3390/en13040921