Article

A Computer Vision Line-Tracking Algorithm for Automatic UAV Photovoltaic Plants Monitoring Applications

1
Politecnico di Milano, Dipartimento di Scienze e Tecnologie Aerospaziali, Via La Masa 34, 20156 Milano, Italy
2
Politecnico di Milano, Dipartimento di Energia, Via Lambruschini 4a, 20156 Milano, Italy
*
Author to whom correspondence should be addressed.
Energies 2020, 13(4), 838; https://doi.org/10.3390/en13040838
Submission received: 15 January 2020 / Revised: 6 February 2020 / Accepted: 7 February 2020 / Published: 14 February 2020
(This article belongs to the Special Issue Unmanned Aerial Vehicles for Energy Applications)

Abstract

:
In this paper, the authors propose an UAV-based automatic inspection method for photovoltaic plants analyzing and testing a vision-based guidance method developed to this purpose. The maintenance of PV plants represents a key aspect for the profitability in energy production and autonomous inspection of such systems is a promising technology especially for large utility-scale plants where manned techniques have significant limitations in terms of time, cost and performance. In this light, an ad hoc flight control solution is investigated to exploit available UAV sensor data to enhance flight monitoring capability and correct GNSS position errors with respect to final target needs. The proposed algorithm has been tested in a simulated environment with a software-in-the loop (SITL) approach to show its effectiveness and final comparison with state of the art solutions.

1. Introduction

In the last few years, the PV sector has witnessed a very rapid increase in its production rate with the complicity of economic incentives offered by many countries and a general market attention toward renewable energy sources.
Maintenance represents nowadays a key aspect for PV plants profitability: in fact, many studies have shown that a very large number of PV modules present damages. In [1], it has been shown that in some critical plants the impact of failures can even reach the 80% of the total installed modules. Among all the possible failures of PV modules, the superficial ones are the most common [2]. Some studies have been calculated that the impact of defects on PV modules can increase the levelized cost of energy of around 5% [3].
One of the first tests that has been introduced for detecting the defects is the visual inspection: it can detect several defects, from delamination, to cell corrosion, from glass breakage, to the snail trails phenomenon [4]. The visual inspection performed by an expert is very effective in detecting defects. During the inspection it is possible to perform other analysis on the modules, for example, the detection of backsheet damages, but it generally requires a lot of time. Due to this reason, this technique is suitable for small–medium size ground plants, whereas for large scale ground plants, or for rooftop plants, it is almost unsuitable.
A very accurate defect identification technique is the electroluminescence test: it is performed in the laboratory, but it is able to easily detect the defects [5].
Another possible technique for failure identification on PV plants is the analysis of the power output data. This method is very simple because it can be performed with the standard remote sensing data that are almost always acquired by inverters. On the other hand, this method has two main disadvantages: for detecting the defectiveness rate it is required to have a reference power production, and it is not able to detect the position of the defects inside the plant [6].
For improving the inspection for large-scale plants or even more rooftop plants, Unmanned Aerial Vehicles (UAV) technology has been proposed. The main advantage of this technique is the very low time required in the acquisition, but it creates a large amount of raw data that should be processed [7].
Adopting this technology, it is possible to easily acquire two main different kinds of information that can be exploited together for performing a proper inspection: The first type of information is the picture of the module in the visible spectrum of the light, and the second one is the infrared imagery. This last information is widely adopted to diagnose faults in PV modules because it can detect in a easy way a wider range of defects [8].
The images acquired from the UAV can be processed both by an expert user or by computational techniques for the image postprocessing [9]. This last type of analysis is very promising because it is able to process a large amount of data in a fast and effective way to keep the entire process competitive. The analysis of the big data acquired by the UAV can be carried out in several ways: The most advanced techniques regards the analysis of the healthy status of each module: this analysis has been performed exploiting deterministic algorithms [10] or artificial intelligence techniques such as deep learning [11].
In the automated image processing techniques there are two very important aspects that should be taken into account. First, for large PV plants the access to the final information can be very hard and, thus, can slow down the overall maintenance operations. For overcoming this problem, advanced processing methods have been introduced to automatically index the information in a database of the PV plant and for providing a better user interface [12].
Second, the UAV flight must be clearly compliant with the requirements in terms of accuracy and resolution of the post processing phase. In particular, the images should be properly oriented and acquired in a predefined altitude range. The flight control system of the UAV should allow the acquisition of accurate pictures in visual and thermal spectrum, in a repeatable and effective way.
The required resolution for the postprocessing is a key factor for designing a correct flight plan: to achieve the resolution required for detecting defects, a proper trade-off between flight altitude and UAV sensor accuracy is needed [13,14]. Typically, a low flight height is preferred, giving problems in management of the UAV path planning.
The objective of this paper is to develop a real-time correction technique for the flight path of a multirotor UAV for PV plants inspections using information coming from additional sensors. In particular, cameras are particularly suitable for this kind of operations. Thus, a vision-based guidance law has been developed and tested in an appropriate simulation environment. Preliminary results regarding a possible tuning and the performance of the algorithm over a single straight line have been presented in [15]. In particular, the vision algorithm has shown capable of reconstructing the distance between the line and the UAV with a mean error of 5 cm.
In the literature, the problem of controlling a vehicle, or, in general, a robot using feedback information coming from a vision sensor, is referred to as visual servoing [16]. In particular, referring to on-board visual systems there are two ways to implement vision-feedback robot control: the dynamic look-and-move system and the direct visual servo system.
The dynamic look-and-move system performs vision-feedback control of robot manipulation in a hierarchical manner. The higher-level vision system provides a desired pose reference input to a lower-level robot controller which then uses feedback from the joints to internally stabilize the robot [17].
In direct visual servo control systems, instead, a visual controller replaces the robot controller and directly computes inputs to the robot joints. In UAVs, a direct visual servoing problem concerning the tracking of power lines has been faced in [18]. A similar solution for the tracking of linear features has been also proposed in [19]. In [20,21], similar works have been conducted on fixed-wing UAV for alignment with ground runway lines for landing.
Note that direct visual servoing approach requires an ad hoc design of the control law and, consequently, it is not compatible with pre-existing flight control software. In contrast, this work aims to develop a general law which could be implemented on different platforms. In this context, indirect visual servoing (dynamic look-and-move system) could represent a suitable solution. The idea would be the one of using the high-level vision information to provide a desired modification in the position reference to the flight control software available on the platform.
To the best of the author’s knowledge, this kind of approach (and UAV visual servoing more in general) has never been used on photovoltaic plants.
The work presented here is a very important step toward autonomous flight and, thus, opens up a scenario of complete autonomous monitoring techniques for energy plants.
The paper is structured as follows. In Section 2, the motivations behind this work are discussed, whereas in Section 3 the proposed solution is presented and analyzed. In Section 4, the case study and the simulation environment are presented and in Section 5 the results are shown and analyzed. Finally, in Section 6, some conclusions are drawn.

2. Motivations

UAV flight control for plant inspection can be carried out in two different ways: manually or in a fully automatic way. In the former, the commands to the UAV are provided by an operator through a radio controller, whereas in the latter, they are inserted in the form of waypoints on a georeferenced map (Figure 1) and tracked by the UAV exploiting the Global Navigation Satellite Systems (GNSS).
However, in this case, no guarantee that the drone will actually fly over the PV panels exists. First of all, the waypoints can be misplaced by the operator and/or not exactly corresponding to the desired location due to possible incorrect georeferencing of the map in which the waypoint itself is positioned. Note that georeferenced maps obtained from satellite imagery, e.g., Google Earth, widely used in this framework, are not a complete reliable source of information. Researches in the literature have shown that the error in planimetric coordinates (North, East), between objects as captured in Google Earth and obtained from a base map produced by ground surveying techniques, ranges from 5 [22] to 10 m [23] and even more [24,25], depending, among many factors, on the geographic location. The accuracy of measured distances in Google Earth is considerably better than the accuracy of measured individual coordinates, but, in any case, an error of 2 or more meters can be expected [26].
Second, the intrinsic inaccuracy of the received GNSS signal can lead to poor performance in the estimation of the UAV position, leading to tracking errors and consequent degradations in the inspection performance. The GNSS error sources could be many, ranging from ionospheric and tropospheric delays, clock-related and satellites’ orbit-related errors, multipath errors, and the receiver noise itself [27]. In particular, the GNSS receivers embedded on a professional UAV have been tested in [28], highlighting a 1 to 2 m and 4 m accuracy, respectively, on the horizontal and vertical position. Note that this result provides some indications about the magnitude of the error, but it cannot be generalized as it depends on the hardware used, satellite coverage, and geographic position.
The aim of an inspection procedure is gathering data from which it is possible to obtain information on the health status of each module. This information is usually captured through infrared (IR) and visible images. From the images, the most important defects which affect the performance of the module and of the power plant are recognized. In the context of UAVs for aerial inspection, the ground resolution of the images is of paramount importance. In [29], an overview of the required ground resolution for many of the most common defects is provided. From the type of defect, the required ground resolution is established (the number of pixels for each c m 2 of ground). More precisely, the resolution is influenced both by the cruise altitude of the UAV by the resolution of the camera as highlighted in Equation (1),
R g r o u n d = R p h o t o H · f d p i c t u r e ,
where R g r o u n d is the ground resolution and its function of the cruise altitude H, and for the camera data: the picture resolution R p h o t o , the focal distance f, and the picture distance d p i c t u r e .
For identification of some defects, especially in the visible spectrum, a high sample ground resolution is usually required. Table 1 shows the ground resolution required by some defects after a large trial campaign: it is possible to see that snail trail is the most critical defect that can be identified.
This means a lower cruise altitude and, thus, a small number of PV modules contained in each picture. Consequently, a small positioning error of the UAV can lead to captured images which contain only part of the PV row to be inspected. Thus, an accurate flight control performance is required to have a satisfactory inspection outcome, therefore there exists a need of the proposed algorithm for the enhancement of automatic flight.
Having a correct and repeatable acquisition of images is particularly useful when automatic systems for image analysis are employed (as can be the case when a large amount of information is captured, as in the case of UAV inspection and monitoring applications).

3. Proposed Solution

A conventional position control loop for a multirotor UAV can be described using the block diagram in Figure 2, where x is the position, x 0 the corresponding set-point and transfer functions G x ( s ) and R x ( s ) represent, respectively, the position dynamics and the position controller.
If, as is common practice, position control is implemented using GNSS, then the feedback system will be affected by the measurement noise n G N S S . The set-point x 0 can be either generated directly by a pilot or may correspond to a sequence of waypoints defined on a Ground Control Station (GCS) at the beginning of the mission. In the latter case, however, an additional error term has to be taken into account, namely, the error in the positioning of the waypoints, which for example may be due to limitations of the GCS interface or inaccurate georeferencing of the plant map to be inspected. In such a case, a more realistic representation of the control system, see Figure 3, should be taken into account where the actual set-point received by the control system (denoted as x ˜ 0 ) will be the intended set-point x 0 (the coordinate of the PV row to inspect) plus an error term n M A P .
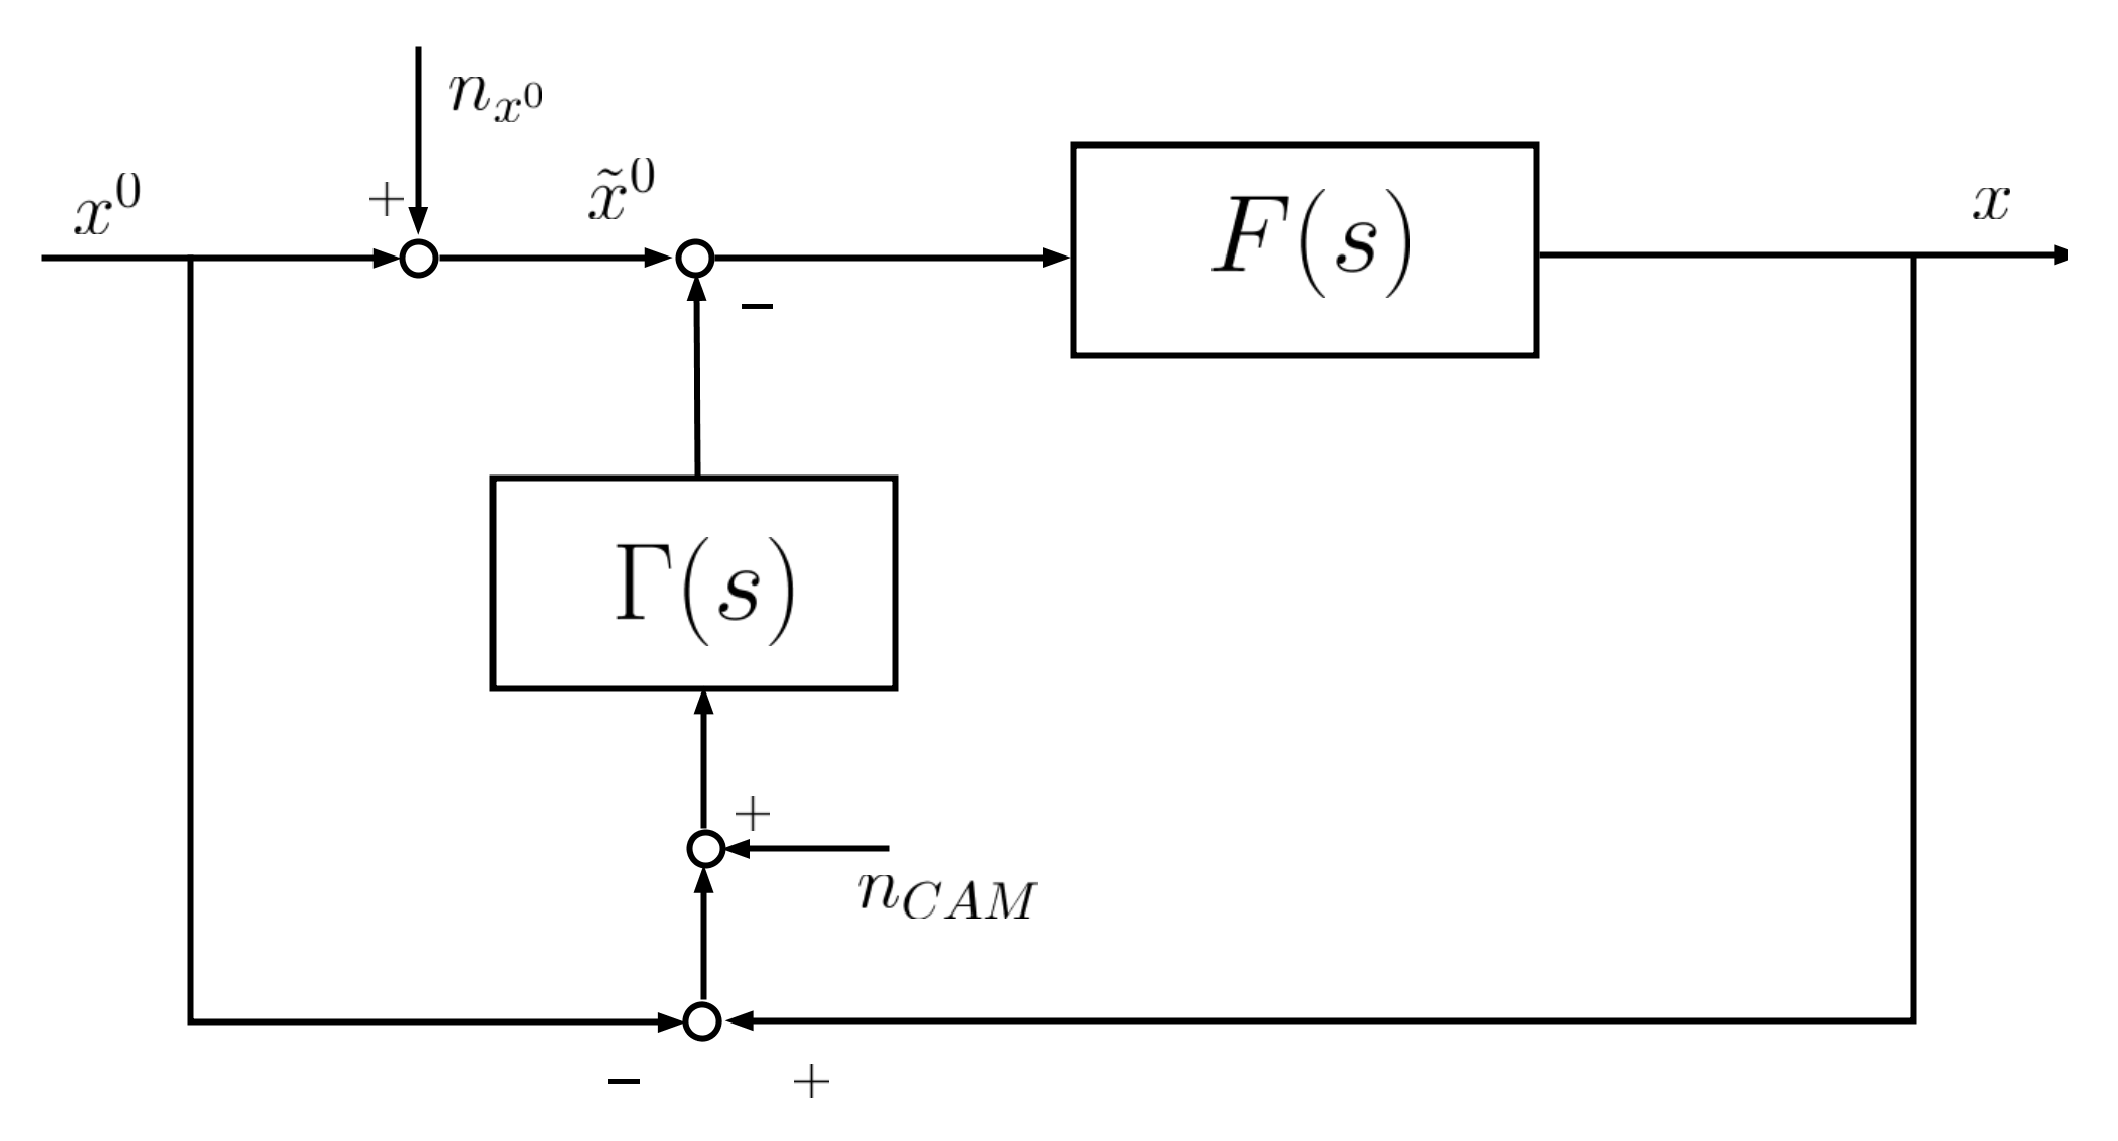
This block diagram is interesting as it shows clearly that the effect of GNSS measurement error and the effect of inaccurate set-point computation enter the control system at the same point, so that letting
F ( s ) = R x ( s ) G x ( s ) 1 + R x ( s ) G x ( s ) ,
the complementary sensitivity of the position control system, the block diagram can be equivalently represented as in Figure 4, where n x 0 represents the simultaneous effect of all the error terms.
The proposed solution is based on the assumption that additional sensors can return a (moderately) noisy measurement of x x 0 . In such a case, the problem under study will become the one of exploiting this information to compensate the effect of n x 0 on the performance of the control system. In particular, a compensator with transfer function Γ ( s ) is designed and properly tuned to take as input the measurement of x x 0 , characterized by a noise term n C A M , and to give as output the needed quantity to cancel out the term n x 0 , as represented in Figure 5.
Note that directly an ad hoc designed UAV position controller could be used to accomplish this aim. The reason behind the choice of having a dedicated compensator operating on top of the UAV’s position control loop with respect to the flight controller (represented in the block diagram with the transfer F ( s ) function) resides in the fact that the same concept can be applied to different platforms and control units.
Among the different sensors, cameras are particularly promising as they are already available on a typical UAV involved in this kind of inspections without additional equipment costs. Consequently, this will not lead to an overall increase in the payload of the vehicle. Through the use of appropriate techniques, images allow the extraction of useful information about the relative position and orientation between the PV row and the UAV itself.
In the computer vision literature, several possibilities to extract and analyze features exist. In particular, feature descriptors algorithms like Scale Invariant Feature Transform (SIFT) [30], Speeded Up Robust Features (SURF) [31], Histogram of Oriented Gradients (HOG) [32], and Local Binary Patterns (LBP) have been used in a wide range of applications, including face recognition [33], speech resampling [34], and cancer detection [35]. However, for the application object of this paper, since the shape to be searched in the image is known a priori and very simple, i.e., a line, the extraction process can be divided into an edge detection and a simple line detection algorithm.

3.1. Edge Detection

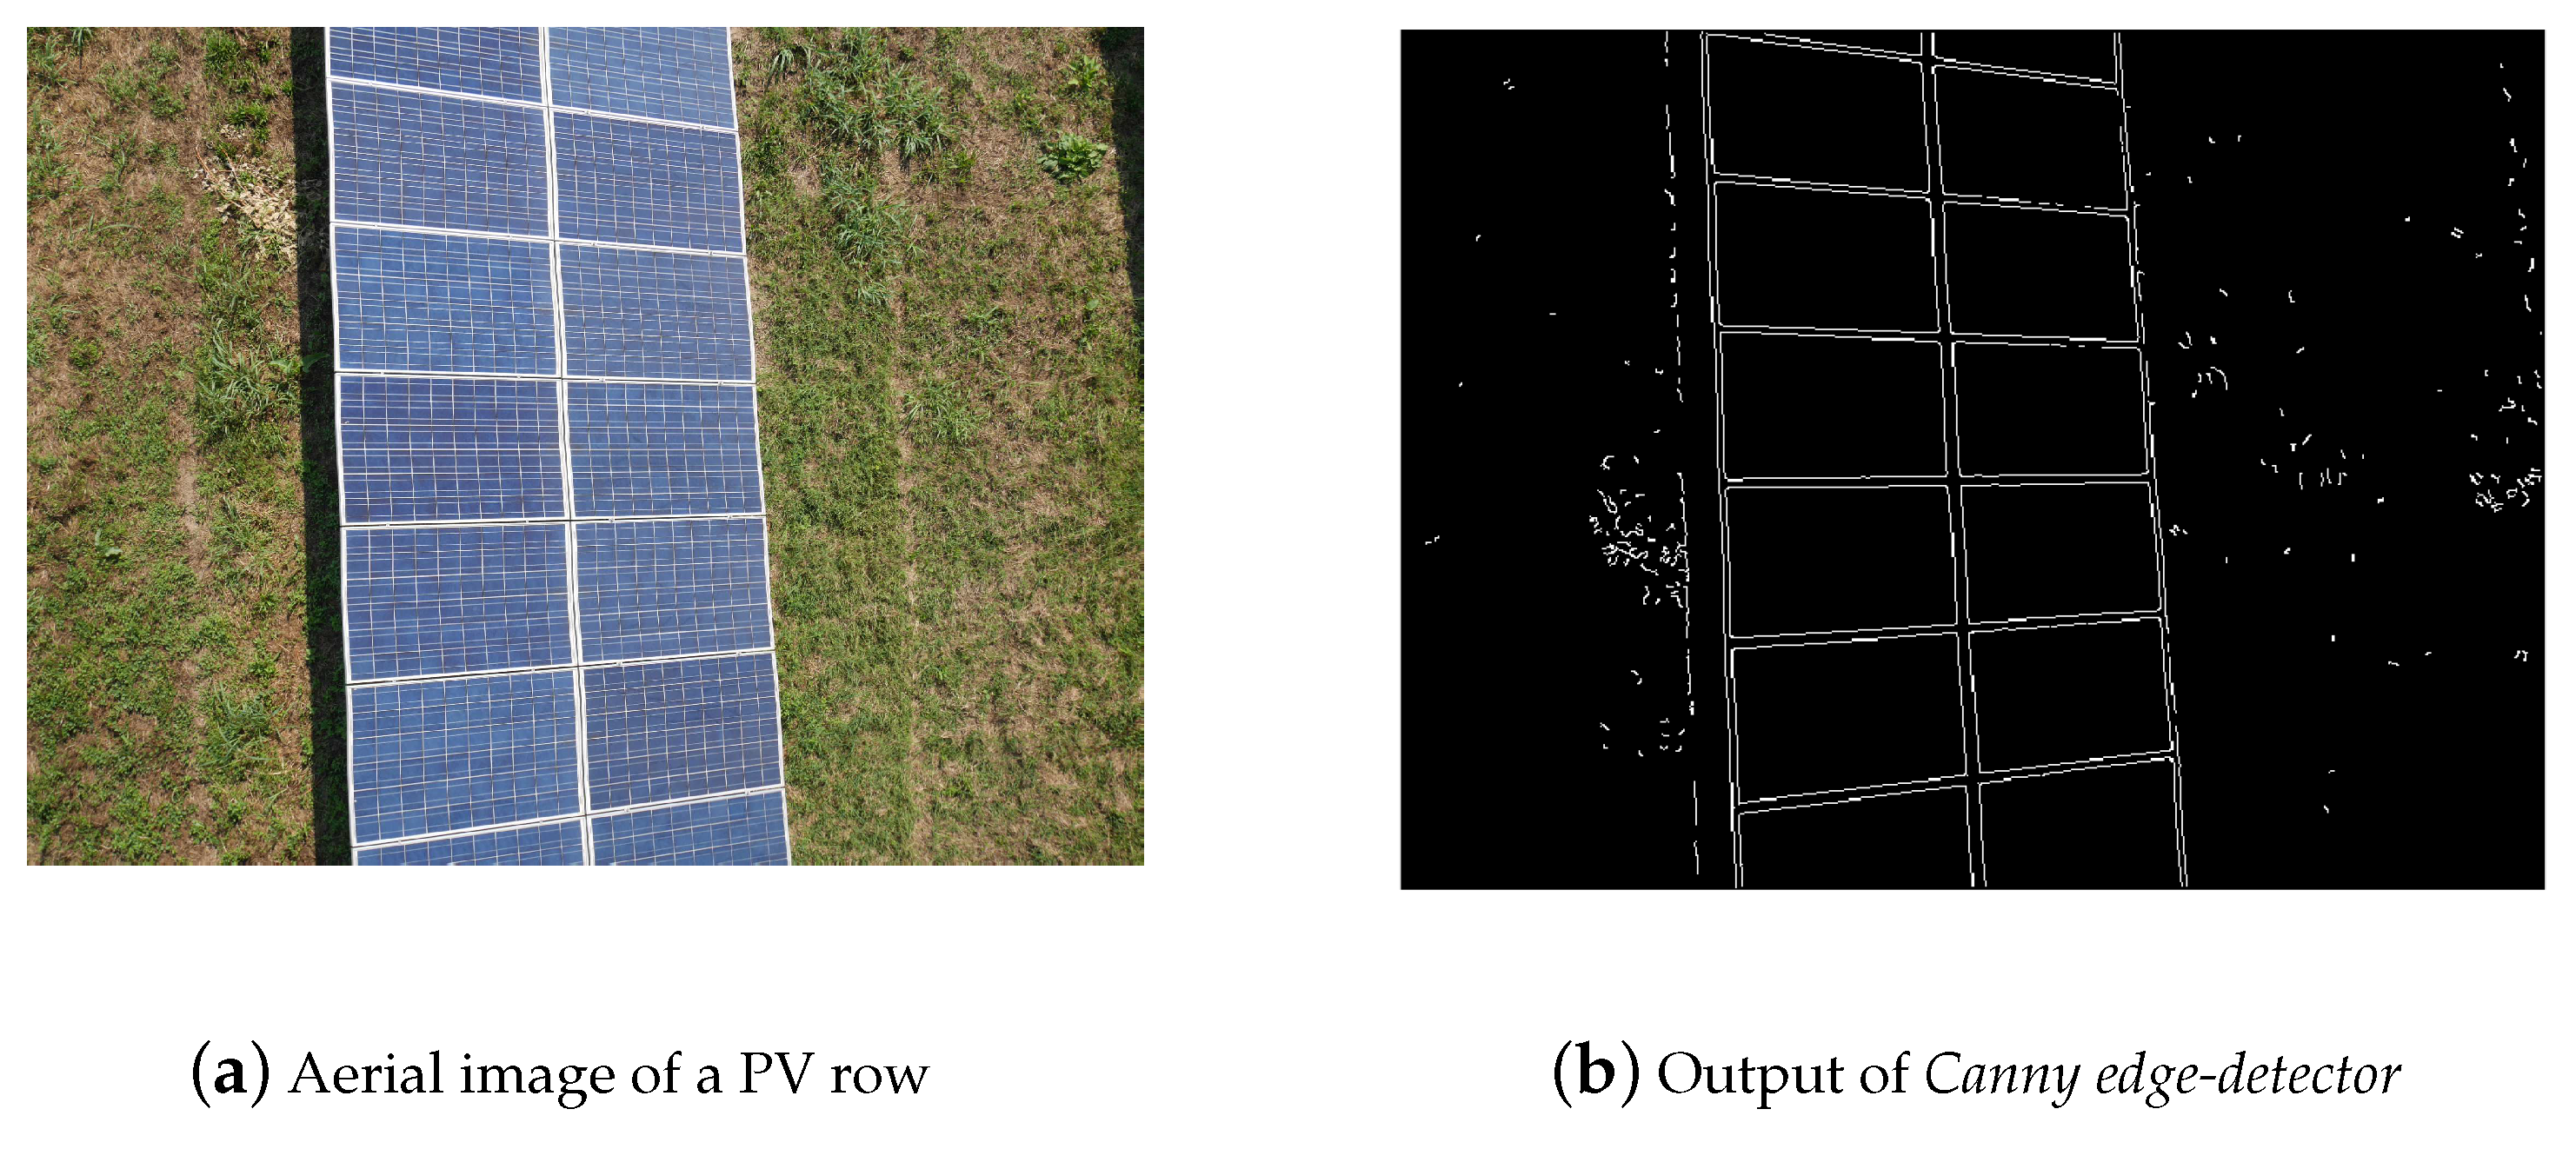
Edge detection highlights points in a digital image where brightness changes sharply and finds discontinuities. Various edge detection algorithms exist, e.g., Roberts cross operator [36], Prewitt operator [37], Sobel operator [38], and Canny edge-detector [39]. The latter has been chosen for its simple and precise mathematical formulation and its satisfactory performance in terms of noise rejection. Its application to an aerial image of a single PV row (see Figure 6a) is shown in Figure 6b.

3.2. Line Detection

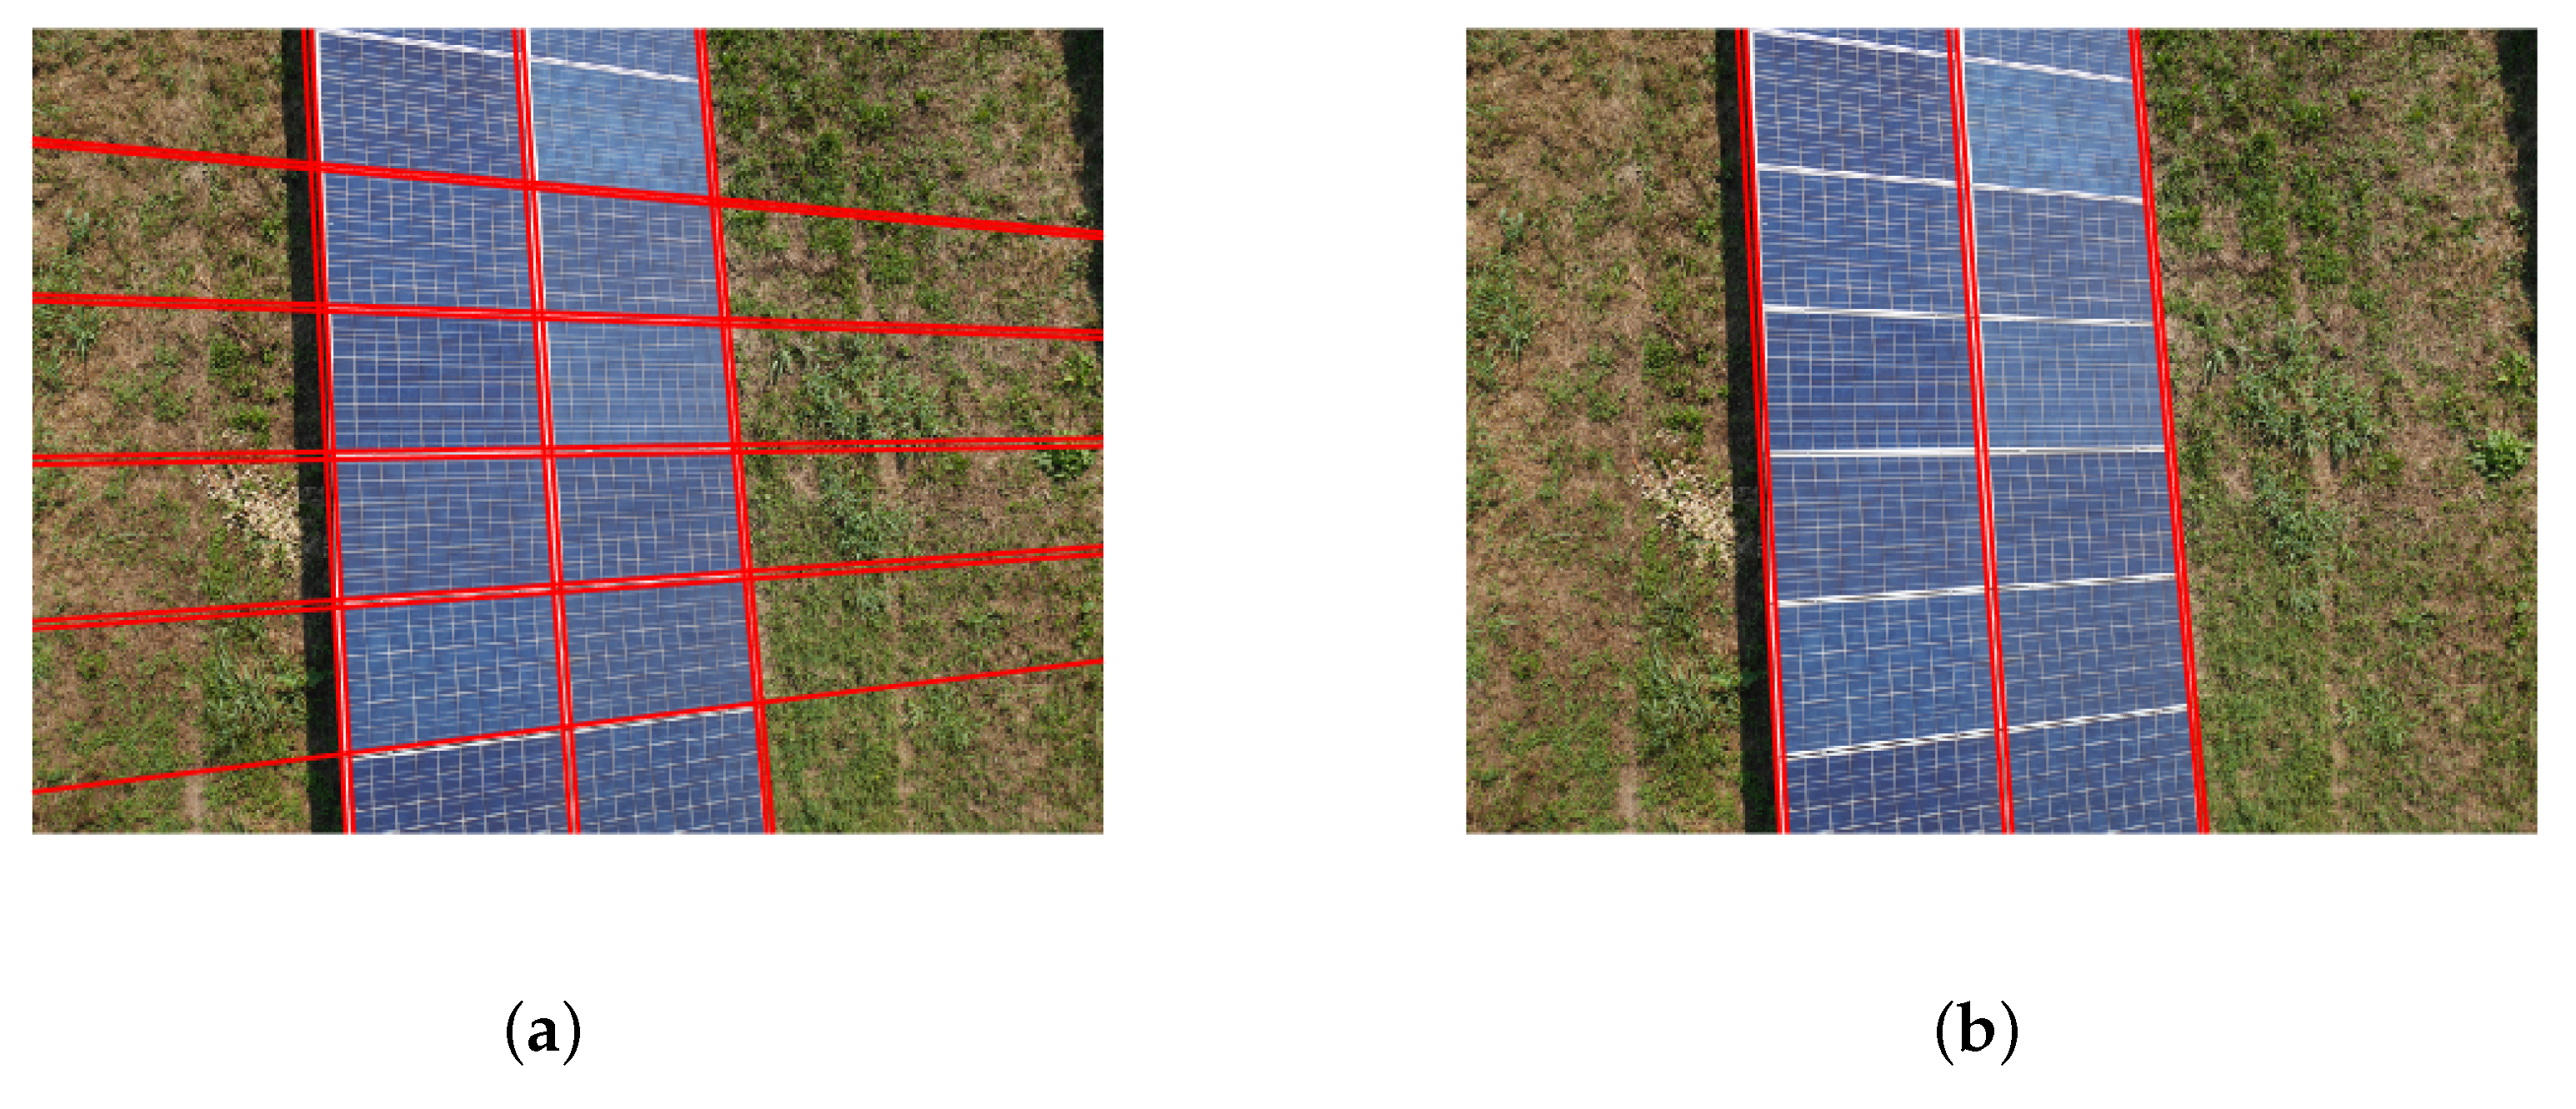
Concerning line detection, the Hough transform [40] is applied to the obtained binary template. It allows detection of the lines appearing in the image, giving as additional information their analytical form in terms of distance of the line from the upper left corner of the image and angle between the line and the vertical.
A graphical example of its output is shown in Figure 7a.
As the aim of the algorithm is to support the monitoring process maintaining the UAV along the principal (longitudinal) direction of the PV row, only the lines which correspond to the direction of the row itself are of interest and must be taken into account in the guidance algorithm. Assuming that the relative angle between the heading of the UAV and the principal direction of the PV row is, in absolute value, lower than 45 , ambiguity in the selection of the correct lines cannot be found. This can be regarded as a reasonable assumption considering the scale of the errors addressed in this paper. Thus, the lines in the direction of the row are selected and retained, and the others are discarded. The final output is shown in Figure 7b.
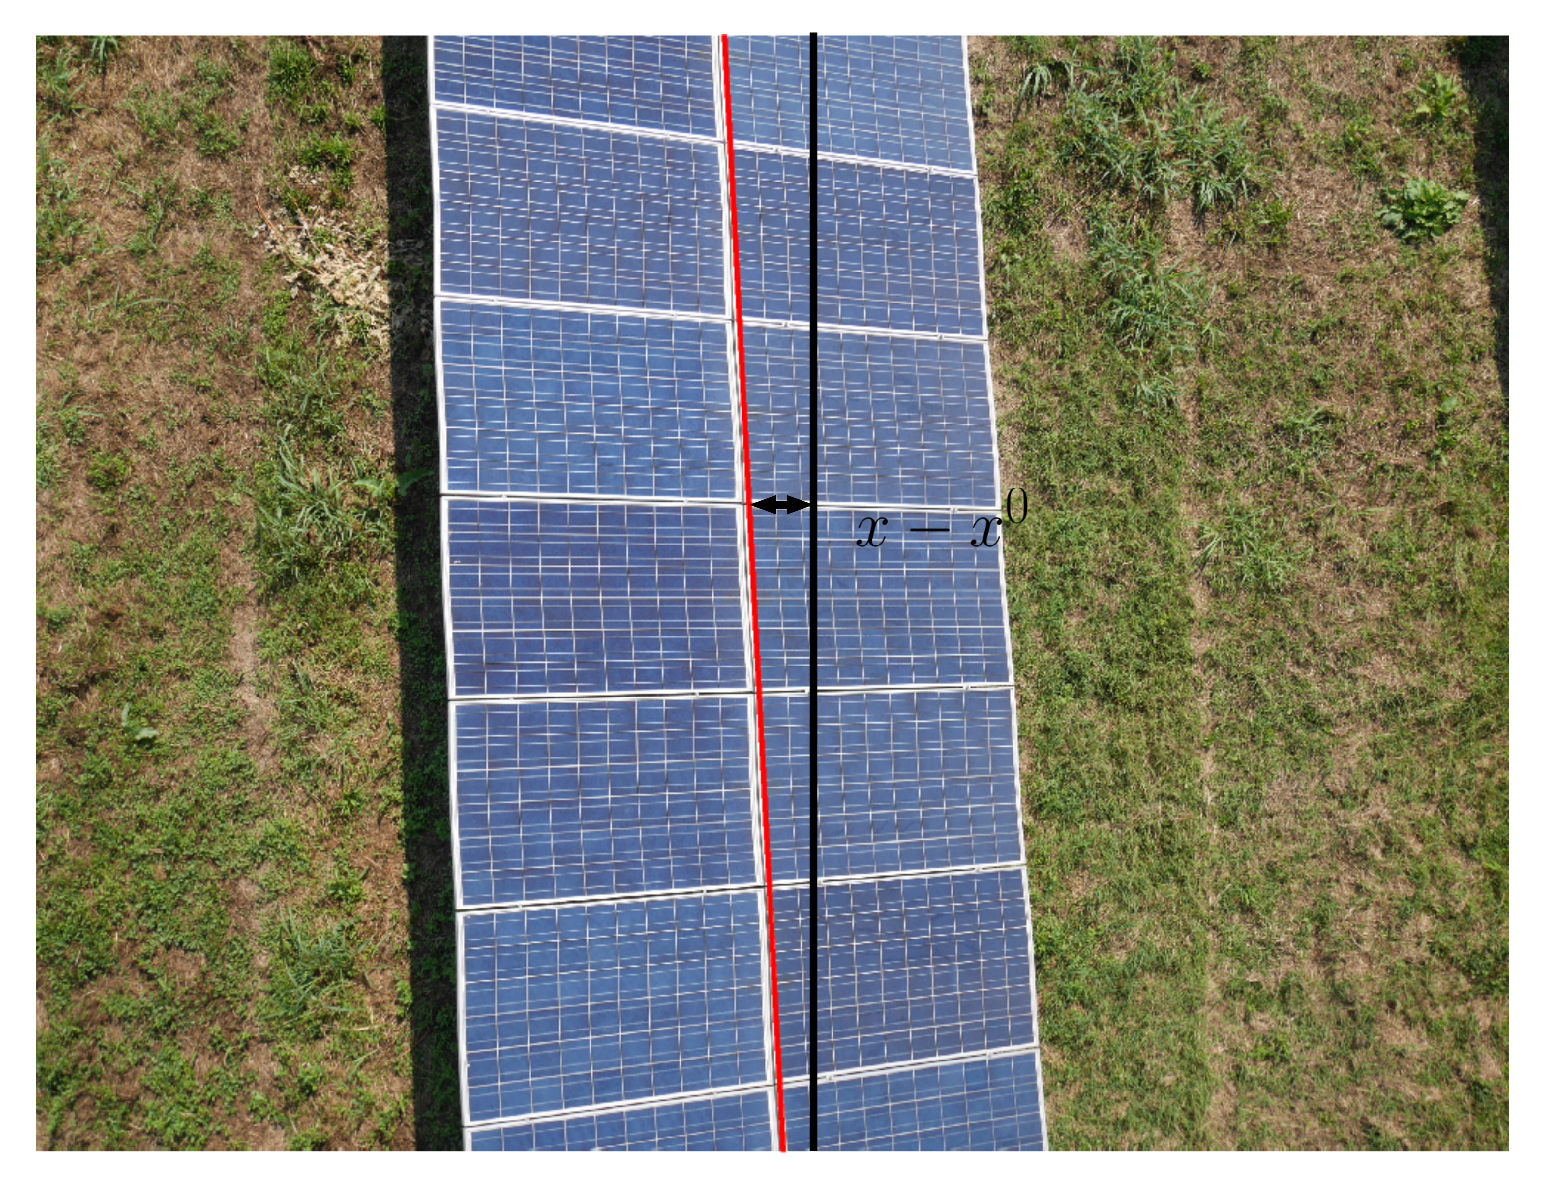
Furthermore, the PV row is approximated as the mean line of the remaining lines and compared with the desired outcome. The latter is the one in which the PV row is located exactly at the center of the image with its mean line aligned with the vertical direction. The distance between the two will give an indication about the relative position in pixels between the UAV and the PV panel, indicated as x x 0 in the block diagram and in Figure 8.
Finally, assuming that the width of the PV row is known, or alternatively using the altitude of the UAV for the reconstruction of the camera Field of View (FOV), the position can be converted directly into meters.
The compensator Γ ( s ) has been chosen so that the feedback interconnection between the complementary sensitivity of the UAV’s position control system F ( s ) and Γ ( s ) is asymptotically stable and considering the case in which n x 0 can be treated to first approximation as a constant input. Then, clearly the response to the error tends asymptotically to zero if and only if a compensator with integral action is adopted. Its transfer function can be written as
Γ ( s ) = K p + K i s ,
where K p and K i are respectively the proportional and integral gain. These two gains can be tuned using classical methods from linear control systems theory.

4. Test Case

4.1. Simulation Environment Architecture

For the purpose of testing the developed algorithm, a simulation Software-in-the-Loop (SITL) approach has been adopted. In particular, the developed SITL tool is based on the PX4 autopilot’s firmware [41].
In detail, the PX4 SITL communicates via a protocol called MAVLink [42] with the simulator (e.g., Gazebo [43]) to receive sensor data from the simulated world and send actuator command values to it. Furthermore, the PX4 SITL communicates with the GCS and an offboard API (e.g., ROS [44]) to send telemetry from the simulated environment and receive commands.
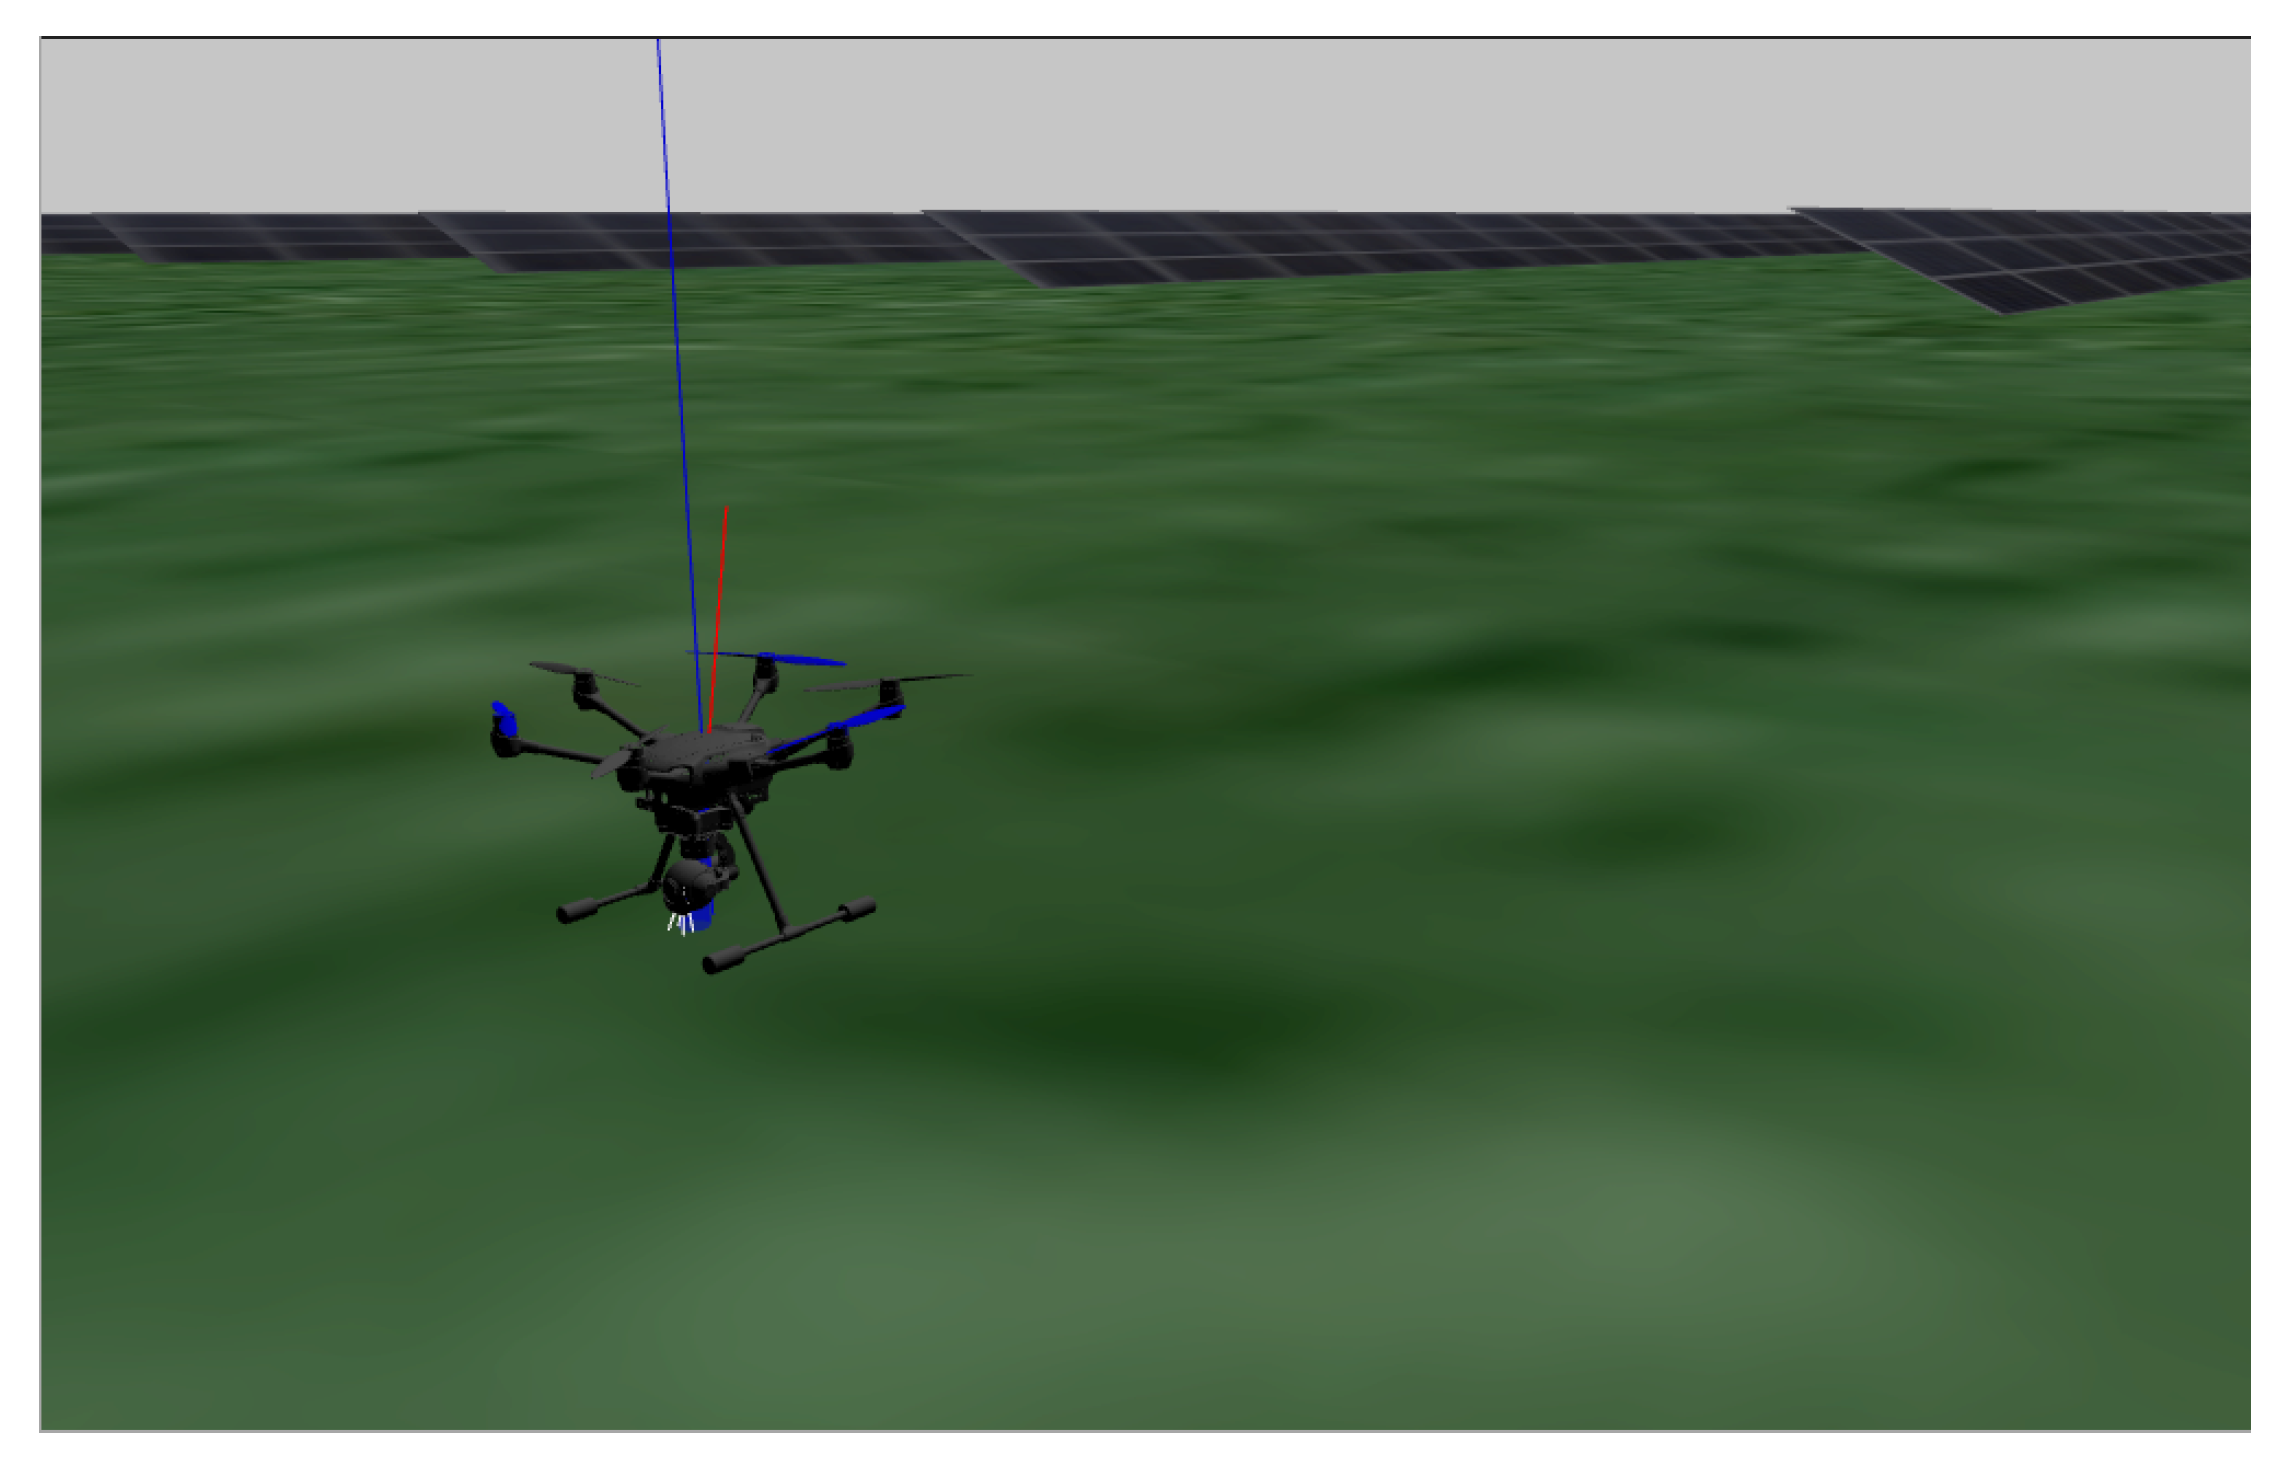
In the Gazebo simulator, the Yuneec Typhoon H480 hexacopter has been implemented (Figure 9) along with a series of sensors’ plugin, namely, the GNSS and the camera, which triggers at a frequency of 1 Hz and provides the pictures that are analyzed in real-time in the way presented in the previous section.

4.2. Field Case Study

A real PV plant configuration has been used as a real case study. The selected PV plant is located in Massa Lombarda, Ravenna, Italy. It is a 4.72 MWp PV plant with polycrystalline modules. The plant is connected to 4 inverters and then to the medium-voltage grid.
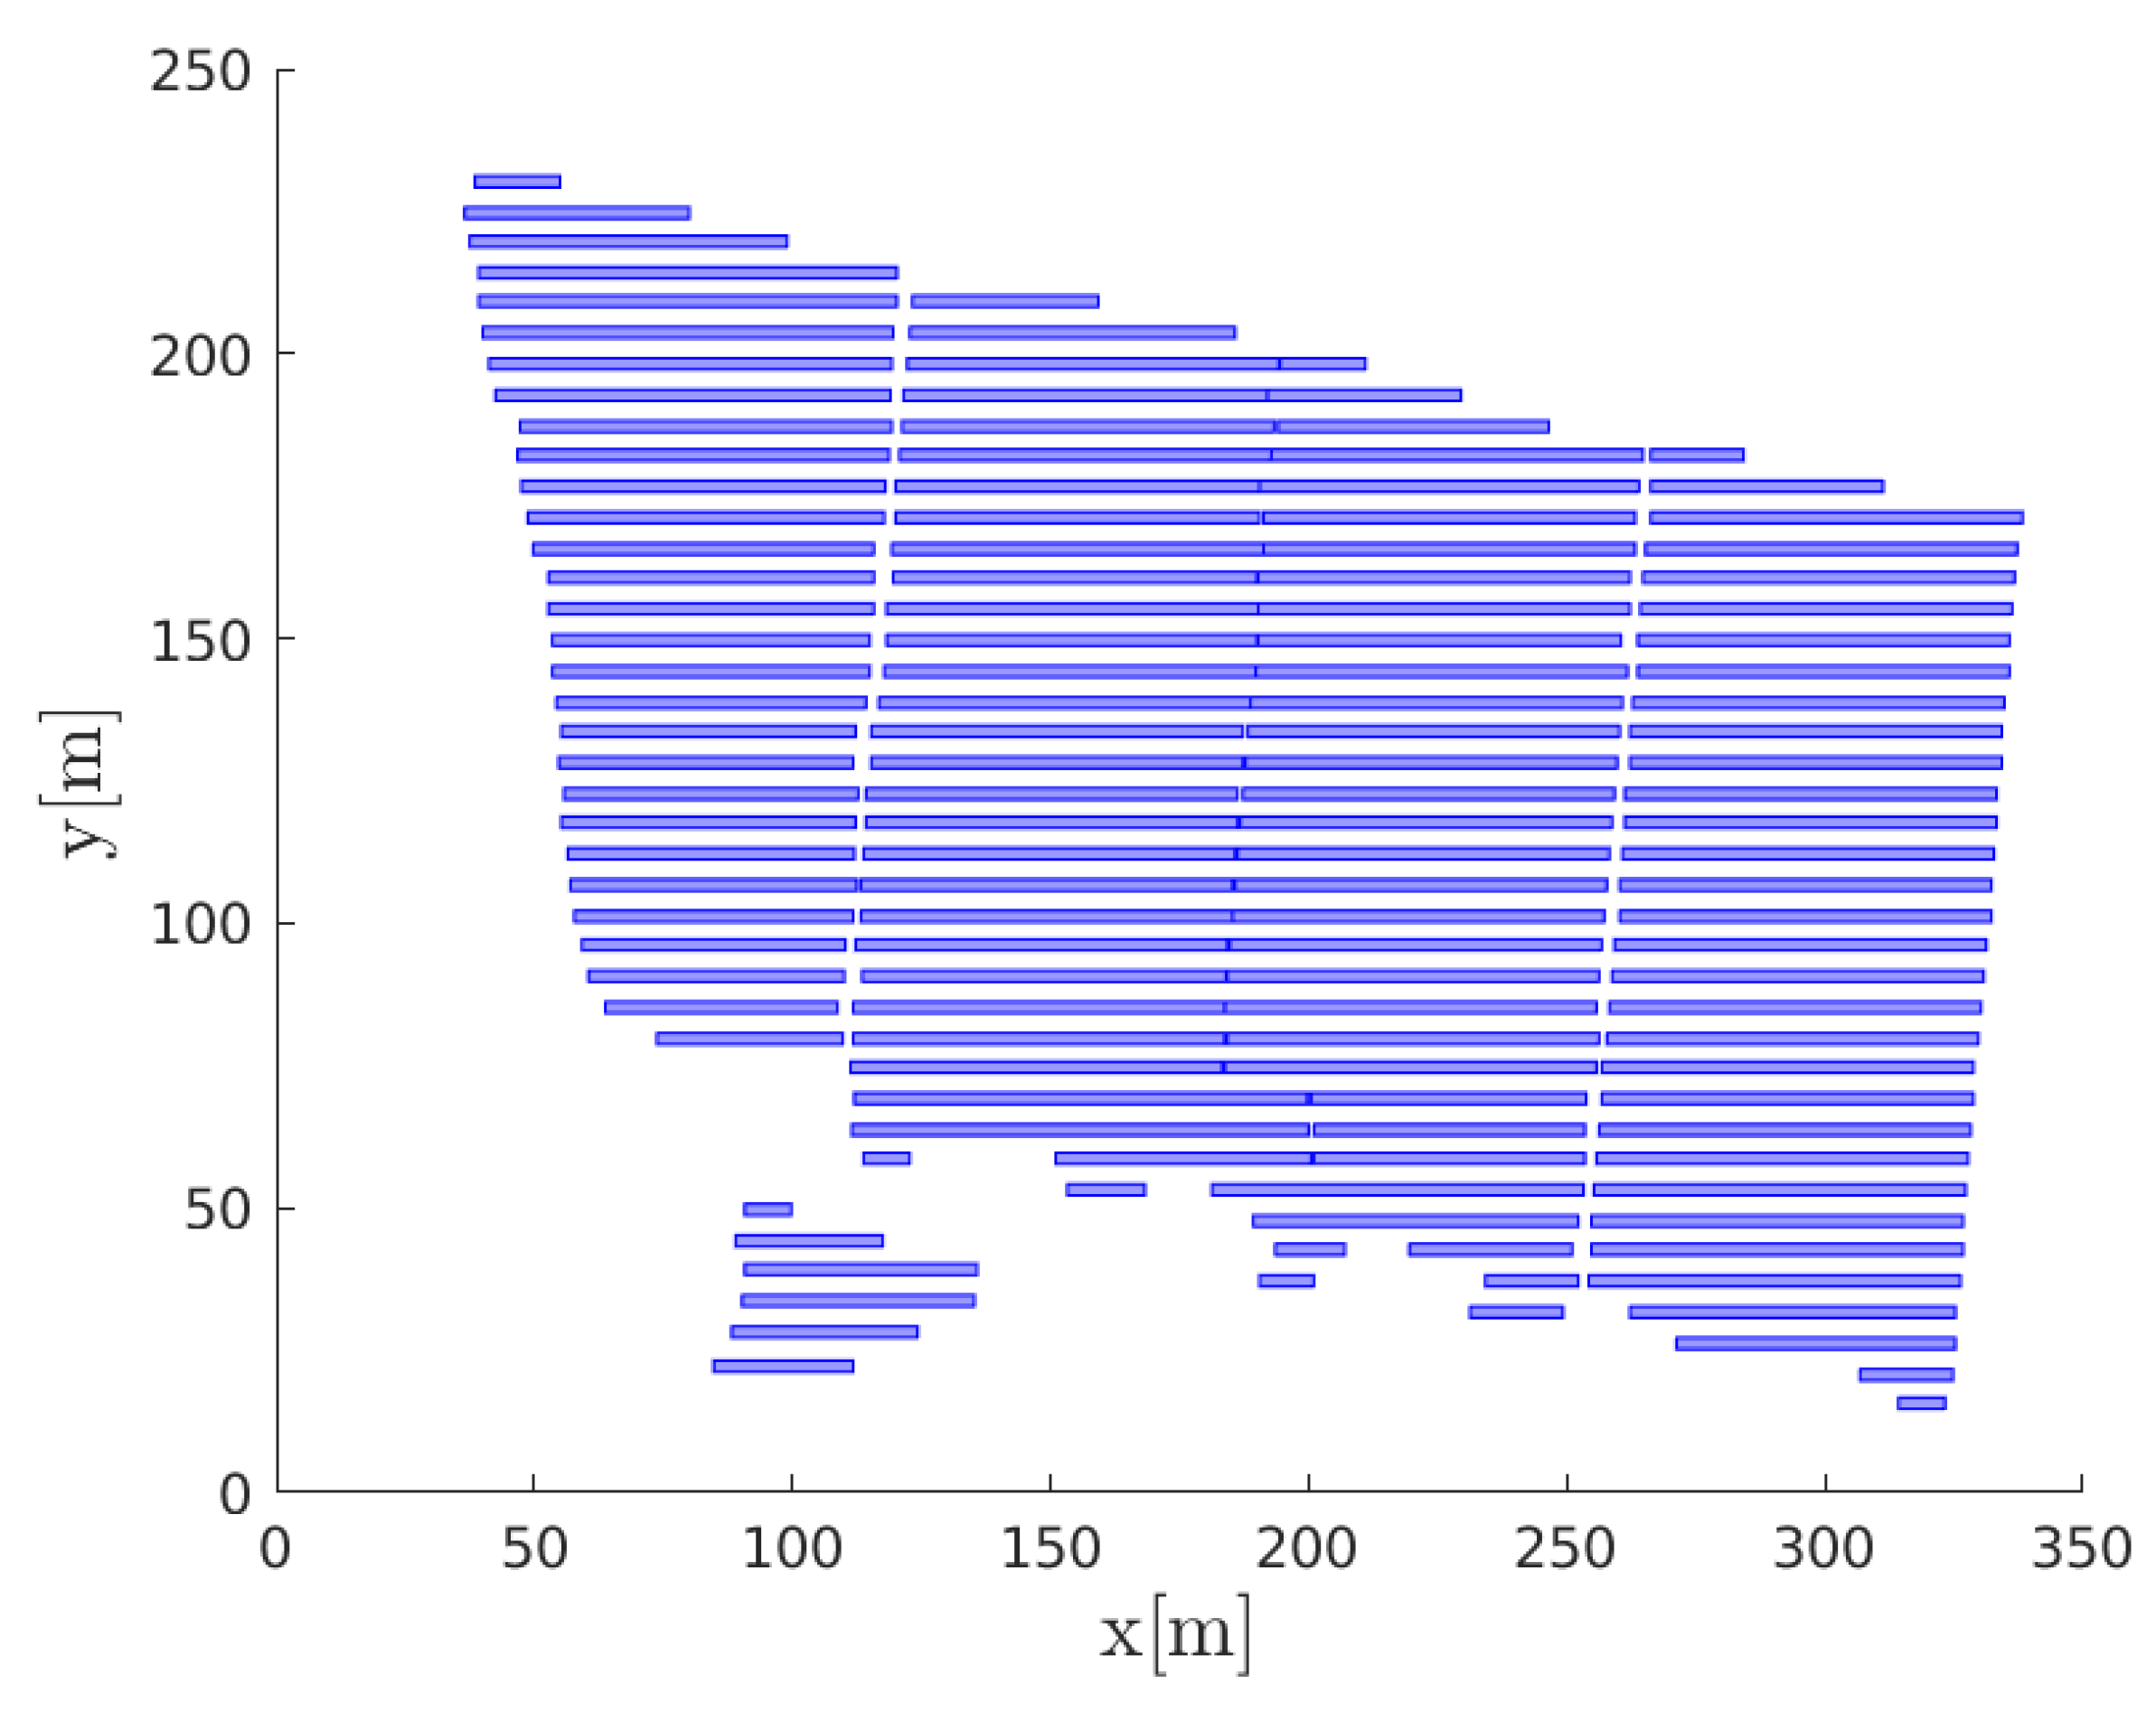
The digitalized map of this PV plant is represented in Figure 10. The plant is divided in several rows of different length, each row is inclined of 30 degrees with respect to the ground and the width comprises two modules.
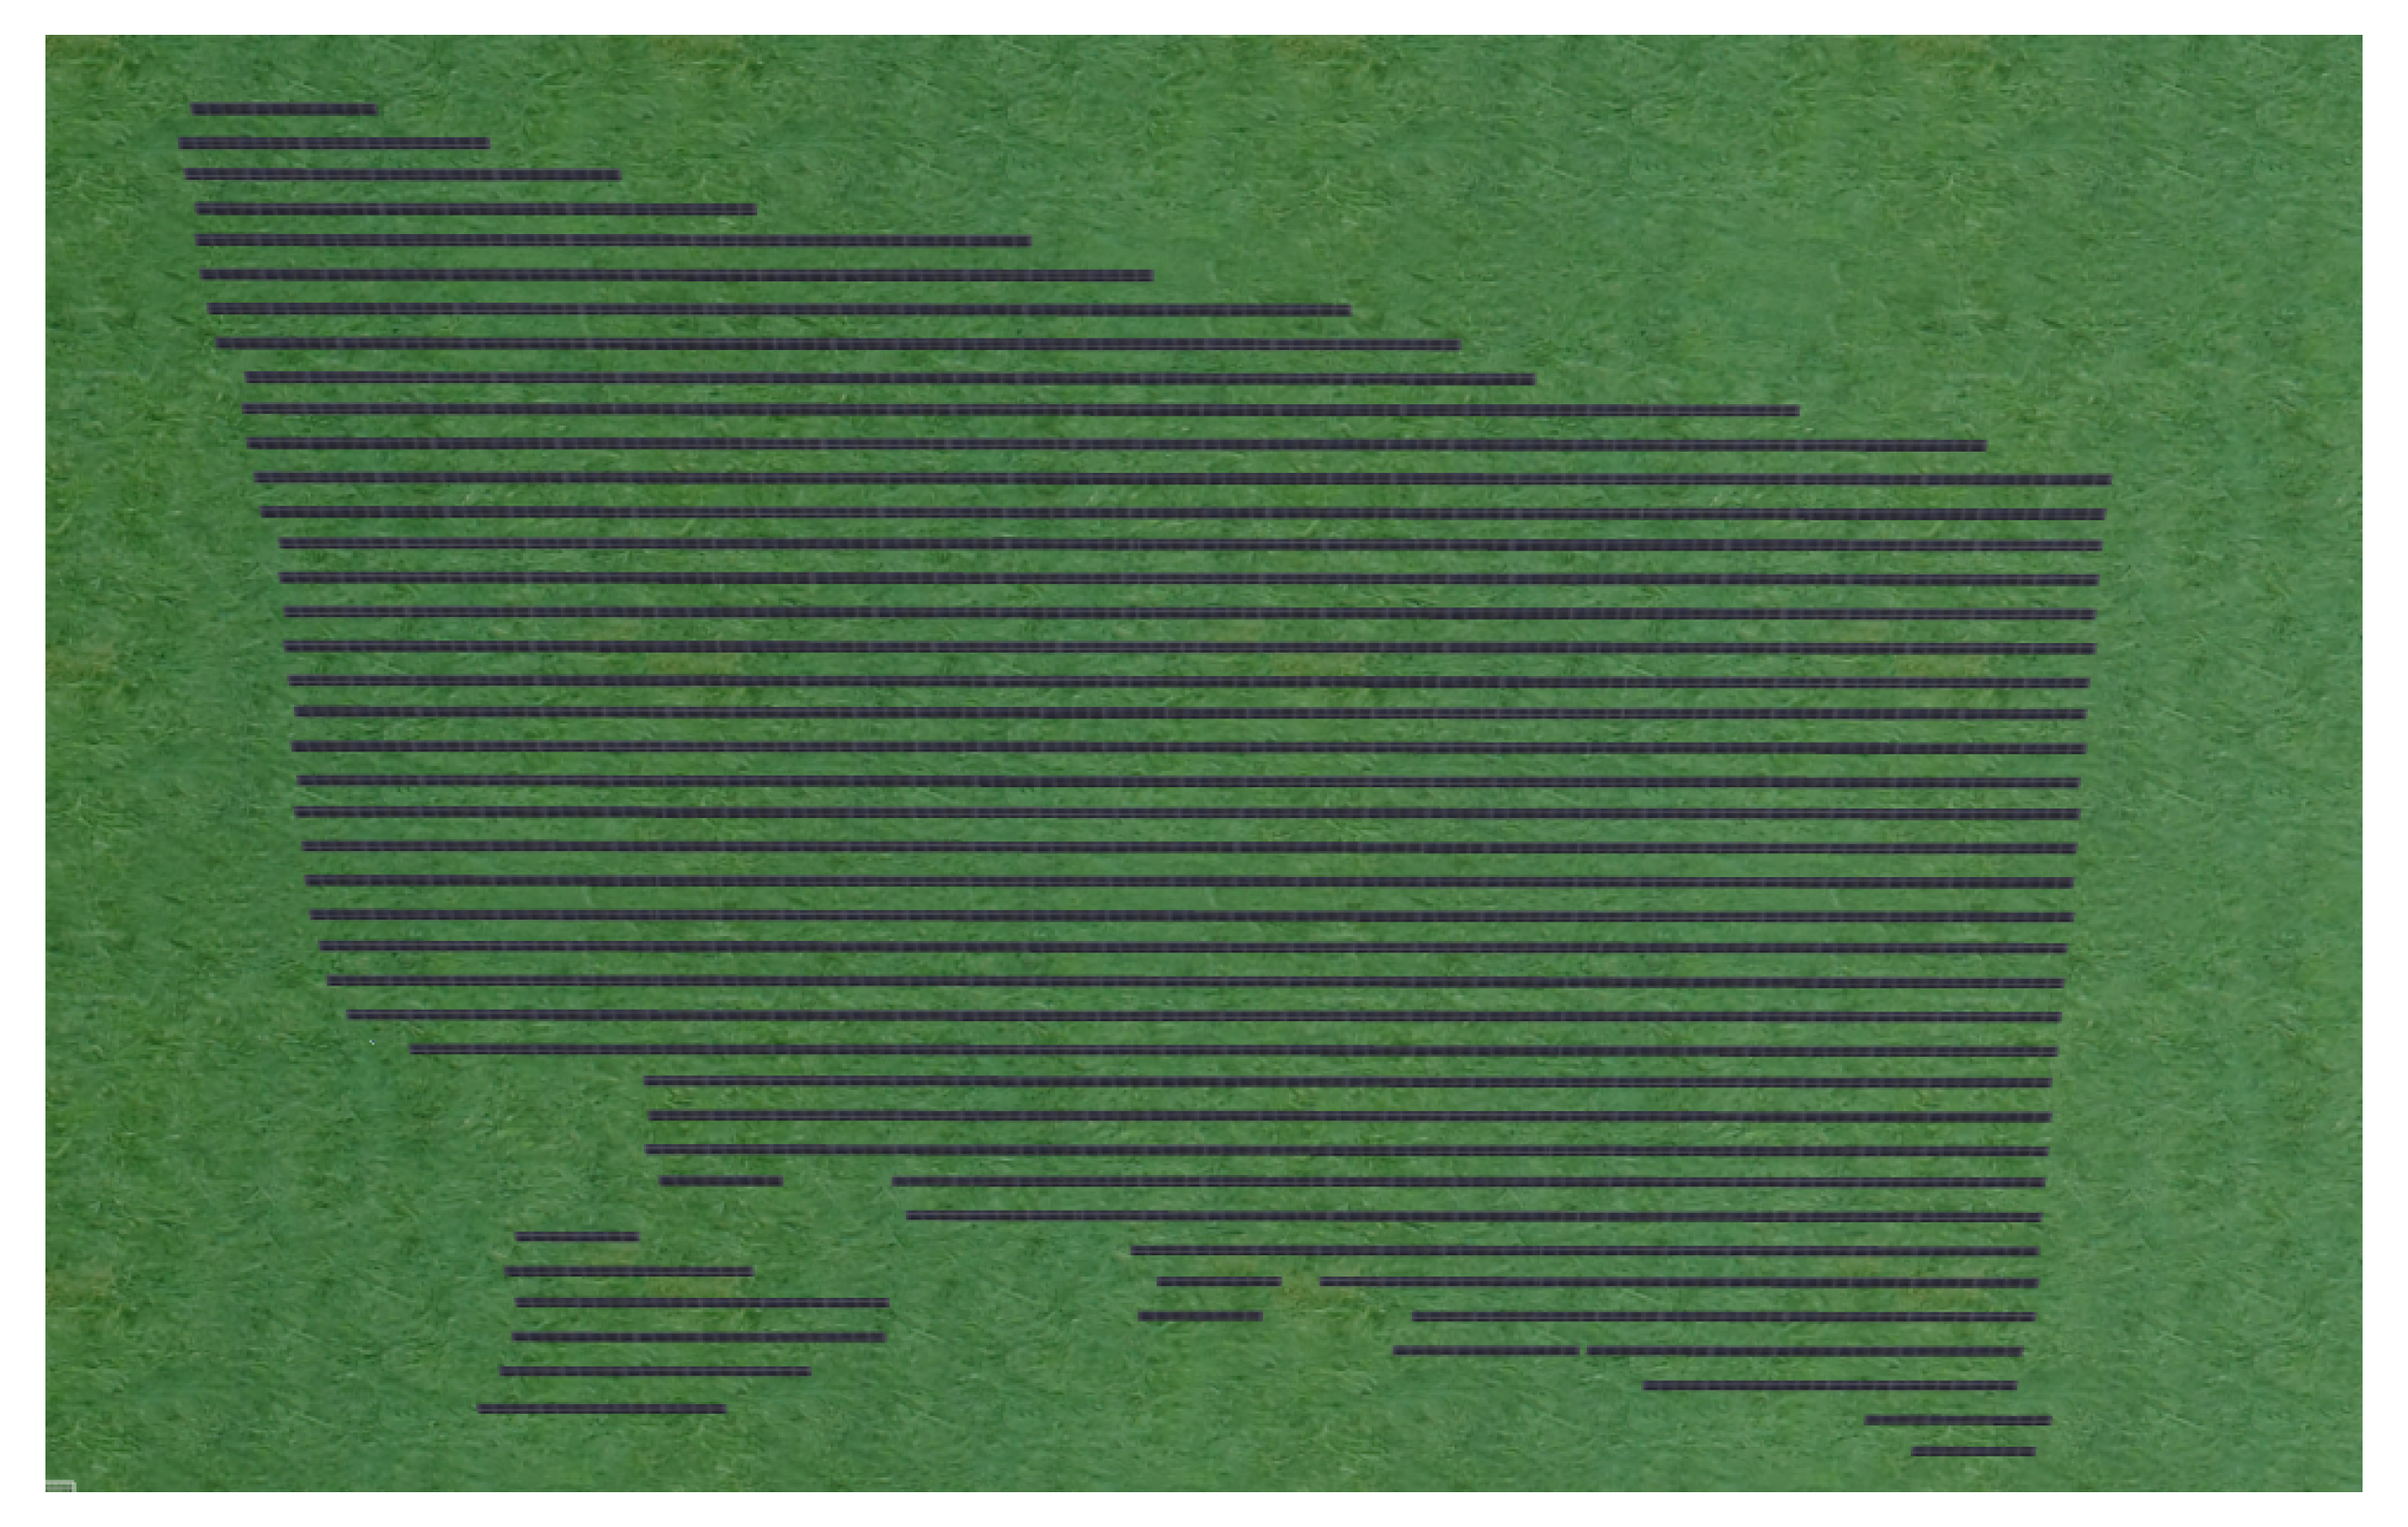
The plant has been imported into the Gazebo simulator as presented in Figure 11.
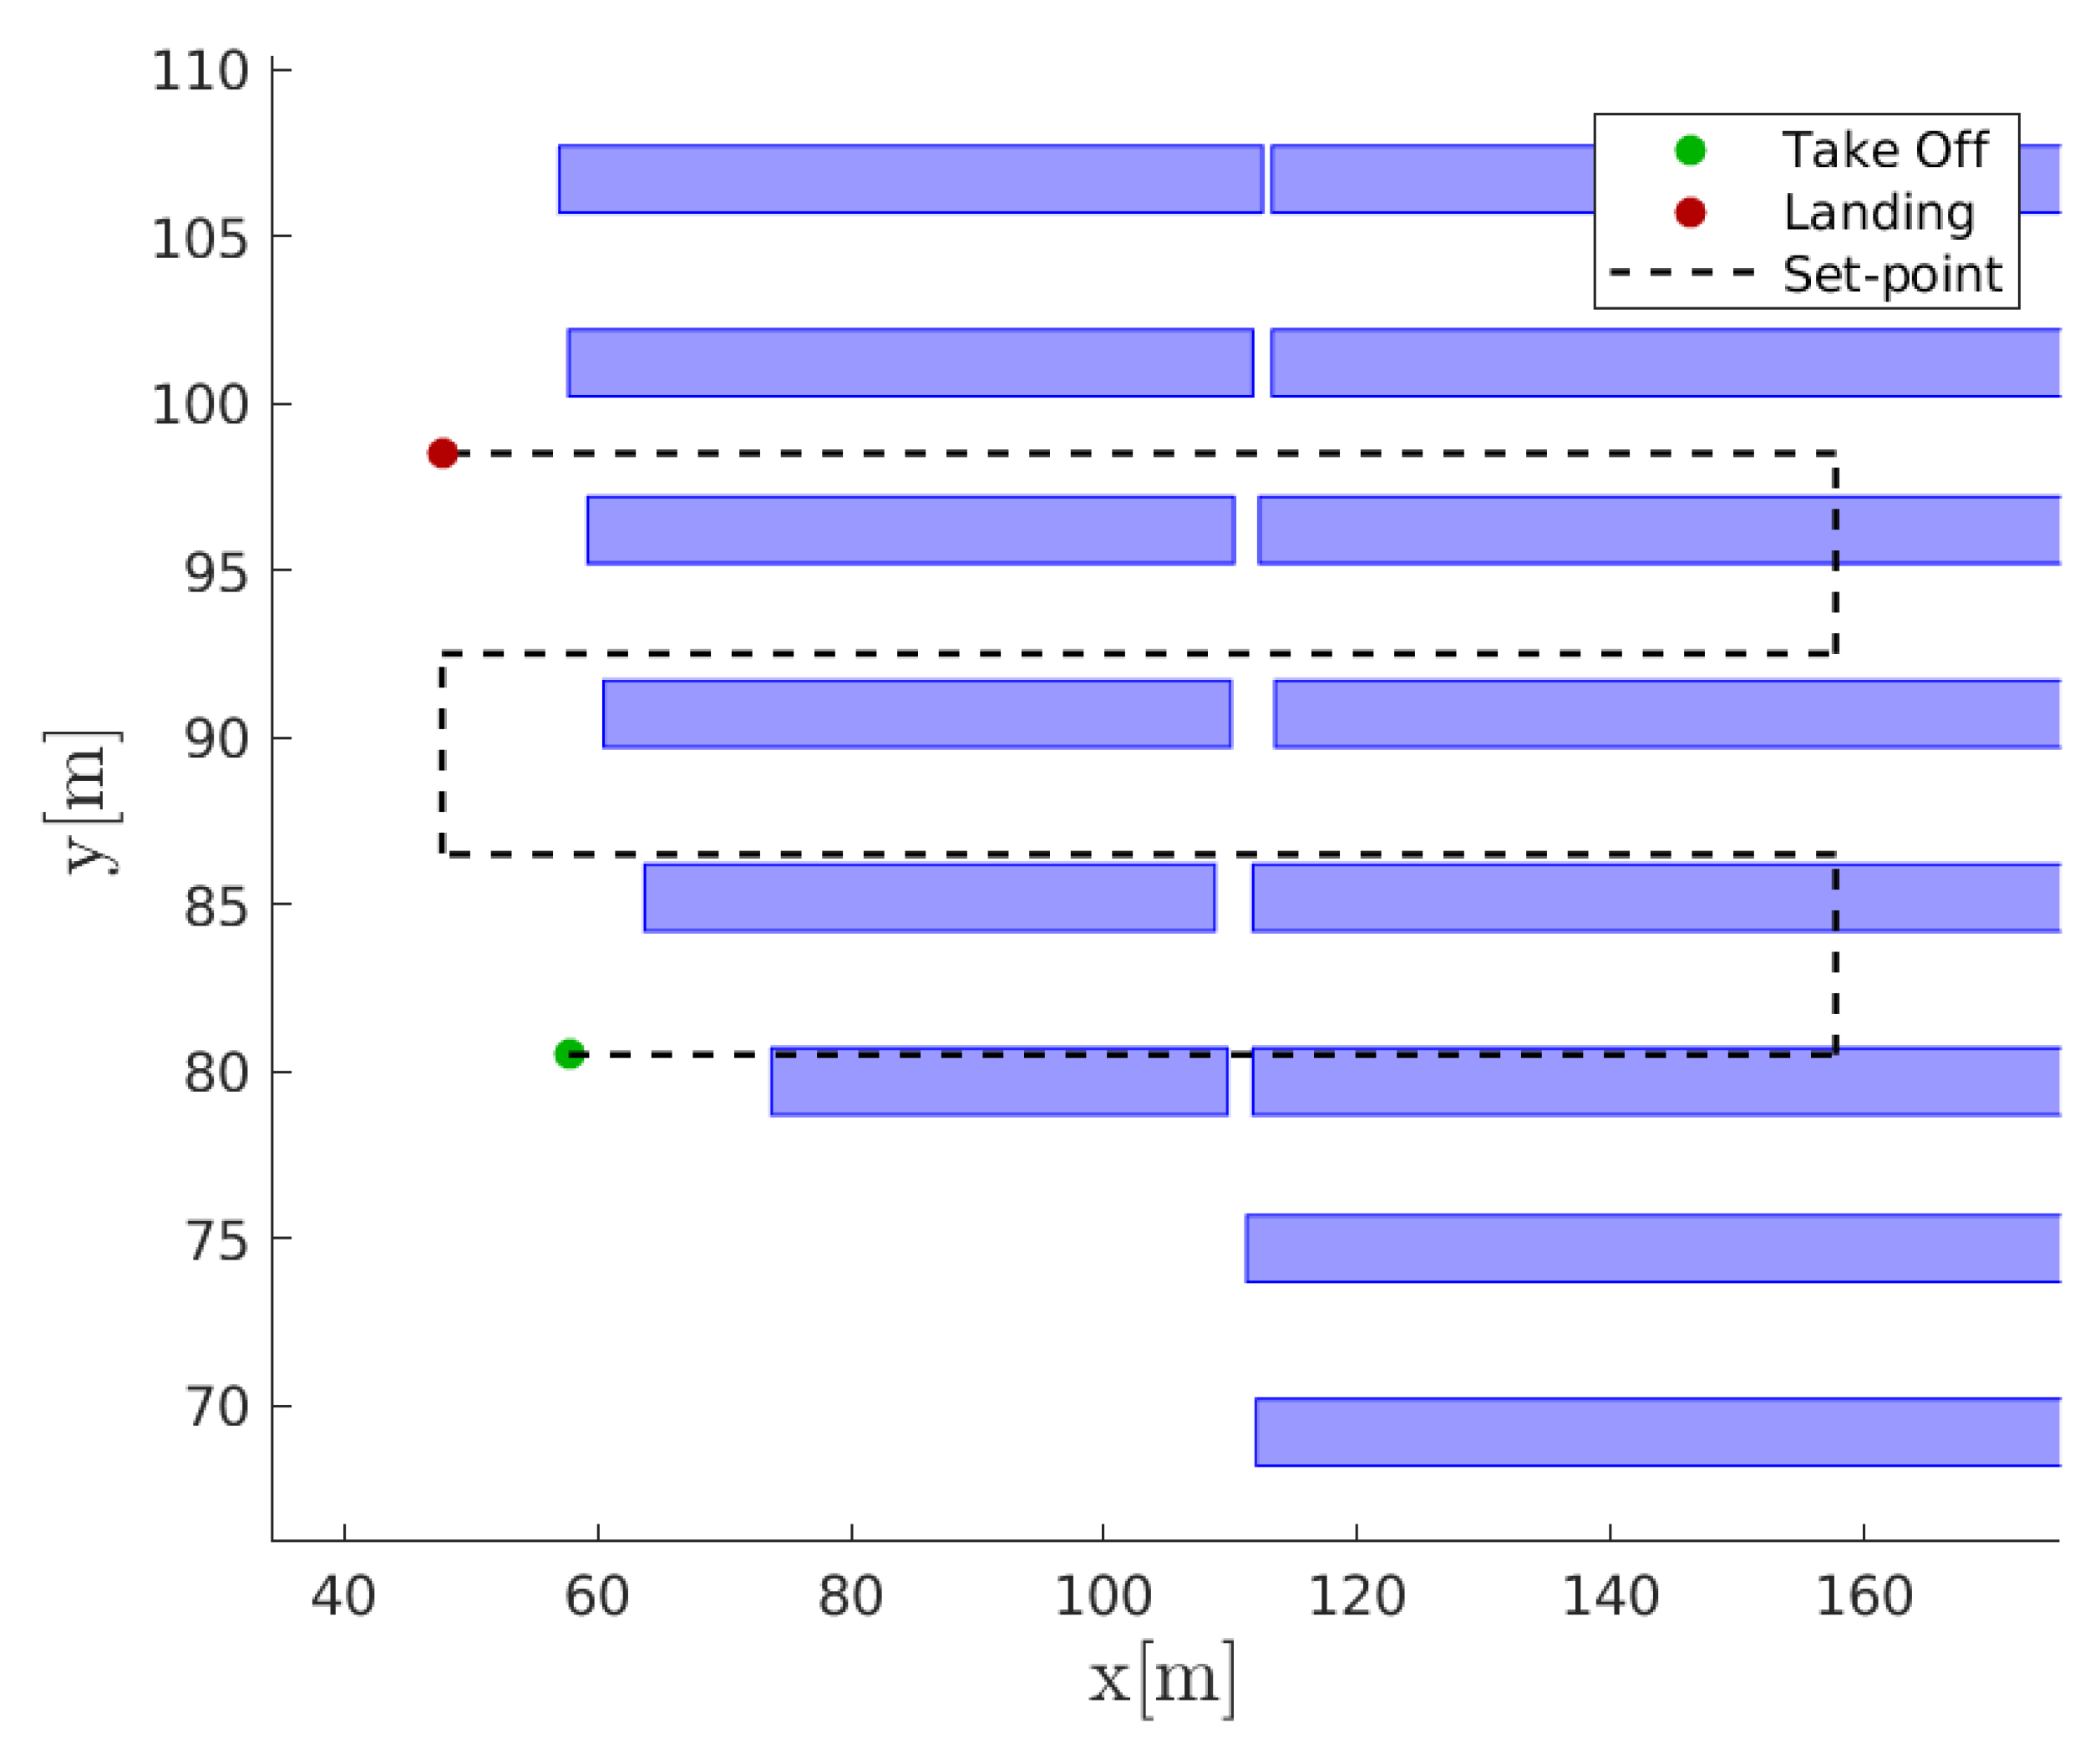
For the inspection operations, a proper horizontal routing has been designed (Figure 12). This helps the postprocessing of the acquired information and it does not worsen the acquisition time.
The route is appropriately shifted with respect to the target panels to simulate the map georeferencing error the planning process is typically subjected to.

5. Flight Simulation Results

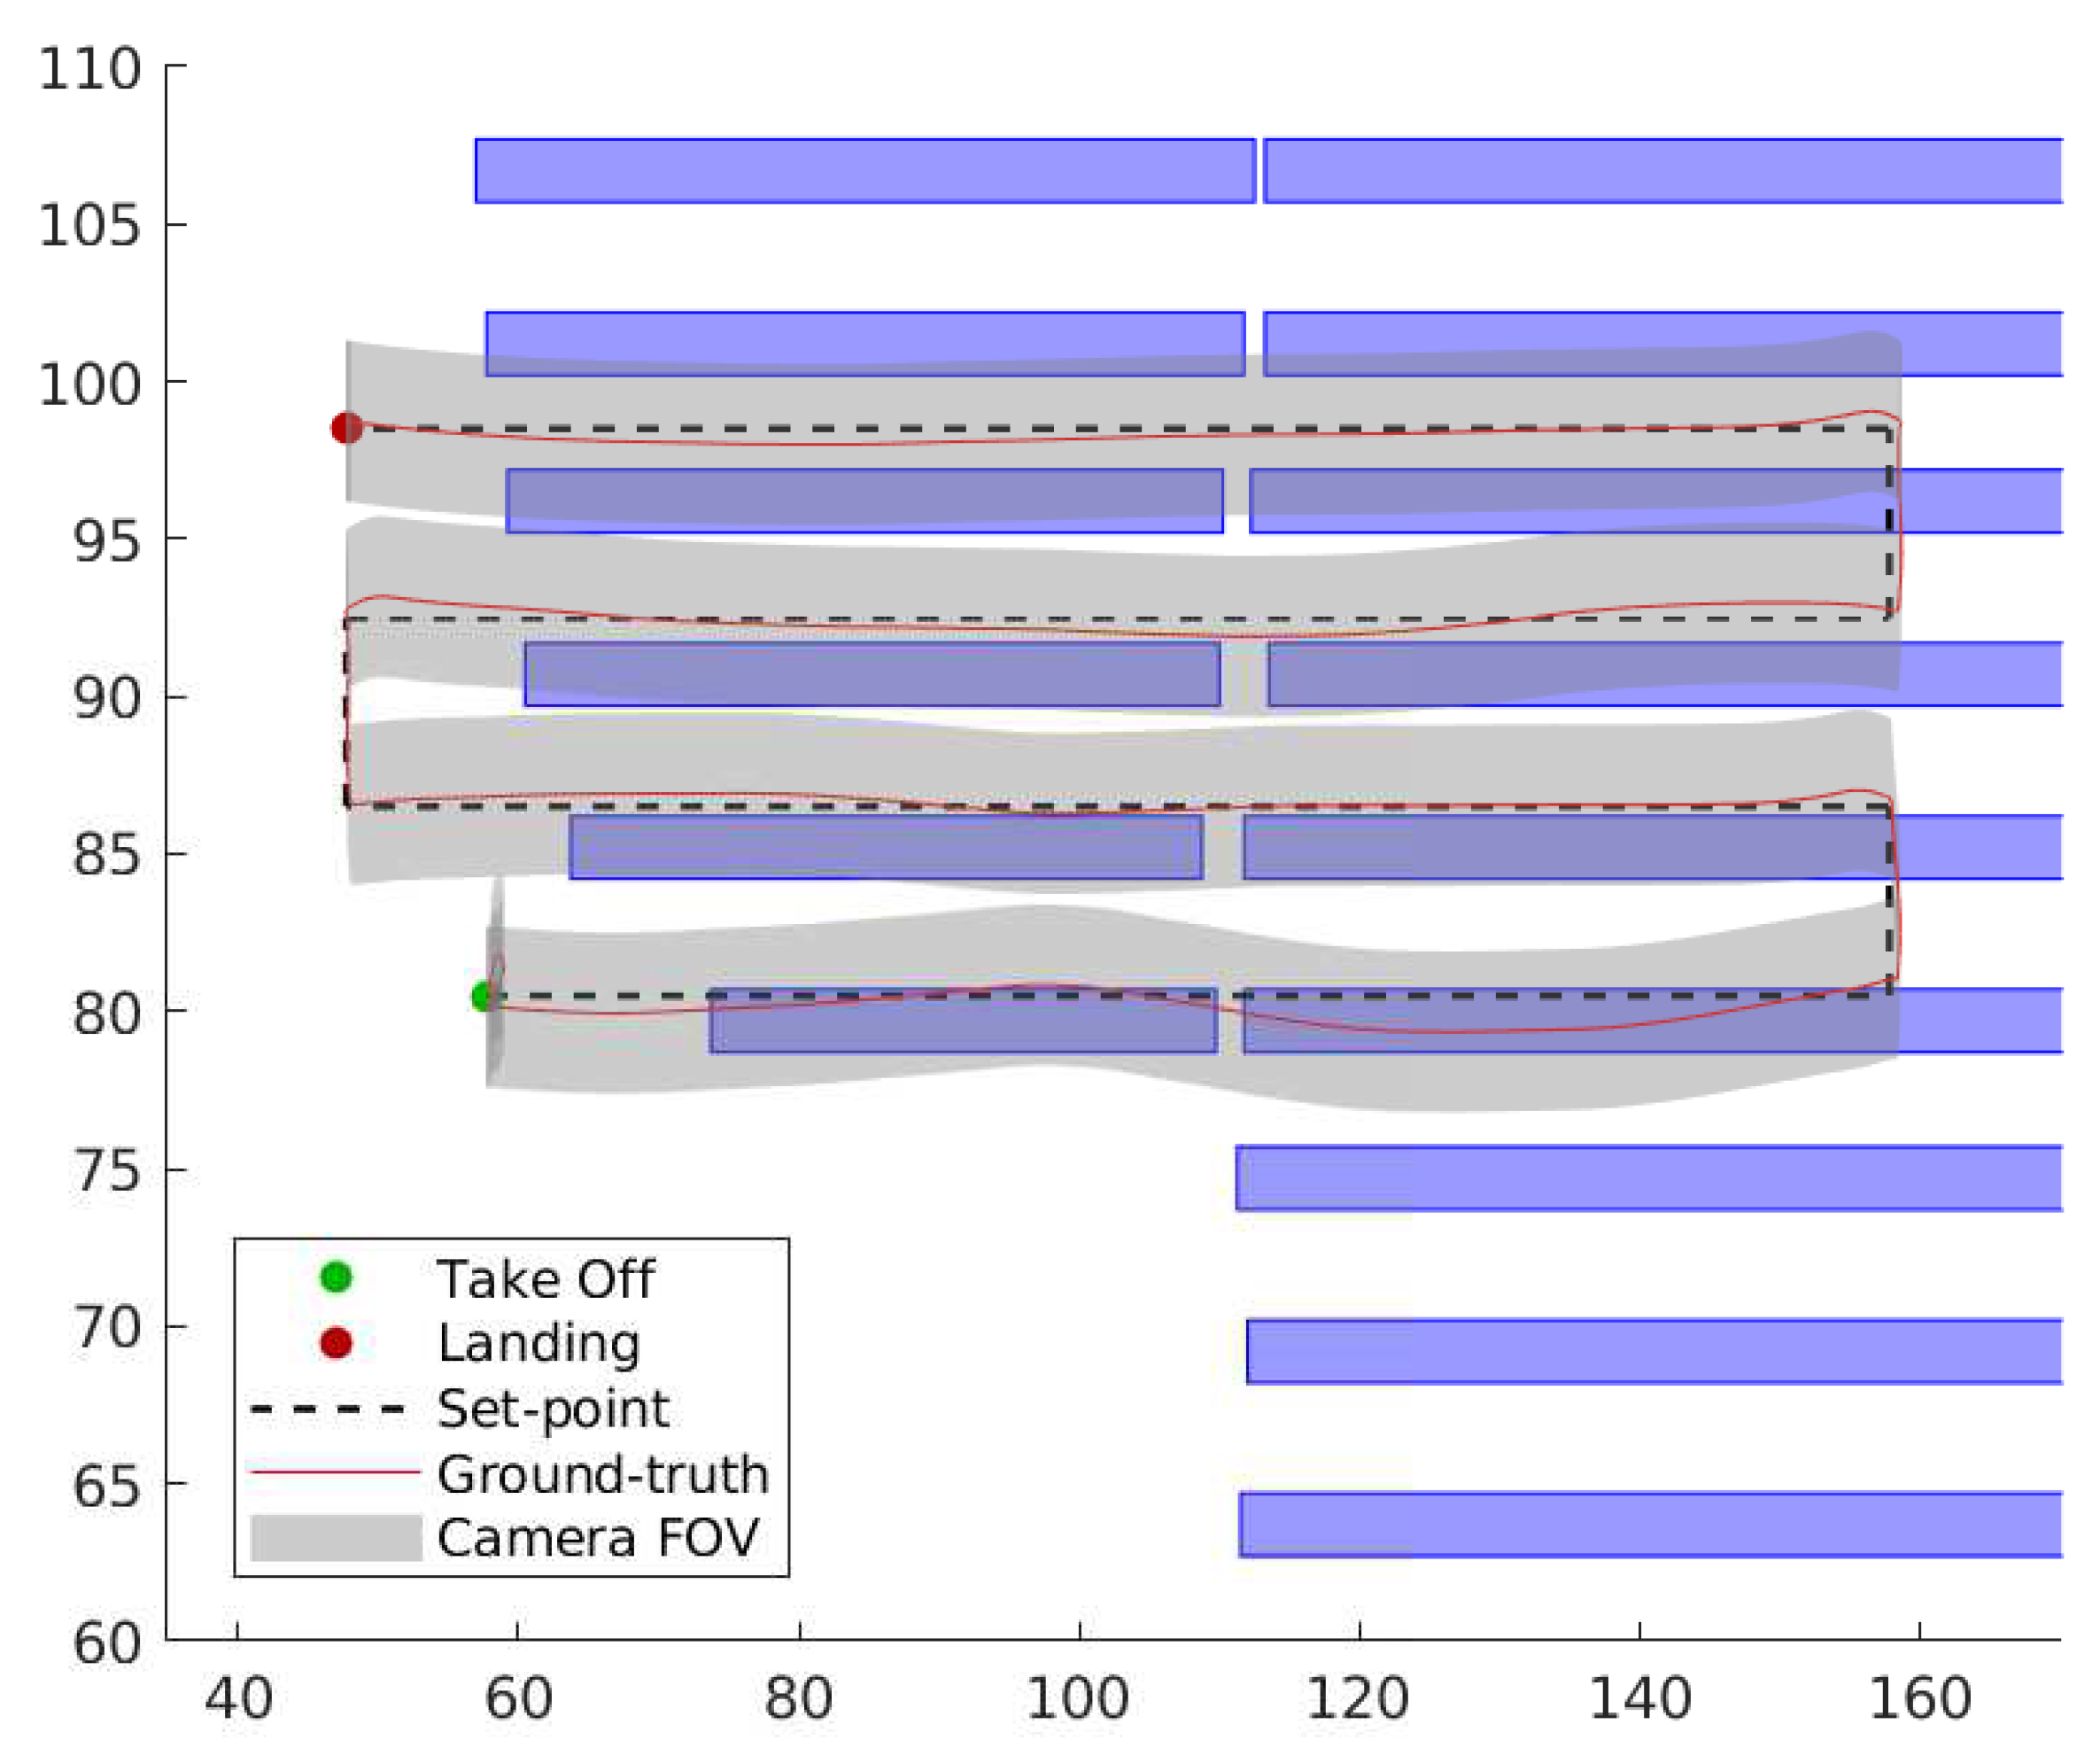
In Figure 13, in which the proposed correction object of this paper is not activated (this scenario represents the state-of-the-art of automatic flight), the UAV follows quite well the given route, even in presence of GNSS errors. However, in the case of georeferencing errors, like the one presented in the previous section, due to the UAV wrong positioning, the camera is not able to capture part of the PV row.
In particular, as can be observed in the presented plot, the last row before landing sees a complete slice of the PV row not covered. Thus, the data acquisition related to that plant section is completely ineffective.
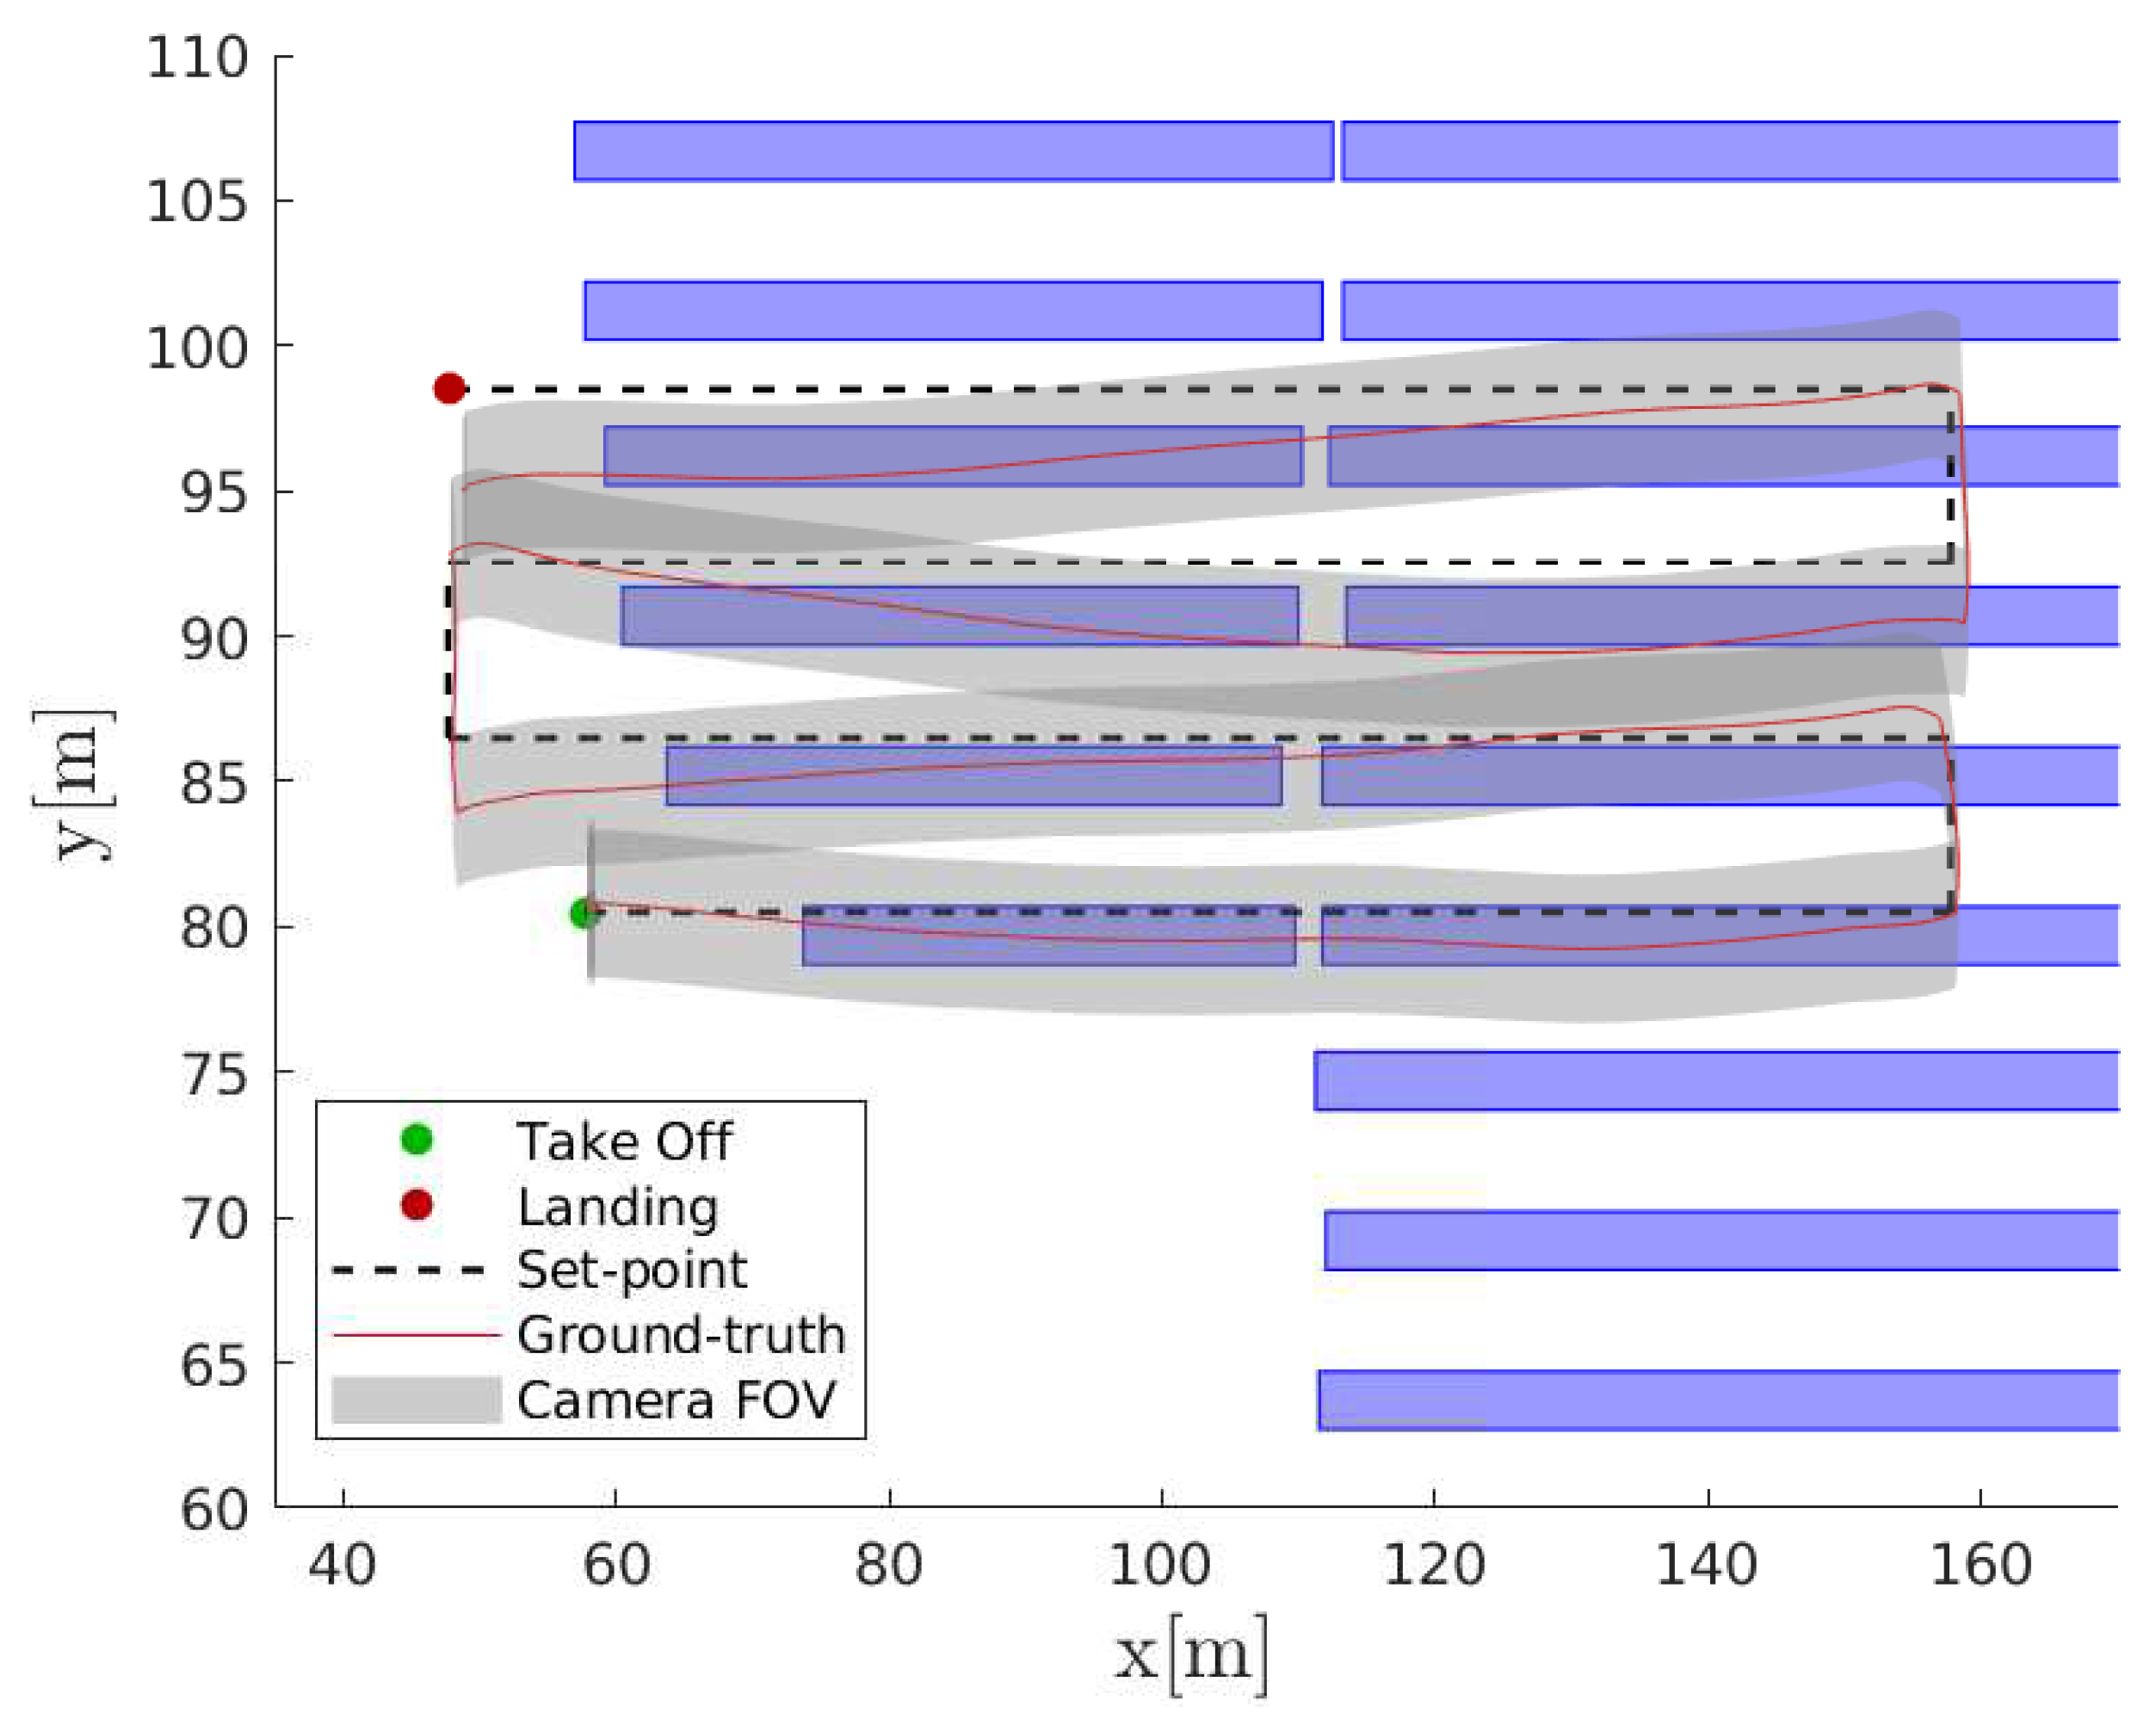
Conversely, in Figure 14, the results related to the proposed correction are reported. It is worth noting that, in this case, the UAV platform is able to correct the pre-planned setpoints due to information coming from the captured images (the so called fly by sensor) and modifies its trajectory going towards the target PV row. In this way, the camera FOV is able to completely cover the desired target. The only exception to this positive corrective effect regards the transition between one row to another in which the correction mechanism requires some time to take place. To mitigate this effect, it is recommended to properly adjust UAV flight speed in those transition between one row to another.

6. Conclusions

In this paper, the problem of improving the performance of automatic inspection for PV plants has been considered and a vision-based guidance law has been developed in this scope.
The proposed technique exploits information from sensors that are already installed onboard, thus it does not require relevant additional equipment costs with respect to traditional UAV flights. In addition, the automatic inspection cost compared to the energy production of a more than 4 MW PV plant is fully payback in one year considering just a 1.5% rate of PV module failures.
A dynamic compensator, which takes as input the sensor camera information, has been employed through the combination of a Canny edge-detector and a Hough transform, giving as output the needed correction to the set-point position to reject errors with respect to the desired trajectory. To validate the overall system, resembling application on a real hardware, the PX4 firmware software-in-the-loop testing environment has been used. In particular the Gazebo modeling environment has been exploited, thanks to its capability to test sensors’ feed like visual cameras. The results show that the approach is successful in reducing the number of pictures with incomplete coverage of the target PV row if compared to the state of the art solutions. Note that the developed vision algorithm runs in real-time in simulation and that tests on a typical embedded computer of a UAV (NanoPi NEO Air: http://wiki.friendlyarm.com/wiki/index.php/NanoPi_NEO_Air) show a computational time of less than 50 ms on a 640 × 360 pixels image.
Possible limitations of the proposed approach regard the robustness of vision-based methods against changes in lighting and environmental conditions. Comparing the results with the state-of-the-art of visual servoing presented in the introduction, higher steady-state positioning errors can be highlighted. This is because, in direct visual servoing, the captured images are used in the system feedback to improve in real-time the robot accuracy. On the other hand, that kind of controller rates are bounded by the vision system frequency, possibly leading to stabilization problems. In the proposed solution, the system simply change the set-point position, whereas stabilization is guaranteed by the low-level controller even in the presence of faults of the vision system.
Image quality is a key factor in automated and semi-automated image processing techniques that are very often used in PV plant inspection. The results found in this paper shows that the proposed technique can improve drastically the image quality for autonomous flight. Moreover, with this technique the flight altitude can be reduced, and thus the resolution of the images can be higher with a fixed equipment.
This manuscript may represent a very important step toward the autonomous flight and UAV-based automatic monitoring operations in energy plants. In particular, for large-scale PV plants, where the cost-performance ratio is a crucial aspect and manned lights are difficult due to typical harsh environments, fly-by-sensor automatic flights allow higher accuracy and more frequent inspection giving a more updated plant status report.

Author Contributions

Conceptualization, G.R., F.G., and M.L.; Investigation, G.R., A.N., and F.G.; Methodology, G.R., A.N., and M.L.; Project administration, F.G. and M.L.; Software, G.R.; Supervision, F.G. and M.L.; Validation, A.N.; Visualization, A.N.; Writing—original draft, G.R., A.N., F.G., and M.L. All authors have read and agreed to the published version of the manuscript.

Funding

This research received no external funding.

Acknowledgments

The authors thanks the Alta Scuola Politecnica and in particular the FBS-PV team.

Conflicts of Interest

The authors declare no conflict of interest

List of Symbols

R g r o u n d ground resolution.
R p h o t o picture resolution.
d p i c t u r e picture distance.
Hcruise altitude.
ffocal length.
xdrone position.
x 0 drone position set-point.
G x ( s ) position dynamics transfer function.
R x ( s ) position controller transfer function.
F ( s ) complementary sensitivity of position control system.
n G N S S GNSS measurement noise.
n M A P map georeferencing error.
x ˜ 0 position set-point received by the control system.
n x 0 simultaneous effect of noise n G N S S and n M A P
n C A M camera noise.
Γ ( s ) compensator transfer function.
K p compensator proportional gain.
K i compensator integral gain.

Acronyms

UAVUnmanned Aerial Vehicle.
PVPhotovoltaic.
GNSSGlobal Navigation Satellite System.
SITLSoftware in the loop.
GCSGround Control Station.
FOVField of View.
APIApplication Programming Interface.

References

  1. Grimaccia, F.; Leva, S.; Dolara, A.; Aghaei, M. Survey on PV Modules’ Common Faults After an O&M Flight Extensive Campaign Over Different Plants in Italy. IEEE J. Photovolt. 2017, 7, 810–816. [Google Scholar] [CrossRef] [Green Version]
  2. Packard, C.E.; Wohlgemuth, J.H.; Kurtz, S.R. Development of a Visual Inspection Data Collection Tool for Evaluation of Fielded PV Module Condition; Technical Report; National Renewable Energy Lab. (NREL): Golden, CO, USA, 2012. [Google Scholar]
  3. Bradley, A.Z.; Meyer, A.A. Economic impact of module replacement. In Proceedings of the 2016 IEEE 43rd Photovoltaic Specialists Conference (PVSC), Portland, OR, USA, 5–10 June 2016; pp. 3492–3494. [Google Scholar]
  4. Peng, P.; Hu, A.; Zheng, W.; Su, P.; He, D.; Oakes, K.D.; Fu, A.; Han, R.; Lee, S.L.; Tang, J.; et al. Microscopy study of snail trail phenomenon on photovoltaic modules. RSC Adv. 2012, 2, 11359–11365. [Google Scholar] [CrossRef]
  5. Ebner, R.; Zamini, S.; Újvári, G. Defect analysis in different photovoltaic modules using electroluminescence (EL) and infrared (IR)-thermography. In Proceedings of the 25th European Photovoltaic Solar Energy Conference and Exhibition, Valencia, Spain, 6–10 September 2010; pp. 333–336. [Google Scholar]
  6. Cristaldi, L.; Faifer, M.; Lazzaroni, M.; Khalil, A.; Catelani, M.; Ciani, L. Failure modes analysis and diagnostic architecture for photovoltaic plants. In Proceedings of the 13th IMEKO TC10 Workshop on Technical Diagnostics, Advanced Measurement Tools in Technical Diagnostics for, Systems’ Reliability and Safety, Warsaw, Poland, 26–27 June 2014. [Google Scholar]
  7. Grimaccia, F.; Aghaei, M.; Mussetta, M.; Leva, S.; Quater, P.B. Planning for PV plant performance monitoring by means of unmanned aerial systems (UAS). Int. J. Energy Environ. Eng. 2015, 6, 47–54. [Google Scholar] [CrossRef] [Green Version]
  8. King, D.L.; Kratochvil, J.; Quintana, M.A.; McMahon, T. Applications for infrared imaging equipment in photovoltaic cell, module, and system testing. In Proceedings of the Conference Record of the Twenty-Eighth IEEE Photovoltaic Specialists Conference-2000 (Cat. No. 00CH37036), Anchorage, AK, USA, 15–22 September 2000; pp. 1487–1490. [Google Scholar]
  9. Vergura, S.; Marino, F.; Carpentieri, M. Processing infrared image of PV modules for defects classification. In Proceedings of the 2015 International Conference on Renewable Energy Research and Applications (ICRERA), Palermo, Itly, 22–25 November 2015; pp. 1337–1341. [Google Scholar]
  10. Grimaccia, F.; Leva, S.; Niccolai, A. PV plant digital mapping for modules’ defects detection by unmanned aerial vehicles. IET Renew. Power Gener. 2017, 11, 1221–1228. [Google Scholar] [CrossRef]
  11. Li, X.; Yang, Q.; Lou, Z.; Yan, W. Deep Learning Based Module Defect Analysis for Large-Scale Photovoltaic Farms. IEEE Trans. Energy Convers. 2018, 34, 520–529. [Google Scholar] [CrossRef]
  12. Niccolai, A.; Grimaccia, F.; Leva, S. Advanced Asset Management Tools in Photovoltaic Plant Monitoring: UAV-Based Digital Mapping. Energies 2019, 12, 4736. [Google Scholar]
  13. Gallardo-Saavedra, S.; Hernández-Callejo, L.; Duque-Perez, O. Image resolution influence in aerial thermographic inspections of photovoltaic plants. IEEE Trans. Ind. Inform. 2018, 14, 5678–5686. [Google Scholar] [CrossRef]
  14. Aghaei, M.; Dolara, A.; Leva, S.; Grimaccia, F. Image resolution and defects detection in PV inspection by unmanned technologies. In Proceedings of the 2016 IEEE Power and Energy Society General Meeting (PESGM), Boston, MA, USA, 17–21 July 2016; pp. 1–5. [Google Scholar]
  15. Roggi, G.; Giurato, M.; Lovera, M. A computer vision line-tracking algorithm for UAV GNSS-aided guidance. In Proceedings of the XXV International Congress of the Italian Association of Aeronautics and Astronautics, Rome, Italy, 9–12 September 2019. [Google Scholar]
  16. Hutchinson, S.; Hager, G.D.; Corke, P.I. A tutorial on visual servo control. IEEE Trans. Robot. Autom. 1996, 12, 651–670. [Google Scholar] [CrossRef] [Green Version]
  17. Sanderson, A.C.; Weiss, L.E. Image-based visual servo control of robots. In Robotics and industrial inspection; International Society for Optics and Photonics: Bellingham, WA, USA, 1983; Volume 360, pp. 164–169. [Google Scholar]
  18. Araar, O.; Aouf, N. Visual servoing of a Quadrotor UAV for autonomous power lines inspection. In Proceedings of the 22nd Mediterranean Conference on Control and Automation, Palermo, Italy, 16–19 June 2014; pp. 1418–1424. [Google Scholar]
  19. Mahony, R.; Hamel, T. Image-based visual servo control of aerial robotic systems using linear image features. IEEE Trans. Robot. 2005, 21, 227–239. [Google Scholar] [CrossRef]
  20. Azinheira, J.R.; Rives, P. Image-based visual servoing for vanishing features and ground lines tracking: Application to a uav automatic landing. Int. J. Optomech. 2008, 2, 275–295. [Google Scholar] [CrossRef]
  21. Frew, E.; McGee, T.; Kim, Z.; Xiao, X.; Jackson, S.; Morimoto, M.; Rathinam, S.; Padial, J.; Sengupta, R. Vision-based road-following using a small autonomous aircraft. In Proceedings of the 2004 IEEE Aerospace Conference Proceedings (IEEE Cat. No. 04TH8720), Big Sky, MT, USA, 6–13 March 2004; Volume 5, pp. 3006–3015. [Google Scholar]
  22. Paredes-Hernández, C.U.; Salinas-Castillo, W.E.; Guevara-Cortina, F.; Martínez-Becerra, X. Horizontal positional accuracy of Google Earth’s imagery over rural areas: A study case in Tamaulipas, Mexico. Boletim de Ciências Geodésicas 2013, 19, 588–601. [Google Scholar] [CrossRef] [Green Version]
  23. Ragheb, A.; Ragab, A.F. Enhancement of Google Earth Positional Accuracy. Int. J. Eng. Res. Technol. (IJERT) 2015, 4, 627–630. [Google Scholar]
  24. Jaafari, S.; Nazarisamani, A. Comparison between land use/land cover mapping through Landsat and Google Earth imagery. Am. J. Agric. Environ. Sci 2013, 13, 763–768. [Google Scholar]
  25. El-Hallaq, M. Positional Accuracy of the Google Earth Imagery in the Gaza Strip. J. Multidiscip. Eng. Sci. Technol. (JMEST) 2017, 4, 7249–7253. [Google Scholar]
  26. Khuwaja, Z.; Arain, J.; Ali, R.; Meghwar, S.; Ali Jatoi, M.; Shaikh, F. Accuracy Measurement of Google Earth Using GPS and Manual Calculations. In Proceedings of the International Conference on Sustainable Development in Civil Engineering (ICSDC 2017), Jamshoro, Pakistan, 5–7 December 2018. [Google Scholar]
  27. Kayton, M.; Fried, W.R. Avionics Navigation Systems; John Wiley & Sons: Hoboken, NJ, USA, 1997. [Google Scholar]
  28. Bačić, Ž.; Šugar, D.; Grzunov, R. Investigation of GNSS Receiver’s Accuracy Integrated on UAVs. In Proceedings of the Surveying the World of Tomorrow-From Digitalisation to Augmented Reality, Helsinki, Finland, 29 May–2 June 2017. [Google Scholar]
  29. Leva, S.; Aghaei, M.; Grimaccia, F. PV power plant inspection by UAS: Correlation between altitude and detection of defects on PV modules. In Proceedings of the 2015 IEEE 15th International Conference on Environment and Electrical Engineering (EEEIC), Rome, Italy, 10–13 June 2015; pp. 1921–1926. [Google Scholar]
  30. Lowe, D.G. Distinctive image features from scale-invariant keypoints. Int. J. Comput. Vis. 2004, 60, 91–110. [Google Scholar] [CrossRef]
  31. Bay, H.; Tuytelaars, T.; Van Gool, L. Surf: Speeded up Robust Features; European Conference on Computer Vision; Springer: Berlin, Germany, 2006; pp. 404–417. [Google Scholar]
  32. Dalal, N.; Triggs, B. Histograms of oriented gradients for human detection. In Proceedings of the 2005 IEEE Computer Society Conference on Computer Vision and Pattern Recognition (CVPR’05), San Diego, CA, USA, 20–25 June 2005; Volume 1, pp. 886–893. [Google Scholar]
  33. Ahonen, T.; Hadid, A.; Pietikäinen, M. Face Recognition With Local Binary Patterns; European Conference on Computer Vision; Springer: Berlin, Germany, 2004; pp. 469–481. [Google Scholar]
  34. Zhang, Y.; Dai, S.; Song, W.; Zhang, L.; Li, D. Exposing Speech Resampling Manipulation by Local Texture Analysis on Spectrogram Images. Electronics 2019, 9, 23. [Google Scholar] [CrossRef] [Green Version]
  35. Abdel-Nasser, M.; Moreno, A.; Puig, D. Breast Cancer Detection in Thermal Infrared Images Using Representation Learning and Texture Analysis Methods. Electronics 2019, 8, 100. [Google Scholar] [CrossRef] [Green Version]
  36. Roberts, L.G. Machine Perception of Three-Dimensional Solids. Ph.D. Thesis, Massachusetts Institute of Technology, Cambridge, MA, USA, 1963. [Google Scholar]
  37. Prewitt, J.M. Object enhancement and extraction. Pict. Process. Psychopictorics 1970, 10, 15–19. [Google Scholar]
  38. Sobel, I.; Feldman, G. An 3x3 Isotropic Gradient Operator for Image Processing. In Pattern Classification and Scene Analysis; John Wiley & Sons: New York, NY, USA, 1973; pp. 271–272. [Google Scholar]
  39. Canny, J.F. A Computational Approach to Edge Detection. In Readings in Computer Vision; Fischler, M.A., Firschein, O., Eds.; Morgan Kaufmann: San Francisco, CA, USA, 1987; pp. 184–203. [Google Scholar] [CrossRef]
  40. Hough, P.V.C. Method and Means for Recognizing Complex Patterns. U.S. Patent 3,069,654, 18 December 1962. [Google Scholar]
  41. PX4. Available online: https://px4.io/ (accessed on 20 December 2019).
  42. MAVLink. Available online: https://mavlink.io/en/ (accessed on 20 December 2019).
  43. Gazebo. Available online: http://gazebosim.org/ (accessed on 20 December 2019).
  44. Open Source Robotic Foundation. ROS. Available online: https://www.ros.org/ (accessed on 20 December 2019).
Figure 1. Example of mission planning in the form of waypoints.
Energies 13 00838 g001
Figure 2. Conventional position control for a multirotor unmanned aerial vehicle (UAV).
Energies 13 00838 g002
Figure 3. Position control with set-point error.
Energies 13 00838 g003
Figure 4. Simplified position control with set-point error.
Energies 13 00838 g004
Figure 5. Simplified position control with camera measurement and compensator.
Energies 13 00838 g005
Figure 6. Original image acquired from the UAV and the results of the Canny edge detector.
Energies 13 00838 g006
Figure 7. Hough transformation and principal lines. (a) Graphical representation of the output of Hough transform. (b) Result of the selection of the principal lines.
Energies 13 00838 g007
Figure 8. Mean line and comparison with the desired one.
Energies 13 00838 g008
Figure 9. Example of Gazebo simulator.
Energies 13 00838 g009
Figure 10. PV plant map.
Energies 13 00838 g010
Figure 11. PV plant in the Gazebo simulator.
Energies 13 00838 g011
Figure 12. Planned route.
Energies 13 00838 g012
Figure 13. UAV trajectory for the non-correction case with camera FOV.
Energies 13 00838 g013
Figure 14. UAV trajectory for the correction case with camera field of view (FOV).
Energies 13 00838 g014
Table 1. Example of required ground resolutions for some typical defects.
Defects R ground [pixel/cm]
Snail Trail8–10
Dirty3–5
White Spot2–3
Encapsulant discoloration2–3
Other6–8