1. Introduction
The energy performs an overriding part in the economic growth (EG) of every economy and is also a definitive constituent for its prosperity because numerous production and consumption activities implicate energy as an elementary input. In addition to investment and labor, it is deliberated as a third imperative production element in economic models [
1]. It associates with ELS, EG and societal steadiness. Electricity is an imperative form of energy and is regarded as the foundation of energy that assists each phase of any economy [
2,
3,
4,
5]. From a natural point of observation, the usage of electricity motivates monetary efficiency and industrial evolution and is very significant for the operation of every contemporary economy [
6]. The significance of the electricity supply was recognized in the beginning of the 20th century. It was the time when the data on supply and demand of electricity became widely accessible. During the industrialization era of the last century, electricity use enhanced briskly and its demand almost doubled. The slight decline in EC (electricity consumption) was noted during the subsequent war retrieval era. The similar trends of an empirical assessment of EG and EC were recorded for the USA. It was this opinion which attained consideration of academics to explore this liaison between EC and EG in order to demonstrate the causal correlation of its nature.
The link between EC and EG is significant and pertinent—even in an industrializing economy. Imperative factors that may affect the relationship between ES and EG could cause oscillations in energy prices, climate variations, energy security and environmental issues. It is also significant to note what type of energy origins are being applied for power generation. If non-renewable sources, e.g., coal, are vigorously utilized, a possible outcome may be great intensities of carbon discharges into the environment. In contrast, in a situation of the inadequate yield of energy raw resources, there could be issued a confirming permanency of reproduction progression, which would affect the speed of financial development. This condition is relatively correlated with emerging economies. Nowadays, several developing economies have power scarcity issues. A suitable and sustainable ES may perhaps be one of the utmost critical elements, which supports economic development in evolving nations [
7]. For instance, South Africa produced 92% of its electricity from coal, which caused 42% of emissions across the continent [
8]. This has caused an imbalance between demand and ELS. This has resulted in turmoil in the industrial sector in the country and therefore EG [
9].
Pakistan, a South Asian economy, is passing through a severe power crisis due to policy failures in the energy sector, which leads to the miserable monetary conduct of the republic. The demand of electricity is driven by populace evolution along with additional dynamics such as tariffs, migration to metropolises and weather. Nevertheless, the major cause of electricity scarcity and this crisis is mainly instigated by larceny, exploitation, and unnecessary wastage of electricity, irrationally instigating massive line losses, maladministration, corruption, institutional weakness, and political involvement [
10]. The population of the country is on a rise, which in turn increases the electricity demand [
11]. The electricity supply has not been consistent with population growth and electricity demand, which has resulted in frequent unscheduled outages. These circumstances have caused problems for industries and have hindered FDI in the country [
12,
13,
14,
15].
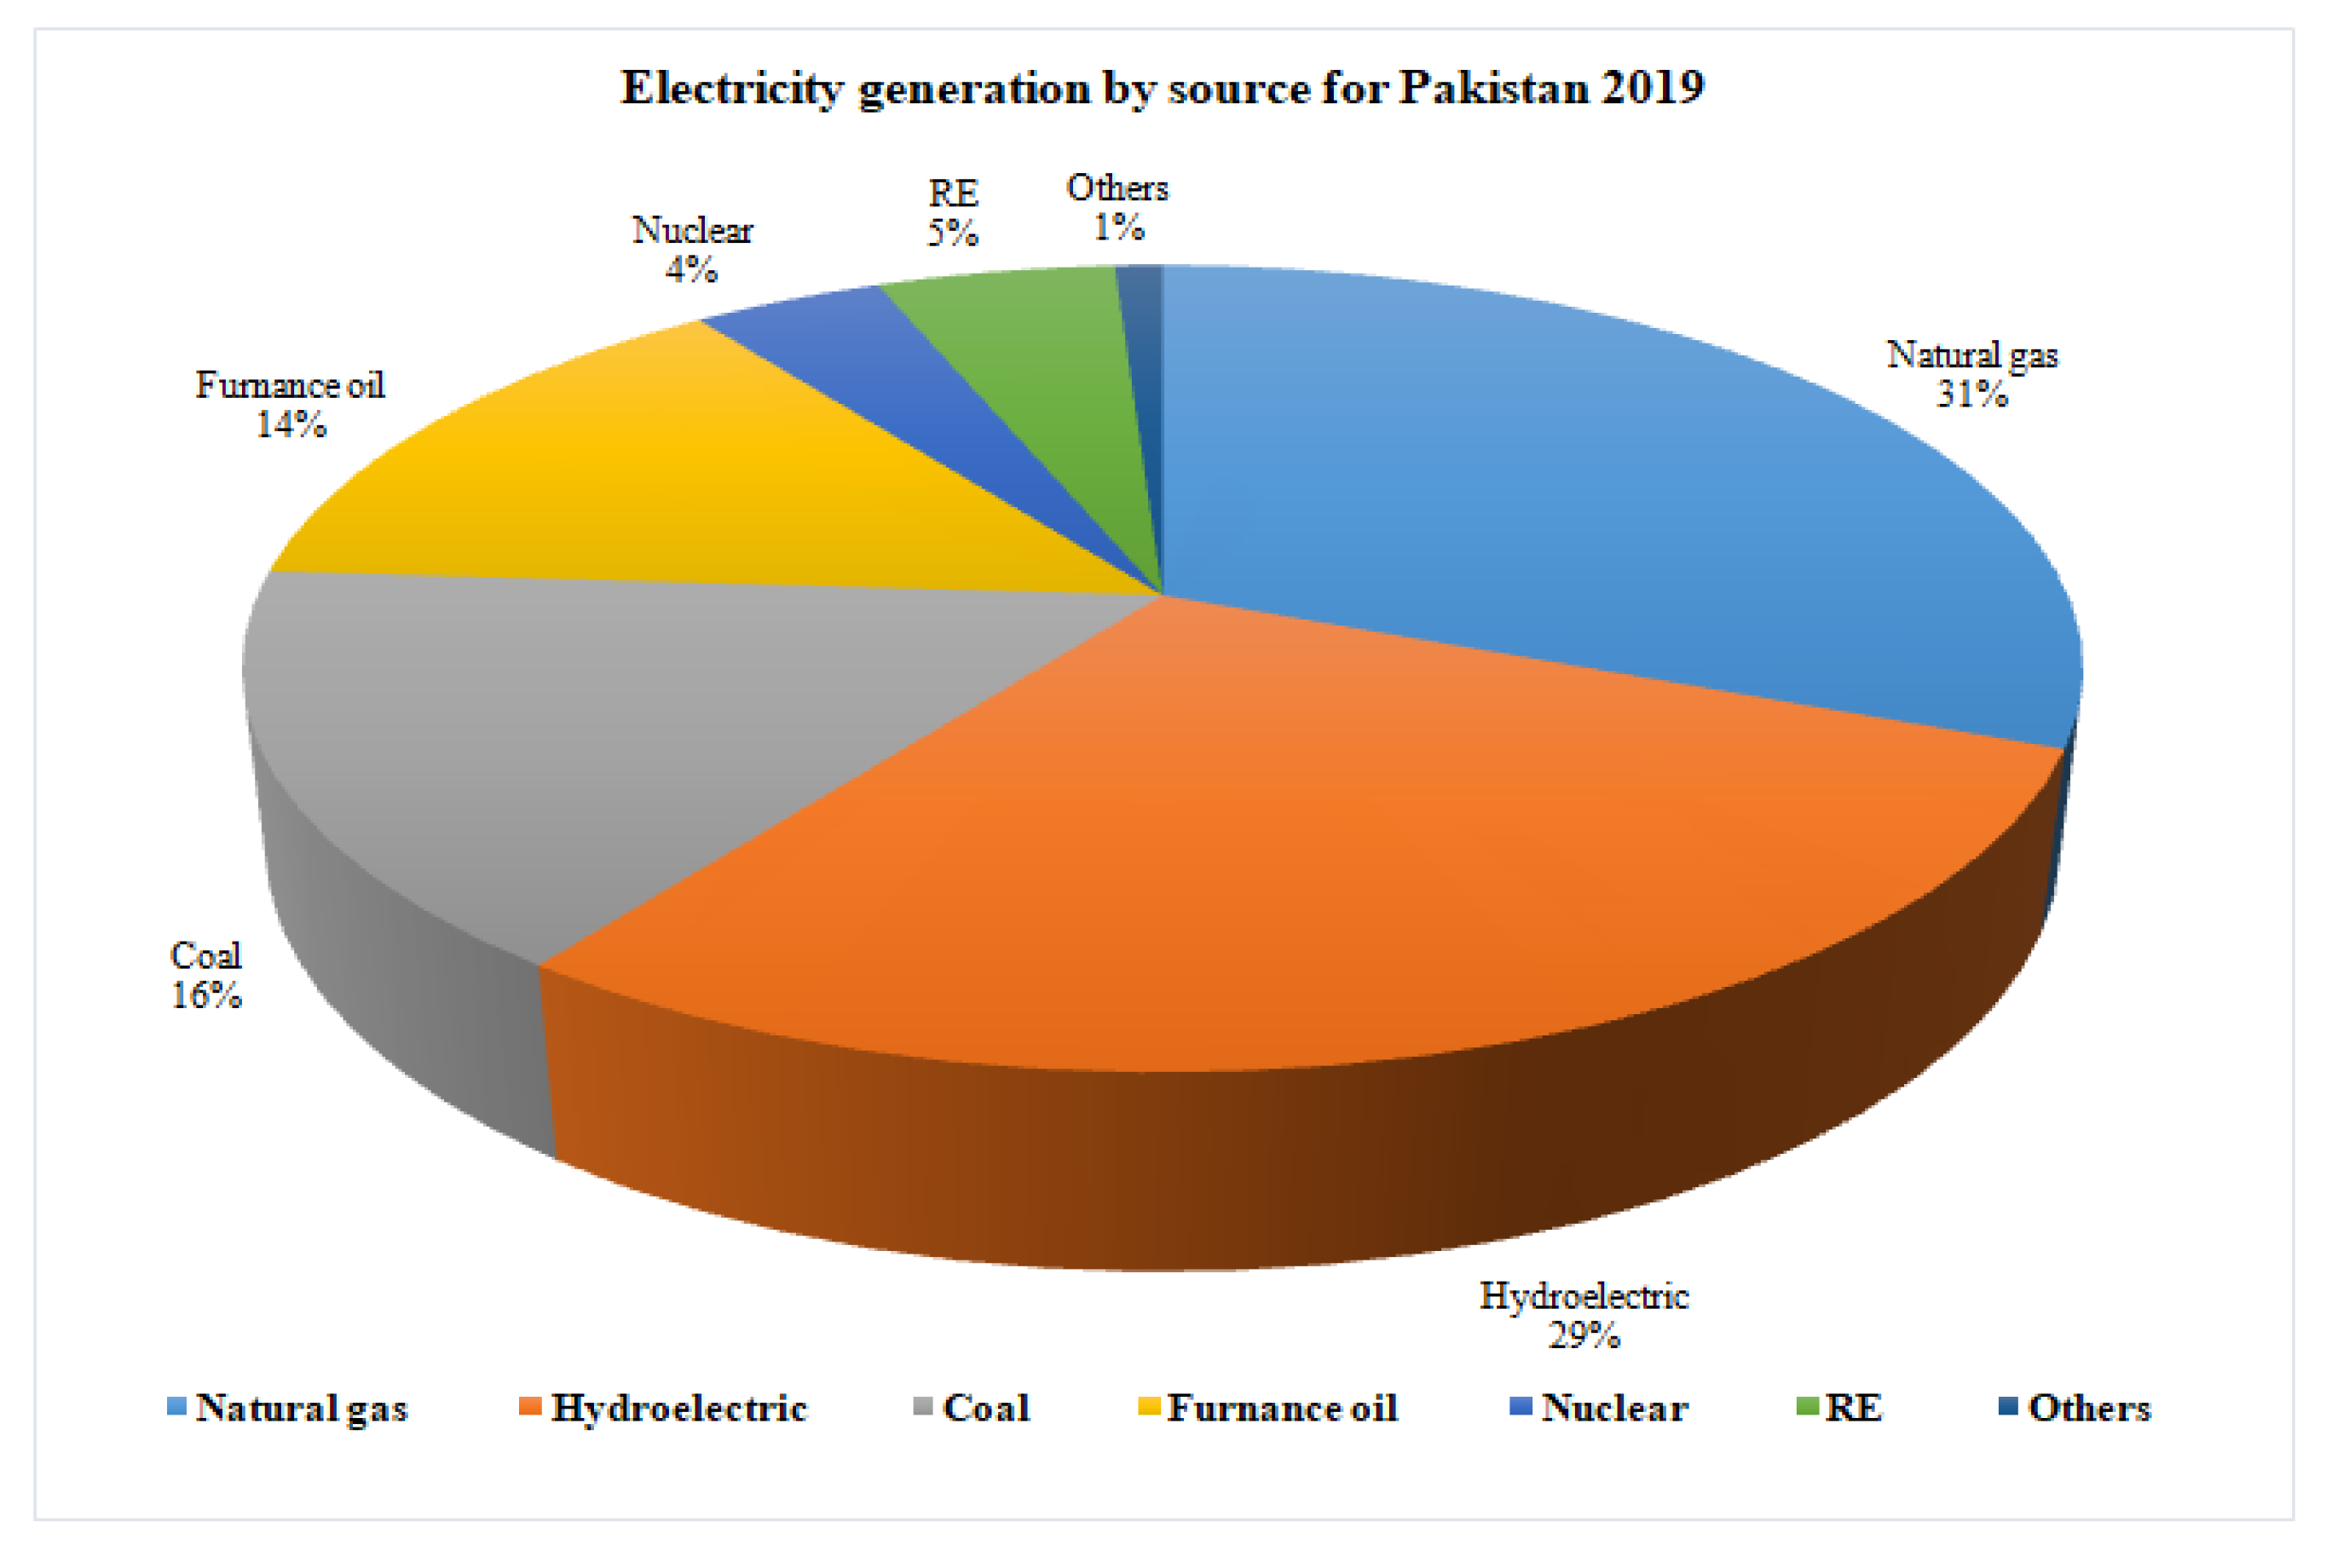
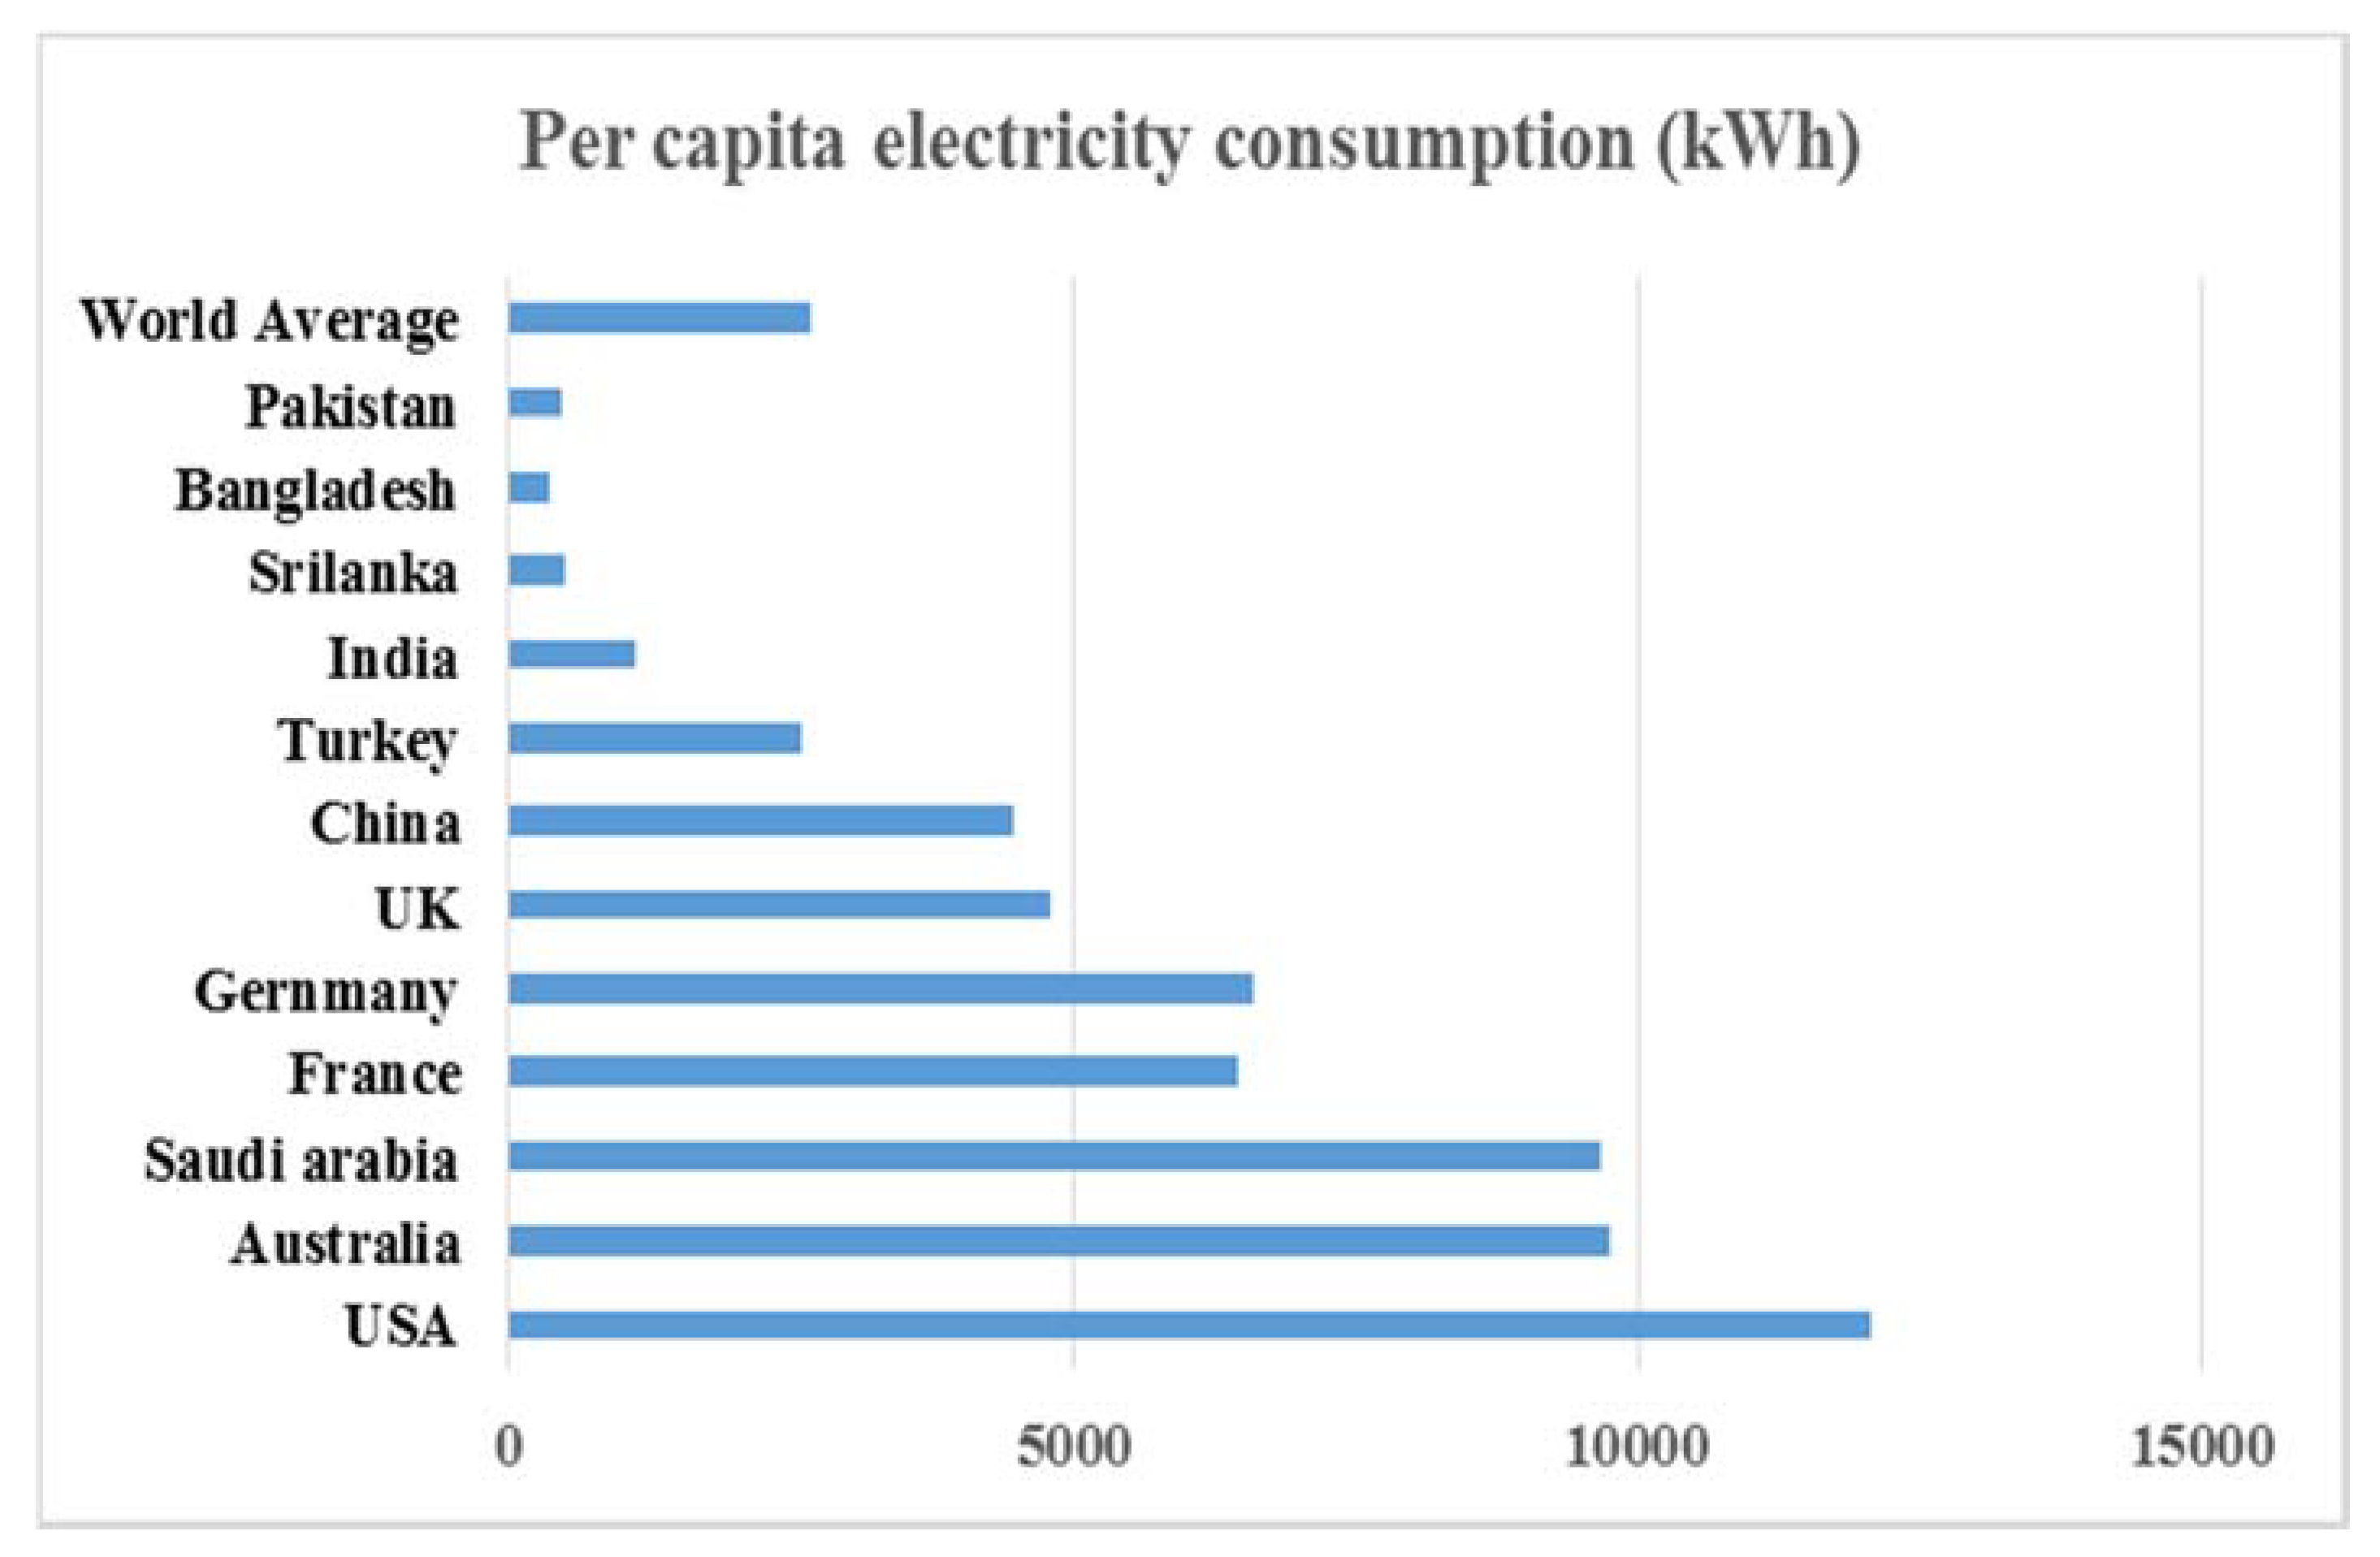
Pakistani energy division has been described by scarcity and resource restraints. Total installed capability to produce electricity as by February 2019 stands at 33,836 MW, consisting of 31% natural gas, 29% hydro, 16% coal, 14% furnace oil, 5% renewables (solar and wind), 3% nuclear, and 1% other sources (Bagasse, waste heat recovery, etc.). The total ELS have increased during 1990–2015. Nevertheless, factually it has been established that capability extension continuously remains short behind of the objective. On the consumption side, per capita electricity consumption was 971 kWh annually for the year 2015–2016, which is one of the lowermost in the world.
The connection between EC and EG has experienced broad exploration after oil impediments in the 1970s. The central issue has been if EC stimulates EG, or whether the EG itself is an incitement for EC through the indirect medium of significant cumulative demand, enhanced total efficacy and scientific growth. Brown and Yucel [
16] deliver a study of the concept and indication on the macroeconomic influence of energy rates. The association between EC and EG was also determined as well as tariff effects. The level of EC may be considered as an indication of EG and socioeconomic progress of a country. Multiple investigations have attempted to observe the causality link between EC and EG. Some other researchers [
17,
18] delivered some useful outcomes related to Granger causality between EG and EC for multiple economies. Nevertheless, it has been evident from these studies that the specific role of EC in EG has presented diverse outcomes across countries and time periods. Gosh [
19] studied co-integration and Granger casuality for India by applying the Joahnsen and Juselius method. This work was not able to find a cointegration link but established short-run Granger casuality directing from EG to EC lacking any feedback effect.
The liaison between EC and EG was vastly investigated by means of the theory of Granger causality. Granger causality does not suggest that ‘X causes Y’, as in traditional logic. Rather, as Diebold [
20] proposes it, ‘X causes Y’ in the Granger logic proposes that ‘X comprises valuable evidence for forecasting Y’. Until now, there is a deficiency of agreement in the literature. The primary cause for this disagreement could be the omitted variables in the Granger causality investigations. Enquiries which investigated Granger causality in a bi-variate context are most likely influenced by the exclusion of pertinent variables influencing EC and EG [
21]. As a result, few Granger causality inquiries determining the nexus between EC and EG have introduced other related variables such as investment besides labor [
22], occupation [
23], exports [
24], chemical emanations [
25], prices [
26], or urbanization [
27]. Multiple prevailing Granger causality inquiries of energy-GDP correlation, which used a bivariate context, have been unsuccessful to discover indication of co-integration and long-run causation, demonstrating the application of bivariate scheme [
28,
29,
30]. Taking into consideration these constraints, it is essential to reconsider the link between energy and EG together with related variables in the Granger casuality agenda, specifying its consequences for energy preservation.
A few studies of the energy–GDP link also applied the multivariate context [
31,
32,
33,
34,
35,
36,
37,
38,
39,
40]. Govindaraju et al., [
41], incorporated prices together with EC and EG, Ang [
25], used greenhouse gasses emission along with EC and EG, whereas Lean and Smyth [
42], used investment, exports and labor besides EC and EG. This work adds more to the literature by determining the link between electricity generation, EG, prices and exports. A four VAR instance includes additional evidence than the bivariate setting, causing casual conclusion drawn further reliable [
43,
44,
45]. Some studies used electricity generation instead of electricity consumption. Yoo and Kim [
45] (for Indonesia) and Ghosh [
46] (for India) used this technique in emergent economies as T and D losses are frequently extraordinary. According to WB [
47], these losses in evolving republics are two to four times greater when compared to OECD economies [
48]. As a consequence, EC statistics are underrated. On the other hand, it is more useful to use electricity production as a suitable representation for electricity. We used investment due to its significance in prompting EC and income.
Including ELS, exports, EG and investment in the lone model efficiently marries the Granger casuality literature with the energy–GDP interconnection and exports–GDP link. This type of methodology was used by Narayan and Smyth [
23], who presented a panel statistics enquiry for the Middle East. In this exploration, writers used export elevation approaches to understand the great degree of EG [
49]. Lean and Smyth [
42] examined the Granger casuality between EG, EC and trades for Malaysia; however, they used EC instead of electricity supply, which is less suitable for an evolving economy, as we have discussed. The main aim of this enquiry was to review the electricity–GDP link in Pakistan, as this study diverges from former studies on the subsequent features:
Firstly, this study applies statistics on ELS in a state such as Pakistan, where there are high R and D losses, primarily due to larceny, corruption, mismanagement, institutional issues and ancient infrastructure. Conversely, apart from these losses, entire electricity generated aids to GDP. This provides a possible motivation for applying ELS as a variable instead of demand. Yoo and Kim, 2006 [
45] examined a causative link between ELS and EG for Indonesia by employing a time series approach for the era of 1971–2002.
Secondly, the work applied a multi-variate technique over a bivariate technique due to description bias due to the exclusion of appropriate variables [
50,
51,
52]. Different from former studies e.g., Chang et al., 2001 [
50]; Narayan and Smyth, 2005 [
23]: Gosh, 2009 [
46], this study includes investment and export along with ELS and GDP.
Thirdly, the sample period for investigation is from 1990–2015. The period for the enquiry has been governed by the accessibility of data, which is available simultaneously for all four variables from 1990 onwards.
2. Hypothesis
The first set of the competing hypothesis is associated with the correlation between ES and GDP. The relationship between ES and GDP can be explained by four hypotheses. They include growth, conservation, feedback and neutrality hypothesis. These hypotheses about the energy-GDP link have imperative strategy insinuations. Provided that there is uni-directional Granger casuality directing from GDP to ES or no Granger causativeness in either way, it could be concluded that energy preservation strategies have a minute or no adversative consequence on EG. In contrast, when uni-directional Granger causativeness directs from ES to GDP, declining ES in the market may perhaps result in a drop in income, while an upsurge in ES contributes toward EG.
The second set of opposing hypothesis is related to the causal link between exports and GDP. The hypotheses have been deliberated in exports-GDP link literature. The export run hypothesis elaborates that Granger casuality directs from exports to GDP. There could be multiple causes of Granger causativeness direct from exports to GDP [
53]. Exports escalate GDP as they are constituent of GDP in state accounting. Indirectly, economies with more exports to GDP ratio are more prone to external impacts and produce externalities, e.g., inducement to innovate. These efficacy advantages enhance GDP through enhancing TFP in the Solow-Swan growth accounting context. The contending hypothesis that Granger causativeness directs from GDP to exports is taken in deviations of concepts of trade [
53], or contention that growth instruments that are internally created best clarify the evolution of exports [
54]. Assuming there is a rise in TFP caused by technical advancements that are autonomous from trade, the proportional price arrangement, such as economy, will possibly develop in a mode that is constant with increasing exports [
55].
The third array of the conflicting hypothesis is associated with the connection between exports and ES. If Granger causativeness directs from ES to exports, declining ES could obstruct efforts to increase exports as a source of EG. Conversely, if there is Granger casuality directing from exports to ES or no Granger causality directing in whichever direction, it tracks that energy management programs might be anticipated to have no adversarial consequence on export progression.
The fourth set of hypothesis discusses the connection between investments, ELS, EG, and exports. A rise in investment may result in an enhancement in ES, while an enhancement in ELS may lead to more investment. Ultimately, an increase in investment may result in more exports and raise economic growth.
3. Pakistani Perspective
Pakistan is administrated by a central legislative constitution. It is the sixth outmost populated nation with inhabitants of more than 200,000 million persons and a relatively high populace growth level of 1.5% [
56]. It is a quasi-industrialized state with a respectable textile, food processing and agriculture support and a per capita GDP of 1561 USD. Conferring to WB, Pakistan has significant tactical bequests and progress possibilities. It has the 10th biggest labor market internationally and it is 67th among worldwide exporters [
57].
Traditionally, Pakistan is one of the biggest oil importers and is largely reliant on fossil fuels. With the upsurge of fossil fuel costs, the price of importing oil is causing a loss for the country’s FX reserves. The mounting cost of oil along with the growing demand for continuous electricity supply is building an extra burden on the previously delicate ELS network of Pakistan. Consequently, to meet this mounting demand, the government has allotted a huge investment in their energy expansion portfolio [
58,
59,
60].
Over the past few decades, the increase in power outages and per capita EC in Pakistan lurched the state into a relentless power calamity, resulting in meager monetary conduct of the country. It has urged the policymakers to look for measures to enhance the electricity supply and to upgrade electricity infrastructure including generation, transmission, and distribution. Electricity organization scheduling is jointly associated with the electricity demand and upsurge of GDP—particularly in an emergent republic such as Pakistan. Jamil and Ahmad determined unidirectional causality between EG and EC, which suggests growing electricity demand with greater EG [
61]. The electricity demand increase is remarkably owed to a steady 6% GDP growth annually from 2002 to 2007 and with no structure development in electricity division, economy encountered huge power outages, which led to a 2.5% damage to GDP, 0.535 million job cuts and damage to exports of value
$1.3 billion in 2010 [
62].
Energy plays a governing part in economic development and also is an essential element of every state’s economy. It associated with energy safety, EG and social permanence. Energy economics is a systematic investigation of assigning sources for ELS to a civilization. It is severely dependent on strategies and demand and supply interaction of the energy market, which is the primary cause of ambiguity for energy managers, which generally emphasizes providing an atmosphere for resource ventures in energy division [
63].
Evidently, forthcoming energy strategy coordination is generally founded on various economic factors along with political and environmental parameters that decide the expertise to be used to approach impending energy demand. The power sector in Pakistan has been disastrous due to insufficient maintenance of power plants, exploitation of subventions in power charges and defective anticipating of the energy mix that could lead to a non-coverable deficit of electricity [
64], and accumulation of huge circular debt [
65,
66]. Moreover, there are numerous problems in Pakistan related to energy security and infrastructure expansion for a consistent supply of electricity that will also stimulus forthcoming policy implications.
The installed capacity to produce electricity of Pakistan is almost 33,836 MW by February 2019, which was approximately 23,337 MW in 2015, indicating the progression of 45% in five years. This capacity was almost 21,036 MW in 2011 [
67,
68]. Electricity production sources mainly comprise of thermal energy (oil and gas) hydropower and nuclear power. Presently, Coal and RE are performing a minor part; however, they are anticipated to be increased in imminent years [
69]. The recognized renewable energy sources are generally wind energy, solar energy and biomass. Thermal, hydropower and nuclear power plants are the constituents of the hybrid electric industry in Pakistan [
70] (
Figure 1). Additionally,
Table 1 compares electricity sources as the percentage of total electricity generated by emerging economies. It is obvious from this comparison that emerging countries such as India, China, Brazil, and South Africa have steadily enhanced their energy sources, differentiating into cleaner and effective energy sources. Amongst all these countries, only Pakistan has constantly persisted on similar energy sources for the period of years deliberated.
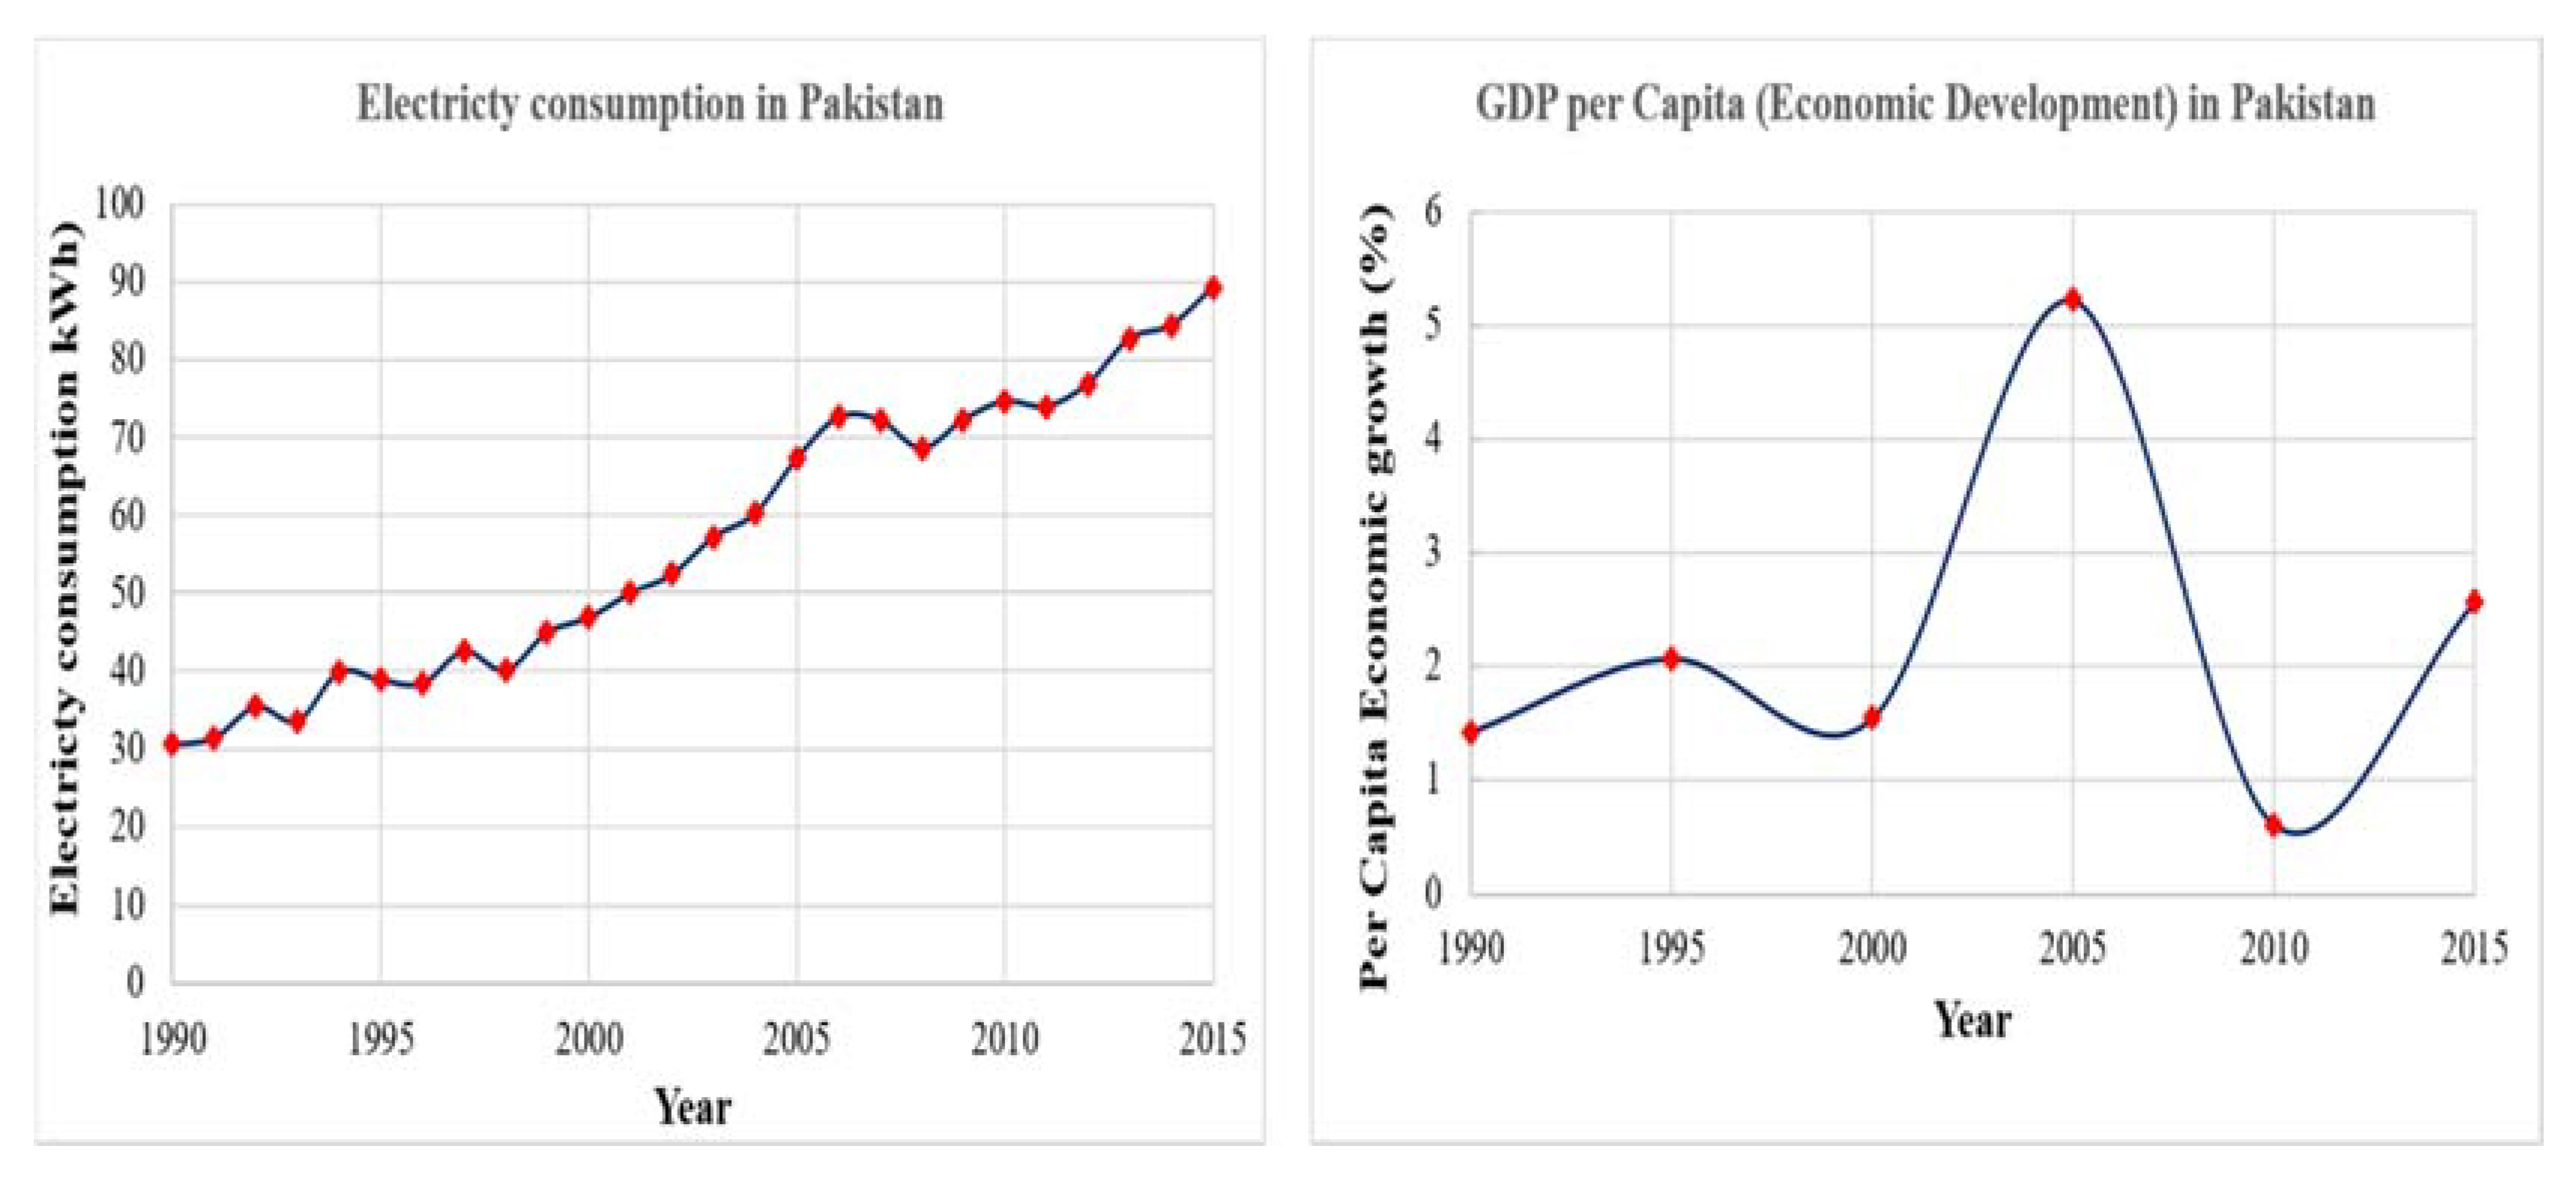
The electricity supply of Pakistan has steadily preserved an ascending inclination. Pakistan displays a slower rate of progress in electricity supply, as shown in
Figure 2. This discloses that ES may translate into EG and serves as the main factor for the progressing economy of a country. In the same way, per capita economic growth (%) has constantly been escalating. From 2005 to 2010, a decline was noticed and subsequently a gradually rise has been noted. The problem of power losses has been a prime concern for electricity supplying companies in Pakistan (
Figure 3). This issue is caused by inefficient and old T and D networks.
In the future, the demand for electricity will augment in various segments, together with manufacturing, building, education, farming and significantly, in sustainable growth to lift economic division [
71]. Most of this supplied electricity is coming from thermal sources [
72], which are also causing huge damage to the environment. The demand for electricity in Pakistan is dictated by multiple factors, e.g. rising population, urban influx, economic development, weather and electricity cost. Conversely, an explicit issue faced by the country is electricity scarcity, which was instigated by larceny and extreme consumption of electricity, leading to massive damage to the power grid and misconduct in mega-power ventures [
73,
74]. Pakistan undergoes energy deficiency due to production and supply.
3.1. Power Segment Arrangement in Pakistan
The administrative arrangement of Pakistan’s electricity sector primarily comprised of four major divisions including WAPDA, PEPCO, PPIB, and KESC, the last one go through privatization in 2005, as shown in
Figure 4.
WAPDA is a semi-sovereign unit with legislative power that was formed in 1958 to manage the organization progress of power and water-related ventures. WAPDA was separated into binary discrete bodies, explicitly, WAPDA and PEPCO. WAPDA is responsible for hydro production and organization expansion. PEPCO comprises of four GENCOs, eight DISCOs, and NTDC, which are allocated the part to restructure, reform and transform these companies into profitable associations. PPIB deals with IPPs, which were brought into the organization as a result of the administration strategy that was presented in 1994 to entice private venture for thermal power production. KESC is solely a perpendicularly unified power corporation responsible for the production and distribution of electricity to metropolitan Karachi [
30]. The transmission section of the division is controlled by NTDC. NTDC is a state grid corporation with the independent transmission of electricity throughout Pakistan apart from KESC. Its main aim was to interconnect new power plants to the national grid, the formation of investment policies for transmission systems and grid stations. The distribution subdivision is accomplished by eight community DISCOs, which oblige final customers with an extra charge of electricity tariff retrievals. In recent years, per capita power consumption has enhanced [
75]. For that reason, it is essential to propose impeding demand side management of electricity (
Figure 5).
3.2. Exploration of Electricity Demand
The final customers are primarily classified as domestic, agriculture, industry and other utilities. The domestic segment covers predominately almost 80% of clients, which is expanding at an average of 3.6% per annum for the past decade, transforming the electricity grid into a complex system leading to enhanced trouble while it arises to forecast the load supervision at peak hours. The admittance to electricity to the population has relatively risen in the last few years [
76,
77]. The industrial customers are also expanding including textile, cement, and leather industries, which need constant electricity supplies [
78]. The commercial sector generally constitutes HT customers and is rising at 2.46% in regards to electricity clients [
79]. In the meantime, EC in agriculture sector is expanding 3.02% annually, granting employment to approximately half of the residents of the state [
80]. The sector wise exploration of the country indicates that strategies must be executed with the view to supply adequate electricity that is required to increase the production of industrial and service sectors since these segments are associated with electricity requirement than agriculture [
81].
3.3. Study of Electricity Supply
An EL in Pakistan is mainly concentrated on non-renewable resources. Fossil fuels supply a major portion of electricity production in the country. Fossil fuels are succeeded by hydropower, which is almost one-third of overall production [
82]. The installed capacity of electricity supply has enhanced predominantly in recent years. The difference between electricity generation and demand is basically a result of a circular debit problem in the supply chain system of electricity division.
The ELS is generally delivered by WAPDA, GENCOs, IPPs, KESC, and PAEC. IPPs, which are essentially oil and gas plants, provide a major installed capacity. Recently, WAPDA maintained 22 hydel power stations with a gross installed capacity of 9389 MW. According to NEPRA, GENCOs ancient state owned units provide the cumulative installed capacity of 6991 MW. According to IAEA, PAEC deals with nuclear power plants, and the country has five operational nuclear plants with an aggregate generating capacity of 1430 MW.
This research is essentially on the electricity supply in a country where there is huge corruption, electric losses, institution mismanagement problems, and old electricity infrastructure. This fuels the need to study the relationship between electriciy supply, GDP, investment and export.
4. Econometric Methodology and Data
Our empirical enquiry employs annual statistics to explore the causal relationship between ELS and GDP by using the multivariate framework for the period 1990 to 2015 in Pakistan. GDP is a dependent variable while ELS, gross capital formation (GCF), investment (INV), and export (EX) are taken as an independent variable. Electricity supply was collected from the International Energy Agency (IEA) and other variables have been collected from the World Bank (WDI), the description of all variables and source of facts are given in
Table 2.
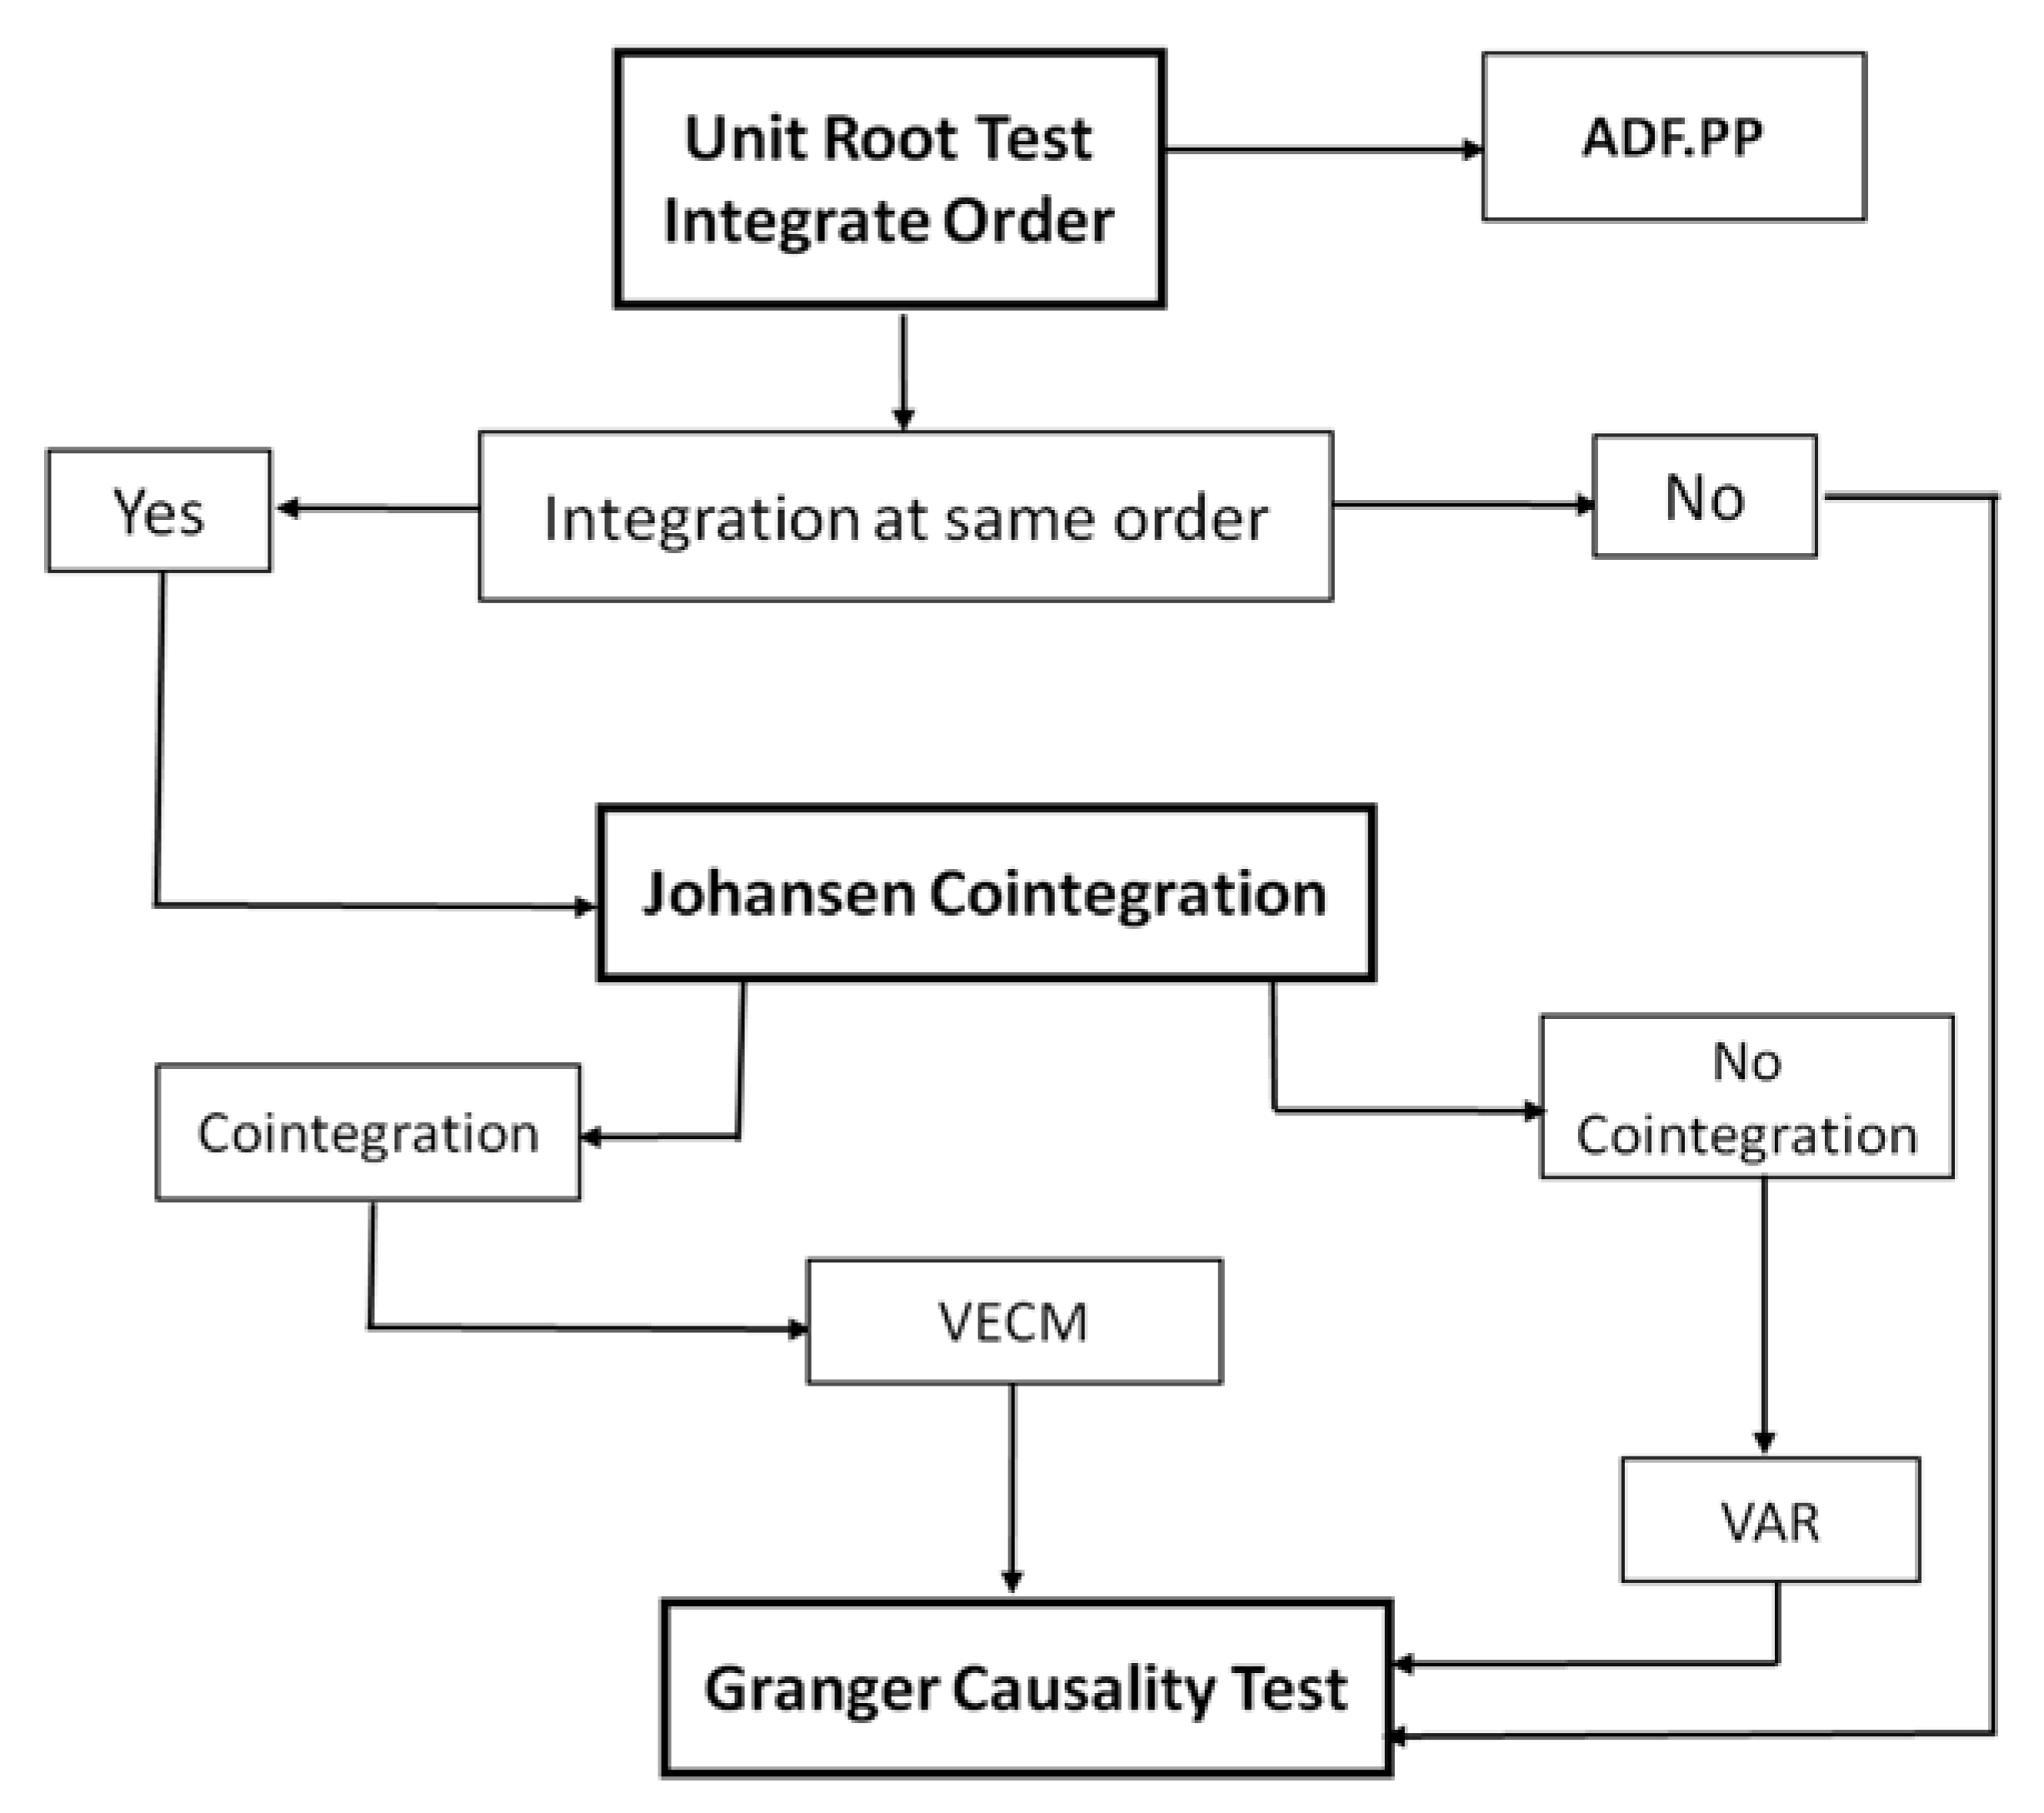
The liaison between ELS and EG in Pakistan test the hypothesis whether electricity supply cause GDP or whether GDP cause electricity supply. For this, the study uses an econometric model with the following steps. Step 1: before examining the econometrics analysis, we analyze the descriptive statistics. Step 2: first and foremost, it is compulsory to examine the stationarity of every variable and integration of order in the model, the series should be in the same order as below in Equation (2). Step 3: if the series are incorporated in the same order I (1), we use the Johnsen co-integration test to determine the presence or absence of the relationship. To check this assumption, the number of lag length criteria is chosen for subsequent Johnsen co-integration test whether either series have long-run equilibrium relationship or not. Step 4: further, to check the relationship among ELS, GDP, GCF, INVm and EX, the Granger causality test is used. The Granger casuality method is important for studying the trend of a causal relationship between variables, and this direction of causation provides the strategy insinuations for policy makers (
Figure 6).
This inquiry applies the neoclassical production function where technology is resolved by the gross capital formation (K). We consider the following functional form and econometric model of this production function as follows:
where
GDPt indicates the Gross Domestic Product,
ELSt, is the Electricity supply (KWH),
GCFt, is the Gross Capital Formation,
INVt, is the total investment,
EXt, is the total export at time
t and
is an error term.
, is a constant,
denote the output elasticitiy of electricity supply, gross capital formation, investment and export, respectively.
4.1. Unit Root Test
Most macroeconomic time sequence facts contain unit root, integrated of order (1) [
83]. A series is integrated of order d as (I (d), if its d’th difference is stationary. If d = 0, then the series will be stationary at level, but if d = 1, the series needs to obtain stationarity at first differencing, then the series will enclose a unit root. The unit root test helps to decide whether the data is stationary or non-stationary, underlying the data generating process of series. If the series has no unit root (stationarity), then it oscillates around a constant mean. On the other hand, if it has a non-constant mean and variance over time, then a series is said to be non-stationary [
84]. The study uses the Augmented dickey-fuller (ADF) (1979) and Philips-Perron (PP) (1988) [
85] unit root test to explore the stationarity of series, whether the series contains a unit root or not. These tests are broadly used to check the incidence or absence of a unit root test [
86]. These unit root tests evacuate the serial correlation by lag selection changes in the residuals of regression [
87,
88]. The estimation of the ADF test with three models is:
Model 1: without constant and trend:
Model 3: with constant and trend:
where α denotes drift (constant), Δ is difference operator;
t is a time period,
γt is the deterministic trend, n is the optimal lag length, and
is an error term. In unit root test, the null hypothesis is the ADF test (H
0:
ß = 0, has unit root). The alternate hypothesis is (H
1:
ß < 0, has no unit root). The (ADF test statistics) t-value related to the calculated relevant critical values lies on the left side. The null hypothesis is excluded if its t-value is greater than the relevant critical value and has no unit root, which designates that the underlying series is stationary. Contrarily, if it is calculated that the t-value is a less than relevant critical value, then we are unsuccessful to discard the null hypothesis that series are non-stationary. While conversely, the null and substitute hypothesis of PP unit root test are the same as the ADF test. This test is based on the non-parametric statistical method, which removes any serial correlation without lag selection.
4.2. Optimal Lag Length
Most of the time, series statistics is in an autoregressive situation as it can be engaged to residuals, which may create a taint condition into co-integration test results when it is applied. However, the optimal lag length selection is crucial before using the co-integration method. The autoregressive (AR) lag length (p) denote to time series, which shows its current values based on its lagged values of first (p) and are usually indicated by AR (p). The lag length of AR (p) is estimated by lag length selection criteria because it always remains unknown [
78]. Numerous criteria are applied for a proper optimal lag length selection in the model such as Schwarz’s information criterion (SIC), Akaike’s information criterion (AIC), Hannan-Quin information criterion (HQ) and log-likelihood ratio test (LR) criterion. The study uses SIC lag length criterion as follow:
where S is the sample size and (â) is an estimated value. The optimal lag lengths of the lowest value of SIC lag length criterions would be chosen for an efficient and accurate model.
4.3. Johansen Co-Integration Test
The Johansen co-integration test is applied to conclude the existence or absence of causlity between variables in time series data. This test is applied when variables are incorporated in similar order and variables are non-stationary at the level. When there is co-integration between series it not only avoids the spurious regression but also discloses that there is equilibrium long-run liaison between series or variable move toghter [
89]. In the Johansen co-integration method, two test statistics with the trace statistics and the maximum eigenvalue test information are analyzed. The trace test facts revealed the number of co-integrating vectors and the null and alternative hypothesis of the co-integration test are: H
0: r = 0 against H
1: r > 0 or ≤ 1. Alternatively, the null hypothesis of the maximum eigenvalue is a number of co-integrating vector equal to r and in against alternative hypothesis is r + 1.
H
0:
there is no co-integration between series.
H
1:
there is co-integration between variables.
where
zt indicate (
n × 1) vector of variables that are integrated I (1),
denote (
n × 1) vector of intercept, and
(
n × 1) is a vector of error terms and
λ1,
λp are (
n ×
n) coefficients estimation.
4.4. Granger Causality Test
The Granger casuality is a general method applied to determine the causative relationship between variables reported by Granger, 1969 [
90]. Normally, the Granger casuality test, when applied in econometrics analysis, refers to the ability of one variable to forecast the other. According to the Granger causality test, a variable
X Granger causes
Y if
Y can be projected with enhanced veracity by means of the past values of
X variable. The Granger causality test use I (1) to assess the super-consistency possessions if
X and
Y series are co-integrated in the same order I (1), then causality exists in at least in one direction [
36].
Here, Xt and Yt imply as X and Y measured values at time periods t, q denote the number of lag length used in time series data, are the estimation of parameters, is an error term. In Equation (8), Y Granger cause X if the null hypothesis H0 = = = … = = 0 is prohibited in favor of the alternative hypothesis H1: at least one . Correspondingly, for Equation (9), X Granger causes Y if the null hypothesis H0 = = = … = = 0 is excluded in favor of the alternative hypothesis H1: at least one
5. Results and Discussions
First, our results are started by statistical exploration;
Table 3 shows the descriptive statistics of variables using time series data from 1990–2015. This statistical analysis reveals that the mean value of gross domestic product GDP is 4.063, with a standard deviation (S.D) of 1.86. Electricity supply ELS mean is 64.83, with a standard deviation of 16.05 and the mean of gross capital formation GCF is 21.64, with a standard deviation of 3.51. The variable investment INV mean is 1.18, with standard deviation 0.89 and the average of export EX is 14.91, with standard deviation 1.67.
To test the hypothesis, the ADF and PP are applied in this investigation to explore the presence of unit root with intercept and intercept and trend. The outcomes of ADF and PP unit root tests are shown in
Table 4. From
Table 4, the results discovered that the null hypothesis of the unit root may not be prohibited at level but it is strongly excluded at 1% and 5% significance level at first difference. This indicates that the variables are nonstationary and incorporated in the same order I (1).
After establishing the unit root test, we establish that variables are non-stationary and integrated in the order I (1), then, Johnsen co-integration was applied to find long-run liaison between variables. Before using the test, it is obligatory to analyze the lag length criteria.
Table 5, represents the lag length assortment criteria. The optimal lag length selection for the model is 1 by using the lowest value of Schwar’s information criteria (SIC). The consequences of the Johnsen co-integration test with trace and max eigenvalue test statistics are provided in
Table 6. The outcomes indicate that based on the trace test statistic and max Eigen statistic value, the series has three co-integration at a 5% significance level. The trace test statistic 162.2 is greater than 5% critical value of 69.8, so we can discard the null hypothesis of no co-integration (H
0: r = 0). Similarly, the max Eigen test statistics 70.2 is greater than the critical value of 33.8, which is in the favor of the alternative hypothesis that there is a relationship between series.
The Johannsen co-integration determines only the endurance of a long run relationship among variables, but it does not designate the course of causation. This existence of long run link means that the Granger causality must be existing at least in one direction in series [
46]. Thus, when the series are co-integrated by using the vector error correction model (VECM) we can analyze the Granger casuality test to explore the direction of causativeness between variables. In the ganger causality test, we want to analyse whether the presence of this long run equilibrium relationship caused the variables, and if ELS lead to the EG or EG lead to the ELS, or if they have a reciprocal causation condition.
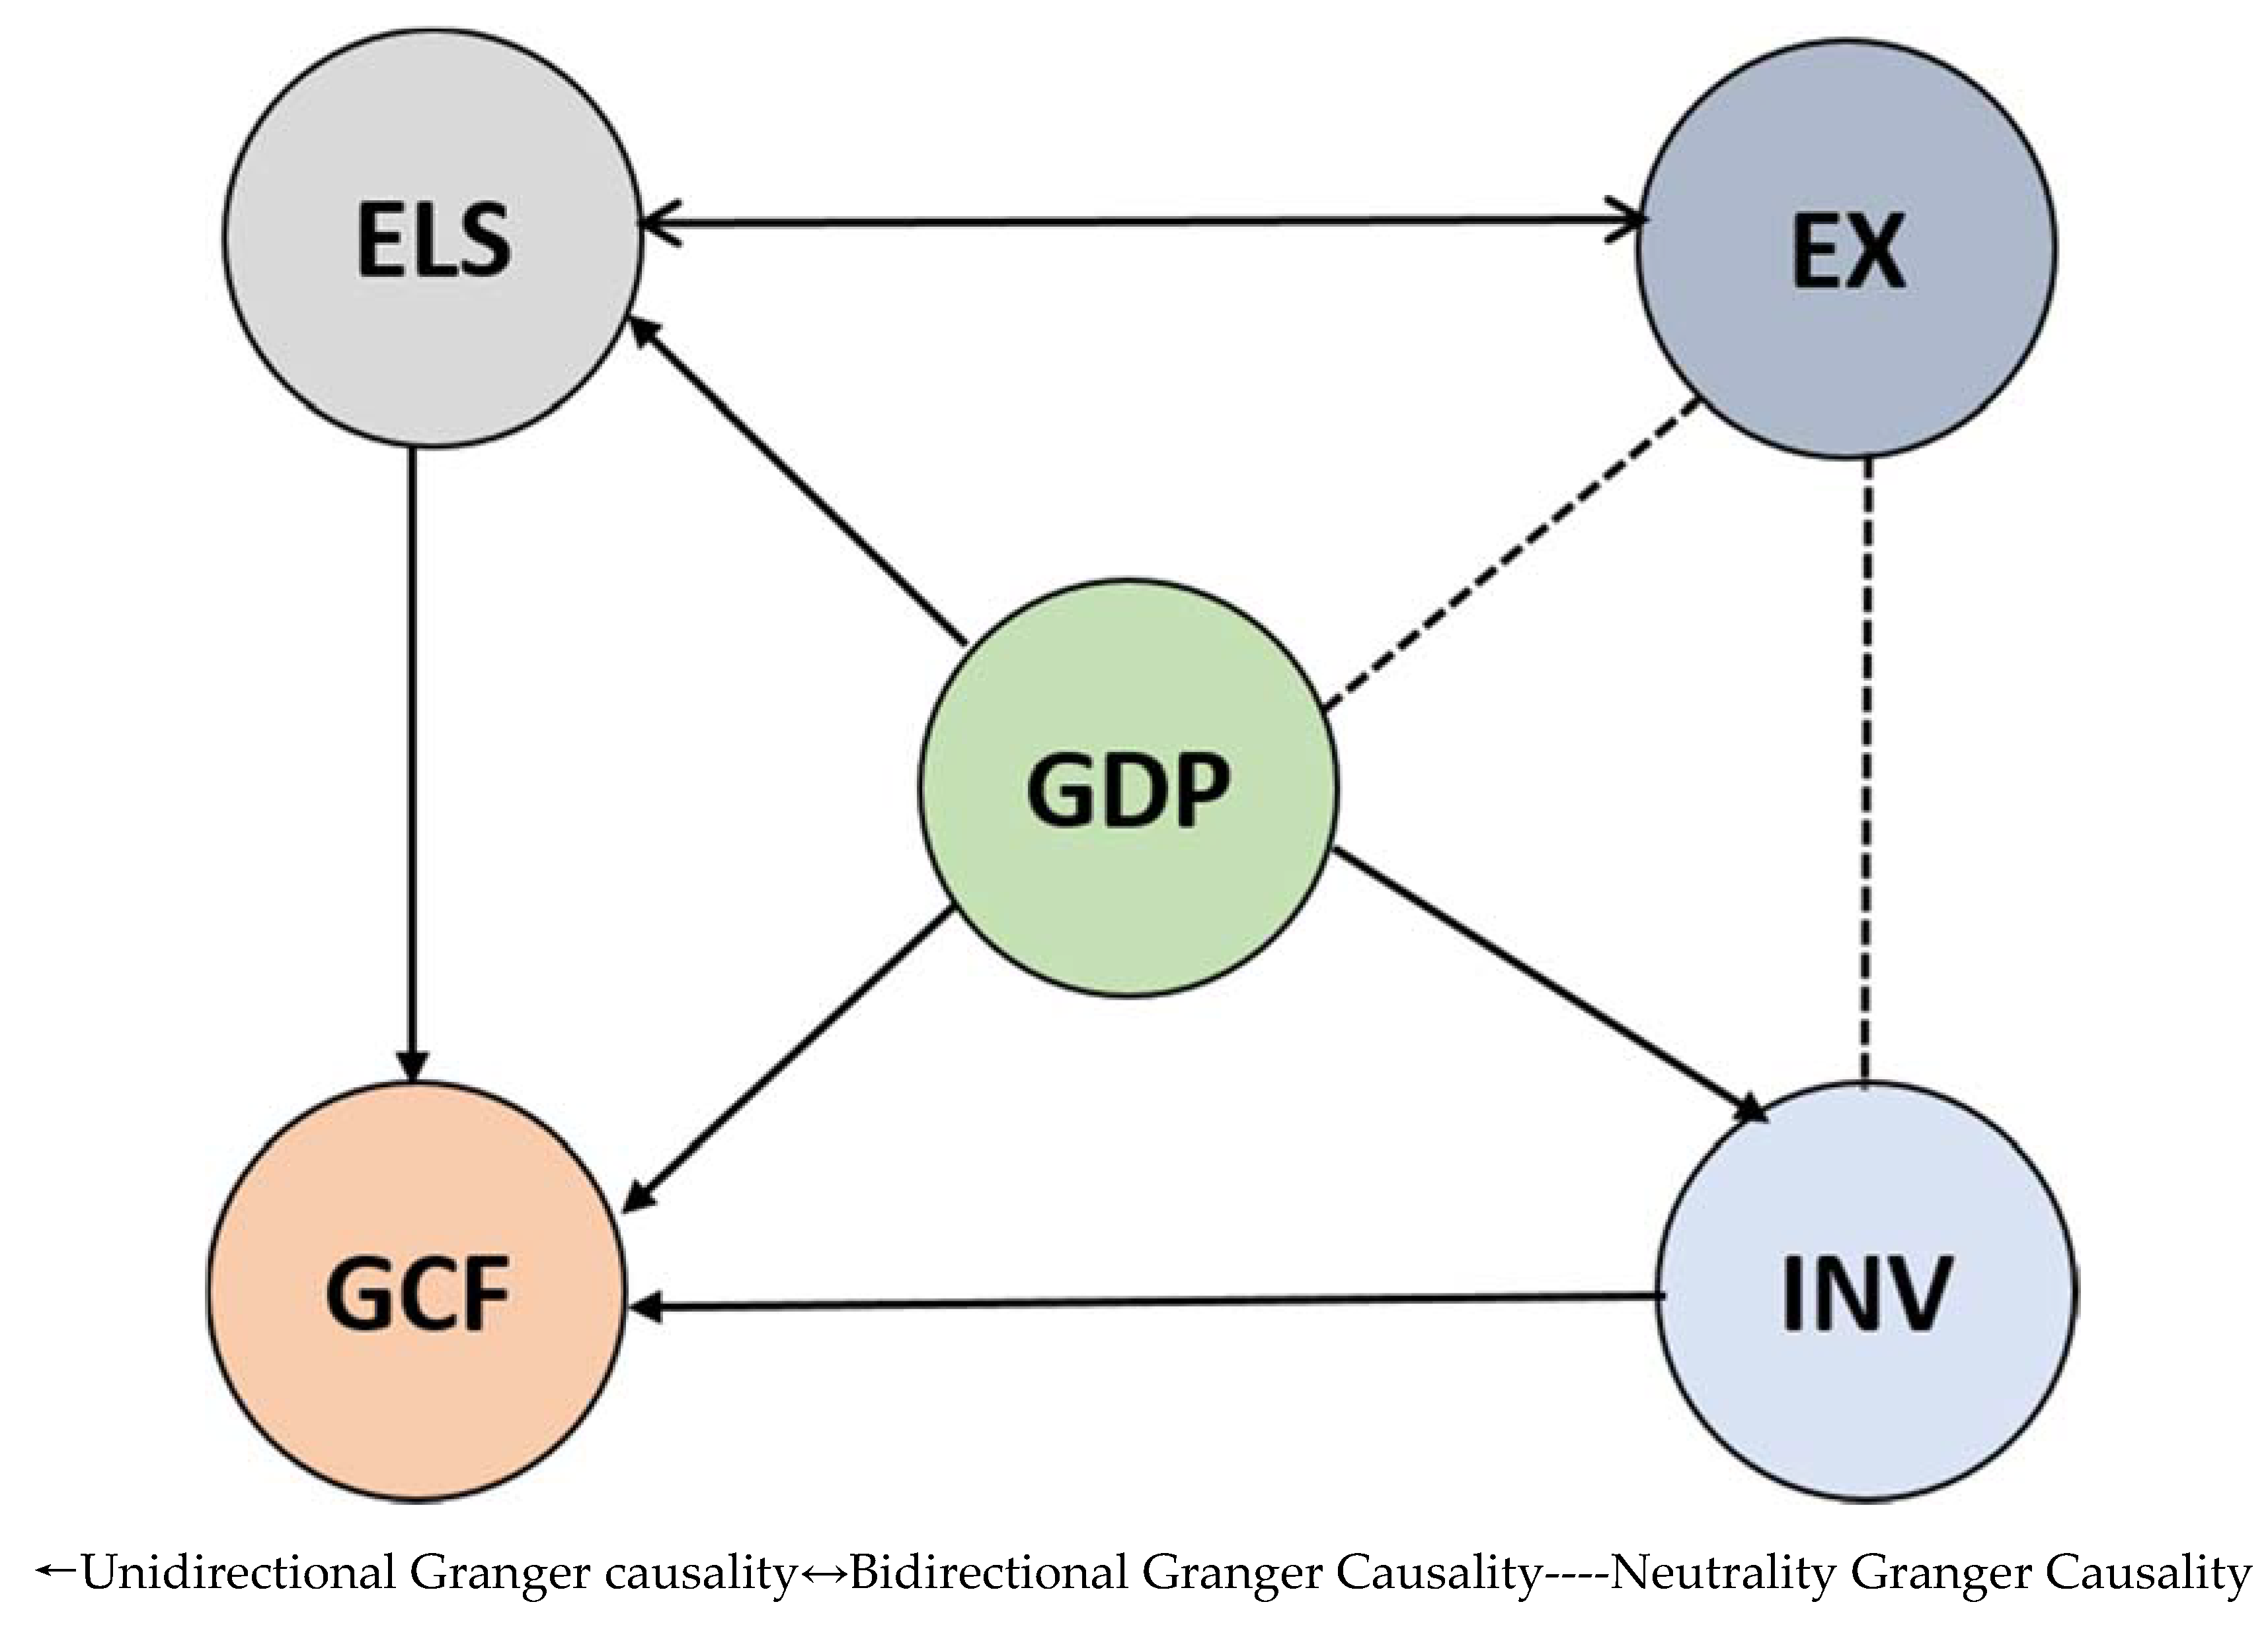
Table 7 shows the findings of Granger causality base on the VECM Equations (8) and (9). The results show that causation directs from EG to ELS (GDP to ELS (
p < 0.05). The finding of this study is reliable with the previous studies [
42], but different from [
46], who fail to discover the causation between ELS and EG. Thus, an enduring increase in Pakistan’s GDP may cause an increase in electricity supply and this long-term increase can have a significant impact on electricity supply. The causality also runs from gross capital formation and investment to GDP, but not vice versa. This shows that a growth in investment and capital that resulted in a higher EG of Pakistan. Thus, enhancing GDP is more crucial and has a broad impact on Pakistan’s development. Moreover, bidirectional causality runs from electricity supply and export. This indicates that promoting export can enhance the electricity supply in this country. In other words, we can say that a large amount of electricity is required to produce exported products. Electricity productions play a significant role in Pakistan’s export, unidirectional causality electricity supply to gross capital formation, and no causality found export and GDP. It can be concluded that economic growth causes electricity supply, so conservation policies have no adversative impact on EG.
6. Conclusions
This work attempted to explore the causal relationship between ELS and EG by including investment, gross capital formation and export in Pakistan from 1990–2015. Many researchers have debated on energy-growth nexus but electricity supply and growth nexus is still underexplored. Time series data was used in this study by applying ADF and PP unit root to conclude the order of integration. This study used the Johnsen co-integration test to determine long run causlity among series. Finally, we applied the Granger casuality test to discover the direction of causal relationship.
The result implies that variables gross domestic product (GDP), electricity supply (ELS), investment (INV), gross capital formation (GCF) and export (EX) are co-integrated. In other words, from our findings we can say that variables have long run relationships, thus they can travel together in the long run or they have the same tendency of crusade in the long run. The outcomes of the Granger casuality concede that unilateral casuality directs from GDP to other variables, e.g., ELS, GCF and also one-way causality between GDP and investment. Furthermore, electricity supply and export are interdependent from each other. Finally, no Granger causality was found from GDP to export and export to investment. In developing countries, if unidirectional causality exists between electricity and growth then it has a negative impact on GDP—but in Pakistan this is not the case. According to our findings, unidirectional causation is flowing from GDP to ELS. Thus, the policy implication is that electricity is not a limiting factor for Pakistan’s economic growth. So, according to our findings, Pakistan’s GDP is culpable for enhance the electricity supply (
Figure 7).
EG originates in the growth of commercial and industrial segments where ELS has been applied as a primary energy input due to its efficient and clean nature. ELS in the transport and agricultural sector will help to speed up EG of the country. Hence, it could be anticipated that EG augments the electricity supply in Pakistan.
The electricity supply network in Pakistan has been passing through an era of prolonged supply scarcity, extraordinary T and D losses primarily because of high auxiliary consumption, electricity theft, and environmental issues linked with thermal power plants. The electricity sector of Pakistan is also suffering due to poor operative and monetary performances of electric supply distribution companies. Lower electricity tariffs due to subsidy by the government in the domestic sector inspire the customers for extravagant usage of electricity.
The demand for electricity in Pakistan is rising due to its high population in the coming years. The government of Pakistan (GOP) has already initiated electricity sector reforms such as energy preservation and efficiency enhancement program as a portion of continuing restructuring practice because of the great energy saving perspective in Pakistan.
Nevertheless, in various Asian economies, electricity conservation strategies may have adverse effects on EG due to unidirectional causativeness from EC to GDP, this is not the instance for Pakistan. The causality directs from GDP to EC in the long run according to our outcomes. Consequently, electricity is not a limiting factor for Pakistan’s EG. Enhancing electricity tariffs could be a good prospect for the Pakistani economy to stimulate substitution and technical improvement. Meanwhile, high levels of EG has contributed to mounting electricity demand, and the government may endorse environmentally friendly protection by permitting charges to react to market forces. A competitive energy market would signify a stride headed to allocate the country’s valuable resources proficiently.


