1. Introduction
In recent years, the issue of wind curtailment in Northeast China is very serious, especially during the heating period. The reason is that Combined Heat and Power (CHP) units have to generate electricity at high levels due to “the power-heat coupling”, which takes up a great portion of the power generation space and very small is left for wind power. Before the spot market is established, Northeast China built a Deep Down-regulation (DDR) market in 2014. It has kept revising and improving since then. Through compensating DDR, CHP plants are encouraged to reduce the electric power outputs so as to integrate more renewable energy [
1].
Inspired by the market, CHP plants have undergone “decoupling power and heat”, mainly using the individual and the cooperative operations of three methods: Flexible cutting off the Low-pressure (LP) turbine, installing the Heat Accumulator (HA), and installing the Electric Boiler (EB) [
2]. There are some cases: A solid electric heat storage (260 MW) down-regulation boiler built on Dandong Jinshan CHP Plant. Three 16.7 MW direct heating electric boilers built on Jilin CHP Plant. Two 50 MW immersion-type electrode boilers built on Harbin Datang No. 1 CHP Plant. Inner Mongolia Hailar CHP Plant carried out retrofit for 200 MW unit by cutting off the LP turbine. Liaoning Dongfang Power Generation Company cutting carried out the same retrofit for 350 MW unit. A 26,000 m
3 hot water storage tank built on Datang Liaoyuan Power Plant. After the retrofits of the abovementioned plants, the capacity and cost of DDR are different from those before. How to quantify these parameters in real time and how to formulate a bidding strategy for CHP plants in the DDR market based on these parameters need to be further studied. Especially when a plant contains different types of units, the problem becomes more complicated.
At present, many studies have been reported in the literature related to the issues of “decoupling power and heat” of CHP plants to improve the flexibility from different perspectives. At the system level, the main concerns are the impact of the decoupling on integration of renewable energy, energy consumption and emissions [
3,
4,
5], national economy [
6], and centralized dispatch operations [
7] after the decoupling. At the power plant level, the main concerns are the impact of decoupling technology [
8], operational flexibility evaluation [
9,
10,
11,
12], operational strategies and economics [
13,
14,
15,
16,
17]. However, in the context of the Northeast China DDR market, there is little literature on the operational strategies of CHP plants after the decoupling. Only one of them [
16] studies the bidding strategy of plants with extraction condensing units and HA through predicting the behavior of competitors, and obtains very useful conclusions. However, they do not consider multitypes of units and multiple decoupling methods. Therefore, a more general model is necessary. In addition, because the behavior of competitors is difficult to predict, there are many problems in practical applications.
Therefore, this paper studies a CHP plant consisting of multitype units and the EB and HA. In the Northeast China real-time DDR market, several general models are established, including the operating constraints of devices in the plant, the coal consumption function, an internal optimized dispatch model of the plant, the model of minimizing the electric power output of the plant, the models of total cost for down-regulation and average cost for DDR. Furthermore, the bidding strategy of the plant participating in the real-time DDR ancillary service market is proposed.
2. Models of Operation Constraints for Multitypes of Units and Flexible Heating Devices
2.1. Extraction Condensing Unit
In Northeast China, in order to improve the ability to adjust the electric power output while supplying heat, most units in CHP plants are designed or retrofit into extraction condensing units.
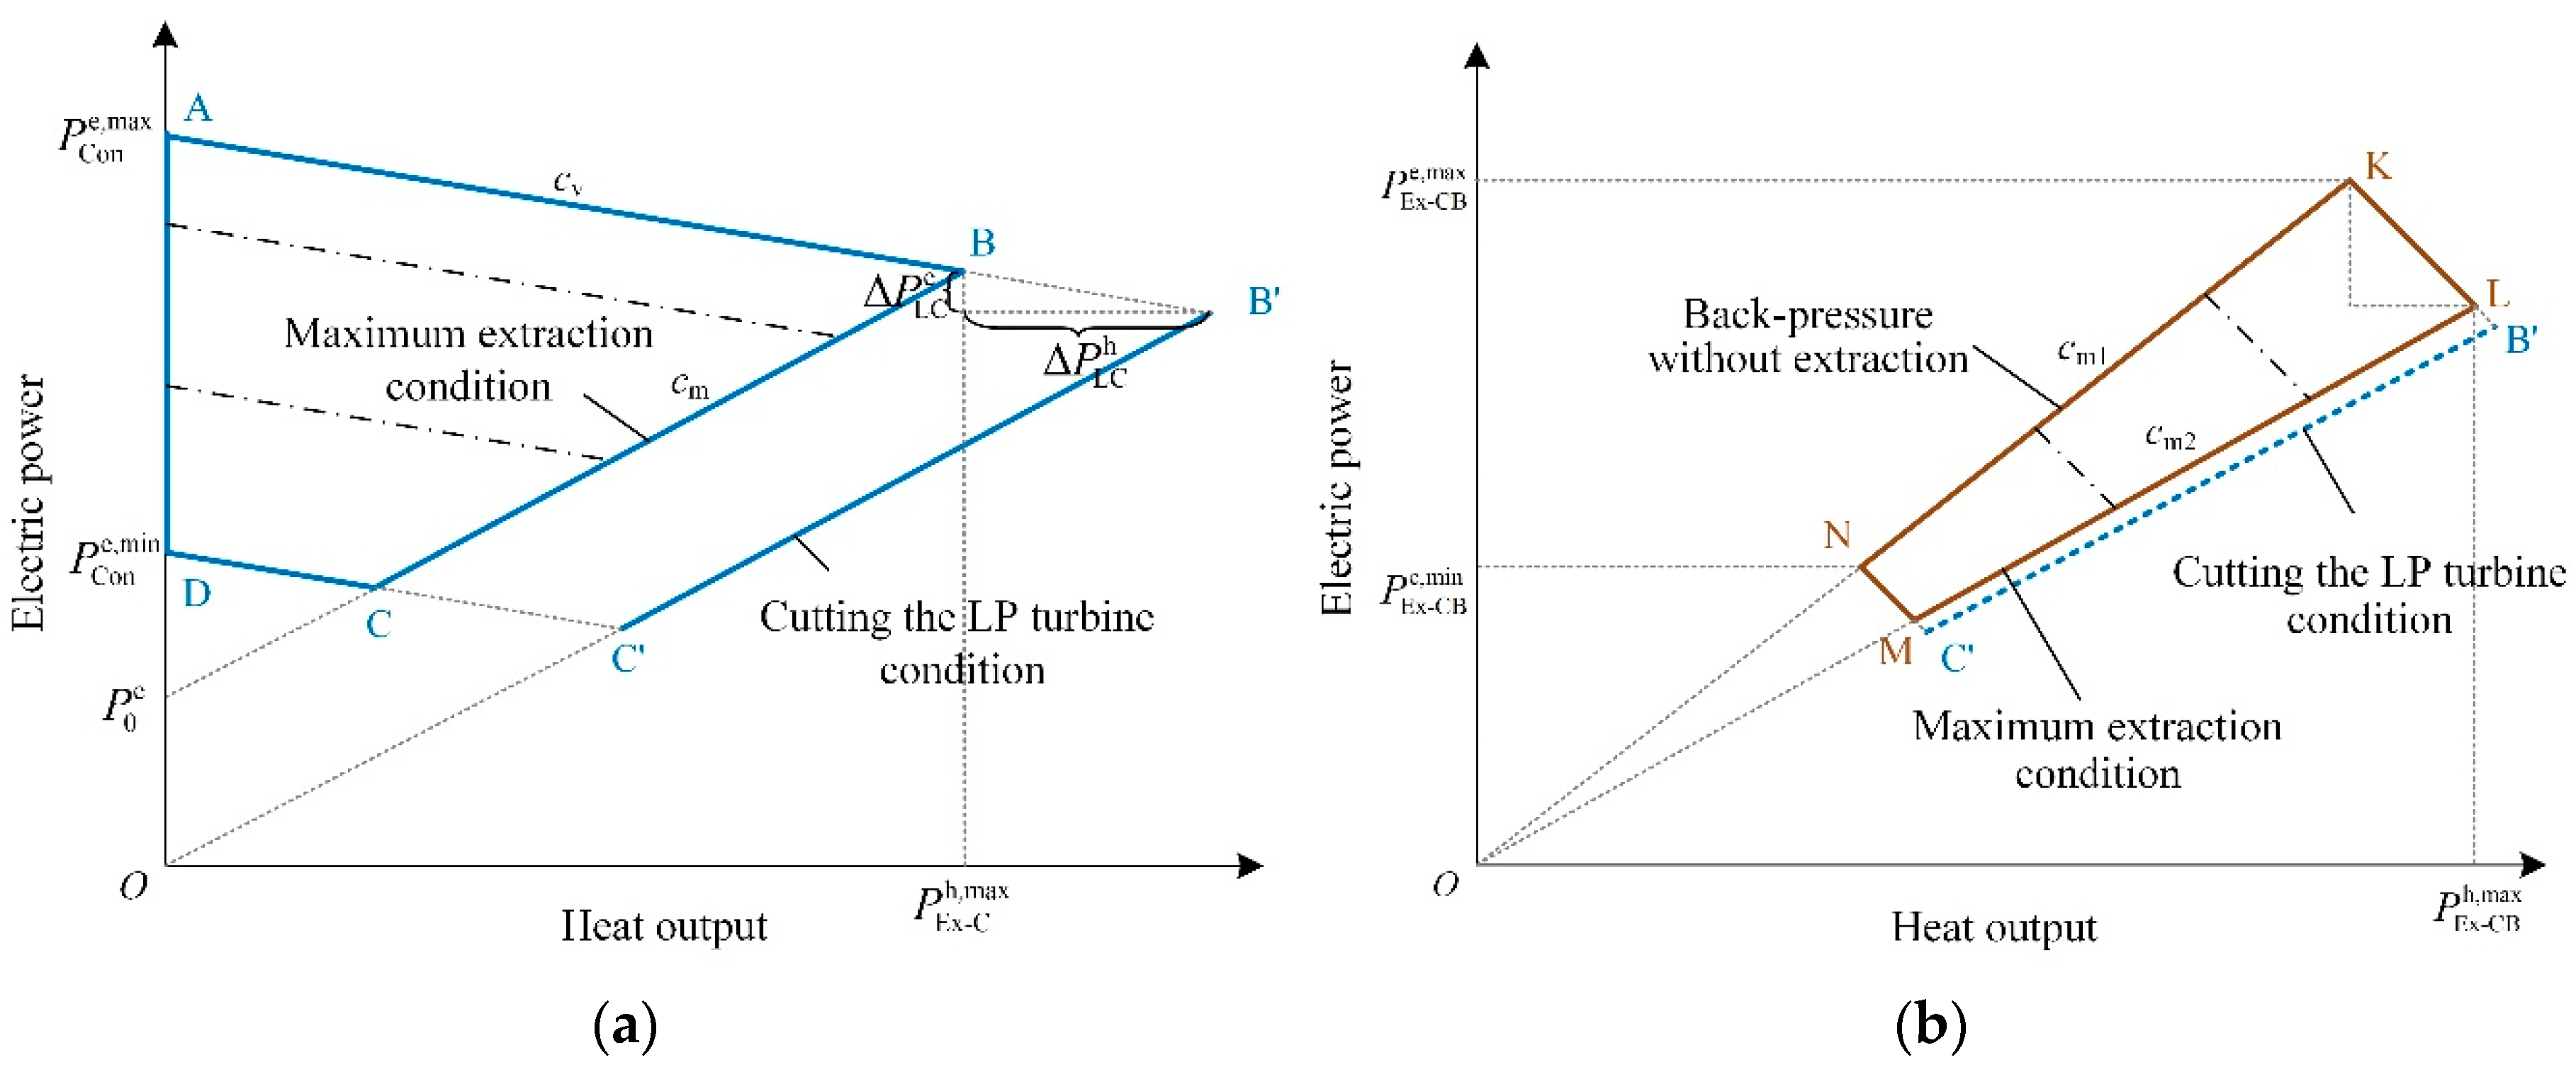
The Feasible Operating Region (FOR) of a typical extraction condensing unit can be represented by a quadrilateral, namely the area of ABCD shown in
Figure 1a. The slopes of the line AB and line BC are
and
, respectively. The line BC is the maximum extraction condition line, also the minimum condensing condition line.
represents the influence coefficient of the heat output from the extracted steam on the electric power output when the amount of steam entering the turbine is unchanged.
represents the ratio of the electric power to the heat output of extracted steam.
is the intersection of line BC and the vertical axis;
and
are the minimum and maximum electric power output of the unit under condensation condition, respectively;
is the maximum heat output. In this paper, the units for all power related variables and parameters are MW.
The mathematical model for the operating region of the extraction condensing unit is shown in Equation (1), where
and
represent the electric power and heat output of the unit, respectively.
According to the heating principle, the coal consumption of this type of unit can be calculated by converting the operation point in the extraction mode to the operation point in the condensing mode, and then using the coal consumption function of the condensing mode. Accordingly, the coal consumption can be expressed as:
where
(t/MW
2h),
(t/MWh), and
(t/h) are coal consumption coefficients of the extraction condensing unit under condensing condition.
2.2. Extraction Condensing Unit with Ability to Cut Off the LP Turbine
Generally, when an extraction condensing unit operates at the minimum condensing condition, namely on line BC, about 5–10% of the rated capacity of steam flow into the LP turbine to prevent over-heat and blast. The steam entering a condensation cycle is not used for heating. In recent years, in order to reduce the electric power output as much as possible meanwhile ensuring the heating supply, LP-cut-off technology has rapidly developed. The LP turbine can achieve “zero output” operation under high vacuum [
18]. Under this working condition, almost all steam is used for heating. So, the unit can be considered as working under the backpressure condition, the FOR is represented by line B′C′ in
Figure 1a. Since the amount of steam entering the LP under the minimum condensing condition depends on the type of unit, regardless of the steam intake of the turbine, the reduction in electric power
and the increase in heat output
are fixed. After LP-cut-off, the operation line B′C′ is parallel to line BC.
The unit needs to switch quickly from the minimum condensing condition to the backpressure condition [
18]. It cannot work stably between line BC and line B′C′. It means that there are two operating modes of the unit: One is LP-cut-off mode operating on line B′C′, and the other one is traditional mode in region ABCD. Therefore, the operating region is expressed by Equation (3):
where
and
are the electric power and heat output of the extraction condensing unit with the ability to cut off the LP turbine, respectively;
is a Boolean value that represents whether the LP turbine is cut off.
represents cutting off;
represents not and the unit operates under extraction condensing condition.
After LP-cut-off, almost all condensing steam of the unit is extracted from the original extraction point for heating. Therefore, the coal consumption function is the same as Equation (2).
2.3. Extraction Back-Pressure Unit
For the traditional extraction condensing unit, the exhaust temperature from the LP turbine is about 30–45 °C. Directly condensing the exhaust will cause a large amount of condensing loss of the steam. In order to recycle this part of the heat, some units are designed or retrofitted into extraction back-pressure units.
The steam flow used for heating of the extraction back-pressure unit is divided into two parts: One part is extracted after working in the high and medium pressure turbines, and the other part is the exhaust after working in the high, medium, and low pressure turbine. This is equivalent to the parallel operation of two back-pressure units with different electric heating ratios. When the steam turbine inlet flow rate is fixed, under the premise of meeting the minimum flow rate restriction of the LP turbine, the electric power and heat output can be changed by adjusting the extraction flow rate.
The operating region of extraction back-pressure unit can be represented by a quadrilateral area, namely the area of KLMN shown in
Figure 1b. The line KN represents the back-pressure operation without extraction, and the line LM represented the maximum extraction operation. Obviously, if the minimum flow rate restriction is ignored, the line LM will coincide with the line B′C′.
The region of the abovementioned unit can be expressed as Equation (4), and the specific derivation process is shown in
Appendix A.
where
and
are the electric power and heat output of the extraction back-pressure unit, respectively.
and
are the minimum and maximum electric power output of the unit under back-pressure condition, respectively.
is the power to heat ratio of the exhaust steam from LP turbine.
is the power to heat ratio of the extraction steam.
is the maximum heat output.
According to the heating principle of the extraction back-pressure unit, its coal consumption can be calculated by converting the operating point in the extraction back-pressure condition to an operating point in the back-pressure condition. Then, the coal consumption function is Equation (5):
where
(t/MW
2h),
(t/MWh), and
(t/h) are coal consumption coefficients of the extraction back-pressure unit under the back-pressure condition.
2.4. EB and HA Models
The CHP unit can make full use of the condensing loss of the exhaust steam through flexibly cutting off the LP turbine or performing backpressure retrofit. Then, the heating capacity of the unit is increased and the electric power output reduced, meanwhile satisfying the current heat demand. However, under a given heat demand, the down-regulation capability of the unit will also decrease, and the electric power output cannot be reduced below the point C′ in
Figure 1. Therefore, the down-regulation capacity and operating flexibility of the plant should further be more by installing EB or HA [
2].
Constraints of the HA include:
where,
is the heat output of the HA.
and
are the heat storages at the beginning and end of a certain period, respectively.
and
are the maximum charging and discharging heat output, respectively;
and
are the capacity and heat storing efficiency, respectively.
Constraints of the EB include:
where
and
are the electric power and heating output.
is the electric-heat transfer efficiency.
is the capacity.
3. Rule of the Real-Time DDR Market in the Northeast of China
In order to encourage power plants to participate in DDR and integrate renewable energy, a real-time DDR market is set up.
3.1. Principle of the Real-Time DDR Market
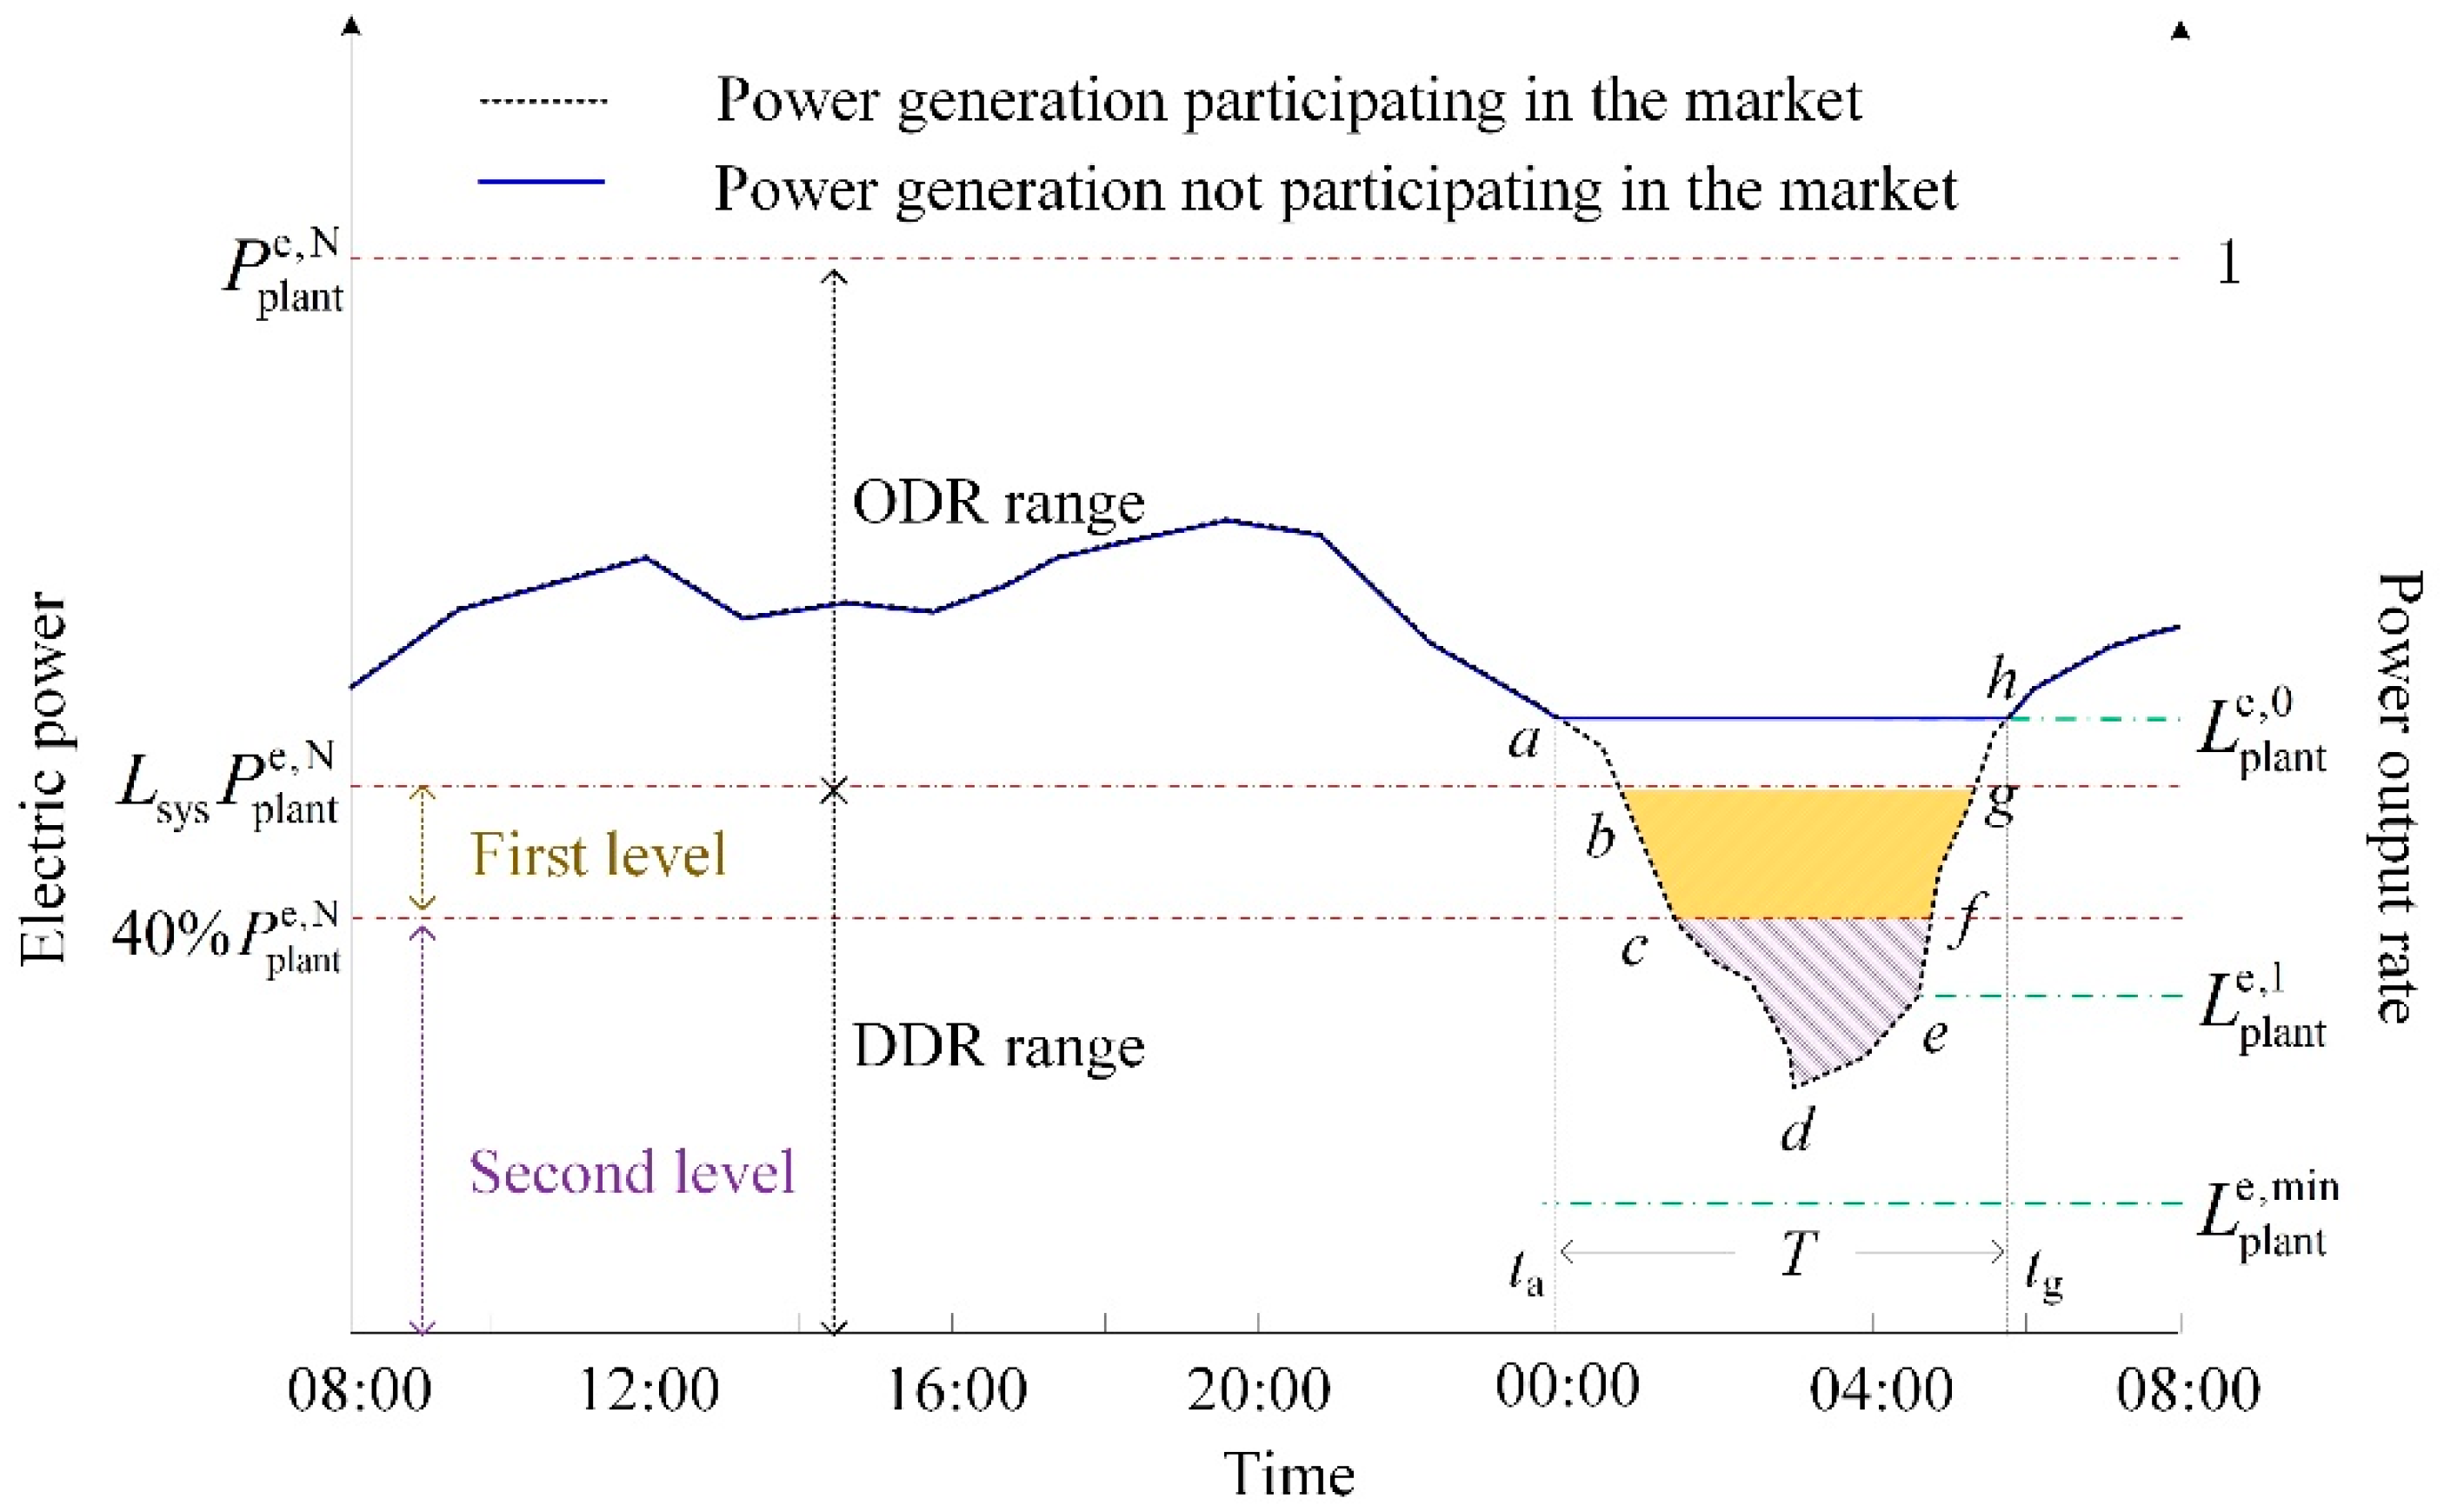
In the Northeast China power system where a high proportion of wind power is integrated into the grid, wind power output is often high during low-load periods at night, namely the period of
in
Figure 2, where
is the total capacity of the working units in the power plant.
In this market, a baseline of DDR
is drawn. It divides down-regulation capacity into ordinary down-regulation (ODR) and DDR, as shown in
Figure 2. The DDR range includes two levels: The first level is
and the second level is
.
During the operation, if a power plant reduces its electric power output rate from
to below
according to the dispatching instructions, it means that the plant provides the system with real-time DDR services. Then, the market will compensate the plant according to electric power quantities of the two levels. The reimbursement for DDR model is as follows:
where
and
are the market-clearing prices of the first and the second levels, respectively. They are determined by the system demands and the bids of each unit.
Before 11 o’clock, power plants willing to provide real-time DDR services of the next day will submit to the trading platform the minimum power output rate and two bidding levels for the DDR. The price of the first level cannot be higher than 400 ¥/MWh. The price of the second level is not lower than 400 ¥/MWh and not higher than 1000 ¥/MWh.
The market adopts the sequential clearing rule. Namely, the DDR capacity will be activated sequentially from low to high prices bid by power plants. The bidding price of the last unit activated in each level is the market-clearing price for the level. Obviously, according to the price limit, the capacity of the second level will be activated only when all of the first level capacity cannot meet the requirement.
3.2. Allocated Payment for the Reimbursement
All power plants operating under the baseline
will receive payment on market-clearing price, while the payment for the reimbursement will allocate proportionally to those plants operating above the baseline during the DDR period, as well as the wind, solar, and nuclear power plants. It means that the latter purchases the services from the former. The allocated payment is according to the revised power quantities of power plants. The modified power quantities model of the power plant is as follows:
where
,
,
are modification factors. It can be seen that if the electric power output rate of the power plant is under the baseline, its allocated payment will be reduced to 0.
4. Optimal Operation Model of CHP Plants
As described in
Section 3, the CHP plants in Northeast China that are expected to participate in the real-time DDR market need to report the minimum electric power output of the next day.
In this section, a minimum electric power output model under a given heat load and an internal optimal dispatch model are established for the plant that consists of extraction condensing units, extraction condensing units with the ability of LP-cut-off, extraction back-pressure units, the EB, and the HA.
4.1. The Objective Function
• Model of Minimum Power Output of a CHP Plant
Under a given heat load, the minimum power output can be expressed as:
where
,
,
are the numbers of working extraction condensing units, working extraction condensing units with LP-cut-off capability, and working extraction back-pressure units in the plant, respectively. Therefore, the minimum power output rate of the plant can be expressed as:
where
is the sum of the rated capacities of various types of working units in the plant.
• Internal Optimal Dispatch Model of the CHP Plant
During the real-time DDR period, to satisfy a given electric and heat load, a plant can minimize its operating cost through an internal optimal dispatch. The objective function can be expressed as the sum of the coal consumption of all units and the heat consumption of the HA:
where
is coal consumption coefficient when HA discharges heat (t/MWh). Since the heat released by the HA during the DDR period is from the other period,
can be calculated based on the CHP units’ marginal coal consumption during the heat storing period.
4.2. Constraints
• Constrains on the Units and Flexible Heating Devices in the CHP Plant
Constraints of each unit are described in
Section 2. The heat storing of different periods in the HA is coupling. In order to ensure that the minimum power output calculated by Equation (10) can be reached in the whole DDR period
T as shown in
Figure 2, the maximum heat power output of the HA is taken as:
where
is the original heat stored in HA at the beginning of DDR period.
• Constrains on the Heat Output Balance is:
where
is the heat output of the entire plant.
• Constrains on Electric Power Balance is:
where
is the electric power output of the plant.
5. Model of the Total Cost for Down-Regulation in CHP Plants
As described in
Section 3, when a CHP plant participates in the real-time DDR market, it needs to declare the minimum electric power output and bids in two levels based on its down-regulation cost on the previous day.
In the Northeast China power grid, the system will determine the working units and the minimum electric power output rate for each plant before participating in the market [
19], which is determined based on heat load and the FOR of the plant before decoupling. The minimum electric power output rate here is referred to as the approved output rate,
. When the system has DDR requirements, for example during the period of
in
Figure 2, the plant is required to reduce its power output rate to
. It indicates that the plant has the right to operate at the approved output rate (
) and earn revenue by generating during the DDR period.
The approved output rate of a CHP plant is generally between 65% and 70%. It is higher than the baseline (), which is 50% for a CHP plant during its heating period. If a CHP plant reduces its power output rate below for down-regulation, it will decrease the revenue. Meanwhile, the allocated payment can be reduced or avoided as the power output rate is lower than the baseline.
5.1. Loss of Profit from Power Generation Due to the Down-Regulation
It is assumed that a CHP plant will reduce its electric power output rate to () during the period of down-regulation meanwhile ensuring the heating demand.
(1) Loss of electricity sales revenue
As the plant reduces its electricity sales due to the down-regulation, the losing revenue
is expressed as:
where
is the electricity price (¥/MWh).
(2) Saving of electricity generation cost
As the operating points of units in the plant are reduced due to the down-regulation, the saving generation cost is expressed as:
where
is the coal price (¥/t).
(3) Loss of profit
The electric power generation profit lost by the plant due to the down-regulation is expressed as:
5.2. Reduction of the Allocated Payment for Reimbursement Due to Down-Regulation
According to market rules, the plant does not need to participate in the allocation of the payment for reimbursement incurred if
. Otherwise, it needs to participate in the allocation. Furthermore, the allocated payment due to down-regulation reduces by the segmentation function as given by:
where
is the price of allocated payment (¥/MWh) which can be estimated based on the historical allocation data.
5.3. Total Cost for Down-Regulation of a CHP Plant
In summary, when a CHP plant reduces its electric power output rate from
to
, the total cost for the down-regulation is:
6. Model of the Average Cost for DDR
When the CHP plant reduces the electric power output rate from to , the total cost is . However, if the plant wants to bid in two levels, it needs to discuss the average cost when providing DDR capacity.
The power output rate of a CHP plant has the following three situations:
• (ODR range)
In this situation, the output rate of the plant is higher than the baseline. It does not provide DDR service and cannot be compensated. The plants are willing to participate in down-regulation if only .
• (First level of DDR range)
In this situation, the plant has participated in the DDR service, and the power quantities reduction is
. The average cost for DDR is:
where
and
are the total costs for down-regulation when the plant reduces its electric power output rate from
to
, and from
to
, respectively. They can be calculated by Equation (20) in
Section 5. Obviously,
is a fixed cost regardless of the value of
.
If is higher than the price cap of the first level (400 ¥/MWh), the gained reimbursement from the market will not be able to cover the total cost for the down-regulation. Therefore, the plant will not participate in the market.
• (Second level of DDR range)
In this situation, the electric power reduction provided by the plant to the market is . The average cost can be calculated by Equation (21).
The first level of the electric power quantities provided by the plant to the market is
. The corresponding average cost for DDR is
. The second level of the electric power quantities provided by the plant to the market is
. The corresponding average cost can be calculated by:
If is higher than the price cap of the second level (namely, 400 ¥/MWh), the plant will not participate in the second level of DDR. If is less than 400 ¥/MWh, the plant will participate in the first level.
7. Case Study
Taking a CHP plant in Northeast China as an example, the costs of participating in the Northeast real-time DDR market under different conditions are calculated and analyzed. The optimization model is solved using the IBM ILOG CPLEX software.
7.1. Basic Data
• The CHP Plant Data
The plant has four 350 MW extraction condensing units, of which unit No. 1 has been retrofitted into an extraction back-pressure unit, and unit No. 2 is undergoing retrofit about flexible cutting off the LP turbine. When the retrofit of unit No. 2 is completed, the heat output will increase by 136 MW and the electric power output will reduce by 41.3 MW while the steam intake of the turbine is unchanged. The FORs of the three types of units are shown in
Figure 3, and the units parameters are shown in
Table A1 of
Appendix B.
• Load Data
According to the characteristics of the peak and valley of the electric load during the heating period, the period of the valley of the load on a certain day is taken as the DDR period, and the duration is 6 h. During this period, the minimum power output approved by the system is 890 MW (the approved output rate is 63.5%). At this time, the maximum heating output can reach 1648 MW. Under this electric and heat load, the coal consumption of the plant during the period is 2464 t, and the electric power and heat output of each unit are shown in
Table A2.
• Flexible Heating Devices in the Plant
In addition to flexible cutting off the LP turbine of unit No. 2, it is assumed that the plant will also be equipped with the EB and the HA, and the maximum charging/discharging heat output of the HA is set to fill up/empty the tank in 8 h.
• Price Data
According to the latest data, the benchmark prices stipulated by authorities is 374.9 ¥/MWh [
20], and the coal price is 800 ¥/t [
21]; the allocation price of the reimbursement cost is set as 20 ¥/MWh based on historical data.
• Real-Time DDR Market Data
The plant adopts the two-step bid mechanism. The price limits of two levels are as mentioned in
Section 3. The baseline (
) is 50%. Namely, the electric power output rate of the plant that is down-regulated above 50% is the ODR, and below 50% is the DDR.
7.2. Influence of LP-Cut-Off on Down-Regulation
7.2.1. Influence on Down-Regulation Capacity
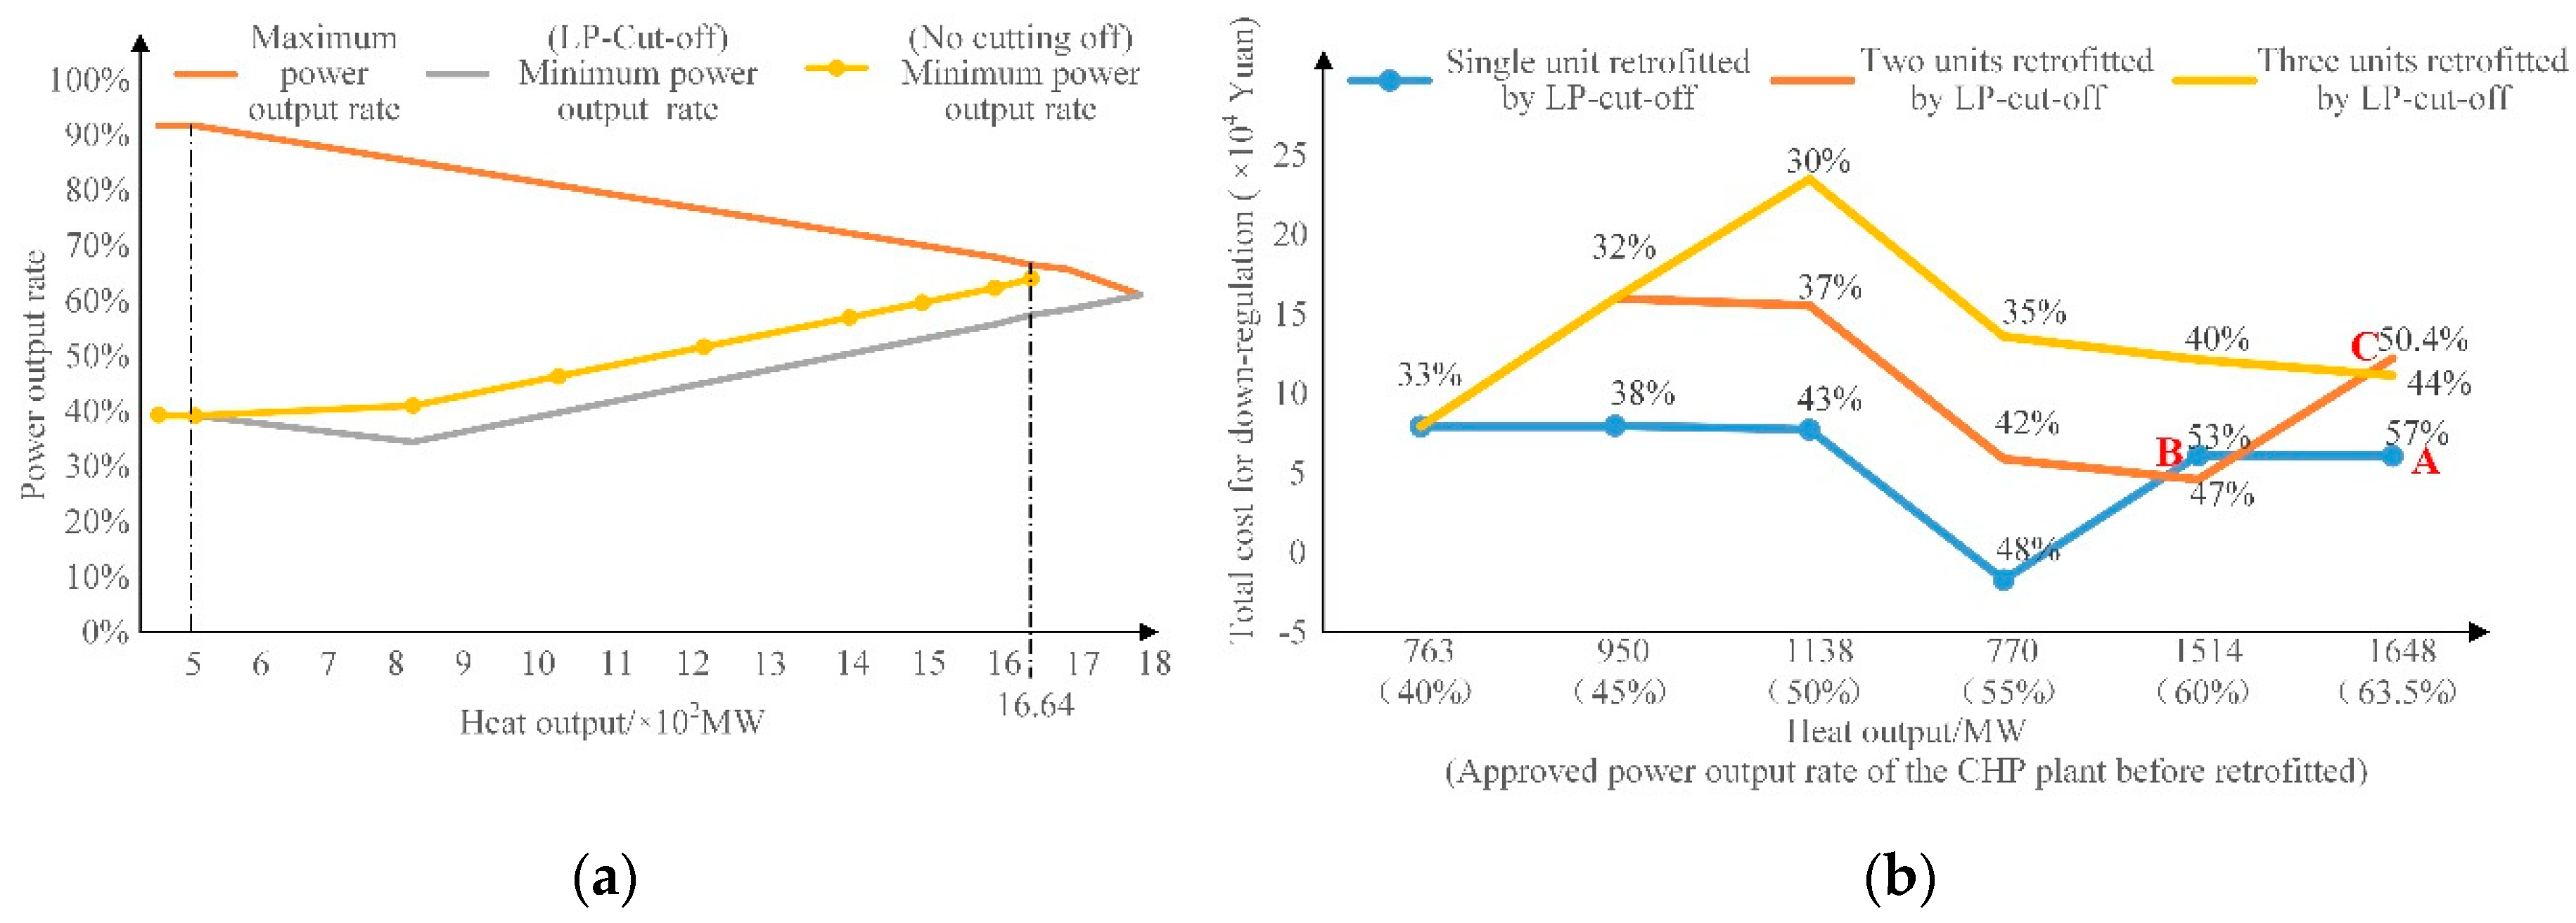
Figure 4a shows the relationship between the electric power output rate of the plant and the heat load after cutting off the LP turbine of unit No. 2. It can be seen that when the heat load is greater than 500 MW, the LP-cut-off operation of unit No. 2 can significantly reduce the minimum power output rate of the plant, about 7% (92 MW). However, when the heat load is less than 500 MW, the LP-cut-off operation of unit No. 2 is not allowed due to the limitation of the LP-cut-off operation region (line B′C′ in
Figure 1a), so as to avoid the heating output exceeding the heat load.
Satisfying the different heat loads, the minimum power output rate of the CHP plant after LP-cut-off operation of single unit, two units, and three units are shown in
Figure 4b (above on the curves). The total cost for down-regulation of the plant from the approved power output rate determined by the heat load to the minimum power output rate are shown as the curves. It can be seen that the more units are retrofitted, the lower the minimum power output rate and the greater the total cost. When the minimum power output rate just drops below 50% after the LP-cut-off, the total cost for down-regulation will reduce significantly due to the fixed cost
being gone.
7.2.2. Analysis of the Total Cost for Down-Regulation and Average Cost for DDR
It should be noted that when the heat load is large, the approved power output rate is high, and the power output rate of the plant may still be higher than 50% after LP-cut-off (as shown in point A, B, and C in
Figure 4b). At this time, the total cost for the down-regulation cannot be compensated, so the plant is not willing to participate in down-regulation.
When the heat load is small, or several units can be cut off the LP turbine, the power output rate can be reduced to less than 50% by the way of LP-cut-off operation. At this time, the plant will gain the DDR reimbursement. According to Equation (21), the average cost for the DDR can be calculated.
Table 1 shows the average cost of the plant under different heat loads (corresponding to the different approved power output rate) by LP cut-off for DDR. Clearly, the average cost is lower than the price cap of the first level (400 ¥/MWh), and the plant can gain compensation or greater profits by participating in the market. When a single unit is retrofitted, the power output rate will reduce from the approved power output rate of 55% to 48% after LP-cut-off operation. Without the allocation payment, the total cost for down-regulation are negative, then the average cost for DDR is negative.
7.3. Influence of Flexible Heating Devices on Down-Regulation
7.3.1. Influence on Down-Regulation Capacity
As outlined above, the unit can provide about 7% (92 MW) of DDR capacity after cutting off the LP turbine. However, the extraction condensing unit retrofits into a back-pressure unit after the LP-cut-off, and the power-heat coupling of the unit is linear, which will lead to the loss of electric power output regulation capacity of the unit. Therefore, in the future, it may be necessary to install the HA to improve the flexibility of the unit. With the cooperation of the HA, three units are allowed to LP-cut-off operation on the premise of meeting the heat load (all units are operating at the lowest point of the FOR: The point C′ and M in
Figure 3), the minimum power output rate of the CHP plant can be reduced to 28%. If the minimum power output is needed to reduce more, the EB shall be considered.
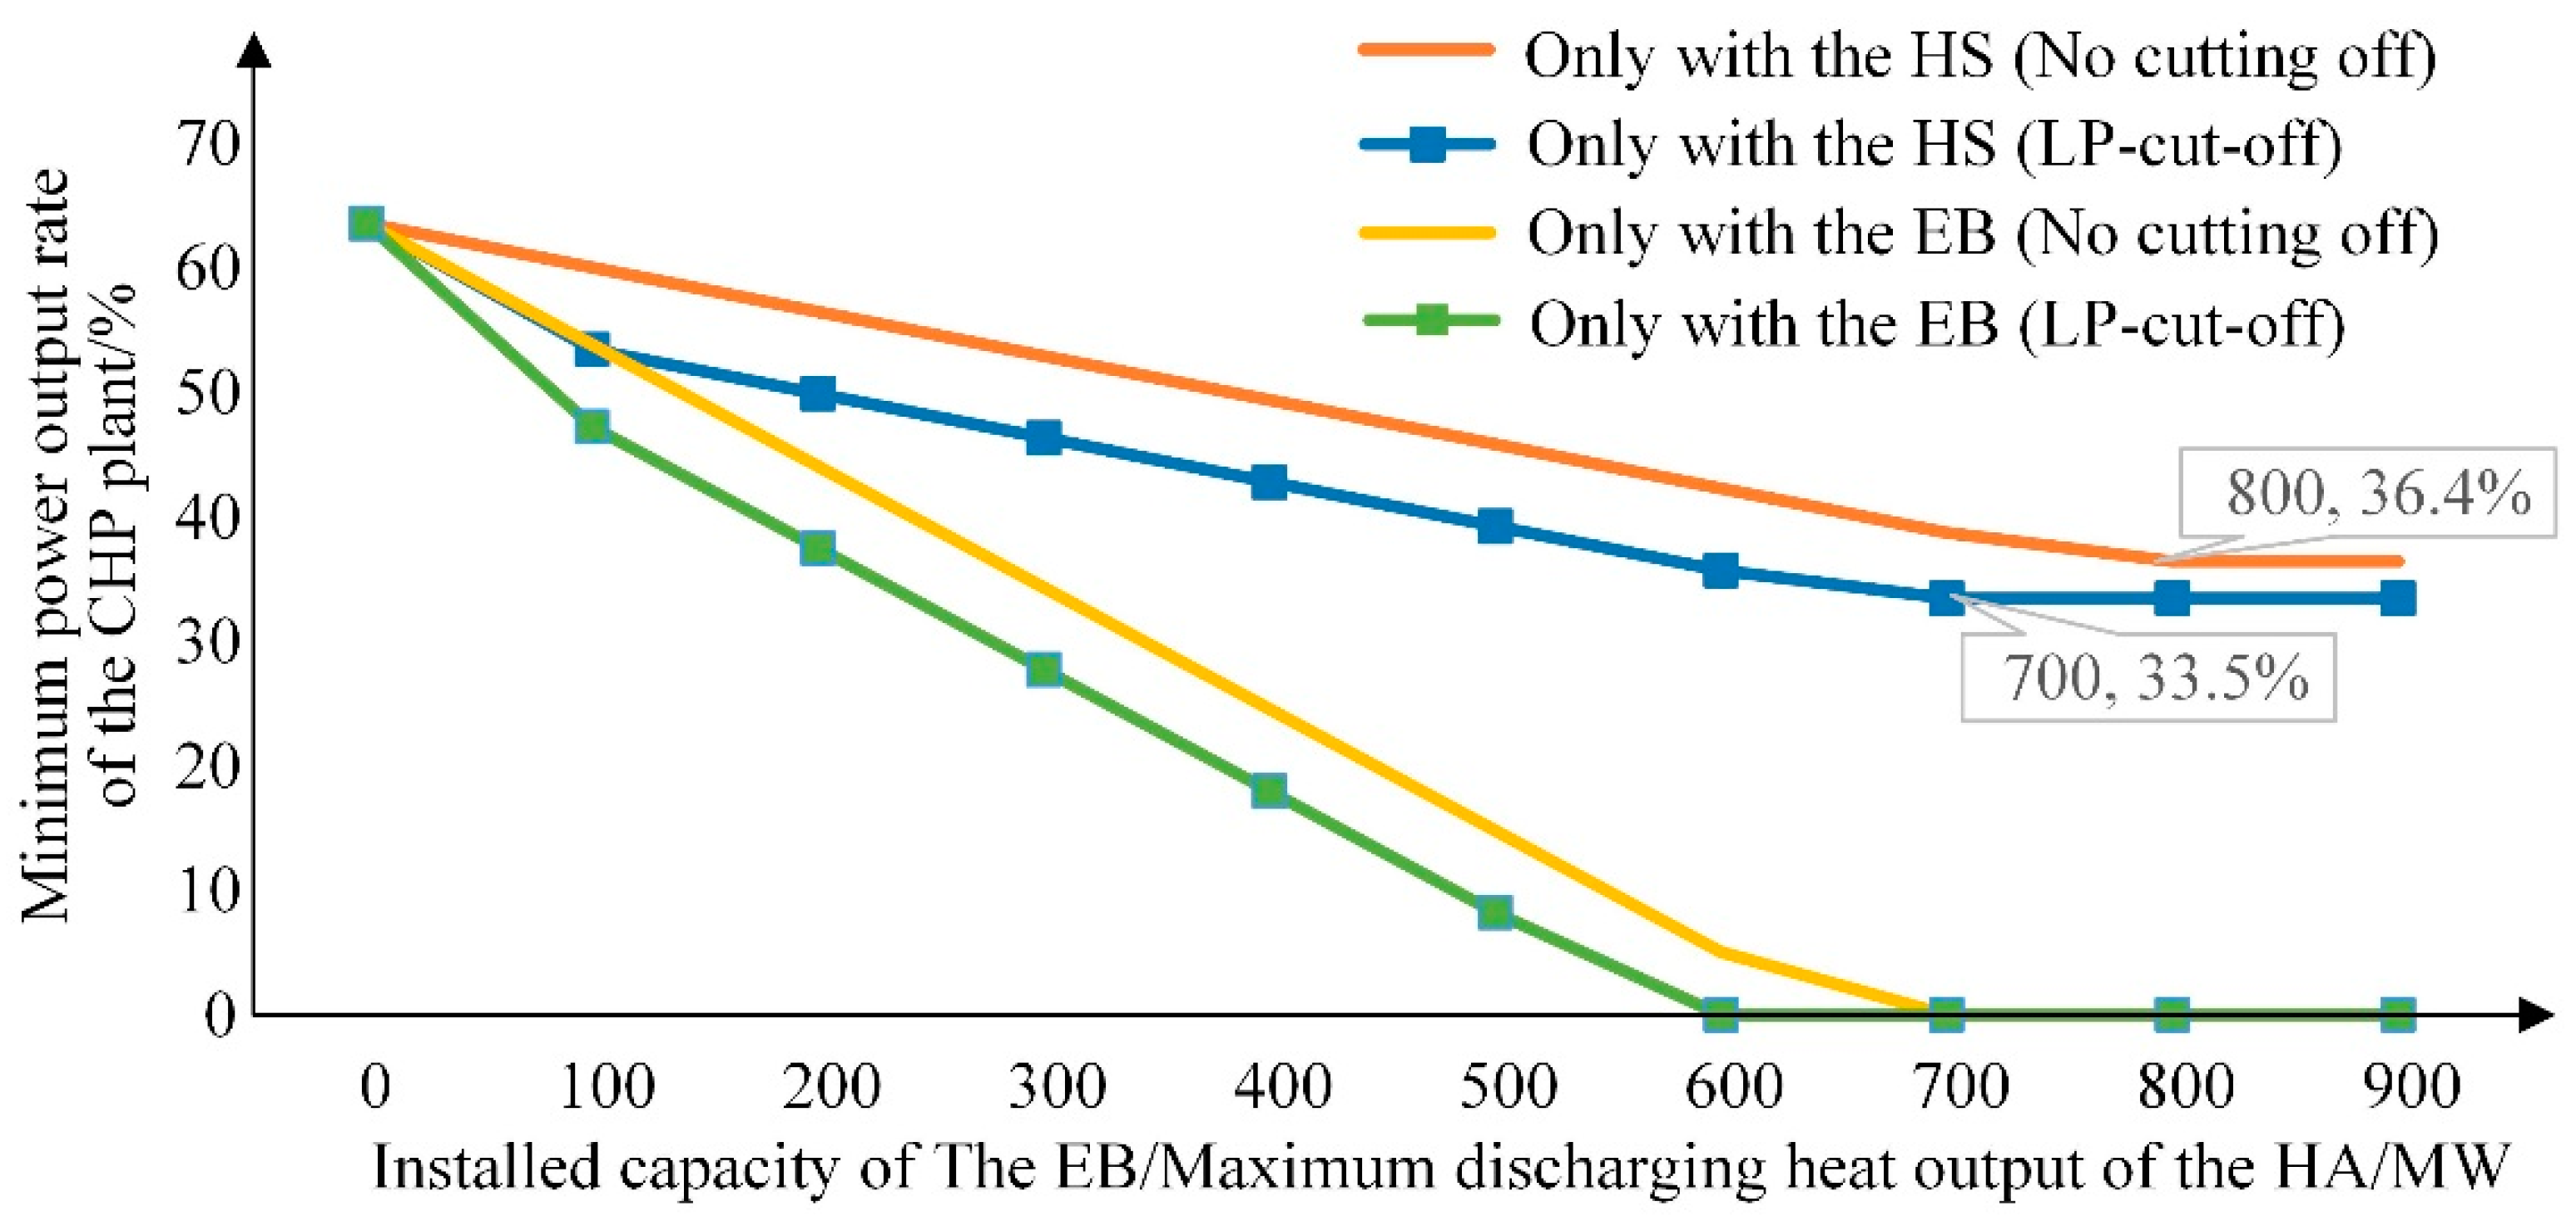
For this reason, this section further analyzes the effect on DDR after installing the HA and EB in the plant. It is assumed that the heat load of the CHP plant is 1648 MW, and only unit No. 2 of the plant has the ability of flexibly cutting off the LP turbine.
Figure 5 shows the minimum power output rate responding with the different parameters of the HA and the EB installed, respectively in the plant. From the curves, the larger capacity of the HA or the EB will result in further minimizing the power output rate. When unit No. 2 is under the LP-cut-off operation, the lowest value of 33.5% is the minimum power output rate of the plant equipped with the HA. For EB, as long as the capacity is large enough, the minimum power output of the plant can be reduced to 0.
7.3.2. Analysis of the Total Cost of Down-Regulation
The capacity of the EB and HA is large enough not to restrict the depth of down-regulation. The parameters are shown in
Table 2.
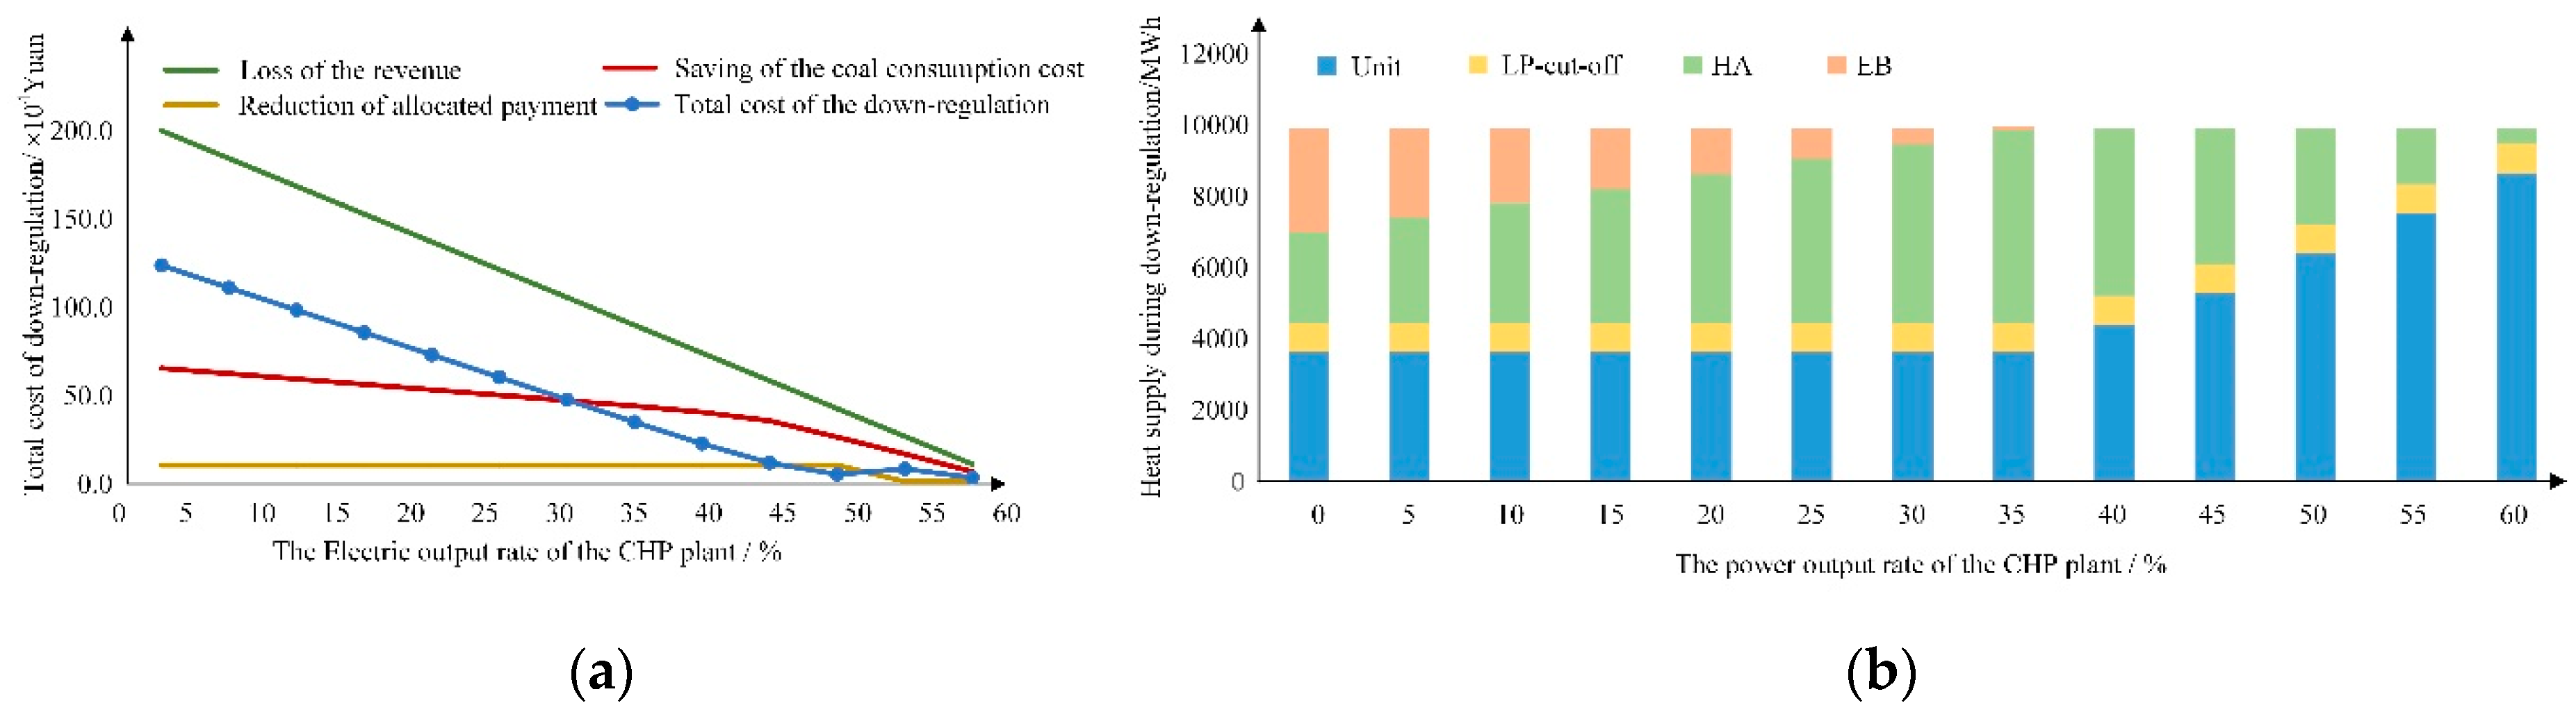
Analyze the relationship between the electric power output rate of the plant and the total cost for down-regulation from the approved minimum electric output (890 MW), and the curve is shown in
Figure 6a.
It is clear that as the electric power output rate of the plant decreases, the depth of down-regulation increases, and the loss of electricity sales revenue increases linearly. The total cost for down-regulation is the smallest at the electric power output rate of 50%, which is because the allocated payment for the reimbursement cost is suddenly reduced to 0.
It can be known from the heat components during the down-regulation shown in
Figure 6b that with the increase of the down-regulation depth, when the heat load cannot be met, it is necessary to enable flexible heating devices for heating compensation. The activation sequence is performed according to the coal consumption coefficient in the order of LP-cut-off, HA, then EB. The heat compensated by LP-cut-off and the HA are essentially waste heat from the middle pressure turbine, which has a lower cost than heat by EB. Therefore, the total cost for down-regulation increases significantly after using the EB. It can be seen that the depth of down-regulation directly affects the order of flexible heating devices activation and the total cost for down-regulation.
When the heat load on the plant changes, the approved power output rate is different.
Figure 7 shows the total cost for the DDR from different approved power output rates (60–45%) to 40%. It can be seen that with the reduction of the approved power output rate, the total cost is generally decreasing.
7.3.3. Analysis of the Average Cost for DDR
In the Northeast real-time DDR market, based on the minimum power output rate declared by each plant on a daily basis and the bidding price in two levels, the system will call the DDR capacity of plants according to the low price priority. Therefore, the realistic electric power output rate of a plant is not necessarily the minimum power output rate declared.
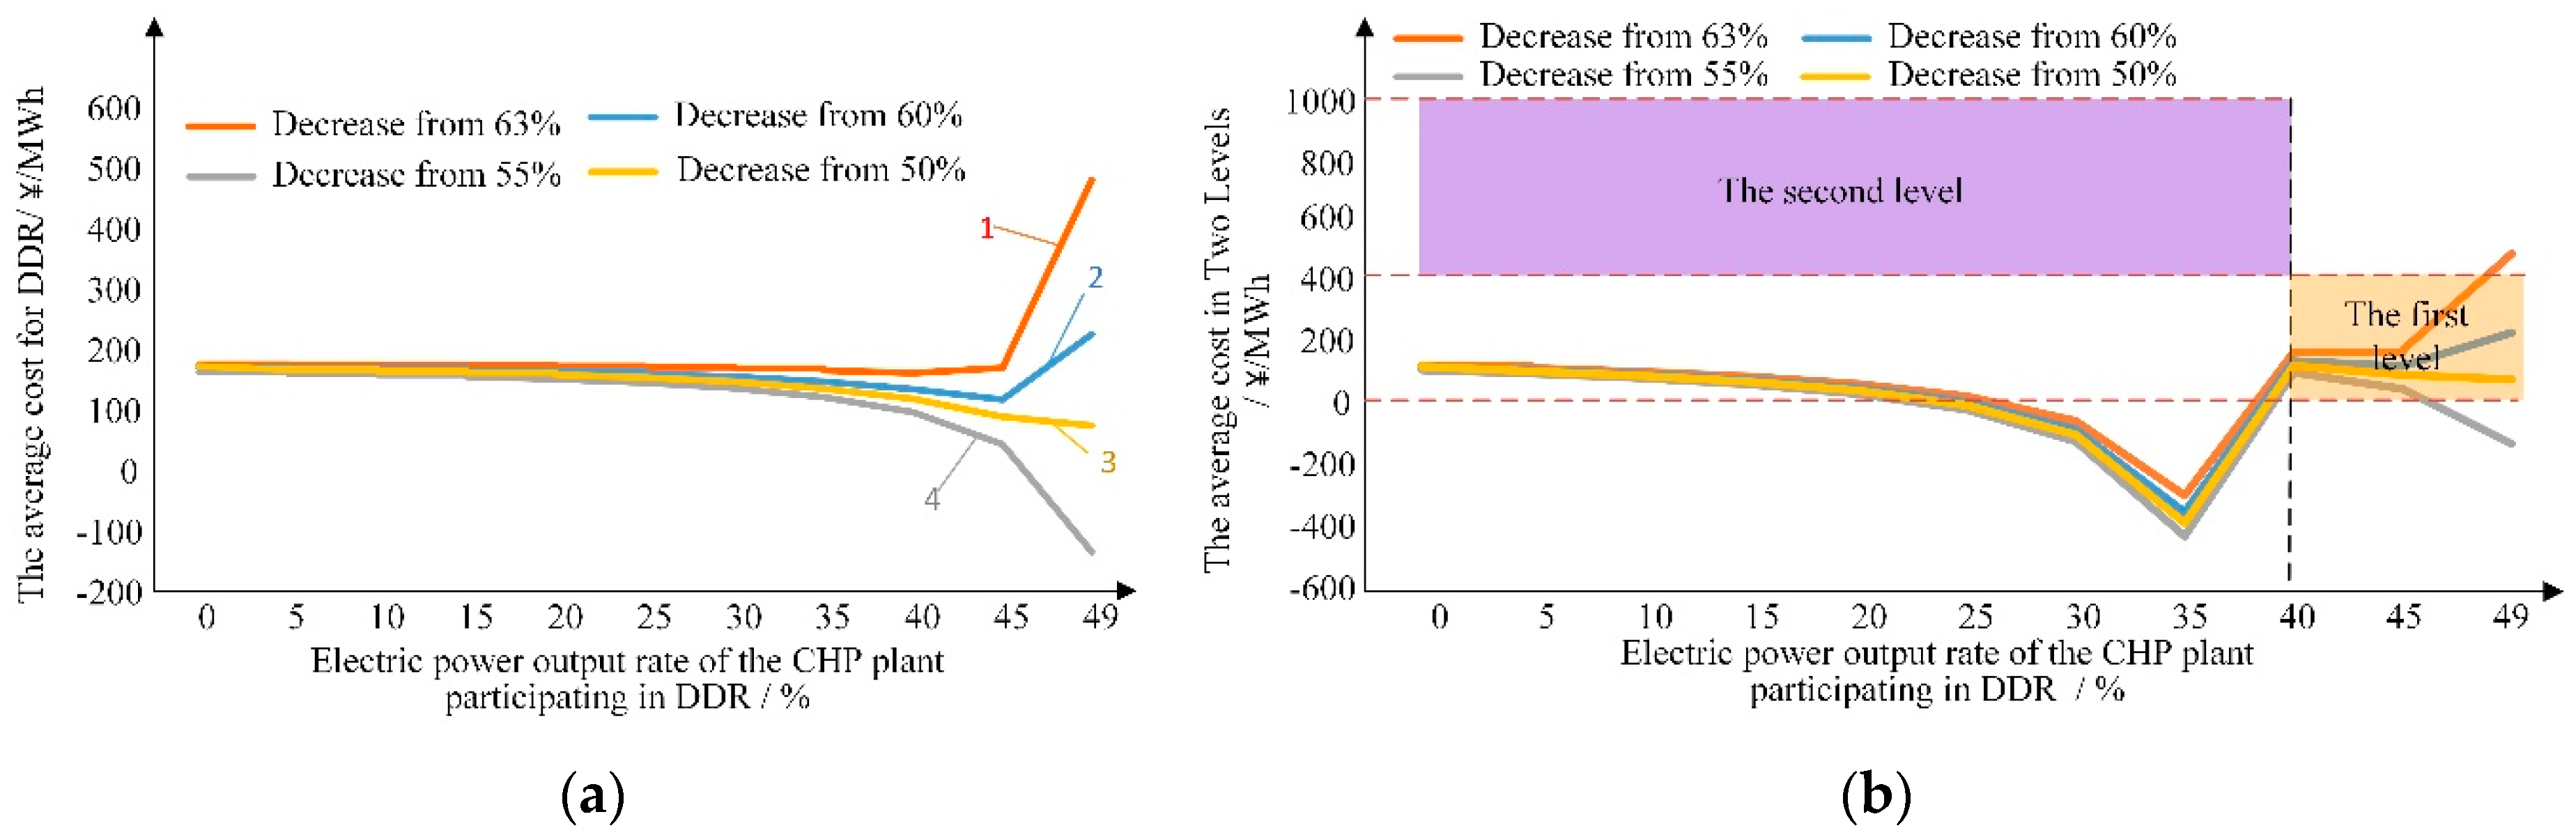
Figure 8a shows the average cost for the DDR when the CHP plant performs down-regulation from four different approved output rates determined by heat to a certain power output rate.
It can be seen that when the approved power output rate is above 55%, with the electric power output rate decreasing from 50%, the average cost will decrease and then slowly increase. The reason is that there is the fixed cost for down-regulation () shown in Equation (21). When the approved power output rate is high such as over 55%, the loss of generation profit by the down-regulation is greater than the avoided allocation payment, namely is a positive value. Therefore, the fixed cost needs to cover by being averaged in the power quantities of DDR when bidding. Therefore, with the increase of the depth of the DDR, the value of denominator of Equation (21) increases, then the average cost for the DDR decreases. At the same time, the greater the depth of the DDR, the lower efficiency of the CHP units. According to the quadratic function of coal consumption of the units, the coal consumption cost saved is lower. Then, the average cost will rise slowly.
In this example, when the approved power output rate is 55%, the lost profit is less than the avoided allocated payment when the electric power output rate is reduced to 50%, so
is a negative value. Therefore, when the depth of DDR is small, the average cost for the DDR is a negative value, as shown in
Figure 8a.
When the approved power output rate is below 50%, there is no fixed cost. As analyzed above, the deeper the DDR, the lower the efficiency of CHP unit, the less the loss of profit expressed by Equation (18), then the greater the total costs for down-regulation expressed as in Equation (21). Therefore, the average cost for the DDR increases slowly.
According to Equations (21) and (22), the averages cost for DDR of the first level and the second level can be calculated under different approved power output rates, and the curve is shown in
Figure 8b.
It can be seen that when the electric power output rate of the plant is reduced from four approved power output rates determined by different heat loads to below the baseline of DDR, the average cost in two levels is basically less than the bidding price limit of each level, so participating in the DDR can benefit.
The average cost for the DDR in two levels can be used as the basis of bid. For example, if the price strategy is based on the price-taker, the average cost in the first level is about 130 ¥/MWh when the electric power output rate is reduced from 60% to 40%, so the bid price can be set as 130 ¥/MWh. When the power output rate is reduced to 30%, the average costs in the first level and the second level are about 160 and −90 ¥/MWh, respectively, considering the bidding price limit, the two bids prices can be set to 160 and 400 ¥/MWh, respectively.
8. Conclusions
In this paper, the cost of a CHP plant with multiple types of units and flexible heating devices participating in the real-time DDR market in Northeast China is studied, which will be helpful for the CHP plants to construct their bidding strategies.
Several general models are established, which include the integral FOR model, the coal consumption function, an internal optimized dispatch model of the CHP plant, the model to minimize the electric power output, the models of total cost for down-regulation, and average cost for the DDR. These models are validated based on the realistic data of the plant in the Northeast of China. There are some conclusions as follows:
- (1)
Based on the established models, we can get the minimum electric power output rate of the plant under a given heat load, and the total cost of down-regulation from and the average cost for the DDR, so as to advise the plant to formulate the bidding strategy of participating in the market.
- (2)
When the plant performs down-regulation by flexibly cutting off the LP turbine, if the electric power output rate can reduce below the baseline, the LP-cut-off operation can be profitable; otherwise, down-regulation should not perform.
- (3)
In the middle period of heating, when providing DDR capacity to the market through flexible heating devices such as the HA and EB, the average cost is lower than the bidding price limit. From the perspective of operation, it has a large profit space, and the lower the heat load, the larger the profit space.

