Small Hydropower in the Baltic States—Current Status and Potential for Future Development


Abstract
1. Introduction
- nationally designated protected areas under the Laws of Protected areas.
- the EU Natura 2000 protected areas network established under the EU Habitats (92/43/EEC) and Birds (2009/147/EC) directives that form the cornerstones of the EU’s biodiversity policy.
- rivers and their stretches exempt from damming or so-called “no-go areas” for hydropower development
- to present a brief history and overview of the current status of small hydropower in the Baltic States,
- to analyse environmental laws and support schemes and national renewable energy strategies that affect the future development of small hydropower in the Baltic States, and
- to evaluate the possible capacity and electricity generation at historic and currently nonpowered dam sites in the Baltic States.
2. Materials and Methods
3. Results
3.1. Short Overview of Electricity Sector in the Baltic States
3.1.1. Estonia
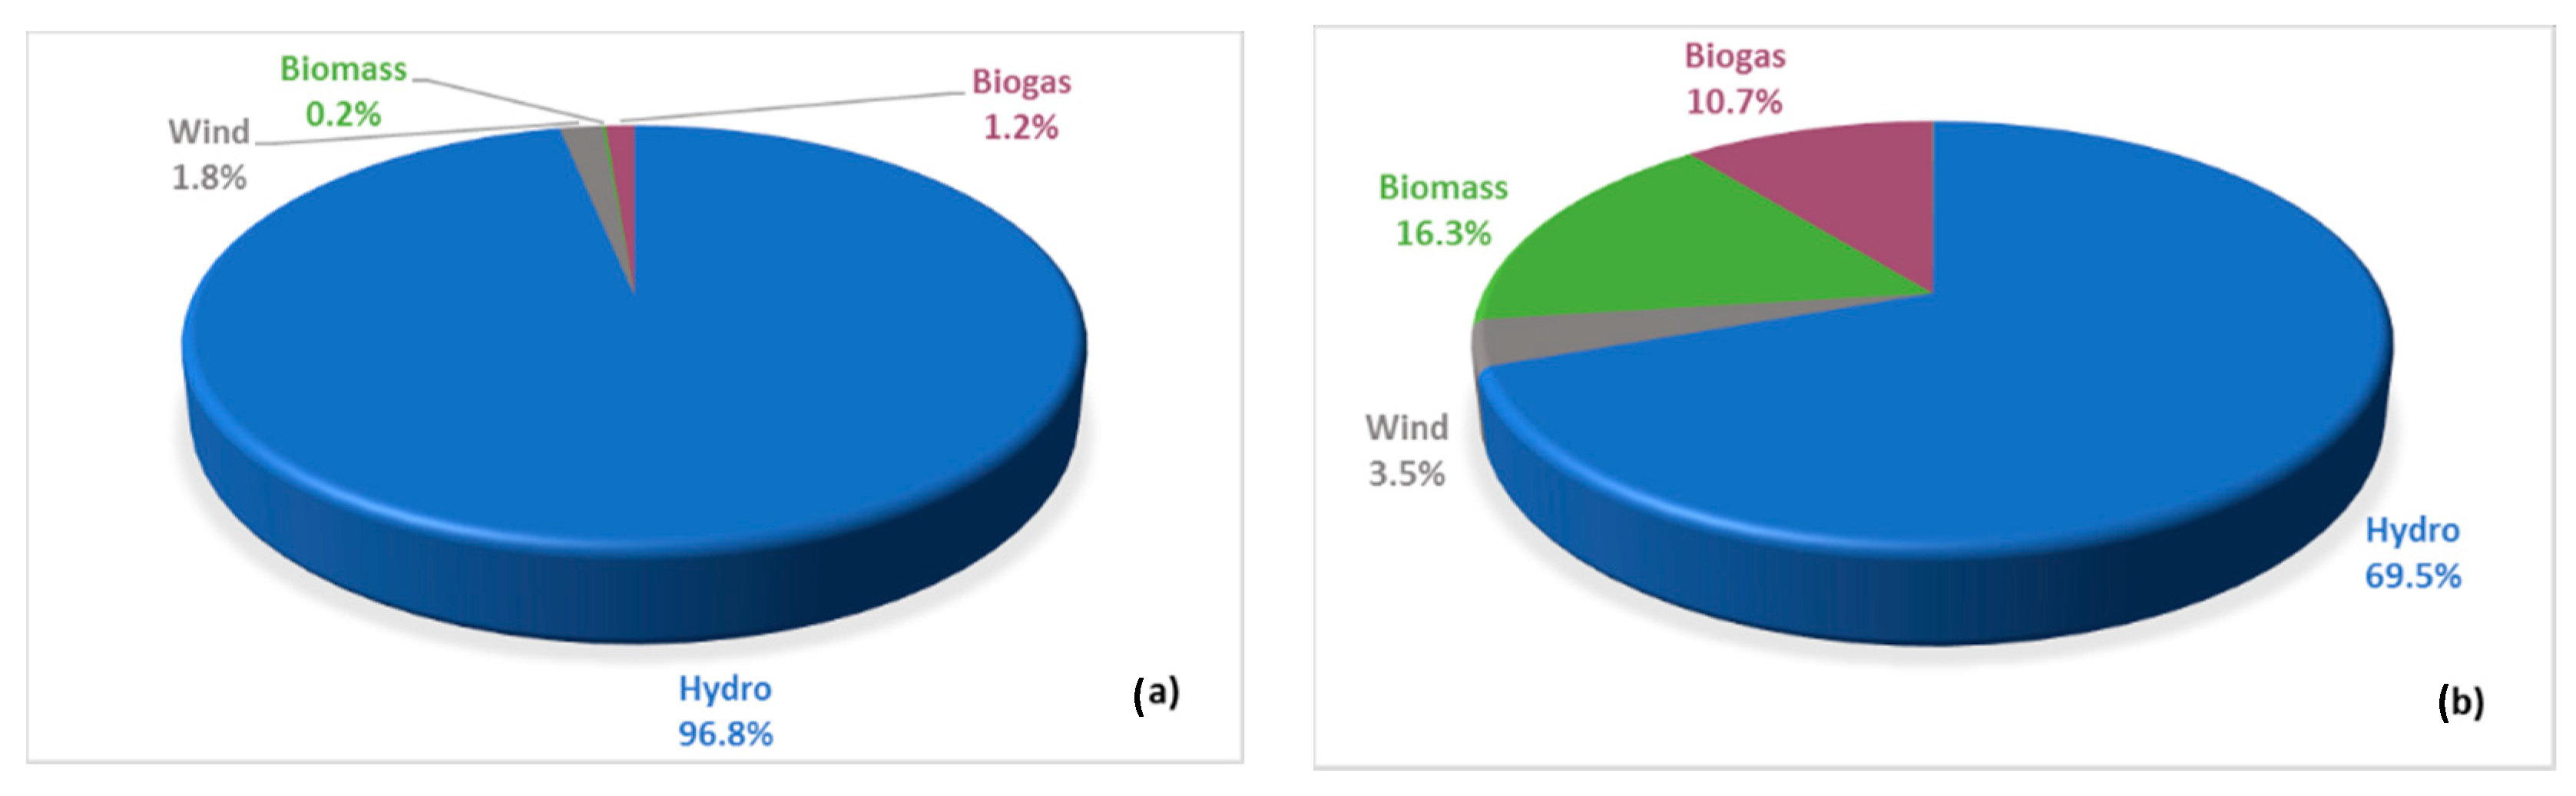
3.1.2. Latvia
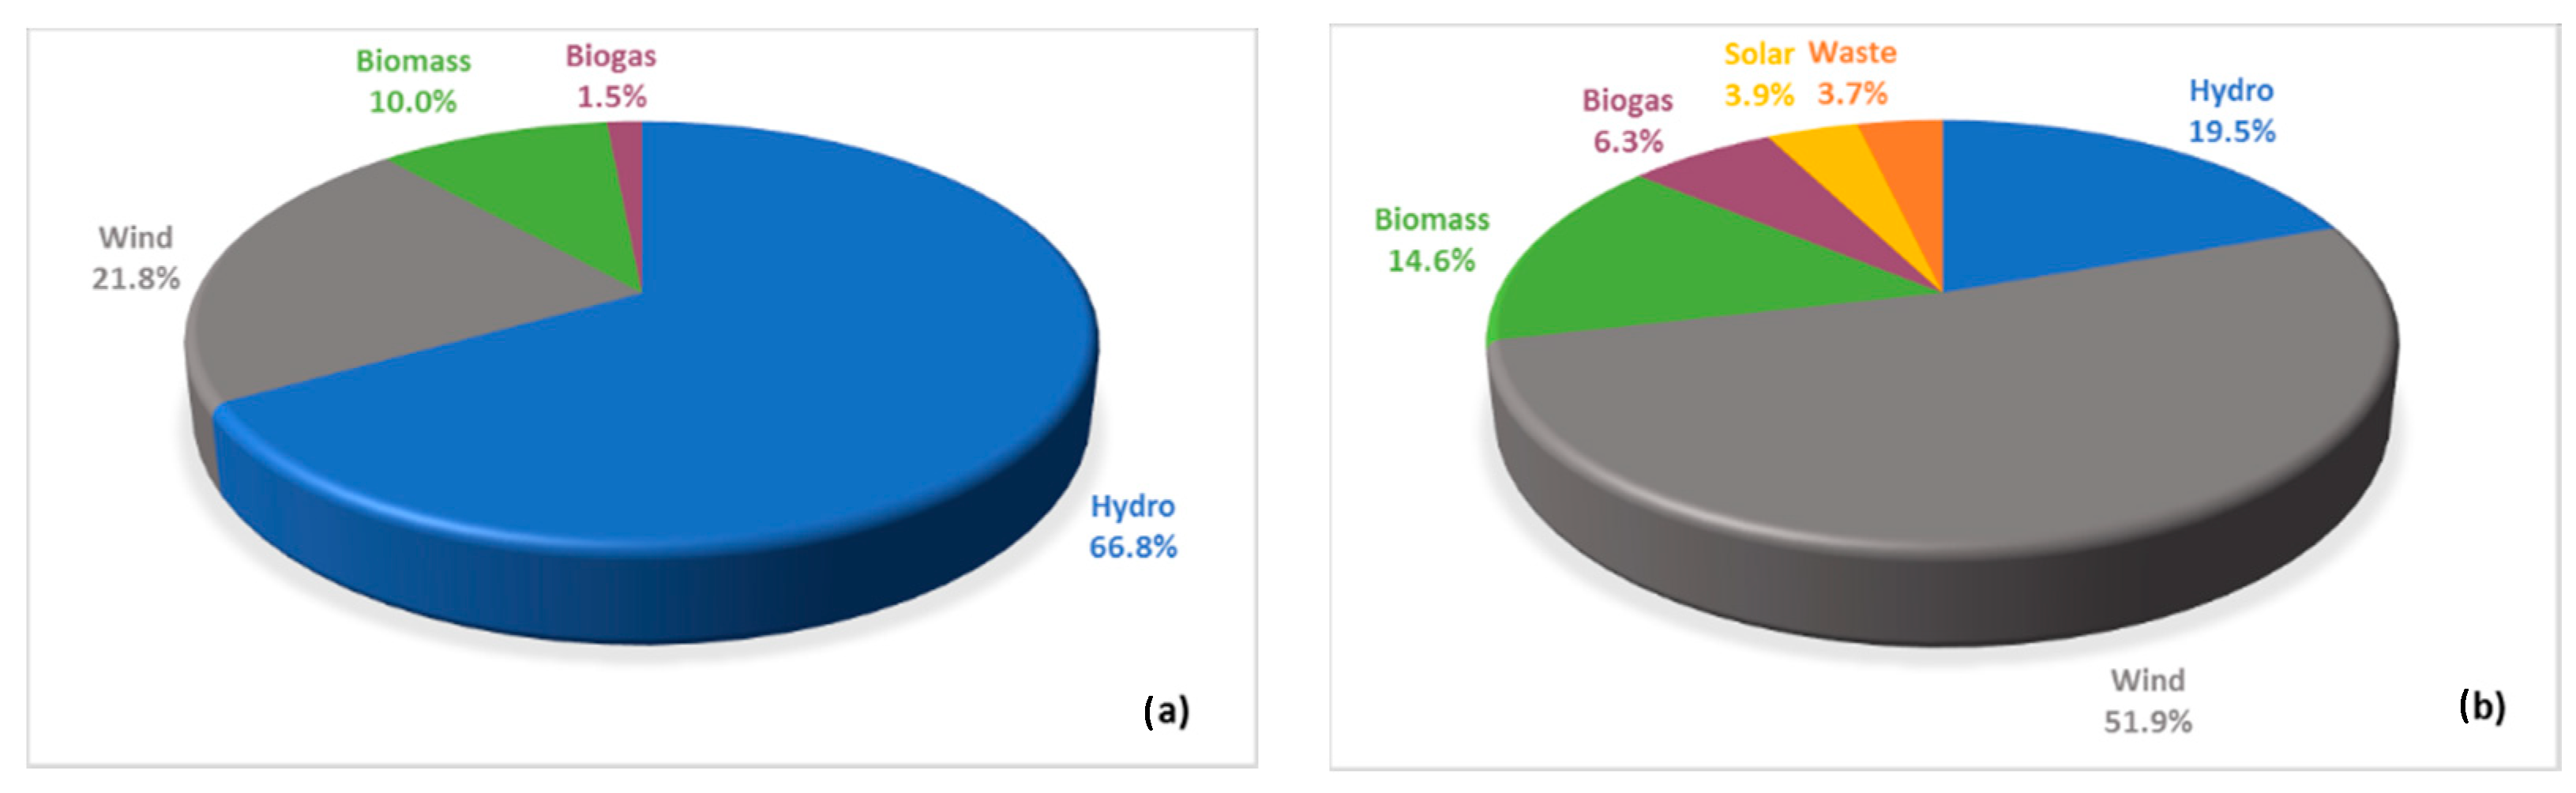
3.1.3. Lithuania
3.1.4. Toward a Renewable Future
3.2. History and the Current Status of Small Hydropower in the Baltic States
3.3. Existing Potential and Support Schemes
3.3.1. Existing Potential for Small Hydropower
3.3.2. Support Schemes for Renewable Energy Producers
3.4. Historic and Currently Nonpowered Dam Sites in the Baltic States
3.4.1. Number of Sites
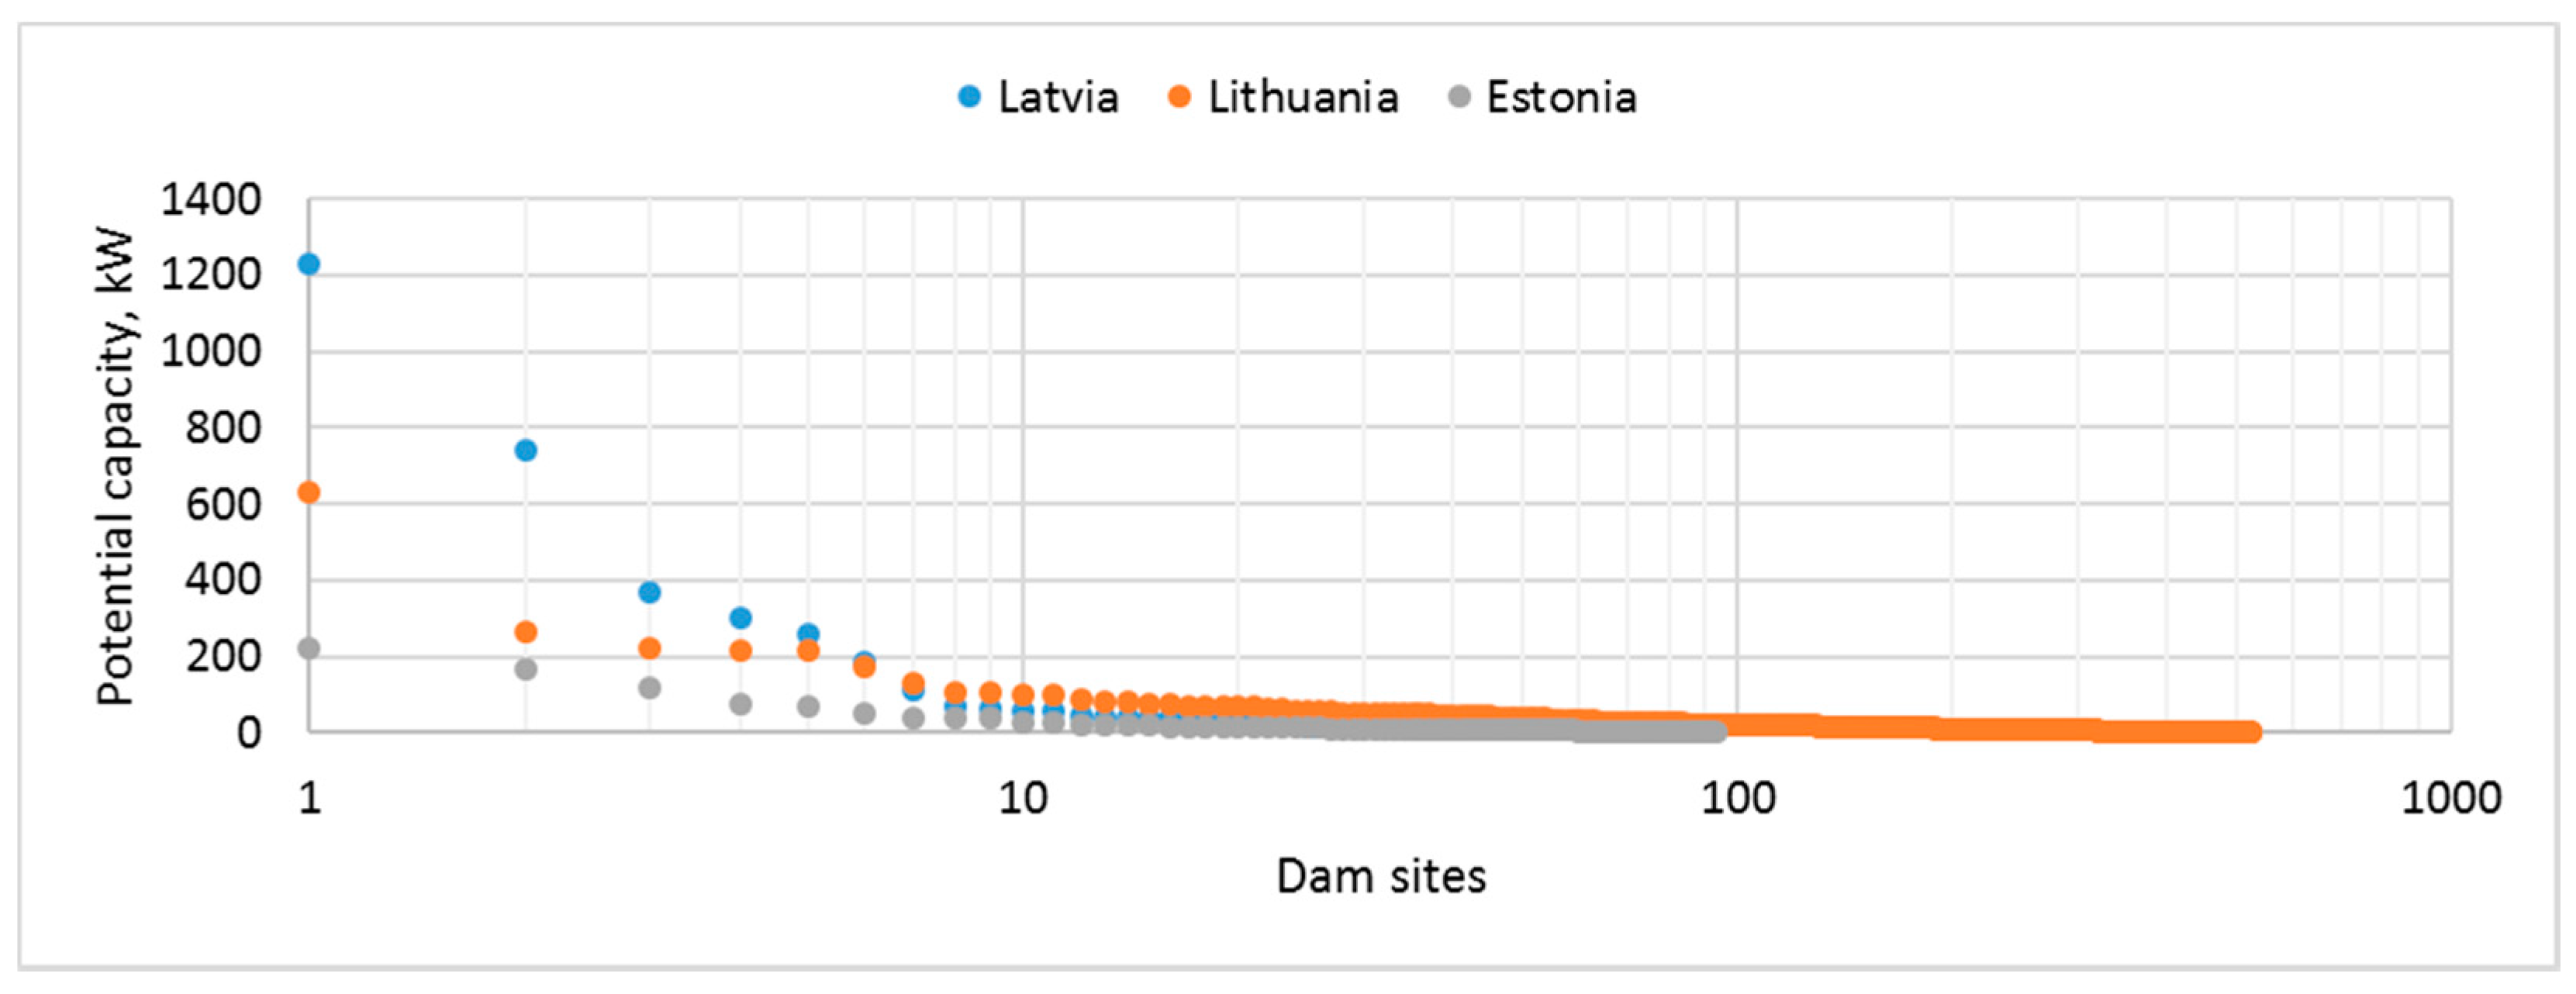
3.4.2. Potential Capacity and Electricity Generation
3.4.3. Sites in Environmentally Sensitive Areas
3.4.4. Share of the Potential Hydropower Generation of Historic Sites in the Remaining Small Hydropower Potential
4. Discussion
Author Contributions
Funding
Conflicts of Interest
Abbreviations
| CDDA | Common database on designated areas |
| EC | European Commission |
| EU | European Union |
| GIS | Geographic information system |
| NECP | National energy and climate plan |
| NREP | National renewable energy plan |
| PSO | Public service obligation |
| SHP | Small hydropower |
References
- European Commission and International Renewable Energy Agency. Renewable Energy Prospects for the European Union. Executive Summary; EC and IRENA: Brussels, Belgium, 2018. [Google Scholar]
- Eurostat. Renewable Energy Statistics. Available online: https://ec.europa.eu/eurostat/statistics-explained/index.php/Renewable_energy_statistics (accessed on 2 December 2020).
- Liu, D.; Liu, H.; Wang, X.; Kremere, E. (Eds.) World Small Hydropower Development Report 2019; United Nations Industrial Development Organization and International Center on Small Hydro Power: Hangzhou, China, 2019. [Google Scholar]
- European Commission. National Renewable Energy Action Plans. Available online: https://ec.europa.eu/energy/topics/renewable-energy/national-renewable-energy-action-plans-2020_en (accessed on 2 December 2020).
- EurObserv’ER. Barometer of the Renewable Energies in EU. Available online: https://www.eurobserv-er.org/ (accessed on 2 December 2020).
- UNIDO/ICSHP. The World Small Hydropower Development Report 2016; United Nations Industrial Development Organization and International Center on Small Hydro Power: Hangzhou, China, 2016. [Google Scholar]
- European Small Hydropower Association. Statistical Releases. D3.3. Energy; D4.3 Market; D5.3 Policy. SHP Stream Map Project (2009–2012). Available online: https://issuu.com/esha89/docs/d._7.1__statistical_release (accessed on 2 December 2020).
- European Renewable Energy Council. Renewable Energy in Europe. Markets, Trends and Technologies; Earthscan: London, UK, 2010. [Google Scholar]
- Anderson, D.; Moggridge, H.; Warren, P.; Shucksmith, J. The impacts of ‘run-of-river’ hydropower on the physical and ecological condition of rivers. Water Environ. J. 2015, 29, 268–276. [Google Scholar] [CrossRef]
- Nguyen, T.H.T.; Everaert, G.; Boets, P.; Forio, M.A.E.; Bennetsen, E.; Volk, M.; Hoang, T.H.T.; Goethals, P.L.M. Modelling tools to analyze and assess the ecological impact of hydropower dams. Water 2018, 10, 259. [Google Scholar] [CrossRef]
- Hedger, R.D.; Sauterleute, J.; Sundt-Hansen, L.; Forseth, T.; Ugedal, O.; Diserud, O.H.; Bakken, T.H. Modelling the effect of hydropeaking-induced stranding mortality on Atlantic salmon population abundance. Ecohydrology 2018, 11, e1960. [Google Scholar] [CrossRef]
- Suwal, N.; Huang, X.; Kuriqi, A.; Chen, Y.; Pandey, K.P.; Bhattarai, K.P. Optimisation of cascade reservoir operation considering environmental flows for different environmental management classes. Renew. Energy 2020, 158, 453–464. [Google Scholar] [CrossRef]
- Li, Y.; Wu, J.; Liu, L.; Wu, L.; Huo, W. The study on assessment of fish habitat in de-watered river channel due to diversion-type hydropower station. Energy Procedia 2016, 100, 496–500. [Google Scholar] [CrossRef]
- Athayde, S.; Duarte, C.G.; Gallardo, A.L.C.F.; Moretto, E.M.; Sangoi, L.A.; Dibo, A.P.A.; Siqueira-Gay, J.; Sánchez, L.E. Improving policies and instruments to address cumulative impacts of small hydropower in the Amazon. Energy Policy 2019, 132, 265–271. [Google Scholar] [CrossRef]
- Dorber, M.; Mattson, K.R.; Sandlund, O.T.; May, R.; Verones, F. Quantifying net water consumption of Norwegian hydropower reservoirs and related aquatic biodiversity impacts in Life Cycle Assessment. Environ. Impact Assess. Rev. 2019, 76, 36–46. [Google Scholar] [CrossRef]
- Simonov, E.A.; Nikitina, O.I.; Egidarev, E.G. Freshwater ecosystems versus hydropower development: Environmental assessments and conservation measures in the transboundary Amur River basin. Water 2019, 11, 1570. [Google Scholar] [CrossRef]
- Buddendorf, W.B.; Jackson, F.L.; Malcolm, I.A.; Millidine, K.J.; Geris, J.; Wilkinson, M.E.; Soulsby, C. Integration of juvenile habitat quality and river connectivity models to understand and prioritise the management of barriers for Atlantic salmon populations across spatial scales. Sci. Total Environ. 2019, 655, 557–566. [Google Scholar] [CrossRef]
- European Union. Council Directive 92/43/EEC of 21 May 1992 on the Conservation of Natural Habitats and of Wild Fauna and Flora. Available online: https://eur-lex.europa.eu/legal-content/EN/TXT/?uri=CELEX:31992L0043 (accessed on 2 December 2020).
- Ministry of Environment of the Republic of Estonia. Confirmation of the List of Spawns and Habitats for Salmonids (Salmon, Sea Trout, River Trout, Bristles). Available online: https://www.riigiteataja.ee/akt/22598 (accessed on 2 December 2020).
- Cabinet of Ministers of the Republic of Latvia. Regulations on Rivers (River Steps) for Which it is Prohibited to Construct and Renew Hydroelectric Dams and to Create any Mechanical Obstacles for the Protection of Fish Resources. Available online: https://likumi.lv/doc.php?id=58603 (accessed on 2 December 2020).
- Government of the Republic of Lithuania. Resolution on the Validation of the List of the Ecologically and Culturally Sensitive Rivers and Their Stretches. Resolution Nr. 1144, Official Gazette, Nr. 137-4995; Government of the Republic of Lithuania: Vilnius, Lithuania, 2004. [Google Scholar]
- Punys, P.; Kasiulis, E.; Kvaraciejus, A.; Dumbrauskas, A.; Vyčienė, G.; Šilinis, L. Impacts of the EU and national environmental legislation on tapping hydropower resources in Lithuania—A lowland country. Renew. Sustain. Energy Rev. 2017, 80, 495–504. [Google Scholar] [CrossRef]
- Vuta, L.I.; Dumitran, G.E.; Popa, B.; Diminescu, M.A.; Tica, E.I. Hidden hydro related with non-powered dams in Romania. In Proceedings of the International Conference on Energy and Environment, Timisoara, Romania, 17–18 October 2019. [Google Scholar]
- van Vuuren, S.J.; Blersch, C.L.; van Dijk, M. Modelling the feasibility of retrofitting hydropower to existing South African dams. Water SA 2011, 37, 679–692. [Google Scholar] [CrossRef][Green Version]
- Jia, J.; Punys, P.; Ma, J. Hydropower. In Handbook of Climate Change Mitigation; Springer Science: New York, NY, USA, 2012; pp. 1357–1401. [Google Scholar]
- Punys, P.; Kvaraciejus, A.; Dumbrauskas, A.; Šilinis, L.; Popa, B. An assessment of micro-hydropower potential at historic watermill, weir, and non-powered dam sites in selected EU countries. Renew. Energy 2019, 133, 1108–1123. [Google Scholar] [CrossRef]
- European Environment Agency. Natura 2000 Data—The European Network of Protected Sites. Available online: https://www.eea.europa.eu/data-and-maps/data/natura-11 (accessed on 2 December 2020).
- Löhnertz, M. CDDA; Version 13; European Topic Centre on Biological Diversity: Dhaka, Bangladesh, 2015. [Google Scholar]
- Dementjeva, N.; Siirde, A. Analysis of current Estonian energy situation and adaptability of LEAP model for Estonian energy sector. Energetika 2010, 56, 75–84. [Google Scholar]
- Statistics Estonia. Available online: https://www.stat.ee/en (accessed on 2 December 2020).
- Central Statistics Bureau of Latvia. Available online: https://www.csb.gov.lv/en/sakums (accessed on 2 December 2020).
- Prodanuks, T.; Cimdina, G.; Veidenbergs, I.; Blumberga, D. Sustainable development of biomass CHP in Latvia. Energy Procedia 2016, 95, 372–376. [Google Scholar] [CrossRef][Green Version]
- Statistics Lithuania. Available online: https://www.stat.gov.lt/en (accessed on 2 December 2020).
- Lithuanian Electricity Transmission System Operator. Available online: https://www.litgrid.eu/ (accessed on 2 December 2020).
- European Commission. National Energy and Climate Plans (NECPs). Available online: https://ec.europa.eu/energy/topics/energy-strategy/national-energy-climate-plans_en (accessed on 2 December 2020).
- Alatalu, R.; Kõivupuu, M. Estonian Heritage; Estonian Institute: Tallinn, Estonia, 2014. [Google Scholar]
- Punys, P.; Ruplys, B.; Kasiulis, E. (Eds.) Hydropower in Lithuania; Lithuanian Hydropower Association: Kaunas, Lithuania, 2011. [Google Scholar]
- Shipkovs, P.; Kashkarova, G.; Lebedeva, K.; Migla, L.; Snegirjovs, A.; Shipkovs, J. Potential and analysis of grid integrated renewables in Latvia. Energy Procedia 2014, 57, 735–744. [Google Scholar] [CrossRef]
- Raesaar, P. Resource and utilization of Estonian hydropower. Oil Shale 2005, 22, 233–241. [Google Scholar]
- Shipkovs, P.; Kashkarova, G.; Shipkovs, M. Renewable energy utilization in Latvia. Renew. Energy 1999, 16, 1241–1244. [Google Scholar] [CrossRef]
- European Commission. Stream Map for Small Hydropower in the EU (SHP STREAMMAP). Available online: https://ec.europa.eu/energy/intelligent/projects/en/projects/shp-streammap (accessed on 2 December 2020).
- Elering. Renewable Energy Subsidy. Available online: https://elering.ee/en/renewable-energy-subsidy#tab1 (accessed on 2 December 2020).
- Ministry of Economics of the Republic of Latvia. Energy Production. Available online: https://www.em.gov.lv/en/energy-production (accessed on 2 December 2020).
- National Energy Regulatory Council. Fixed Tariffs for Electricity Producers Using Renewable Energy Sources. Available online: https://www.regula.lt/atsinaujinantys-istekliai/Puslapiai/tarifai.aspx (accessed on 2 December 2020).
- European Commission. Guidance Document on the Requirements for Hydropower in Relation to EU Nature Legislation; Publications Office of the EU: Luxembourg, 2018. [Google Scholar]
- European Commission. Guidance on the Requirements for Hydropower in Relation to Natura 2000; European Commission: Brussels, Belgium, 2018. [Google Scholar]
- European Environment Agency. IUCN Management Categories. Available online: https://www.eea.europa.eu/themes/biodiversity/protected-areas/facts-and-figures/IUCN-management-categories (accessed on 2 December 2020).
- Sachdev, H.S.; Akella, A.K.; Kumar, N. Analysis and evaluation of small hydropower plants: A bibliographical survey. Renew. Sustain. Energy Rev. 2015, 51, 1013–1022. [Google Scholar] [CrossRef]
- Unipede-Eurelectric. Statistical Terminology Employed in the Electricity Supply Industry; 1991; Unpublished. [Google Scholar]
- Punys, P.; Dumbrauskas, A.; Kasiulis, E.; Vyčienė, G.; Šilinis, L. Flow regime changes: From impounding a temperate lowland river to small hydropower operations. Energies 2015, 8, 7478–7501. [Google Scholar] [CrossRef]
- Punys, P. Aplinkosauginių Rekomendacijų Hidroelektrinių (HE) Neigiamam Poveikiui Sumažinti Parengimas; Aplinkos Apsaugos Agentūra: Vilnius, Lithuania, 2010. (In Lithuanian) [Google Scholar]
- Kasiulis, E. Dam removal in the Baltic States: Mission (im)possible. Energetyka Wodna 2020, 3, 48–49. [Google Scholar]
- Bracken, L.J.; Bulkeley, H.A.; Maynard, C.M. Micro-hydro power in the UK: The role of communities in an emerging energy resource. Energy Policy 2014, 68, 92–101. [Google Scholar] [CrossRef]
- Parasiewicz, P.; Rogers, J.N.; Vezza, P.; Gortazar, J.; Seager, T.; Pegg, M.; Wisniewolski, W.; Comoglio, C. Applications of the MesoHABSIM Simulation Model. In Ecohydraulics: An Integrated Approach; John Wiley & Sons, Ltd.: Chichester, UK, 2013. [Google Scholar]
- Zingraff-Hamed, A.; Noack, M.; Greulich, S.; Schwarzwälder, K.; Pauleit, S.; Wantzen, K.M. Model-based evaluation of the effects of river discharge modulations on physical fish habitat quality. Water 2018, 10, 374. [Google Scholar] [CrossRef]
- van Treeck, R.; Van Wichelen, J.; Wolter, C. Fish species sensitivity classification for environmental impact assessment, conservation and restoration planning. Sci. Total Environ. 2020, 708, 135173. [Google Scholar] [CrossRef] [PubMed]
- O’Hanley, J.R.; Pompeu, P.S.; Louzada, M.; Zambaldi, L.P.; Kemp, P.S. Optimizing hydropower dam location and removal in the São Francisco river basin, Brazil to balance hydropower and river biodiversity tradeoffs. Landsc. Urban Plan. 2020, 195, 103725. [Google Scholar] [CrossRef]
- Tamm, O.; Tamm, T. Verification of a robust method for sizing and siting the small hydropower run-of-river plant potential by using GIS. Renew. Energy 2020, 155, 153–159. [Google Scholar] [CrossRef]
- Quaranta, E.; Revelli, R. Gravity water wheels as a micro hydropower energy source: A review based on historic data, design methods, efficiencies and modern optimisations. Renew. Sustain. Energy Rev. 2018, 97, 414–427. [Google Scholar] [CrossRef]
- Bozhinova, S.; Hecht, V.; Kisliakov, D.; Müller, G.; Schneider, S. Hydropower converters with head differences below 2.5 m. ICE Proc. Energy 2012, 166, 107–119. [Google Scholar]


| 2016 | Anticipated by 2020 | |||||
|---|---|---|---|---|---|---|
| EurObserv’ER [5] | International Center on Small Hydropower [6] | EurObserv’ER [5] | National Renewable Energy Action Plans [4] | European Small Hydropower Association [7] | Green-X Project [8] | |
| Total capacity, GW | 14.3 | 15.0 | 15.0 | 16.3 | 17.3 | - |
| Generation, TWh/year | 47.2 | 54.5 | 45.0 | 54.1 | 59.7 | 68.4 |
| 2012 | 2014 | 2016 | 2018 | ||||||
|---|---|---|---|---|---|---|---|---|---|
| MW | GWh | MW | GWh | MW | GWh | MW | GWh | ||
| Estonia | Wind (installed) | 266 | 434 | 334 | 604 | 304 | 594 | 306 | 636 |
| Wind (NREAP goal) | 311 | 432 | 400 | 855 | 500 | 974 | 550 | 1320 | |
| Latvia | Wind (installed) | 59 | 114 | 69 | 139 | 70 | 128 | 78 | 122 |
| Wind (NREAP goal) | 49 | 100 | 80 | 175 | 137 | 300 | 235 | 517 | |
| Solar (installed) | 0 | 0 | 0 | 0 | 0 | 0 | 2 | 1 | |
| Solar (NREAP goal) | 1 | 1 | 1 | 1 | 1 | 2 | 2 | 4 | |
| Biomass (installed) | 23 | 65 | 63 | 319 | 81 | 427 | 97 | 570 | |
| Biomass (NREAP goal) | 8 | 49 | 34 | 198 | 55 | 321 | 76 | 447 | |
| Lithuania | Wind (installed) | 275 | 540 | 288 | 639 | 509 | 1136 | 533 | 1144 |
| Wind (NREAP goal) | 250 | 563 | 350 | 813 | 500 | 1111 | 500 | 1250 | |
| Solar (installed) | 7 | 2 | 69 | 73 | 70 | 67 | 82 | 87 | |
| Solar (NREAP goal) | 3 | 3 | 8 | 9 | 10 | 15 | 10 | 15 | |
| Biomass (installed) | 38 | 176 | 48 | 292 | 48 | 262 | 51 | 322 | |
| Biomass (NREAP goal) | 40 | 161 | 98 | 416 | 135 | 626 | 162 | 810 | |
| Potential, GWh/Year | Estonia | Latvia | Lithuania |
|---|---|---|---|
| Gross theoretical | n/a | 1160 | 2093 |
| Technically feasible | 85 | 730 | 853 |
| Economically feasible | 70 | 400 | 617 |
| Environmentally compliant | 50 | 334 | 287 |
| Remaining | 24 | 224 | 180 |
| Country | Number of Sites Used in This Study | Density of Micro-Hydro Sites (Number Per 1000 km2) | ||||
|---|---|---|---|---|---|---|
| Total | Watermills | Dams | Total | Watermills | Dams | |
| Estonia | 347 | 254 | 93 | 7.7 | 5.6 | 2.1 |
| Latvia | 453 | 367 | 86 | 7.0 | 5.7 | 1.3 |
| Lithuania | 739 | 214 | 524 | 11.3 | 3.3 | 8.0 |
| Total | 1539 | 835 | 703 | 8.8 | 4.8 | 4.0 |
| Not Including Constraints | Including Constraints | |
|---|---|---|
| Watermills | ||
| Estonia | 59.2% | 30.4% |
| Latvia | 46.9% | 6.7% |
| Lithuania | 36.8% | 17.9% |
| Dams | ||
| Estonia | 25.4% | 16.7% |
| Latvia | 7.8% | 1.8% |
| Lithuania | 19.9% | 16.5% |
Publisher’s Note: MDPI stays neutral with regard to jurisdictional claims in published maps and institutional affiliations. |
© 2020 by the authors. Licensee MDPI, Basel, Switzerland. This article is an open access article distributed under the terms and conditions of the Creative Commons Attribution (CC BY) license (http://creativecommons.org/licenses/by/4.0/).
Share and Cite
Kasiulis, E.; Punys, P.; Kvaraciejus, A.; Dumbrauskas, A.; Jurevičius, L. Small Hydropower in the Baltic States—Current Status and Potential for Future Development. Energies 2020, 13, 6731. https://doi.org/10.3390/en13246731
Kasiulis E, Punys P, Kvaraciejus A, Dumbrauskas A, Jurevičius L. Small Hydropower in the Baltic States—Current Status and Potential for Future Development. Energies. 2020; 13(24):6731. https://doi.org/10.3390/en13246731
Chicago/Turabian StyleKasiulis, Egidijus, Petras Punys, Algis Kvaraciejus, Antanas Dumbrauskas, and Linas Jurevičius. 2020. "Small Hydropower in the Baltic States—Current Status and Potential for Future Development" Energies 13, no. 24: 6731. https://doi.org/10.3390/en13246731
APA StyleKasiulis, E., Punys, P., Kvaraciejus, A., Dumbrauskas, A., & Jurevičius, L. (2020). Small Hydropower in the Baltic States—Current Status and Potential for Future Development. Energies, 13(24), 6731. https://doi.org/10.3390/en13246731