Article

Cost-Economic Analysis of Hydrogen for China’s Fuel Cell Transportation Field

1
Sichuan Energy Internet Research Institute, Tsinghua University, Chengdu 610042, China
2
School of Mechanical Engineering, Southwest Petroleum University, Chengdu 610050, China
*
Author to whom correspondence should be addressed.
Energies 2020, 13(24), 6522; https://doi.org/10.3390/en13246522
Submission received: 16 November 2020 / Revised: 5 December 2020 / Accepted: 8 December 2020 / Published: 10 December 2020
(This article belongs to the Section A5: Hydrogen Energy)

Abstract

:
China has become a major market for hydrogen used in fuel cells in the transportation field. It is key to control the cost of hydrogen to open up the Chinese market. The development status and trends of China’s hydrogen fuel industry chain were researched. A hydrogen energy cost model was established in this paper from five aspects: raw material cost, fixed cost of production, hydrogen purification cost, carbon trading cost, and transportation cost. The economic analysis of hydrogen was applied to hydrogen transported in the form of high-pressure hydrogen gas or cryogenic liquid hydrogen and produced by natural gas, coal, and electrolysis of water. It was found that the cost of hydrogen from natural gas and coal is currently lower, while it is greatly affected by the hydrogen purification cost and the carbon trading price. Considering the impact of future production technologies, raw material costs, and rising requirements for sustainable energy development on the hydrogen energy cost, it is recommended to use renewable energy curtailment as a source of electricity and multi-stack system electrolyzers as large-scale electrolysis equipment, in combination with cryogenic liquid hydrogen transportation or on-site hydrogen production. Furthermore, participation in electricity market-oriented transactions, cross-regional transactions, and carbon trading can reduce the cost of hydrogen. These approaches represent the optimal method for obtaining inexpensive hydrogen.

Graphical Abstract

1. Introduction

As a fuel for new energy, hydrogen has the characteristics of high calorific value, light weight, and high endurance. Hydrogen can generate electricity through chemical reactions, where water is the only product. Using fossil energy (coal, natural gas, etc.) to produce hydrogen causes carbon dioxide pollution. However, using renewable energy curtailment (hydropower, wind power, photovoltaic power) to produce hydrogen via electrolysis of water provides new ideas for the nonpolluting production of hydrogen. Thus, hydrogen is also known as the most ideal clean energy in the application process [1], and it is one of the main directions of sustainable energy development. Japan, China, the United States, and many countries in Europe are actively promoting the application of hydrogen fuel cell vehicles (FCVs) and the development of the hydrogen energy industry chain [2].
China is one of the world’s largest economic powers with development potential. The energy upgrade of China represents an important determinant of its economic transformation [3]. With the signing of “the Paris Agreement”, the Chinese government promised to adopt more powerful policies and measures to achieve “a carbon peak in 2030 and carbon neutrality in 2060”. To achieve this goal, the energy system must undergo profound changes, from a system based mainly on fossil fuels to a low-carbon energy system that is highly efficient, renewable, and sustainable [4]. Hydrogen energy is a good material carrier for renewable electricity. Through using hydrogen, renewable energy production and clean energy consumption can be effectively connected to make up for the low temporal and spatial matching between renewable resources and energy consumption. Hydrogen can be used in transportation, industrial production, daily energy, and so on, providing new ideas for clean and low-carbon energy utilization [5]. Moreover, hydrogen provides new research directions for companies and researchers in the industry chain. As an efficient and multipurpose energy medium with electricity and fossil fuels, hydrogen has outstanding advantages in terms of its social and economic application in the transportation field [6].
In 2019, the global sales of FCVs were 7500 units, an increase of 35.7% over 2018, to which China made the greatest contribution [7]. It is estimated that, by 2030, the production scale and sales of hydrogen FCVs will reach 500,000 in China, the number of possessions will reach one million, and the corresponding hydrogen demand will reach 5.8145 million tons. China has become the main potential market for hydrogen fuel. The Hydrogen Council predicts that, by 2050, the hydrogen energy industry will reduce carbon dioxide emissions by about 6 Gt globally, of which the transportation field accounts for approximately 3.2 Gt, as shown in Figure 1. In the future, hydrogen vehicles will account for 20–25% of the total number of vehicles in the world and will represent 18% of the global energy demand [8]. Hydrogen fuel is the energy source of hydrogen FCVs. According to Chinese national standard GB/T37244-2018, hydrogen as a fuel has characteristics of high purity, as shown in Table 1 [9]. Compared with fossil energy, hydrogen fuel is more expensive [10]. Therefore, it is important to control the use cost of hydrogen fuel so as to gain an edge in the Chinese market. The use cost of hydrogen can be further divided into hydrogen production cost and trading cost.
Currently, research on hydrogen cost mainly focuses on factors influencing the hydrogen production cost and on methods of reducing it. For example, Boretti described Australia’s export of hydrogen produced from coal, natural gas, wind, and solar power to Japan and South Korea [11]. Dispenza et al. estimated the cost of hydrogen production from water electrolysis at Capo d’Orlando, a solar-powered hydrogen fueling station in Sicily, from the aspects of design, construction, characteristics, and operation [12]. Through the comparison of three cases, it was found that power trading is the main factor affecting the cost of hydrogen without considering the availability of renewable energy or fuel demand. Saenz-Aguirre et al. explored ways to reduce the cost of hydrogen production in combination with wind energy and found that producing hydrogen with power generated by wind turbines can reduce the carbon emissions in hydrogen energy production and promote the development of the electric vehicle industry [13]. Voldsund et al. found that carbon capture technology is required in hydrogen production by fossil fuels to save energy and reduce emissions, and this, in turn, increases the cost of hydrogen production [14]. Sorgulu et al. used the “Hydrogen Economic Evaluation Program (HEEP)” software developed by the International Atomic Energy Agency (IAEA) to evaluate the hydrogen production plan and cost of two nuclear power plants in Turkey. It was found that the cost of hydrogen (H2) ranges from 3.18 USD/kg to 6.17 USD/kg after calculating and evaluating the cost of investment, fuel, electricity, decommissioning, and consumables for production, storage, and transportation [15]. Ishaq et al. studied the cost and carbon emission analysis and optimization of hydrogen production and power generation by solar-driven steam-autothermal hybrid methane reforming in the presence of a carbon tax [16]. However, as the main potential market for hydrogen fuel, China is rarely analyzed for the cost-economic production of hydrogen. In this paper, a hydrogen energy cost model is established to research the effect of hydrogen production cost, including raw material cost, fixed production cost, and hydrogen purification cost, as well as carbon trading cost and transportation cost, on the cost of hydrogen in China. Considering its future development, the benefits of reducing the cost of hydrogen are discussed to propose a method of hydrogen supply which has the characteristics of large scale and low cost.

2. Hydrogen Energy Industry Chain

2.1. Factors Affecting the Cost of Hydrogen Fuel

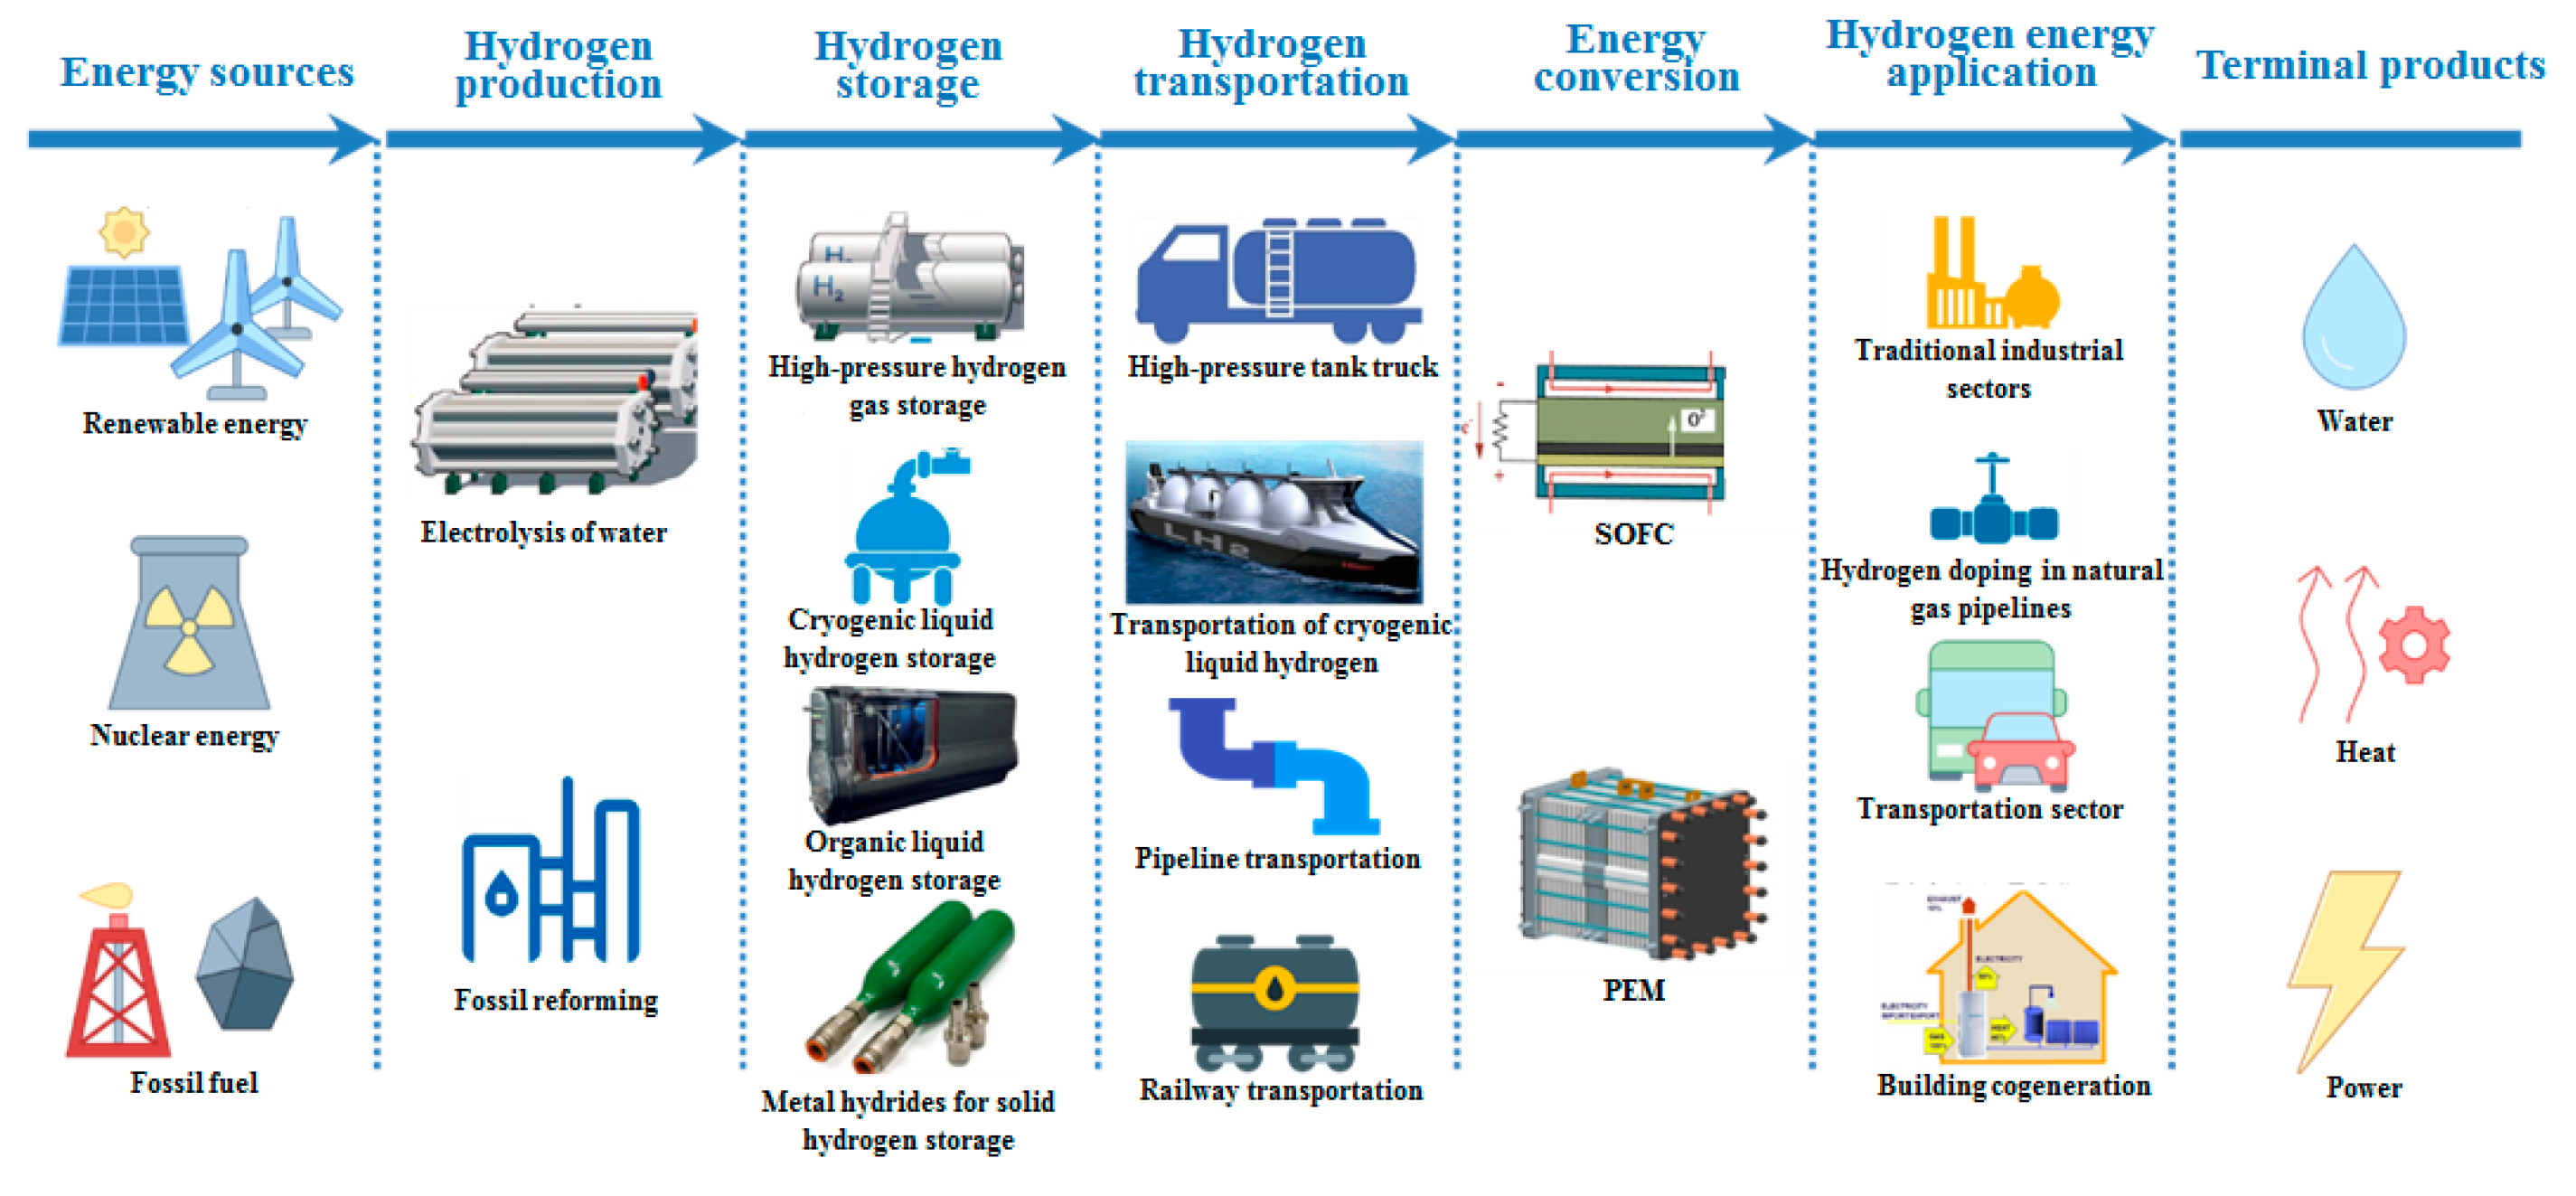
As shown in Figure 2, the hydrogen energy industry involves a huge industry chain covering hydrogen production, storage, transportation, and terminal applications [17]. Hydrogen can be processed to meet different demands. In order to meet the hydrogen fuel standard, the hydrogen must be purified after preparation. During the hydrogen production process, a large amount of carbon dioxide is emitted. Therefore, purification costs and carbon trading costs are also part of the total cost of hydrogen.
According to the survey, the current demand of hydrogen in transportation far exceeds the supply, while the storage time and storage scale are small [18]. Therefore, the storage cost of hydrogen was not studied as an independent factor in this paper. The storage cost during transportation was included in the transportation cost for analysis. The cost of hydrogen is mainly affected by its production cost, transportation cost, and purification cost, as well as the carbon trading cost, as shown in Equation (1) [19,20,21,22,23,24].
C = I 1 , m + D 1 , t + W 1 , r + M 1 , i ,
where C is the hydrogen fuel cost, I 1 , m is the hydrogen production cost, D 1 , t is the purification cost, W 1 , r is the carbon trading cost, and M 1 , i is the hydrogen transportation cost.
The specific expression of Equation (1) is as follows:
I 1 , m = I 1 , p + ( 1 + k m + 1 n m ) I 1 , a + I 1 , f + I 1 , o t W 1 , r = W 1 , p + ( 1 + k r + 1 n r ) W 1 , a + W 1 , o t M 1 , i = φ i M 1 , e D 1 , t = S 1 , 0 + λ l L 1 , 0 } ,
where I 1 , p , W 1 , p is the labor cost, I 1 , a , W 1 , a is the fixed production cost (one-time investment), related to the project scale I 1 , ot , W 1 , ot represents the supplementary materials and other expenses, k m , k r is the maintenance cost coefficient, n m , n r is the operating life of the equipment, I 1 , f is the raw material cost, related to the hydrogen production process, involving coal, natural gas, electricity, water, etc., M 1 , e is the carbon trading price, φ i is the carbon emission coefficient, S 1 , 0 is the hydrogen compression cost [25], L 1 , 0 is the cost of transportation equipment, and λ l is the distance cost coefficient.

2.2. Current Hydrogen Production Scale

According to the primary energy consumed in the process, hydrogen is mainly produced from fossil energy, water electrolysis, or industrial byproducts. As shown in Figure 3, the hydrogen production was 64 million and 17 million tons (excluding that from industrial byproducts) globally and in China, respectively, in 2018 [17], with China’s production accounting for 26.6% of the global figure. Hydrogen production from natural gas is the main source of hydrogen in the world [17]. As China has rich coal resources, hydrogen production from coal is the main hydrogen source in China. As fossil energy is nonrenewable, climate issues are becoming increasingly severe, and the energy demand is increasing, the hydrogen production process is in urgent need of upgrade and transformation. According to the hydrogen energy and fuel cell industry (including hydrogen from industrial byproducts), the proportion of hydrogen production from fossil energy (natural gas, coal, etc.) will be reduced from 67% in 2020 to 20% in 2050, and the proportion of hydrogen production from water electrolysis will rise from 3% to 70% [3].
In order to explore the characteristics of different hydrogen production processes, hydrogen production from coal, hydrogen production from natural gas, and hydrogen production from water electrolysis were analyzed, as shown in Table 2, coupled with the transformation of hydrogen production methods in the future. Hydrogen production from coal has the lowest cost and is suitable for large-scale centralized hydrogen production. However, it has a greater impact on the environment. Under the major premise of increasingly severe environmental problems, large-scale development of hydrogen production from coal faces difficulties in both policies and purification and emission reduction technologies. The cost of hydrogen production from natural gas is relatively low, the applicable scale is moderate, and the raw material reserves are relatively abundant. However, the equipment must operate at high temperatures of 600–800 °C and requires relatively high investment. Hydrogen production from water electrolysis has a small scale and is suitable for onsite applications with high purity without purification and carbon trading stages. Due to the modular nature of the electrolyzer, it can be used in series for centralized production and is, thus, less affected by distance. In addition, the electrolyzer can be used in conjunction with renewable energy sources such as wind power, photovoltaics, and hydropower to reduce carbon emissions and eliminate curtailment. However, hydrogen production from water electrolysis is characterized by a high cost and low economy [26].

2.3. Hydrogen Trading Market

Carbon trading is a market mechanism employed to reduce carbon dioxide emissions, i.e., trading carbon dioxide emission permits, which are regarded as a commodity. Hydrogen production from fossil fuels emits a lot of carbon dioxide; thus, the carbon trading cost is also part of the total hydrogen cost. China’s carbon emission market follows the European Union (EU) carbon market’s quota trading mechanism. The greenhouse gas emission quotas are freely traded in the carbon emission trading market, the development of which is shown in Table 3. At present, the price of carbon trading is not higher than 7 USD/t in China; hence, carbon trading has limited impact on the hydrogen production cost [18]. As the United States has withdrawn from the Paris Agreement, China must assume the image of responsibility in the field of climate change and integrate with the international carbon trading market. It is predicted that, in 2035, the carbon price will reach 100 USD/t, about 14 to 70 times the current value [27]. With the increase in carbon trading prices, the cost of hydrogen production from fossil fuels will fluctuate greatly, whereas hydrogen production from water electrolysis will be less affected due to its zero-emission characteristics.

3. Hydrogen Production Cost

3.1. Raw Material Cost

Different hydrogen production processes use different raw materials, and the main raw materials of each hydrogen production process were analyzed. A single electrolyzer produces a small amount of hydrogen, and water electrolysis is, thus, suitable for small-scale production. Therefore, hydrogen production from water electrolysis is set for small-scale production of 500 Nm3/h, and hydrogen production from coal and from natural gas are set for large-scale production of 90,000 Nm3/h. As shown in Table 4, the cost of hydrogen production from natural gas is most sensitive to the price of raw materials, and the unit raw material cost accounts for 74.29% of the total hydrogen production cost. The production cost is less sensitive to the raw material price for coal, but the percentage still reaches 47.51%.
The price of raw materials directly affects the hydrogen production cost. It is estimated that, by 2030, the price of coal will drop to 60 USD/t, natural gas to 4 USD/MBtu, and renewable energy curtailment to 0.014 USD/kWh. As shown in Figure 4, by 2030, the cost of hydrogen production from water electrolysis will be 1.2 USD/kg, which is only 33.4% of that in 2020. It is competitive in price, only slightly inferior compared to hydrogen production from natural gas and coal. The unit raw material cost accounts for up to 53.7% of the total hydrogen production cost, and the total cost is less sensitive to but still dominated by the raw material price.

3.2. Fixed Production Cost

The fixed production cost includes the equipment investment cost, labor cost, and auxiliary material cost, among which equipment investment cost is the main cost. The technologies are now mature for hydrogen production from coal and natural gas, and the equipment investment cost is mainly affected by the scale of hydrogen production, manufacturing technology, and international trade. It is expected that there will be no significant downward trend in the future. The water electrolysis technology is in a rapid development stage, and the large-scale development of electrolyzers in multi-stack systems in the future can significantly reduce capital expenditures. It is estimated that the cost of 20-stack alkaline electrolyzers will be reduced by 20%, and the cost of six-stack proton exchange membrane (PEM) electrolyzers will be reduced by 40%. The stacks of electrolyzers will account for 50% and 60% of the capital expenditure of alkaline electrolyzers and PEM electrolyzers, respectively [29]. Table 5 shows the performance comparison of water electrolysis hydrogen production equipment.
With off-peak electricity and large-scale industrial electricity as the main sources of electricity for hydrogen production by water electrolysis, the cost changes of two types of hydrogen production equipment are studied under the multi-stack system. As shown in Figure 5, the alkaline electrolyzer is used under the conditions of large-scale industrial electricity and off-peak electricity, and the hydrogen production cost is decreasing faster than that of the PEM electrolyzer. At 20 stacks, the prices are 0.98 USD/kg H2 and 0.97 USD/kg H2, respectively. However, the price of PEM electrolyzer equipment is higher and the hydrogen production cost is more sensitive to equipment cost reduction compared with the alkaline electrolyzer. The use of six-stack PEM electrolyzers reduces the cost by 8.79% under the conditions of large-scale industrial power consumption and reduces the hydrogen production cost by 13.36% under the conditions of off-peak power consumption. Reducing the cost of electrolyzer equipment will have a greater impact on the hydrogen production cost when the number of stacks is small. When the number of stacks increases to a certain number, it will create a boundary effect, and the sensitivity of hydrogen production costs will decrease.

3.3. Hydrogen Purification Cost

The hydrogen purity required for FCVs is higher than 99.97%, and there are strict requirements for the content of impurities in the hydrogen [9]. In order to meet the hydrogen fuel requirements, hydrogen needs to be purified after production. The physical method, chemical method, and membrane separation method are the three main methods of hydrogen purification. The characteristics of each are shown in Table 6. In view that fuel vehicles need to use hydrogen of high purity and in a large amount, high-purity hydrogen is currently mainly obtained using the method of PSA (pressure swing adsorption).
The gas produced in the hydrogen production process is called raw gas, and the hydrogen production cost is mainly affected by the hydrogen content of the raw gas and the processing capacity of the equipment. The raw gas of hydrogen production from water electrolysis has a hydrogen content as high as 99.999%, and the purification cost can be considered to be 0 USD/kg H2. The purification cost was, thus, analyzed for hydrogen production from coal and hydrogen production from natural gas. Through the investigation of the chemical industry in Sichuan Province, the hydrogen purification cost is shown in Table 7. The raw gas of hydrogen production from coal has a low hydrogen content, high equipment investment cost, and a purification cost higher than that of hydrogen production from natural gas. With the future increase in hydrogen demand, hydrogen purification will develop toward large-scale production. At a scale of 1000 Nm3/h, the purification cost of raw gas is 16.46 USD/kg H2 and 3.70 USD/kg H2, respectively, for hydrogen production from coal and hydrogen production from natural gas. When the scale is increased to 10,000 Nm3/h, the purification cost is reduced by 73.45% and 63.33%, respectively. As for hydrogen production from coal, the hydrogen content of raw gas is low, the equipment investment cost is high, and the purification cost is more sensitive to equipment processing capacity.

4. Hydrogen Trading Cost

4.1. Carbon Trading Cost

A market mechanism, called carbon emission trading, was designed to reduce global carbon dioxide emissions. It works by trading carbon dioxide emission permits as a commodity. The current carbon trading price is about 7 USD/t on the Chinese market, and it is predicted to reach 100 USD/t in 2035 [30]. Different hydrogen production processes have different carbon emissions. The carbon emission coefficient is the highest for hydrogen production from coal. No carbon dioxide is generated during the process of hydrogen production from water electrolysis, and the carbon emission coefficient is 0. As shown in Figure 6, according to the current hydrogen production cost, hydrogen production from coal is more economical when the carbon trading price is lower than 30 USD/t. As the carbon trading price increases, the cost of hydrogen production from natural gas becomes the lowest. When the carbon trading price is higher than 85 USD/t, using off-peak electricity for hydrogen production from water electrolysis is competitive in terms of hydrogen production cost. Companies involved in hydrogen production from water electrolysis can also trade unused carbon emission permits to obtain additional income and further reduce the hydrogen production cost.

4.2. Transportation Cost

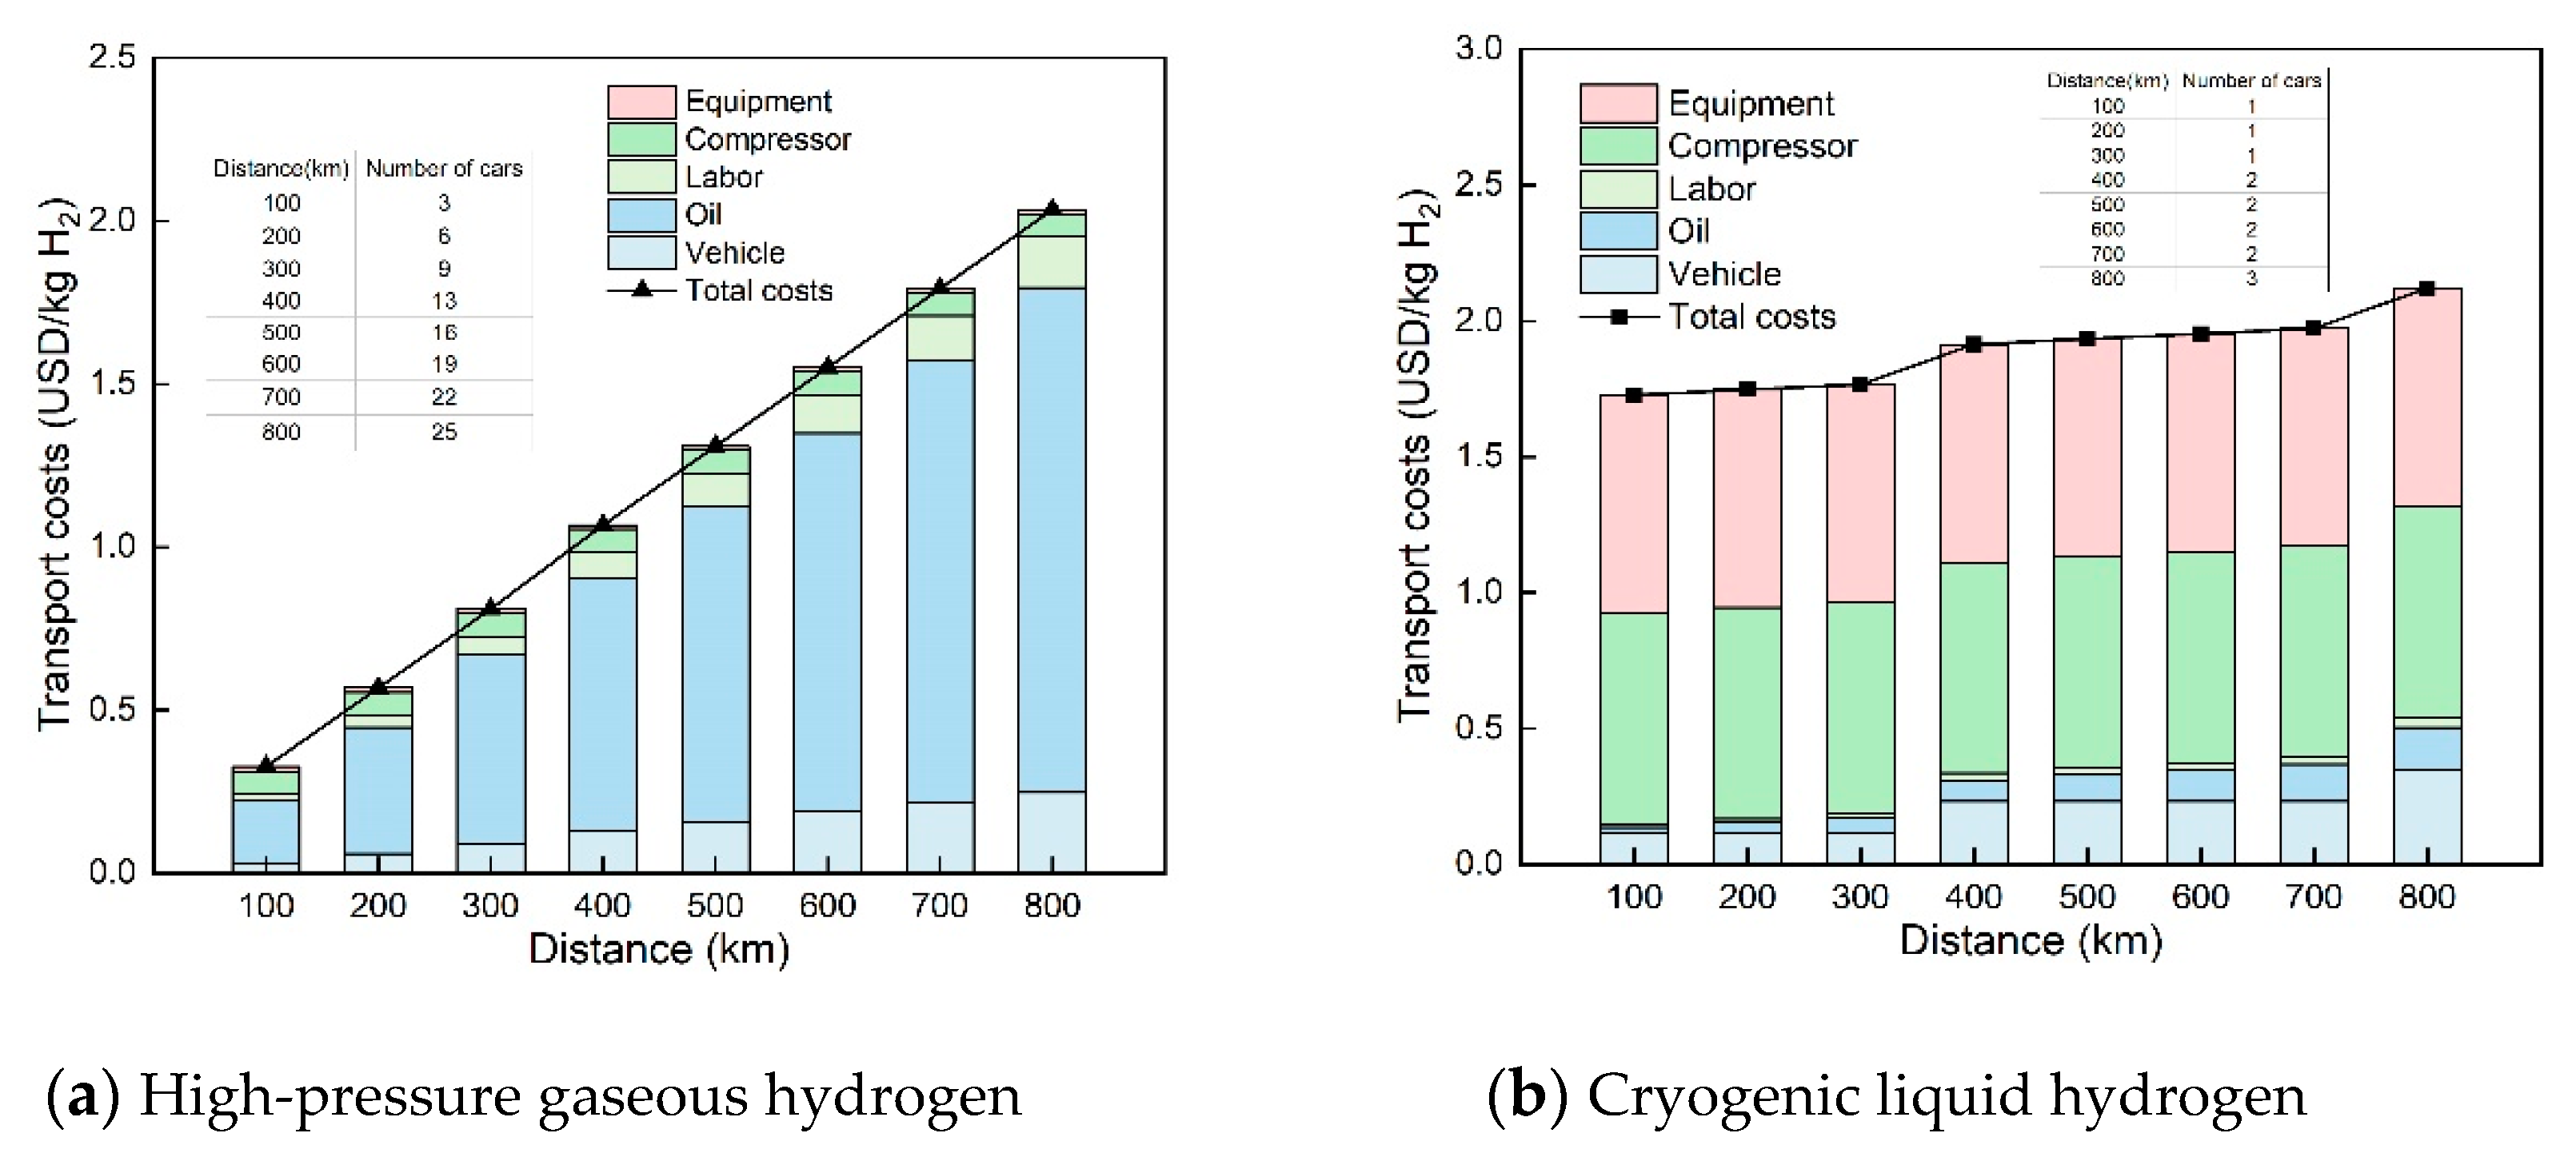
Hydrogen has the characteristics of low energy density, which increases the transportation cost. To increase the energy density, hydrogen is compressed or liquefied to be transported as high-pressure gaseous hydrogen or cryogenic liquid hydrogen [26]. Tanker trucks for gaseous hydrogen and liquid hydrogen are currently the main means of local transportation. It is crucial to choose an appropriate transportation plan according to the different transportation radius and hydrogen demand so as to control the transportation cost. Figure 7 shows the analysis of the transportation cost at the hydrogen demand of 10 t/day, where it can be found that, at the same transportation scale and within a 500 km transportation radius, the transportation cost of high-pressure hydrogen is lower, with the fuel cost of vehicles accounting for 59–76%. When the transportation radius goes beyond 500 km, the transportation cost of cryogenic liquid hydrogen is more reasonable, and the gaseous hydrogen compression cost and equipment investment cost constitute the main parts, accounting for 74–91%.
Gaseous hydrogen transportation and liquid hydrogen transportation differ in the physical state, density, and transportation scale of hydrogen. Theoretically, a trailer loaded with compressed gaseous hydrogen can transport about 1 t of H2, and a highly insulated cryogenic tanker truck can load up to 4 t of liquid hydrogen [26]. At present, most liquid hydrogen plants have a production capacity of about 10–30 t/day. Table 8 shows the transportation cost analysis at a hydrogen demand of 30 t/day [31]. Compared with Figure 7, the transportation cost of high-pressure hydrogen is lower within a small local transportation radius, and the transportation cost of cryogenic liquid hydrogen is lower under the conditions of large hydrogen demand and large transportation radius. As the transportation radius increases, the transportation cost of high-pressure hydrogen increases rapidly, while the transportation cost of cryogenic liquid hydrogen is less sensitive. As the hydrogen demand and the scale of cryogenic liquid hydrogen equipment further increase in the future, the transportation cost of cryogenic liquid hydrogen will become increasingly competitive in a small transportation radius.

5. The Cost of Hydrogen

5.1. The Difference in Cost

According to the International Energy Agency (IEA), hydrogen production from natural gas is currently the most economical option for hydrogen production in most parts of the world [26]. However, as shown in Table 9, hydrogen production from coal costs the least and is the most economical method in China. As a natural gas importer, China pays higher for natural gas than the Middle East, Russia, and North America. The cost of hydrogen production from natural gas is, thus, higher in China. Compared with the real data, the hydrogen production cost, purification cost, carbon trading cost, and gaseous transportation cost obtained from the hydrogen energy cost model in this paper are within a reasonable range. For costs without real data (purification cost and carbon trading cost of hydrogen production from natural gas), indirect parameters from the report of IEA were used for verification [26]. The concentration of carbon dioxide emitted from hydrogen production directly affects hydrogen purification costs and carbon trading costs. The concentration of carbon dioxide is 20 kg CO2/kg H2 for hydrogen production from coal, 8 kg CO2/kg H2 for hydrogen production from water electrolysis, and 0 kg CO2/kg H2 for hydrogen production from water electrolysis. With reference to the carbon dioxide emission concentration, it can be inferred that the calculation result of the model is similar to the real purification cost and carbon trading cost. The inconsistency of fuel costs, labor costs, vehicle parameters, etc. leads to different transportation costs of the model and real data [22], where it is found that the average daily demand (0.9 t/day and 10 t/day) has little effect on hydrogen transportation costs. By comparison, the results of the model are close to the real data. Therefore, the difference in cost between the model and reality is small. The hydrogen energy cost model can accurately predict the current hydrogen cost in the Chinese market.

5.2. The Cost in Future

The cost of hydrogen for FCVs is shown in Table 10. As the cost of raw materials for hydrogen production drops, scale production will take place and the hydrogen demand transportation radius and carbon trading cost will both rise in the future. The hydrogen production cost of different production process is different. Hydrogen production from natural gas has the lowest cost, while hydrogen production from PEM water electrolysis has the highest cost, reaching 2.02 USD/kg H2. However, hydrogen production from water electrolysis is characteristic of high hydrogen purity and zero carbon emissions. It does not require purification and carbon trading. The cost of hydrogen of hydrogen production from water electrolysis is similar to that of hydrogen production from coal and from natural gas. Thus, the economic competitiveness (hydrogen production from water electrolysis) is greatly increased, and the cost of hydrogen production from alkaline water electrolysis is the lowest. The transportation cost is the lowest when hydrogen is transported in the form of cryogenic liquid hydrogen, the transportation radius is 800 km, and the transportation demand is 30 t/day, and the lowest hydrogen cost for FCVs can be 2.15 USD/kg H2.

6. Conclusions

By 2030, China’s hydrogen fuel demand will exceed 5 million tons, and procuring low-cost hydrogen will be the key to opening up the application market in China’s fuel cell transportation field. Hydrogen as a fuel has high purity and is, thus, costly. Raw materials and technologies determine that hydrogen production from fossil fuels (coal and natural gas) are the main methods for large-scale hydrogen production. However, as environmental pressures increase in the future, hydrogen production from fossil fuels will endure stricter purification requirements and higher carbon trading prices. The cost of hydrogen from fossil fuels will increase. Hydrogen production from water electrolysis can be used for small-scale onsite pure hydrogen production. The cost is not affected by purification but mainly limited by the price of electricity. The promotion and application of renewable electricity provide a new way to reduce the price of electricity for hydrogen production from water electrolysis. A model was established to analyze the cost of hydrogen energy, hydrogen transportation, and carbon trading in this paper. Accordingly, it is recommended to use renewable energy curtailment as a source of electricity and multi-stack system electrolyzers as large-scale electrolysis equipment in the future, combined with liquid hydrogen transportation or onsite hydrogen production as the most economical choice. With improvements in the power trading mechanism and carbon trading mechanism in the future, participating in these two trading mechanisms can be combined to reduce the cost of hydrogen. On the one hand, by participating in electricity market-oriented transactions and cross-regional transactions, the cost of electricity as a raw material for hydrogen production can be reduced. On the other hand, by participating in carbon trading, electrolyzed water hydrogen production enterprises can sell surplus carbon emission rights to subsidize the cost of hydrogen production from electrolyzed water. The hydrogen market is developing rapidly; thus, the supply of hydrogen will gradually increase. Considerations must be taken of the storage cost, as well as the impact of different hydrogen energy applications, trading mechanisms, centralized production, and distributed production on the cost of hydrogen. These problems are to be further discussed.

Author Contributions

Resources, Z.L. and Y.H.; project administration and data curation, Z.L.; writing—original draft preparation, Y.H.; validation, Z.L. and H.X.; supervision, H.X.; writing—review and editing, D.G. and W.L. All authors read and agreed to the published version of the manuscript.

Funding

This research work was supported by the National Key R&D Program of China (2018YFE0106700).

Conflicts of Interest

The authors declare no conflict of interest.

References

  1. Widera, B. Renewable hydrogen implementations for combined energy storage, transportation and stationary applications. Therm. Sci. Eng. Prog. 2020, 16, 100460. [Google Scholar] [CrossRef]
  2. Styczynaski, A.; Hughes, L. Public policy strategies for next-generation vehicle technologies: An overview of leading markets. Environ. Innov. Soc. Transit. 2019, 31, 262–272. [Google Scholar] [CrossRef]
  3. Mi, S.H. White Paper on China’s Hydrogen Energy and Fuel Cell Industry; China Hydrogen Alliance: Beijing, China, 2019. [Google Scholar]
  4. Emanuele, T.; Raul, M. Hydrogen from Renewable Power; International Renewable Energy Agency: Abu Dhabi, UAE, 2018; ISBN 978-92-9260-077-8. [Google Scholar]
  5. Gielin, D. Hydrogen: A Renewable Energy Perspective; International Renewable Energy Agency: Tokyo, Japan, 2019; ISBN 978-92-9260-151-5. [Google Scholar]
  6. Liu, X.N. Social and Economic Analysis of Application Scenarios of Hydrogen Energy in China’s Energy Market; CEBM Group Ltd.: Shanghai, China, 2016. [Google Scholar]
  7. Analysis Report on Market Prospective and Investment Strategic Planning of China’s Fuel Cell Industry; Prospective Industry Research Institute: Shenzhen, China, 2019.
  8. Hydrogen Scaling Up; Hydrogen Council: Brussels, Belgium, 2017.
  9. GB/T37244-2018. Fuel Specification for Proton Exchange Membrane Fuel Cell Vehicles—Hydrogen; Chinese Standard Publishing House: Beijing, China, 2018.
  10. A Hydrogen Strategy for a Climate-Neutral Europe; European Commission: Brussels, Belgium, 2020.
  11. Boretti, A. Production of hydrogen for export from wind and solar energy, natural gas, and coal in Australia. Int. J. Hydrogen Energy 2020, 45, 3899–3904. [Google Scholar] [CrossRef]
  12. Dispenza, G.; Sergi, F.; Napoli, G.; Antonucci, V.; Andaloro, L. Evaluation of hydrogen production cost in different real case studies. J. Energy Storge 2019, 24, 100757. [Google Scholar] [CrossRef]
  13. Saenz-Aguirre, A.; Fernandez-Gamiz, U.; Zulueta, E.; Aramendia, I.; Teso-Fz-Betoño, D. Flow control based 5 MW wind turbine enhanced energy production for hydrogen generation cost reduction. Int. J. Hydrog. Energy 2020, 30, 1–13. [Google Scholar] [CrossRef]
  14. Mari, V.; Kristin, J.; Rahul, A. Hydrogen production with CO2 capture. Int. J. Hydrog. Energy 2016, 41, 4969–4992. [Google Scholar] [CrossRef]
  15. Sorgulu, F.; Dincer, I. Cost evaluation of two potential nuclear power plants for hydrogen production. Int. J. Hydrog. Energy 2018, 43, 10522–10529. [Google Scholar] [CrossRef]
  16. Ishaq, H.; Dincer, I. Analysis and optimization for energy, cost and carbon emission of a solar driven steam-autothermal hybrid methane reforming for hydrogen, ammonia and power production. J. Clean. Prod. 2019, 234, 242–257. [Google Scholar] [CrossRef]
  17. Lin, H.C. China Hydrogen Energy Industrial Chain Annual Report 2019; Asia Chem: Shanghai, China, 2019. [Google Scholar]
  18. Luo, Z.X. Report for Development Strategy of Hydrogen Industry in Sichuan Province; Sichuan Energy Internet Research Institute, Tsinghua University: Chengdu, China, 2019. [Google Scholar]
  19. Yang, C.; Ogden, J. Determining the lowest-cost hydrogen delivery mode. Int. J. Hydrog. Energy 2007, 32, 268–286. [Google Scholar] [CrossRef] [Green Version]
  20. Zhang, C.L. Cost analysis and development suggestion for hydrogen production from coal and natural gas. Pet. Process. Petrochem. 2018, 49, 94–98. [Google Scholar] [CrossRef]
  21. Chang, L. Selection of best hydrogen transport mode in the hydrogen supply chain. J. Tsinghua Univ. (Sci. Technol.) 2009, 49, 257–260. [Google Scholar] [CrossRef]
  22. Ma, J.X.; Liu, S.J.; Zhou, W.; Pan, X.M. Comparison of hydrogen transportation methods for hydrogen refueling station. J. Tongji Univ. (Nat. Sci.) 2008, 36, 615–619. [Google Scholar] [CrossRef]
  23. Riis, T.; Hagen, E.F. Hydrogen Production and Storage—R&D Priorities and Gaps; The Hydrogen Coordination Group: Lillestrøm, Norway, 2006. [Google Scholar]
  24. Blazquez-Diaz, C. Techno-economic modelling and analysis of hydrogen fuelling stations. Int. J. Hydrog. Energy 2019, 44, 495–510. [Google Scholar] [CrossRef]
  25. Montenegro Camacho, Y.S.; Bensaid, S.; Piras, G.; Antonini, M.; Fino, D. Techno-economic analysis of green hydrogen production from biogas autothermal reforming. Clean Technol. Environ. Policy 2017, 19, 1437–1447. [Google Scholar] [CrossRef]
  26. Turk, D.; Gül, T. The Future of Hydrogen for G20; International Energy Agency: Osaka, Japan, 2019. [Google Scholar]
  27. Wang, Y.F.; Zhang, L. Hydrogen purification process and technology selection. Chem. Eng. Des. 2015, 25, 14–17. [Google Scholar] [CrossRef]
  28. Khojasteh Salkuyeh, Y.; Saville, B.A.; MacLean, H.L. Techno-economic analysis and life cycle assessment of hydrogen production from natural gas using current and emerging technologies. Int. J. Hydrog. Energy 2017, 42, 18894–18909. [Google Scholar] [CrossRef]
  29. Li, P.P.; Zhai, Y.P.; Wang, X.P.; Chen, F. Brief discussion on the selection of hydrogen purification methods. Nat. Gas Chem. Ind. 2020, 45, 115–119. [Google Scholar]
  30. Bernard, L. Energy Outlook; British Petroleum: London, UK, 2019. [Google Scholar]
  31. Wang, H.W. Economic Analysis of the Whole Process China’s Hydrogen Energy Development Route How to Realize a Green, Efficient and Economic Hydrogen Energy Supply System; China EV100: Beijing, China, 2020. [Google Scholar]
  32. Yao, Z.G. Hydrogen Leads the Decarbonization Process; Siemens Energy: Shanghai, China, 2020. [Google Scholar]
Figure 1. Carbon emission reduction by field in 2050.
Energies 13 06522 g001
Figure 2. Schematic diagram of the hydrogen industry chain.
Energies 13 06522 g002
Figure 3. Sources of hydrogen in 2018.
Energies 13 06522 g003
Figure 4. Forecast of raw material cost changes.
Energies 13 06522 g004
Figure 5. Trends in the cost of electrolyzers in multi-stack systems.
Energies 13 06522 g005
Figure 6. Hydrogen production cost (including carbon trading).
Energies 13 06522 g006
Figure 7. Hydrogen demand (10 t/day) transportation cost.
Energies 13 06522 g007
Table 1. Technical indicators of hydrogen fuel for proton exchange membrane (PEM) fuel cell vehicles.
IndicatorsTarget
Hydrogen purity (mole fraction)99.97%
Total nongaseous hydrogen300 μmol/mol
Maximum Concentration of Single Impurity
Water (H2O)5 μmol/mol
Total hydrocarbon (calculated as methane) *2 μmol/mol
Oxygen (O2)5 μmol/mol
Helium (He)300 μmol/mol
Total nitrogen (N2) and argon (Ar)100 μmol/mol
Carbon dioxide (CO2)2 μmol/mol
Carbon monoxide (CO)0.2 μmol/mol
Total sulfur (calculated as H2S)0.004 μmol/mol
Formaldehyde (HCHO)0.01 μmol/mol
Formic acid (HCOOH)0.2 μmol/mol
Ammonia (NH3)0.1 μmol/mol
Total halide (calculated as halide ion)0.05 μmol/mol
Maximum particle concentration1 μmol/mol
* When the methane concentration exceeds 2 μmol/mol, the total concentration of methane, nitrogen, and argon is not allowed to exceed 100 μmol/mol.
Table 2. Comparison of different hydrogen production processes.
Hydrogen Production ProcessHydrogen Production from CoalHydrogen Production from Natural GasHydrogen Production from Water Electrolysis
Applicable scale (Nm3)10,000–20,000>50002–500
Hydrogen production cost (USD/kg H2)0.95–1.901.27–2.373.95–5.54
Raw materialsCoal and oxygenNatural gasElectricity and water
Main impuritiesCO2CO2, CO, CH4O2, H2O
Hydrogen contentLowMediumHigh
Table 3. Development process of China’s carbon market. US, the United States.
TimeStageDetails
2005–2014Clean development mechanismAs of 2014, the world’s cumulative certified emission reductions (CER) totaled 1.468 billion tons of CO2, with China accounting for more than 60%.
2011–2017Pilot construction of carbon emission permits tradingApproved seven regions to launch pilot projects in carbon emissions trading from 2013 to 2015.
After 2017Construction and implementation of a unified national carbon marketThe China–US Joint Presidential Statement on Climate Change announced that China plans to launch a national carbon emissions trading system in 2017
Table 4. Raw materials for different hydrogen production processes.
Hydrogen Production ProcessHydrogen Production from CoalHydrogen Production from Natural Gas [28]Hydrogen Production from Water Electrolysis
Main raw materialsCoalNatural gasElectricity
Raw material price [18]84.74 (USD/t)9.9 (USD/MBtu) 0.07 (USD/kWh)
Scale (Nm3/h) [18]90,00090,000500
Hydrogen production cost (USD/kg H2)1.511.784.97
Raw material cost/hydrogen production cost (%)47.51%74.29%68.69%
Table 5. Comparison of water electrolysis hydrogen production equipment.
Electrolyzer TypeAlkaline ElectrolyzerPEM Electrolyzer
Electrolyte20–30% KOHPEM
Working temperature (°C)70–9070–80
Electrolytic efficiency (%)65–7570–90
Unit energy consumption ((kW·h)·m3)4.5–5.53.8–5.0
Capital expenditure (USD/kWe) [29]500–14001100–1800
Table 6. Characteristics of several hydrogen purification methods. PSA, pressure swing adsorption.
MethodPhysical MethodChemical MethodMembrane Separation
Cryogenic SeparationPSAMetal Hydride MethodCatalytic DeoxygenationDiffusion in Palladium FilmsPolymer Film Diffusion Method
Purity (%)90–98 [29]99.9999 [27]99.999999.99999.999992–98 [29]
Production scaleLargeLargeModerate and smallModerate and smallModerate and smallSmall–large
Table 7. Purification cost analysis of two raw gas sources.
Source of Raw GasHydrogen Production from CoalHydrogen Production from Natural GasHydrogen Production from Water Electrolysis
Hydrogen content (%)55%74%99.999%
1000 Nm3/hEquipment investment (USD)4,900,0003,000,000-
Purification cost (USD/kg H2)1.470.96-
10,000 Nm3/hEquipment investment (USD)14,800,0008,900,000-
Purification cost (USD/kg H2)0.390.33-
Purification cost reduction ratio73.45%63.33%-
Table 8. Hydrogen transportation cost.
Transport Radius (km)High-Pressure Hydrogen Transportation (USD/kg H2)Cryogenic Liquid Hydrogen Transportation (USD/kg H2)
2000.671.27
3000.971.34
4001.261.40
5001.551.46
6001.851.52
7002.151.58
8002.441.62
Cost increase264.18%27.56%
Table 9. Cost of reality and model calculation.
Hydrogen Production ProcessHydrogen Production from CoalHydrogen Production from Natural GasHydrogen Production from Water Electrolysis
Production cost (USD/kg H2)Reality [3]0.95–1.891.7–1.83.95–5.54
Model1.511.784.97
Purification cost (USD/kg H2)Reality [32]0.92-0
Model0.39–1.470.33–0.960
Carbon trading cost (USD/kg H2)Reality [32]0.14-0
Model0.1350.070
Gaseous transportation cost (USD/kg H2)Reality [22]0.32 (50 km, 0.9 t/day)
Model0.36 (50 km, 0.9 t/day); 0.33 (100 km, 10 t/day)
Table 10. Cost of hydrogen for fuel cell vehicles (FCVs).
Hydrogen Production ProcessHydrogen Production from CoalHydrogen Production From Natural GasHydrogen Production from Alkaline Water ElectrolysisHydrogen Production from PEM Water Electrolysis
Main raw materialsCoalNatural gasRenewable electricity (energy)
Raw material price60 USD/t4 USD/MBtu0.014 USD/kWh
Production cost (USD/kg H2)1.301.001.582.02
Purification cost (USD/kg H2)0.390.33-
Carbon trading cost (USD/kg H2)1.610.85-
200 km, 10 t/day gaseous hydrogen transportation (USD/kg H2)0.57
800 km, 30 t/day liquid hydrogen transportation (USD/kg H2)1.62
Cost of hydrogen (USD/kg H2)3.87–4.922.75–3.802.15–3.202.59–3.64
Publisher’s Note: MDPI stays neutral with regard to jurisdictional claims in published maps and institutional affiliations.