Article

Heating Performance of Solar Building Integrated Wall under Natural Circulation

1
College of Civil Engineering, Hunan University, Changsha 410082, China
2
School of Civil Engineering and Mechanics, Xiangtan University, Xiangtan City 411105, China
*
Authors to whom correspondence should be addressed.
Energies 2020, 13(23), 6288; https://doi.org/10.3390/en13236288
Submission received: 3 November 2020 / Revised: 22 November 2020 / Accepted: 24 November 2020 / Published: 28 November 2020

Abstract

:
This paper presented a building façade combined with photothermal technology where a water circulation system, including a thermal radiation plate and a solar collector, was installed. When heated by solar radiation, the water in the system transfered part of the solar heat to the room through natural circulation by buoyancy caused by density difference. During the cold season, the solar heat efficiency of the façade under natural circulation was studied through experiments and numerical simulations. The results show that the simulated values of the model established by MATLAB were in good agreement with the experimental values. Under the action of natural circulation, good solar energy utilization efficiency could be obtained by the façade. When solar irradiance was 1100 W/m2, the heat gain of the solar collector was 1672 W, of which the heat delivered to the recycled water and supplied to indoor was 1184 W, and the solar heat efficiency could reach 71%. Both the pipeline impedance and the height difference between radiation plate center and solar collector center had a great influence on temperature change of water supply in this system, whereas had little impact on thermal supply and solar heat efficiency of this system.

1. Introduction

Nearly 40% of global greenhouse gas emissions and energy consumption are due to the building industry [1,2]. HVAC is responsible for more than one third of building energy supply [3,4]. With the growth of the construction industry and the continuous improvement of resident’s requirements with respect to comfort of the indoor thermal environment, the demand for building heating energy consumption in cold seasons will become larger and larger [5]. Developing solar building integration technology is a significant method to effectively reduce the building energy consumption [6]. Many solar building integration structures have been designed. Considering the insufficient application proportion of this technology in actual engineering, it is necessary to conduct further research on this technology.
Typical solar building integrated structures include passive solar houses, solar roofs, Trombe walls, double skin façade (DSF), etc. [7]. Research data shows that solar roofs have great energy-saving potential, which could save nearly 30% in Ontario (Canada) [8]. However, for multi-storey and high-rise buildings, the roof is only a small part of the building envelope, thus, the integrated technology of solar energy and walls is a significant method to increase the use of solar energy in architectures. Photovoltaic (PV) building integration and solar thermal building integration are two important solar building integration technologies. Regarding the photovoltaic integrated façade, Brito et al. [9] indicated that vast façade scales of high-rise buildings might contribute remarkably to the potential for photovoltaic integration in urban landscapes. Liang et al. [10] studied a ventilation wall with opacity, which had an average photovoltaic conversion efficiency of about 9% and could reduce 40% of wall heat transfer. Yu et al. [11] displayed a purified PV/T (photovoltaic/thermal)-Trombe wall that could continuously generate electricity throughout the year, demote formaldehyde, realize space heating in winter, and provide hot water in summer. Hu et al. [12] explored the deployment position of PV cells through experiments and simulations and found that PVBTW (Trombe wall with PV cells on blinds) wall had the best performance. However, due to the influence of the solar elevation angle, the solar radiation illuminance per unit area of the building wall is small and the solar energy utilization efficiency is low in cost performance, which is an essential item influencing the development of photovoltaic and wall integration technology at present.
Compared with photovoltaic utilization technology, there are more studies on the combination of solar thermal systems and walls. To prevent overheating in summer, roller shutters [13] or Venetian blinds [14] could be added to Trombe walls. For the sake of improving heat transfer effect in cold winter, thermal fins could be mounted to the inner surface of the Trombe wall [15]. Chen et al. [16,17] presented a composite Trombe wall including a porous absorber, which could increase the thermal resistance and the heat thermal storage performance of the Trombe wall. Zhu et al. [18] investigated a Trombe wall embedding PCM (phase-change material), and found that the peak cold load and heat load of the building were reduced by 9% and 15%, respectively. In addition, the double skin façade technology could also improve the light and heat gain into the building. Leang et al. [19] investigated the energy property of a house integrating a Trombe wall containing PCM, and found that the thermal comfort was positive proportional to the latent heat, while the heating demand was inversely proportional to the latent heat. A study of a high-rise DSF building in Germany performed by Pasquay [20] showed that it could save about 15%–18% of heat energy in winter. Chen et al. [21] demonstrated that DSF system with double-layer reflective glass as outer surface could save nearly 26% of architecture energy consumption. Su et al. [22] found through CFD simulation that increasing the width of the cavity could increase the total thermal gain of DSF. Regarding the heat storage wall, Lee et al. [23] analyzed the thermal insulation performance of walls involving thin layer PCM, and found the peak heat flux decrease of the south and west walls was 51.3% and 29.7%, respectively. Using autoclaved aerated concrete with high porosity and low thermal conductivity instead of cement could greatly reduce the building’s heat gain and cooling load, and energy consumption could be reduced by about 7% [24]. Furthermore, embedding pipes into walls also has significant energy-saving potential, which could reduce heating costs by 40% [25]. Ibrahim et al. [26] displayed a wall circulation system with water pipes inserted in an external coating, which could reduce the heating load of a room by 15–44%. Zhang et al. [27] proposed a passive-use technology regarding solar energy of WIHP (a wall implanted with heat pipes), which has better heat transfer performance than ordinary walls, and the heat loss of a southern outer wall in winter was reduced by 14.47%.
Solar energy utilization efficiency and wall thermal insulation performance are two important performance parameters of the integrated structure of solar energy system and the wall. Based on ensuring the thermal insulation performance of the wall, improving the solar energy utilization efficiency, while using solar technology to ameliorate the thermal insulation performance of the wall, are problems that need to be solved in the progress of integrated solar energy building technology. For this reason, this paper designed a heating façade integrated with solar, which used solar energy as both the heat source and driving force. During the heating period, the wall is capable of transferring solar thermal energy indoors with a small thermal resistance, and prevents the indoor heat from being transferred outdoors with a large thermal resistance. During the cooling season, outdoor heat can be prevented from entering the room with a larger thermal resistance. Both experiments and simulations were conducted regarding the passive heating performance of the wall in the cold period.

2. Experimental

2.1. Description of the Façade System

The structural dimensions of the experimental house were: the internal space was 1.8 m × 1.8 m × 2.1 m (width × length × height), whereas the external dimension was 2.5 m × 2 m × 2.3 m (width × length × height). The experimental façade system faced south and included a solar hot water circulation pipe (Figure 1). The façade system was mainly composed of a glass cover, solar collector, air interlayer, massive wall (polyurethane sandwich panel), and thermal radiation plate. Figure 2 presents the experimental façade structure, while Table 1 shows the dimensions of all material layers. In the circulation system, the indoor radiation plate and solar collector were linked by a circulating pipe (20/24 mm) which was provided with a control valve. Copper pipes with 8/10 mm diameter were installed to the indoor radiation plate and solar collector. When the collector absorbed solar energy, the density of the working fluid (water) in the circulating pipe would decrease due to the increase in its temperature. The buoyancy caused by the density difference allowed the water to circulate naturally, which can directly and passively deliver heat from outside to indoors with small thermal resistance when compared with the ordinary wall. In winter, the wall can provide heat to the room by passively transferring heat from the solar collector to the radiation plate via the natural circulation of working fluid (water). In summer, the solar circulating water can be prevented from entering indoors by closing the control valve.

2.2. Experimental Methods

Physical parameters and dimensions of all material layers in experimental system are presented in Table 1. The test parameters include: solar irradiance, outdoor ambient air temperature, wind speed, water temperature at each inlet/outlet, surface temperatures of the radiation plate and solar collector, and indoor temperature. In the experiment, nine temperature measuring points were set on the surface of radiation plate and solar collector (nine measuring points were evenly distributed on the surfaces). Meanwhile, the indoor, outdoor, inlet and outlet of collector (Inlet 1/Outlet 1), and the inlet and outlet of the indoor radiant panel (Inlet 2/Outlet 2) were respectively set up with temperature measurement points. A TBQ-2 solar pyrometer (Jinzhou Sunshine Meteorological Technology Co., Ltd., Jinzhou, China) was employed to record the solar irradiance on the collector’s vertical surface, while Ni-Cr and Ni-Si thermocouples (Xinling Electric Co., Ltd., Yueqing, China) were employed to obtain the experimental temperature. Finally, the TSI-9555A multi-parameter ventilation meter (Beijing Hongchangxin Technology Co., Ltd., Beijing, China) was used to measure the air velocity. During the experiment, a fan coil with a rated power of 3 kW was installed indoors to control the indoor temperature by the connected 20 °C temperature well water.
The pipeline impedance of the system tested by mechanical circulation, could comprehensively reflect the resistance along the pipeline and local resistance of the system. Under the action of mechanical circulation, the pipeline impedance could be computed by measuring the total resistance of this system and the water flow. The inlet of the return pipe of the solar collector was connected in parallel with a circulating water pump, and the U-tube liquid pressure gauge was connected on both sides of the parallel node to measure the pressure difference. A LZB-15 rotameter (Jinhu Smart Meter Co., Ltd., Huaian, China) and LXS water meter were employed to measure the water flow in the pipe and U-tube liquid pressure gauge (BYY-100) was used (with inverted method) to measure the loop pressure difference of the system. Table 2 listed the measurement accuracy of each parameter.

2.3. Experimental Results

2.3.1. Pipe Impedance

The average value of measurement results under multiple different flows was taken as the pipeline impedance of the circulation system, as shown in Table 3.
According to the experimental test results presented in Table 3, the average pipeline impedance of the experimental system was 1211 kg/m7.

2.3.2. Parameter Uncertainty Analysis

In experiments, the test results are unable to be consistent with the truth value due to the limitation of the factors like test methods, measuring instruments and subjective conditions of experiment operators. For the sake of improving the accuracy and repeatability of the experiment, the influence of different factors variables on the results was analyzed. There are different calculation methods for the uncertainty of the values obtained by direct measurement and indirect measurement, respectively.
For the direct measurement value, according to the sample standard deviation Δa of the measurement data and the indication error Δb of the instrument, the combined comprehensive uncertainty can be obtained by taking the square root on the basis of the sum of the squares of the two.
For the indirect measurement value N:
N   =   f ( x 1 ,   x 2 x n )
where the (x1, x2, …, xn) variables are independent.
The standard uncertainty of the dependent variable N:
Δ N   =   ( f x 1 Δ x 1 ) 2 + ( f x 2 Δ x 2 ) 2 + ( f x 3 Δ x 3 ) 2 + ( f x n Δ x n ) 2
The truth value of experimental measurements and corresponding relative uncertainty (Ur) can be given as:
{   N   =   N ¯   ± Δ N U r   =   Δ N N   ×   100 %  
In this experiment, the parameters, such as outdoor air temperature (T), water temperature at each inlet and outlet (T), outdoor wind speed (v) and solar radiation illuminance received on the surface of the collector (I), water flow (Qv), and pressure difference (ΔP), are directly measured, while other parameters, such as water density (ρ) under natural circulation and its corresponding water flow (G), pipeline impedance (S), and the solar heat efficiency (η), are calculated with the test data by indirect measurement. Based on the above analysis, according to the dependent variable function of other parameters, the Ur of the parameters in this experiment are shown in Table 4.
It could be found from Table 4 that the uncertainty of the direct measurement value was relatively small. The maximum value was 3.24% of the water flow and the minimum value was 0.08% of the temperature. This is mainly because the direct measurement is only affected by measuring instruments and personnel. When the instruments were properly selected, the measured value was closer to the real experimental value. In indirect measurement, the maximum uncertainty of pipeline impedance was 6.47%, which is mainly because the impedance is related to many factors, such as the increase of local pipe resistance due to the presence of dirt in the pipeline. The minimum uncertainty of density was 1.02%, which is mainly based on the precise fitting of MATLAB and the relative high accuracy of measuring temperature.

2.3.3. Experimental Test of Natural Circulation

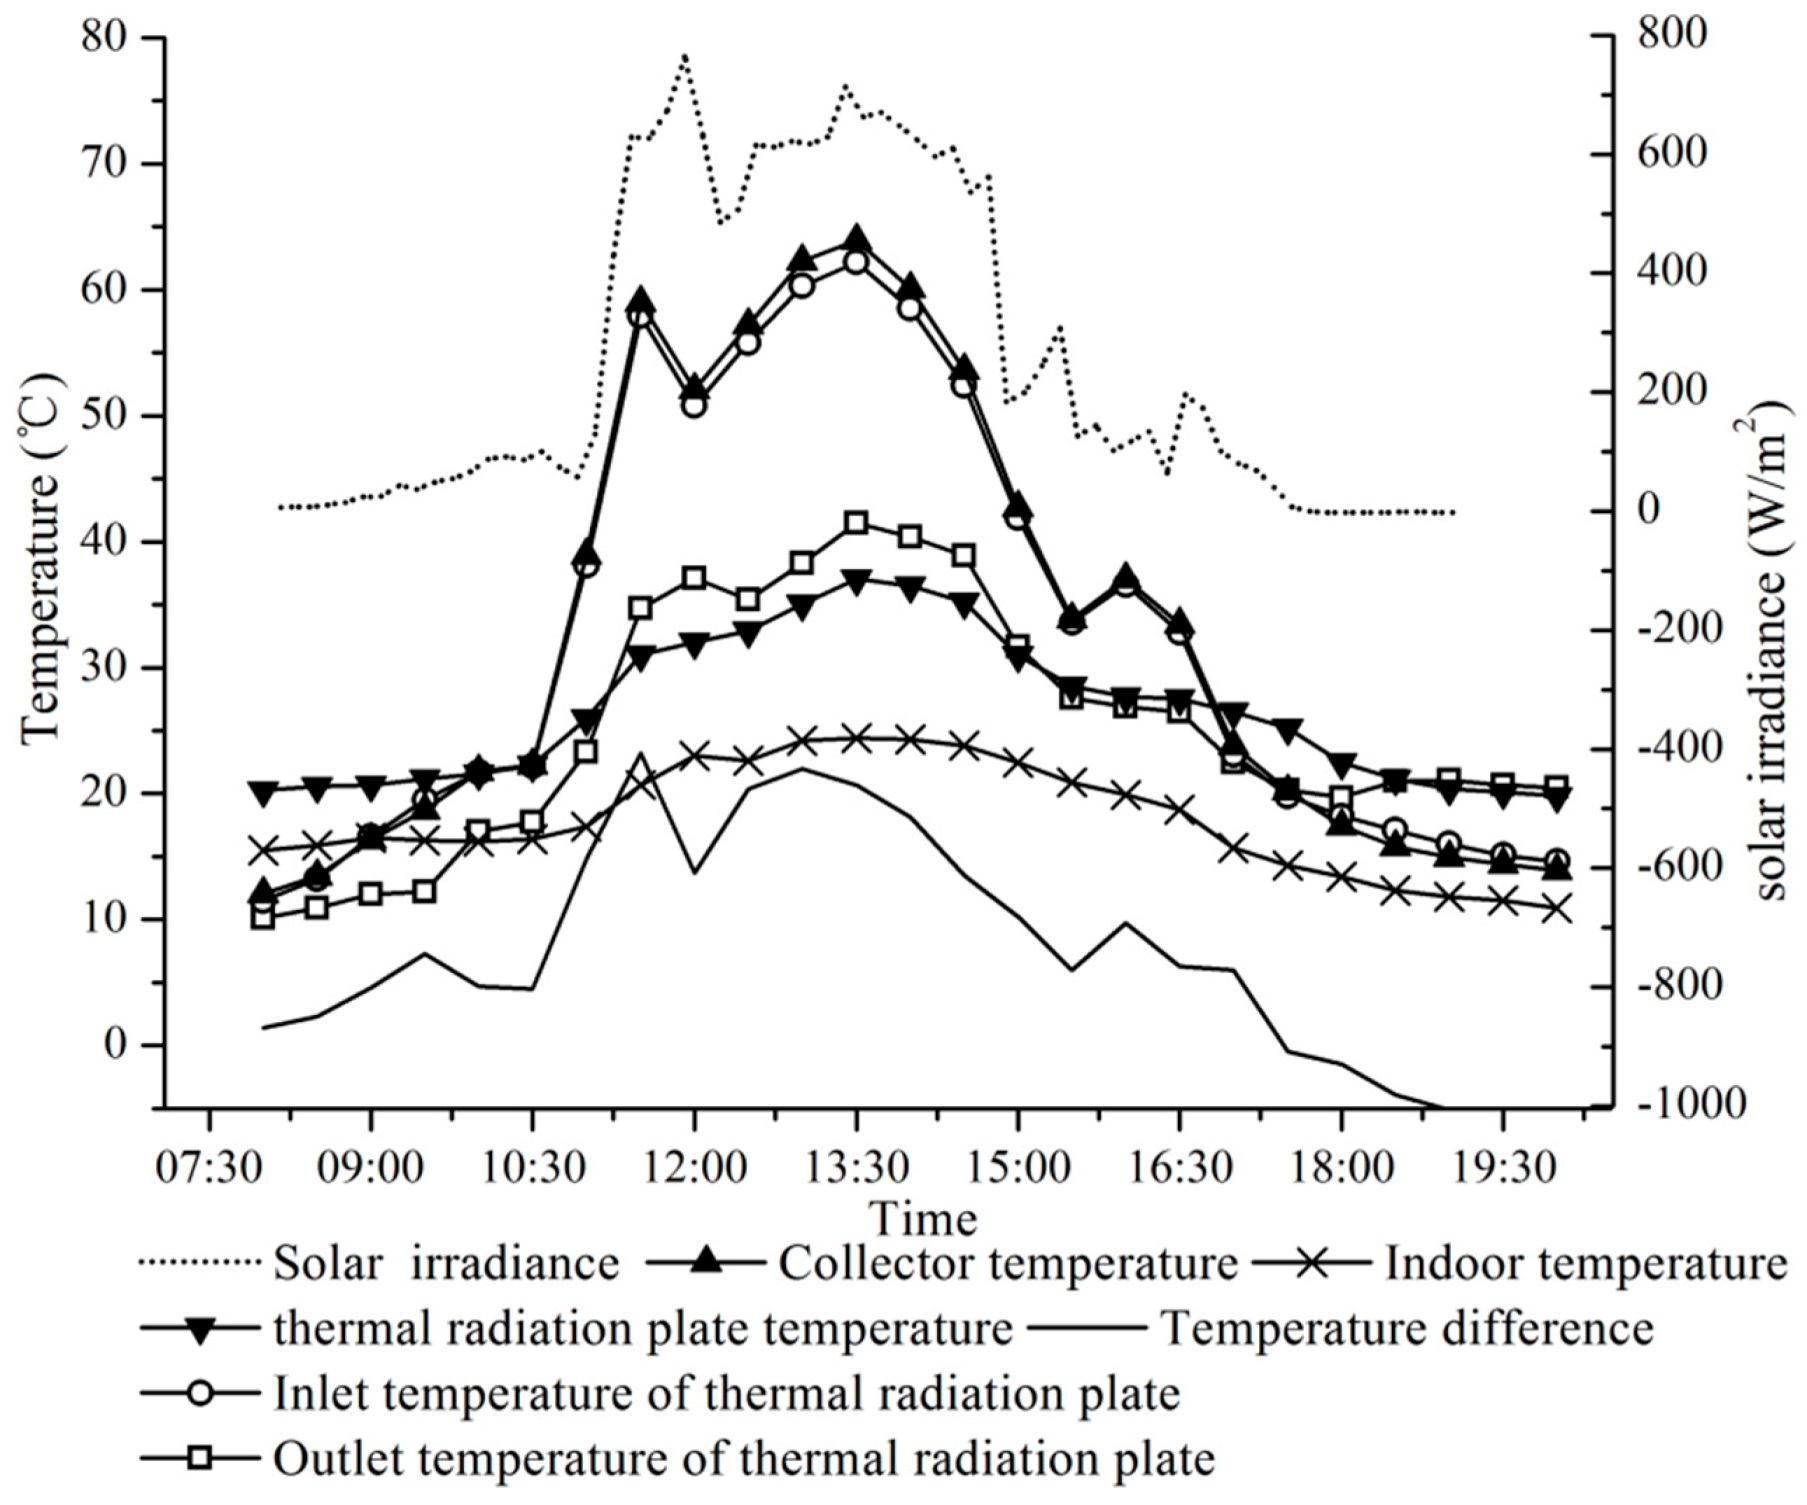
The test data on 5 January 2020 was selected from the multi-day experimental test data for analysis, whose solar radiation changes greatly, and multiple different experimental points could be provided. The presented day was a cloudy to sunny day with solar irradiance of 0–764 W/m2 perpendicular to the collector, outdoor air temperature of 7.2–18.4 °C, and outdoor wind speed of 0.4–2.3 m/s. The variation trend of the inlet (inlet 2) and outlet (outlet 2) temperature of the radiation plate and their temperature difference are shown in Figure 3.
Figure 3 indicates that the indoor air temperature fluctuated little due to the influence of the fan coil during the experiment. The outlet and inlet water temperatures of radiation plate and collector gradually increased as solar irradiance was enhanced. The change tendency of collector surface temperature, the outlet and inlet temperature and their temperature difference are basically consistent with the solar radiation variation tendency. At 11:50, the solar irradiance obtained by collector surface achieved peak maximum, 764 W/m2, while the water temperatures of the radiation plate’s inlet and outlet in the circulation system reached 59.5 °C and 39.2 °C, respectively, their temperature difference reaching 19.3 °C. From 12:30–13:10, the solar irradiance was basically around 620 W/m2, and the water temperatures of the outlet 2 and inlet 2 in system basically reached a stable value, indicating the maximum outlet and inlet water temperatures of the façade system could reach 58.7 °C and 37.1 °C respectively, and their temperature difference was 21.4 °C under a solar irradiance of 620 W/m2. The solar irradiance obtained by collector surface reached 713 W/m2 at 13:20. At this time, the outlet and inlet water temperatures in the circulation system was up to the maximum values of 62.6 °C and 41.3 °C, respectively, and their temperature difference reached 21.3 °C. Comparing the solar irradiance at 11:50 and 13:20 and the water temperature of the indoor radiation plate’s outlet/inlet, it can be found that the water temperature at the radiation plate’s inlet, as well as the duration of the solar radiation with similar intensity, had a certain influence on the wall heat transfer. At 11:50, the irradiance reached peak maximum, 764 W/m2, while the peak water temperature of the system was at 13:20 (the irradiance was 713 W/m2), which was mainly because before the solar irradiance reached 764 W/m2, solar irradiance acting on the wall had been increasing and the intensity was small, whereas before the irradiance reached 713 W/m2, the solar irradiance acting on the wall had lasted for a period of time with little difference in intensity. From 11:10–15:10, the water temperature at the outlet was basically higher than radiation plate surface’s temperature, which means that the system was supplying heat to the room during this period of time. At 17:10, when solar irradiance was nearly 50 W/m2 and not completely reduced to 0 W/m2 (17:50), the temperature difference had become negative in the experiment, indicating that 50 W/m2 solar irradiance had almost no heating effect on the wall. At this time, the solar collector side became the cooling side instead of heating side, and the water was not only unable to supply thermal energy indoors, but would also take the heat in the room outside.
It is also found from Figure 3 that, for the natural circulation system, the gravity pressure difference as a driving force changes with the solar irradiance. There was slight hysteresis in the water temperature changes, and the temperature fluctuation of the indoor thermal radiation plate surface was small.

3. Numerical Model

3.1. Analysis of Heat Transfer Process

In actual working conditions, the flow characteristics of natural circulation were very complicated. When performing theoretical calculations, the following assumptions were made for thermal conditions to simplify the calculations:
  • The natural circulation loop was a single-phase system, which did not involve the study of two-phase natural circulation conditions.
  • There was no heat conduction and heat exchange in the axial direction of the pipe wall.
  • The fluid was an incompressible Newtonian fluid, and the density and viscosity characteristics of the fluid were linear functions of temperature.
  • No inner heat source in this system.
  • The circulating pipe in system was adiabatic, while the water temperatures at inlet 1 and outlet 1 were equal to the temperatures at the outlet 2 and inlet 2, respectively.
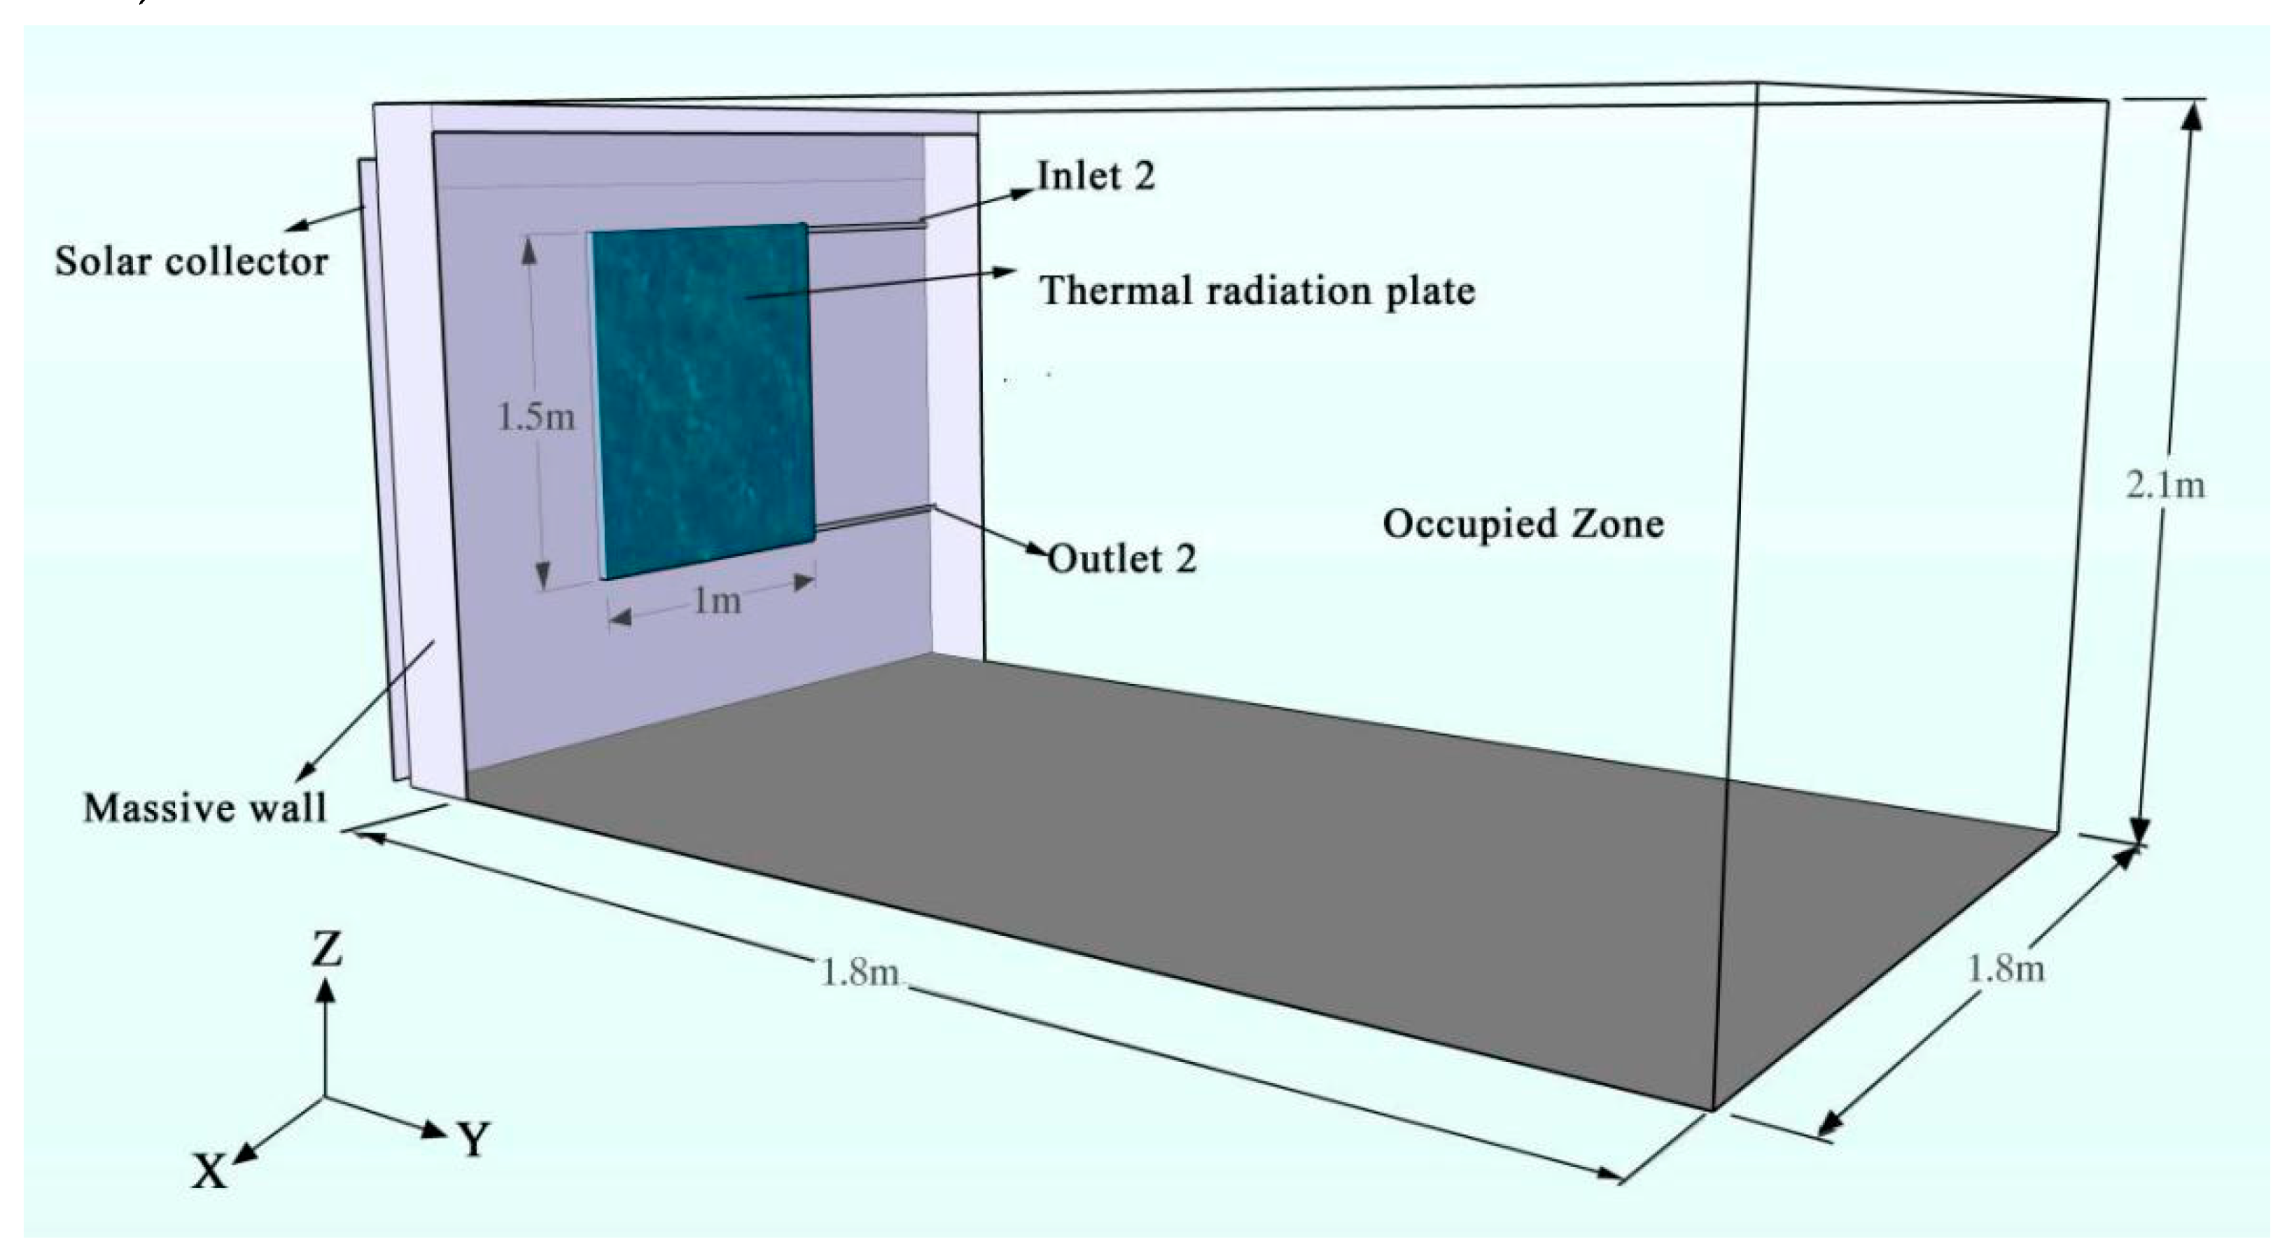
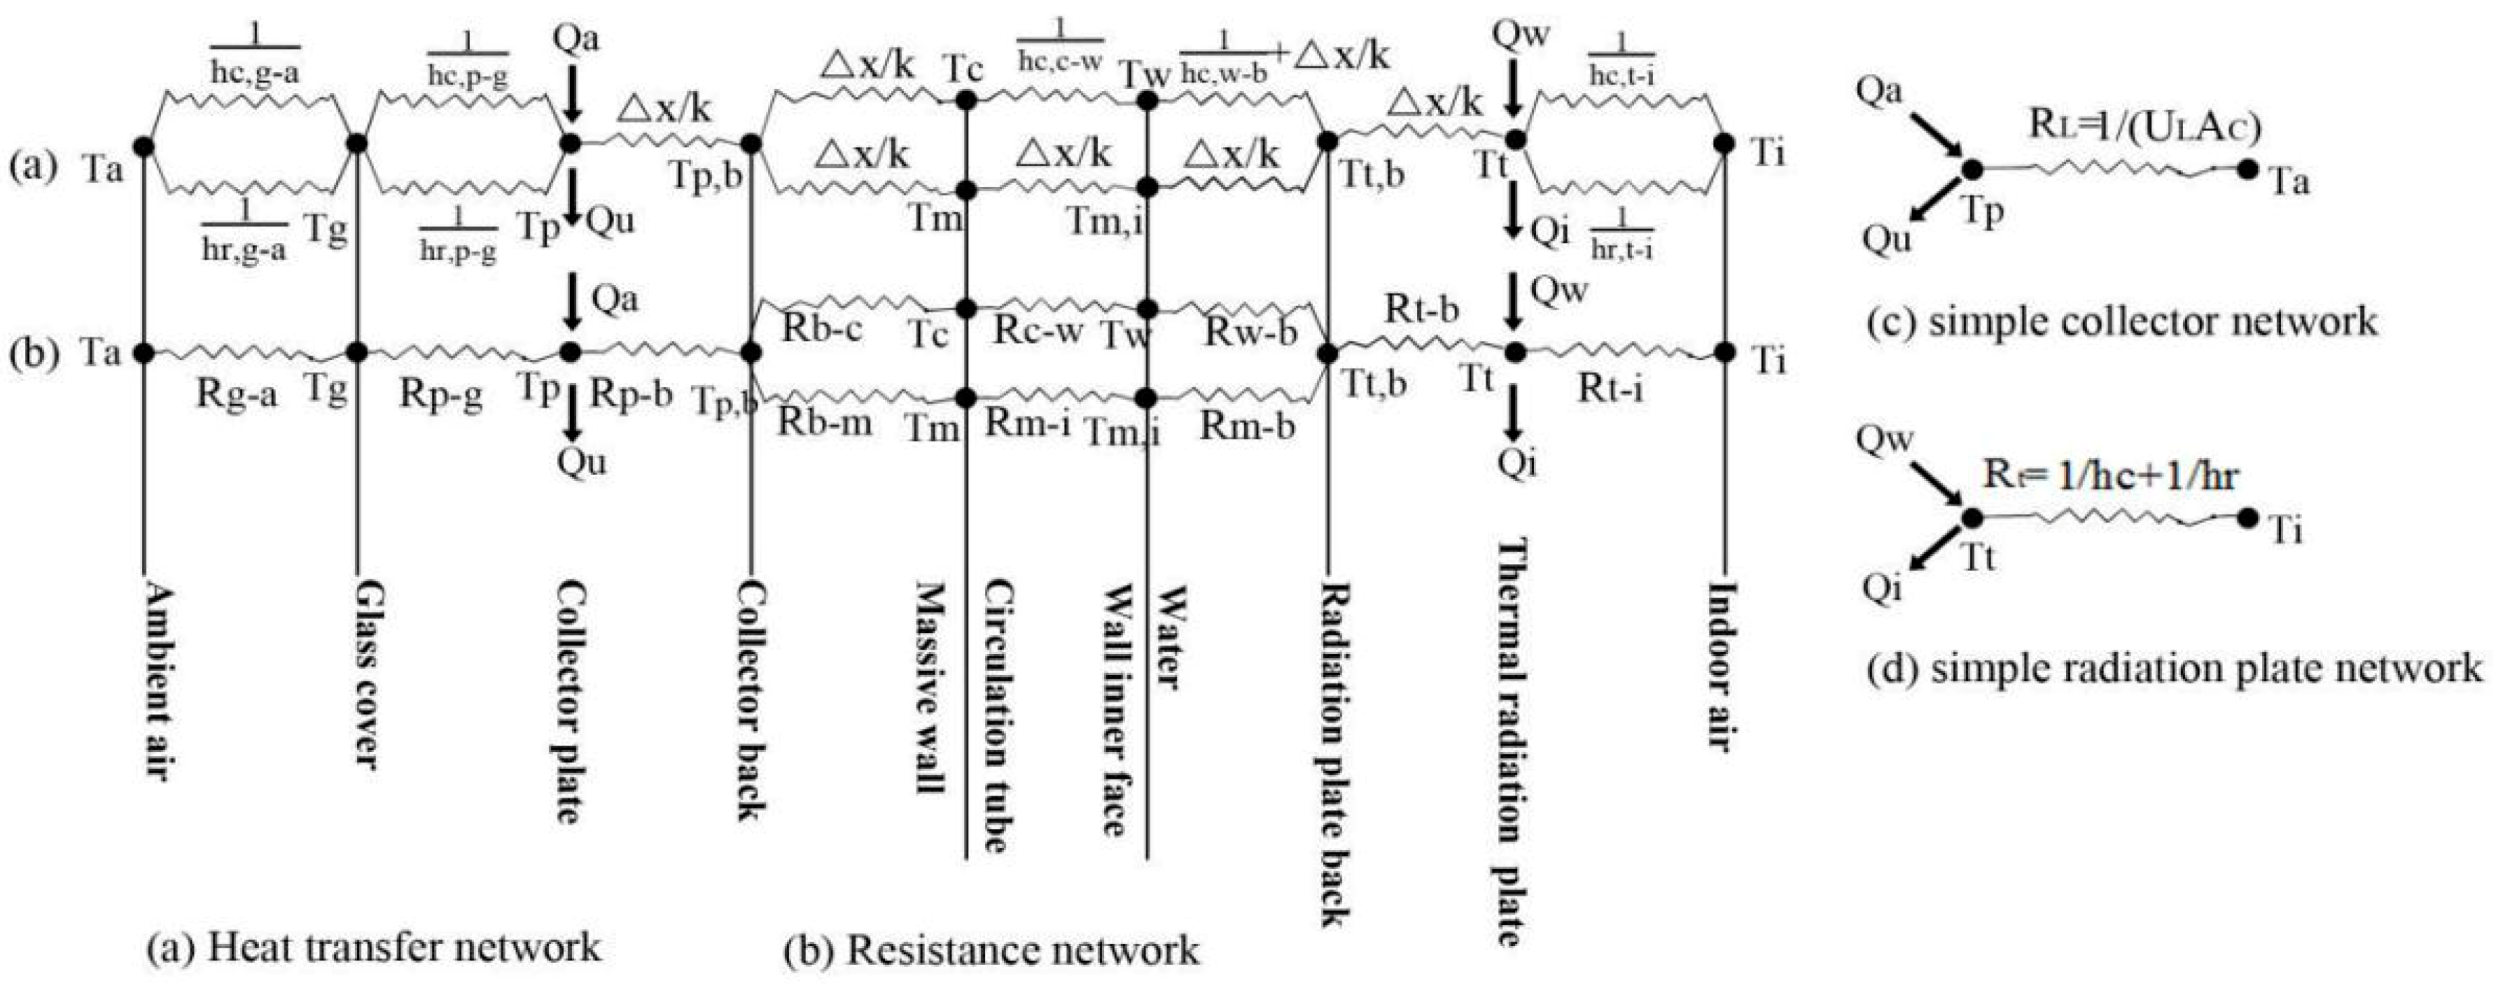
The physical model of the façade system was presented in Figure 4. The heat transfer process of the whole façade circulation system was sophisticated, which involved a contrasting relationship between the supply side (heating side) and the demand side (cooling side). When the surface of the solar collector (heating side) received solar radiation, the collector’s temperature increased. Part of heat was transferred to the room by the working fluid, while part was delivered to the indoor environment by heat conduction through the massive wall. Considering the heat transmitted by the massive wall occupied merely an extremely small section compared to the heat delivered by the water flow, the heat delivered by water flow was mainly considered in this paper. For the purpose of further illustrating the flow characteristics of the solar circulating hot water, the analysis was performed from the heating side and the cooling side, which are described in the following sections. It could be found from the heat transfer process of façade system (Figure 5) that the network consists of conduction, convection, and radiation terms.

3.1.1. Heating Side

In line with the law of conservation of energy, the solar radiation energy irradiated on the surface of solar collector per unit time (Qa) should consist of three parts, which include the useful energy output by the solar collector (Qw), the internal energy change of the collector itself (Qs), and the energy lost by solar collector to the surroundings (QL). It can be expressed by Equations (4)–(8):
Q a =   Q s + Q w + Q L
Q a =   τ α p Ι A p
  Q w =   c w G w ( T w , o T w , i )
  Q s =   M p c p d T p d t
  Q L   =   T p T a R L   =   A p U L ( T p T a )
where UL is the total heat loss coefficient [28]. In the wall system, the radiation heat and convection heat transferred outside could be ignored due to the insulation materials used on the wall side. Therefore, only the heat loss on the side of the glass cover was considered, including the radiation and convection heat exchange between the collector and transparent glass cover (the heat loss coefficient is UL1 calculated by Equation (9)), and the radiation and convection heat exchange between glass cover and surrounding environment:
U L 1 = h r , p - g + h c , p - g = σ ( T p + T g ) ( T p 2 + T g 2 ) ( 1 / ε p ) + ( 1 / ε g ) 1 + N u k L
For vertical planes, the last term in Equation (9) can be obtained by Equation (10) [29] and Equation (11):
  N u = 1 + 1.44 ( 1     1708 R a · c o s θ ) + [ 1     1708 ( s i n 1.8 θ ) 1.6 R a · c o s θ ] +   ×   [ [ R a · c o s θ 5830 ] 1 / 3     1 ] +
  R a = g β L 3 γ ψ ( T p     T g )
where the convection coefficient and radiative heat transfer coefficient [30] between glass cover and surrounding environment can be expressed using Equation (12) and Equation (13), respectively:
h c , a - g = 8.6 v a 0.6 L 0.4
h r , a - g = ε g σ ( T a 2 + T g 2 ) ( T a + T g )
Therefore, the heat balance equation of the glass cover can be written using Equation (14):
δ g ρ g C g T g t = h c , a - g ( T a T g ) + h r , a - g ( T a T g ) + U L 1 ( T p T g ) + I α g
where αg is the glass cover’s effective absorptivity.
To simplify the calculation process, the total heat loss coefficient (ul) can be obtained directly from Equations (15) and (16) [31]:
U L = 1 N 344 T p   ×   ( T p T a N + f ) 0.33 + 1 h a + σ ( T p 2 + T a 2 ) ( T p + T g ) 1 ε p + 0.05   N ( 1 ε p ) + 2 N + f 1 ε g N
f = ( 1 0.04 h a + 0.0005 h a 2 )   ×   ( 1 + 0.091 N )
On the basis of the hypothesis that along the width direction (x direction), the temperature allocation of all solid material layers were even, the collector’s heat thermal balance equation can be presented as Equation (17):
ρ p C p T p t = 1 δ p [ τ g α p I + U L ( T g T p ) Q W ] k p ( 2 T p y 2 + 2 T p z 2 )

3.1.2. Cooling Side

For indoor radiation heating devices in this system, under the condition of heat balance, the heat carried by the water heated by the solar collector (Qw) was equal to the heat delivered indoors by the radiation plate (Qt), and equal to the heat exchanged by indoor fan coil (Qi) (there were no inner heat sources and storage body indoors). The heat of radiation plate included radiation heat transfer and convection heat transfer. Hence, the heat thermal balance equation on cooling side can be illustrated as Equations (18) and (19):
Q w   =   Q t   =   Q i
Q t = Q t , c + Q t , r
where the convection heat thermal transfer amount of thermal radiation plate (Qt,c) can be given by Equation (20) [32]:
Q t , c = h i ( T i T t ) A t = | 2 . 31 ( T i T t ) 1.31 A t |
while the radiation heat transfer amount of the thermal radiation plate (Qt,r) can be expressed as Equation (21) [30]:
Q t , r = A t h t , r | A U S T T t |
where the AUST (area-weighted average temperature of uncontrolled surfaces in the room) represent a weighted average temperature of the non-heated surfaces of the room except the thermal radiation plate surface in °C [30]. In this study, there was no heat storage body, such as furniture, and the AUST value was regarded as the indoor wall surface temperature.
Thereby, the radiation plate’s energy balance equation in this system can be written as Equation (22) by referring to Equation (17):
ρ t C t T t t = 1 δ t [ Q w ( h t , r + h i ) ( T t T i ) ] k t ( 2 T t y 2 + 2 T t z 2 )

3.1.3. Wall Circulation System

For natural circulation, the key to calculating the heat transferred to the room by water was to determine the mass flow (Equation (23)), which was caused by the driving force generated in the natural circulation loop due to the density difference between the heating section and the cooling section of the loop:
G   =   ρ w Q v   =   ρ w v w π d 2 4
The density of the working fluid (water) in the natural circulation system changed with temperature. With reference to the water density change table, Equation (24) can be obtained by MATLAB fitting:
ρ   =   0.000003 T w 2     0.000108 T w   +   1.000937
The volume flow of water in the system (Qv) can be determined by Equations (25)–(27). According to the energy balance, the total driving pressure (ΔP) of the closed loop should be equal to the loss pressure drop (∆Pl). The total driving pressure of the system can be expressed by Equation (25):
Δ P   =   ρ g d h = ρ 1 g d h 1   ρ 2 g d h 2
where h1, h2 is the height change of the water flow density ρ1, ρ2, respectively.
The total loss pressure drop includes frictional resistance along the pipeline and the local resistance. In this study, the pipeline impedance (S) was used to comprehensively reflect the frictional resistance and the local resistance of this system, which can be expressed by Equations (26) and (27):
Δ P = Δ P f + Δ P j = Δ P = S Q v 2
  S = 8 ( λ l d + ζ ) π 2 d 4 g
In this paper, the value of S was equal to the average value of measurement results under multiple different flows.
The solar heat efficiency of the façade system, which represented the proportion of the heat delivered to indoor by radiation plate to heat obtained by collector, can be expressed using Equation (28).
  η   = Q w Q a = G c w ( T w , o T w , i ) 0 t α p τ I Α p d t

3.2. Simulation Methods

MATLAB software was employed to program and solve the numerical model in this study, and the corresponding final results satisfying the cycle termination conditions were obtained through iterative calculation. The calculation method and solution process of the whole circulation system are shown in Figure 6, wherein the left side shows the calculation method and solution process of the outlet temperatures of both the collector (tw_r) and the radiation plate (tw_u). In the simulation, the initial temperature of working fluid (water) was set 10 °C, the initial value of indoor air temperature was set 20 °C, and other initial parameters referred to the data on the experimental day. The flow chart displayed in Figure 6 can be briefly explained as follows:
  • At the beginning of the program, refer to the experimental data and input the necessary parameters, such as solar radiation (I), wind speed (v), and ambient air temperature (Ta). Set the initial values of the solar collector temperature (Tp_k), the inlet water temperature (tw_s), and the indoor temperature (Ti_k).
  • Solve the water temperature at the collector outlet 1 (tw_r). Assume that outlet water temperature of the solar collector (tw_r) is equal to its inlet water temperature (tw_s) at the k-th cycle, superpose iterations in steps of 0.001, and combine Equations (4)–(16) and (23)–(28), until tw_r with the required accuracy is found.
  • Take the collector’s water temperature (tw_r) as the radiation plate’s inlet water temperature at the k-th cycle.
  • Solve the radiation plate’s outlet water temperature (tw_u) in the k-th cycle. Assume the water temperature at radiation plate outlet (tw_u) is equal to the water temperature at collector’s inlet (tw_s). Based on the fact that the mass flow on the cooling side is equal to that on the heating side, combining Equations (6) and (18)–(21), determine whether f (tw_u) is equal to 0 within the accuracy range.
  • If f (tw_u) is equal to 0 within the accuracy range, then tw_u is the water temperature at radiation plate’s outlet at the k-th cycle and outputs tw_u.
  • If not, the iteration is continued with a step size of 0.0001 until tw_u with the required accuracy is found. In this process, the surface temperature of radiation plate is seen as the average temperature of the outlet and inlet water temperature of radiation plate.
  • According to the actual water temperature at collector inlet (tw_s) at the k-th cycle and the outlet water temperature of radiation plate (tw_u) obtained from the calculation at the k-th cycle, determine whether the cycle can be terminated or not. That is, within the precision range (±0.0002), is the tw_u equal to the tw_s?
  • If it is, output the thermal supply from thermal radiation plate to indoor, and calculate the façade’s solar heat efficiency according to Equation (28).
  • If not, take the water temperature at the radiation plate outlet 2 (tw_u) obtained at k-th cycle as the inlet water temperature of the solar collector (tw_s) at k+1-th cycle, return to step 2, and continue the cycle until the heat balance condition is satisfied, and finally obtain the solar heat efficiency of the system.

4. Simulation Validation

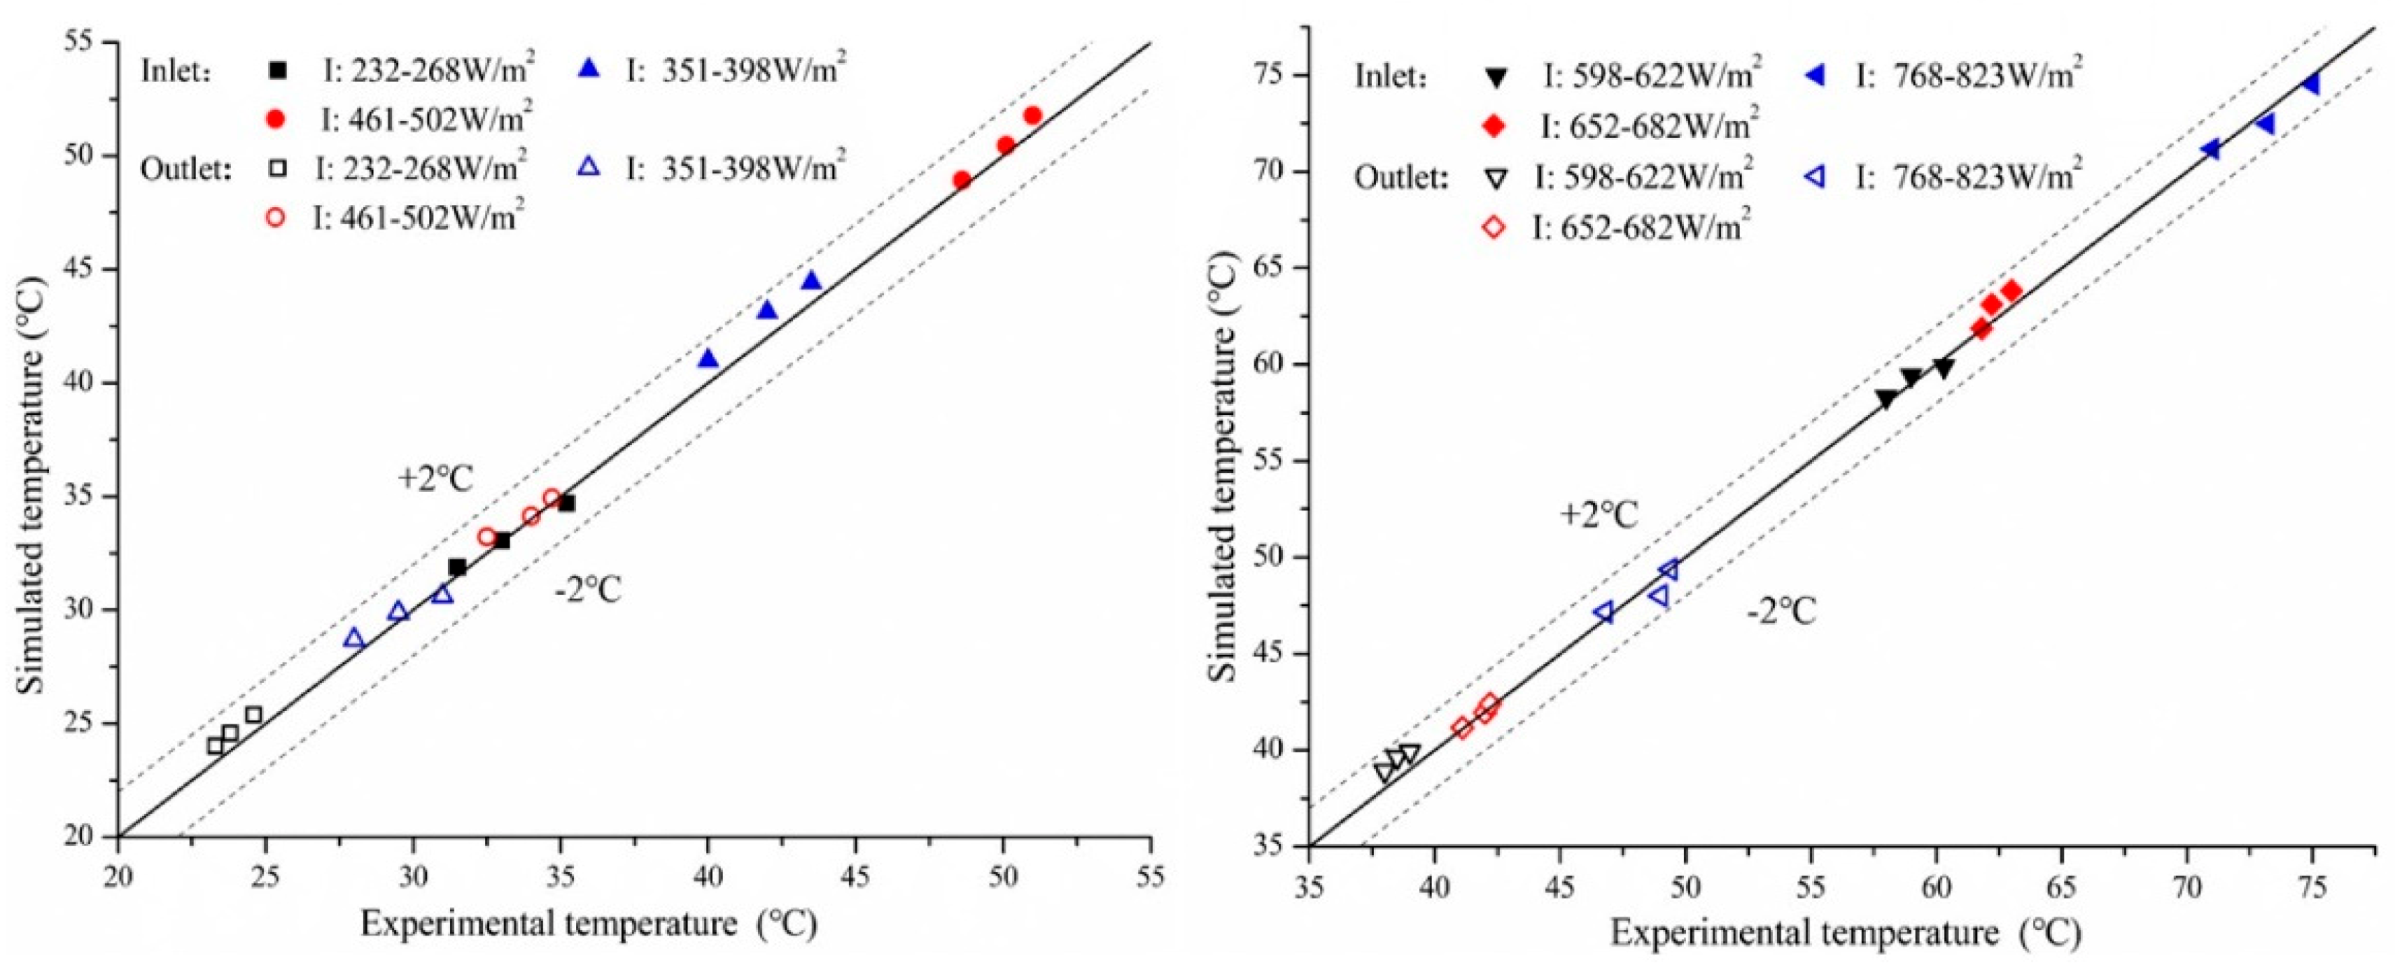
Climate and solar irradiance (I) are important factors affecting the performance of the wall circulation system. For the purpose of precisely analyzing the solar energy utilization performance of this system, this study carried out many days of experimental tests, and selected the time period in which the solar irradiance and outdoor wind speed were basically stable (the duration was greater than 1 h) for simulation verification. The solar irradiance during the selected time period should be higher than the solar irradiance before that time period, so as to ensure that under the action of solar irradiance in this time period, the water temperatures at thermal radiation plate’s outlet and inlet are higher than its inlet and outlet temperatures at the previous time. That is, the water must absorb solar heat rather than release heat to the outside during this time. Additionally, the water temperature at radiation plate’s outlet and water temperature at collector’s inlet should basically tend to be stable in this period of time. This simulation value did not represent a specific value at a certain point in time. In simulation, the solar collector’s area was set to 2 m2 and the radiation plate’s area was set to 1.5 m2 to simplify the calculation. With reference to parameters in the experiment like solar irradiance, wind speed, and outdoor temperature, the experimental conditions within the time period that meets the requirements are simulated, and the corresponding results are presented in Figure 7.
In Figure 7, the results show that under different climates and solar irradiance, the maximum error of the outlet and inlet water temperature of the radiation plate between simulations and experiments was within ±2 °C. Under high solar irradiance, the simulated outlet and inlet water temperatures were slightly lower than the experimental results, which is mainly due to the influence of the temperature gradient in the height orientation of the collector during the experiment. Under low solar irradiance, the simulated water temperatures at the outlet and inlet were slightly higher than the experimental values. This is because under low solar irradiance, the density difference of the circulating hot water in the system is too imperceptible to generate a large adequate gravity pressure difference, thus, the fluid velocity is low, which results in more heat loss per unit mass flow rate in the circulating pipeline under the experimental conditions. It can also be obtained from Figure 6 that the maximum relative error between the water temperature values of experiment and simulation was 2.93%. The simulated results agree well with the experimental results.

5. Discussion and Analysis

In this system, the heat delivered to indoor by circulating water is a direct factor which impacts the solar heat efficiency. Based on the above model, the parameters that influence the variation of heat transfer were simulated, including the outdoor thermal environment, the height difference between the radiation plate center and collector center, and the pipeline impedance. The change law of the solar heat efficiency of the façade was obtained as shown below.

5.1. Effect of Outdoor Thermal Environment Parameters

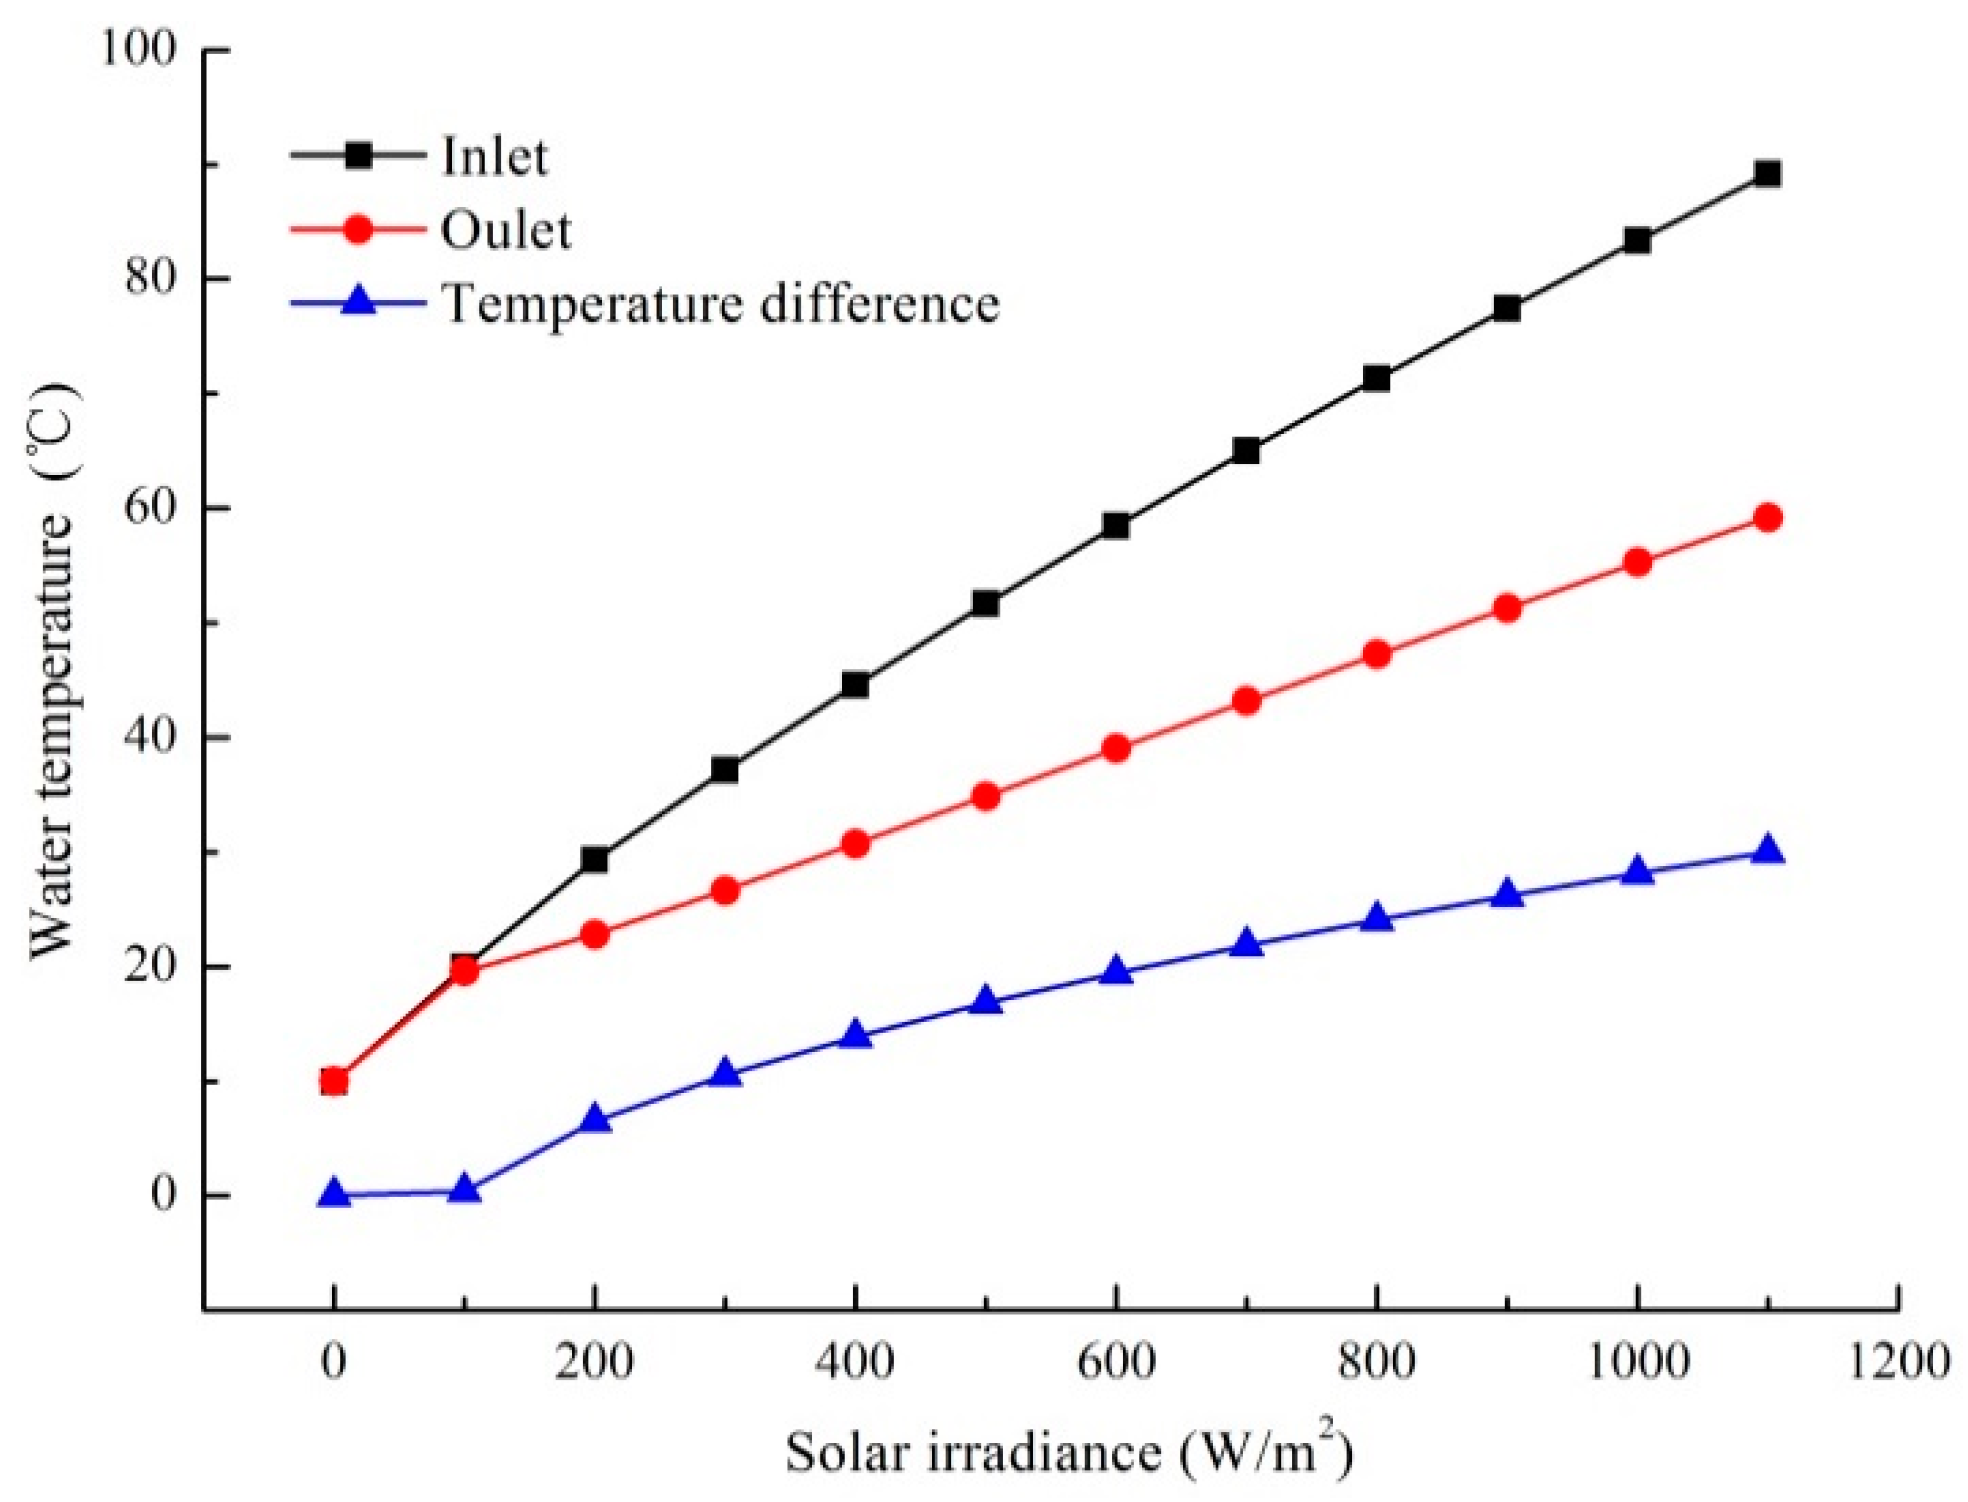
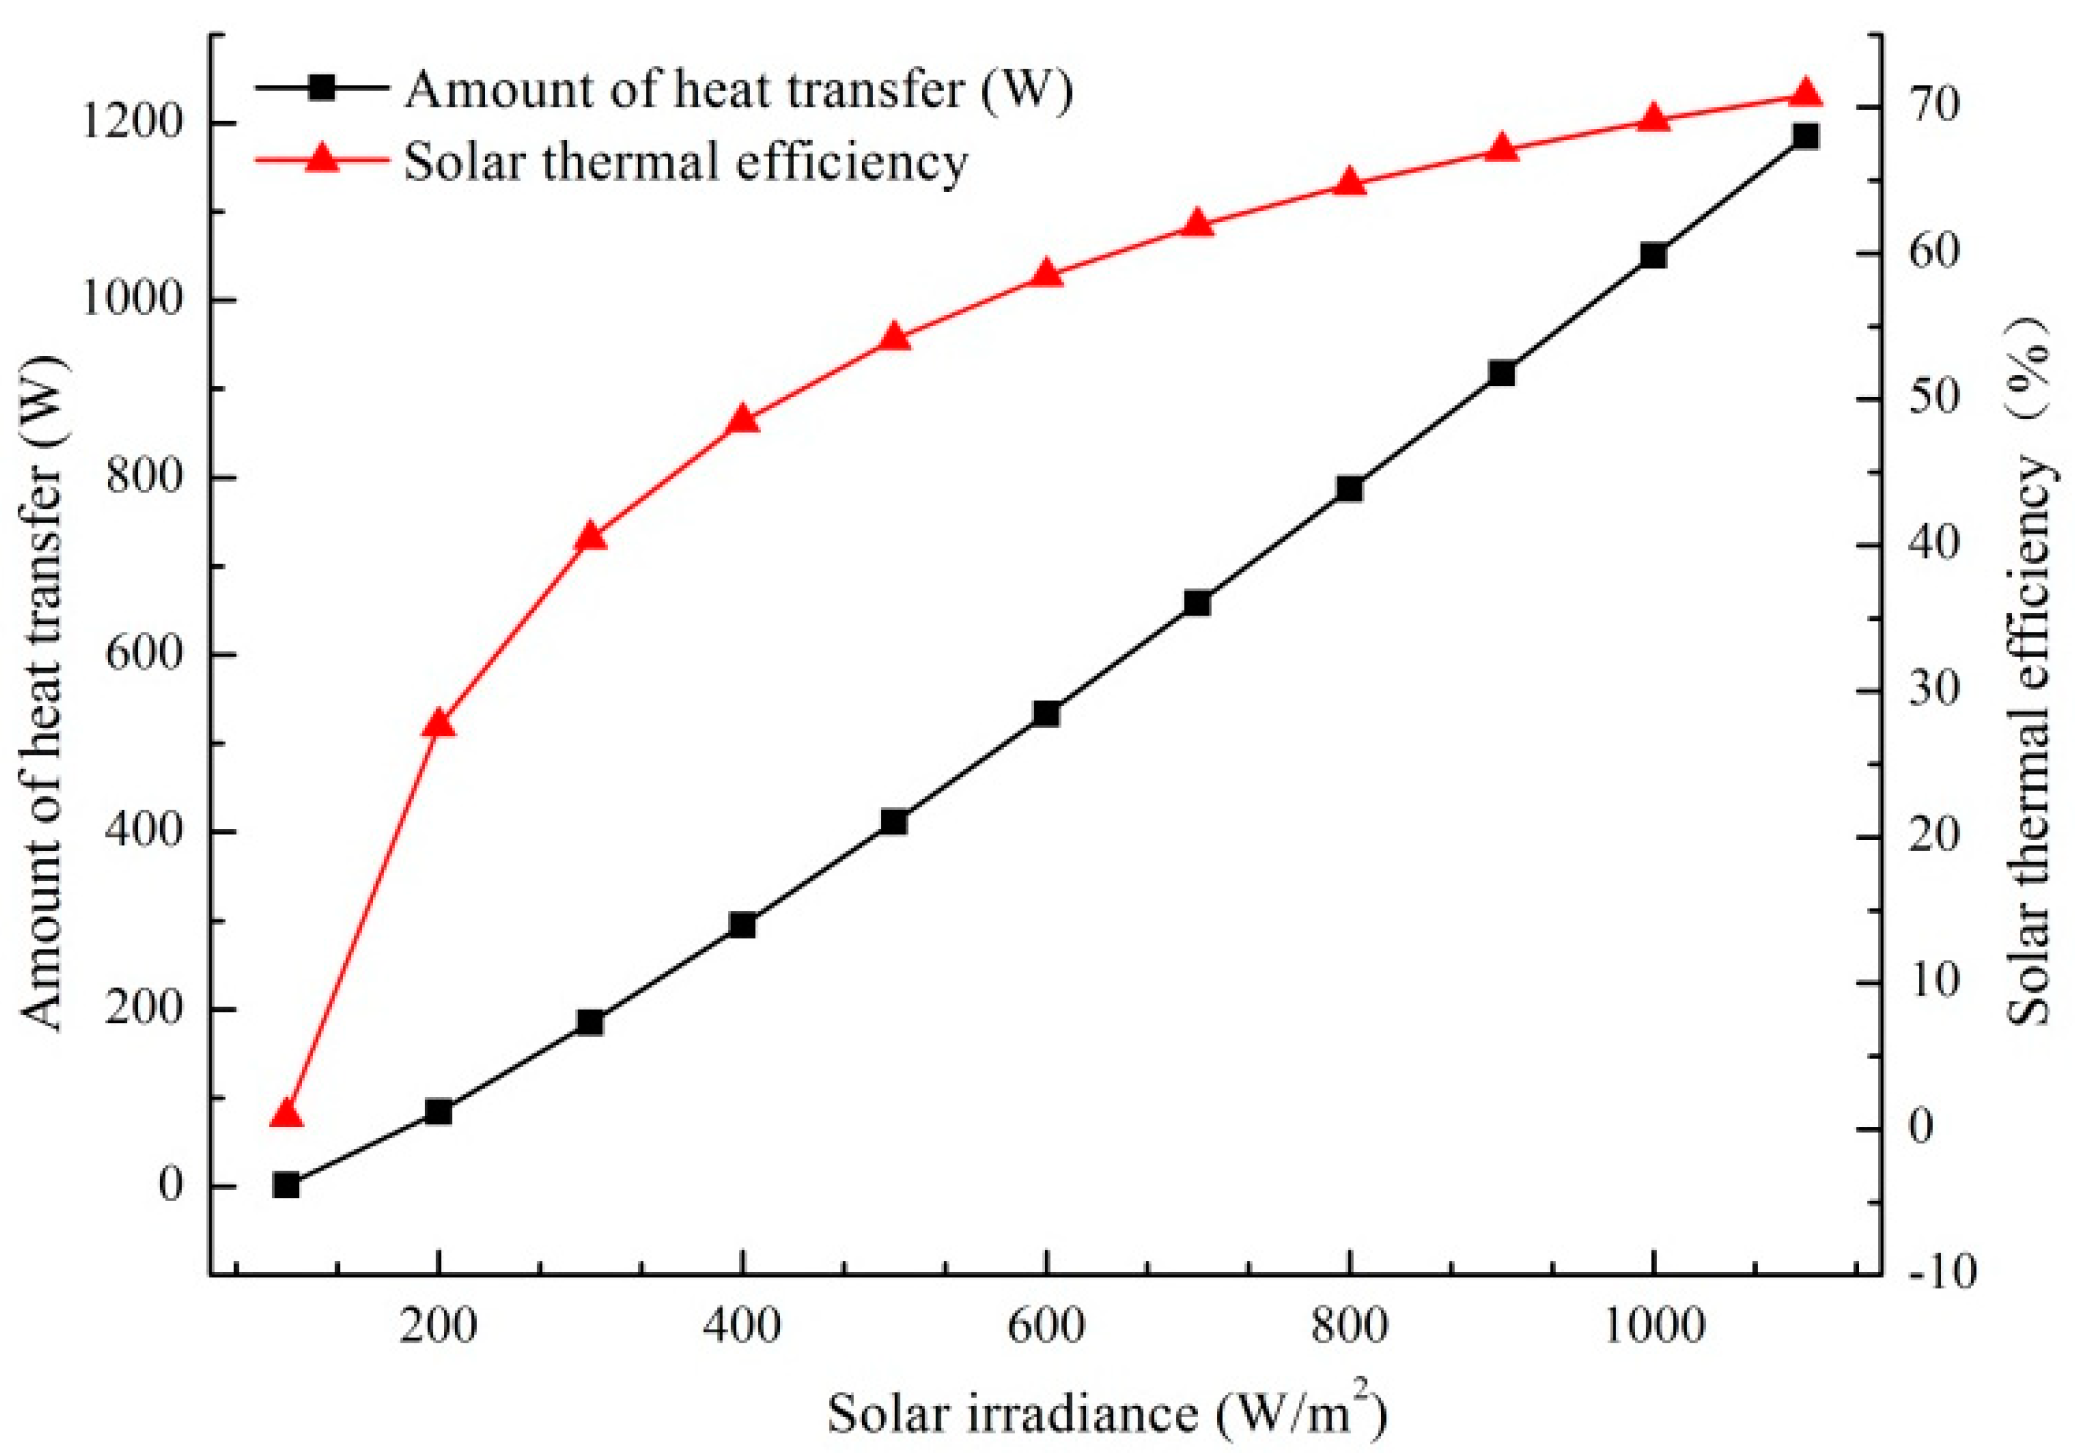
In simulation, the wind speed was set to 1.5 m/s, the indoor temperature was 20 °C, the initial water temperature and initial collector temperature was 10 °C and 7 °C (below the initial water temperature), respectively. Under the condition of different solar irradiance and 10 °C outdoor temperature, the water temperatures at the radiation plate’s outlet and inlet, their temperature difference, the heat delivered into indoor, and the solar heat efficiency can be obtained, which is presented in Figure 8 and Figure 9, respectively.
Figure 8 shows that under natural circulation, the water temperatures at the radiation plate’s outlet and inlet in this façade system and their temperature difference increased as the solar irradiance was enhanced. The water temperature difference between outlet and inlet did not change significantly under the condition of solar irradiance lower than 100 W/m2. As irradiance rose from 100 W/m2 to 1100 W/m2, the radiation plate’s inlet water temperature increased from 19.9 °C to 89.2 °C, the water temperature at outlet increased from 19.6 °C to 59.2 °C, and their temperature difference increased from 0.3 °C to 30 °C. This shows that the larger the solar radiation, the stronger the natural circulation force, and the more heat that is transfer to the room.
Figure 9 shows that both the heat transfer amount through the façade to indoor and the façade’s solar heat efficiency are positive proportional to the solar radiation. In this wall system, the transmittance of the glass cover was 0.8, and the absorptivity of the solar collector was 0.95. As the irradiance rose from 200 W/m2 to 1100 W/m2, the solar radiation thermal heat received by the solar collector was increased from 304 W to 1672 W (the solar collector’s area was 2 m2), the heat transfer amount to indoor at this time could reach 1184 W, and the maximum solar heat efficiency could reach up to 71%. The solar heat efficiency had exceeded 50% at 400 W/m2 solar irradiance. It can also be obtained from the Figure 8 that the variation speed of the solar heat efficiency declined with the increase in solar radiation. According to the previous theoretical analysis, high solar irradiance would increase the temperature of the solar collector and lead to an increase in heat loss, which transferred from the collector to outdoors through heat conduction, heat convection, and heat radiation. Therefore, reducing the solar collector’s heat loss to outside can improve the solar energy utilization efficiency of this façade.
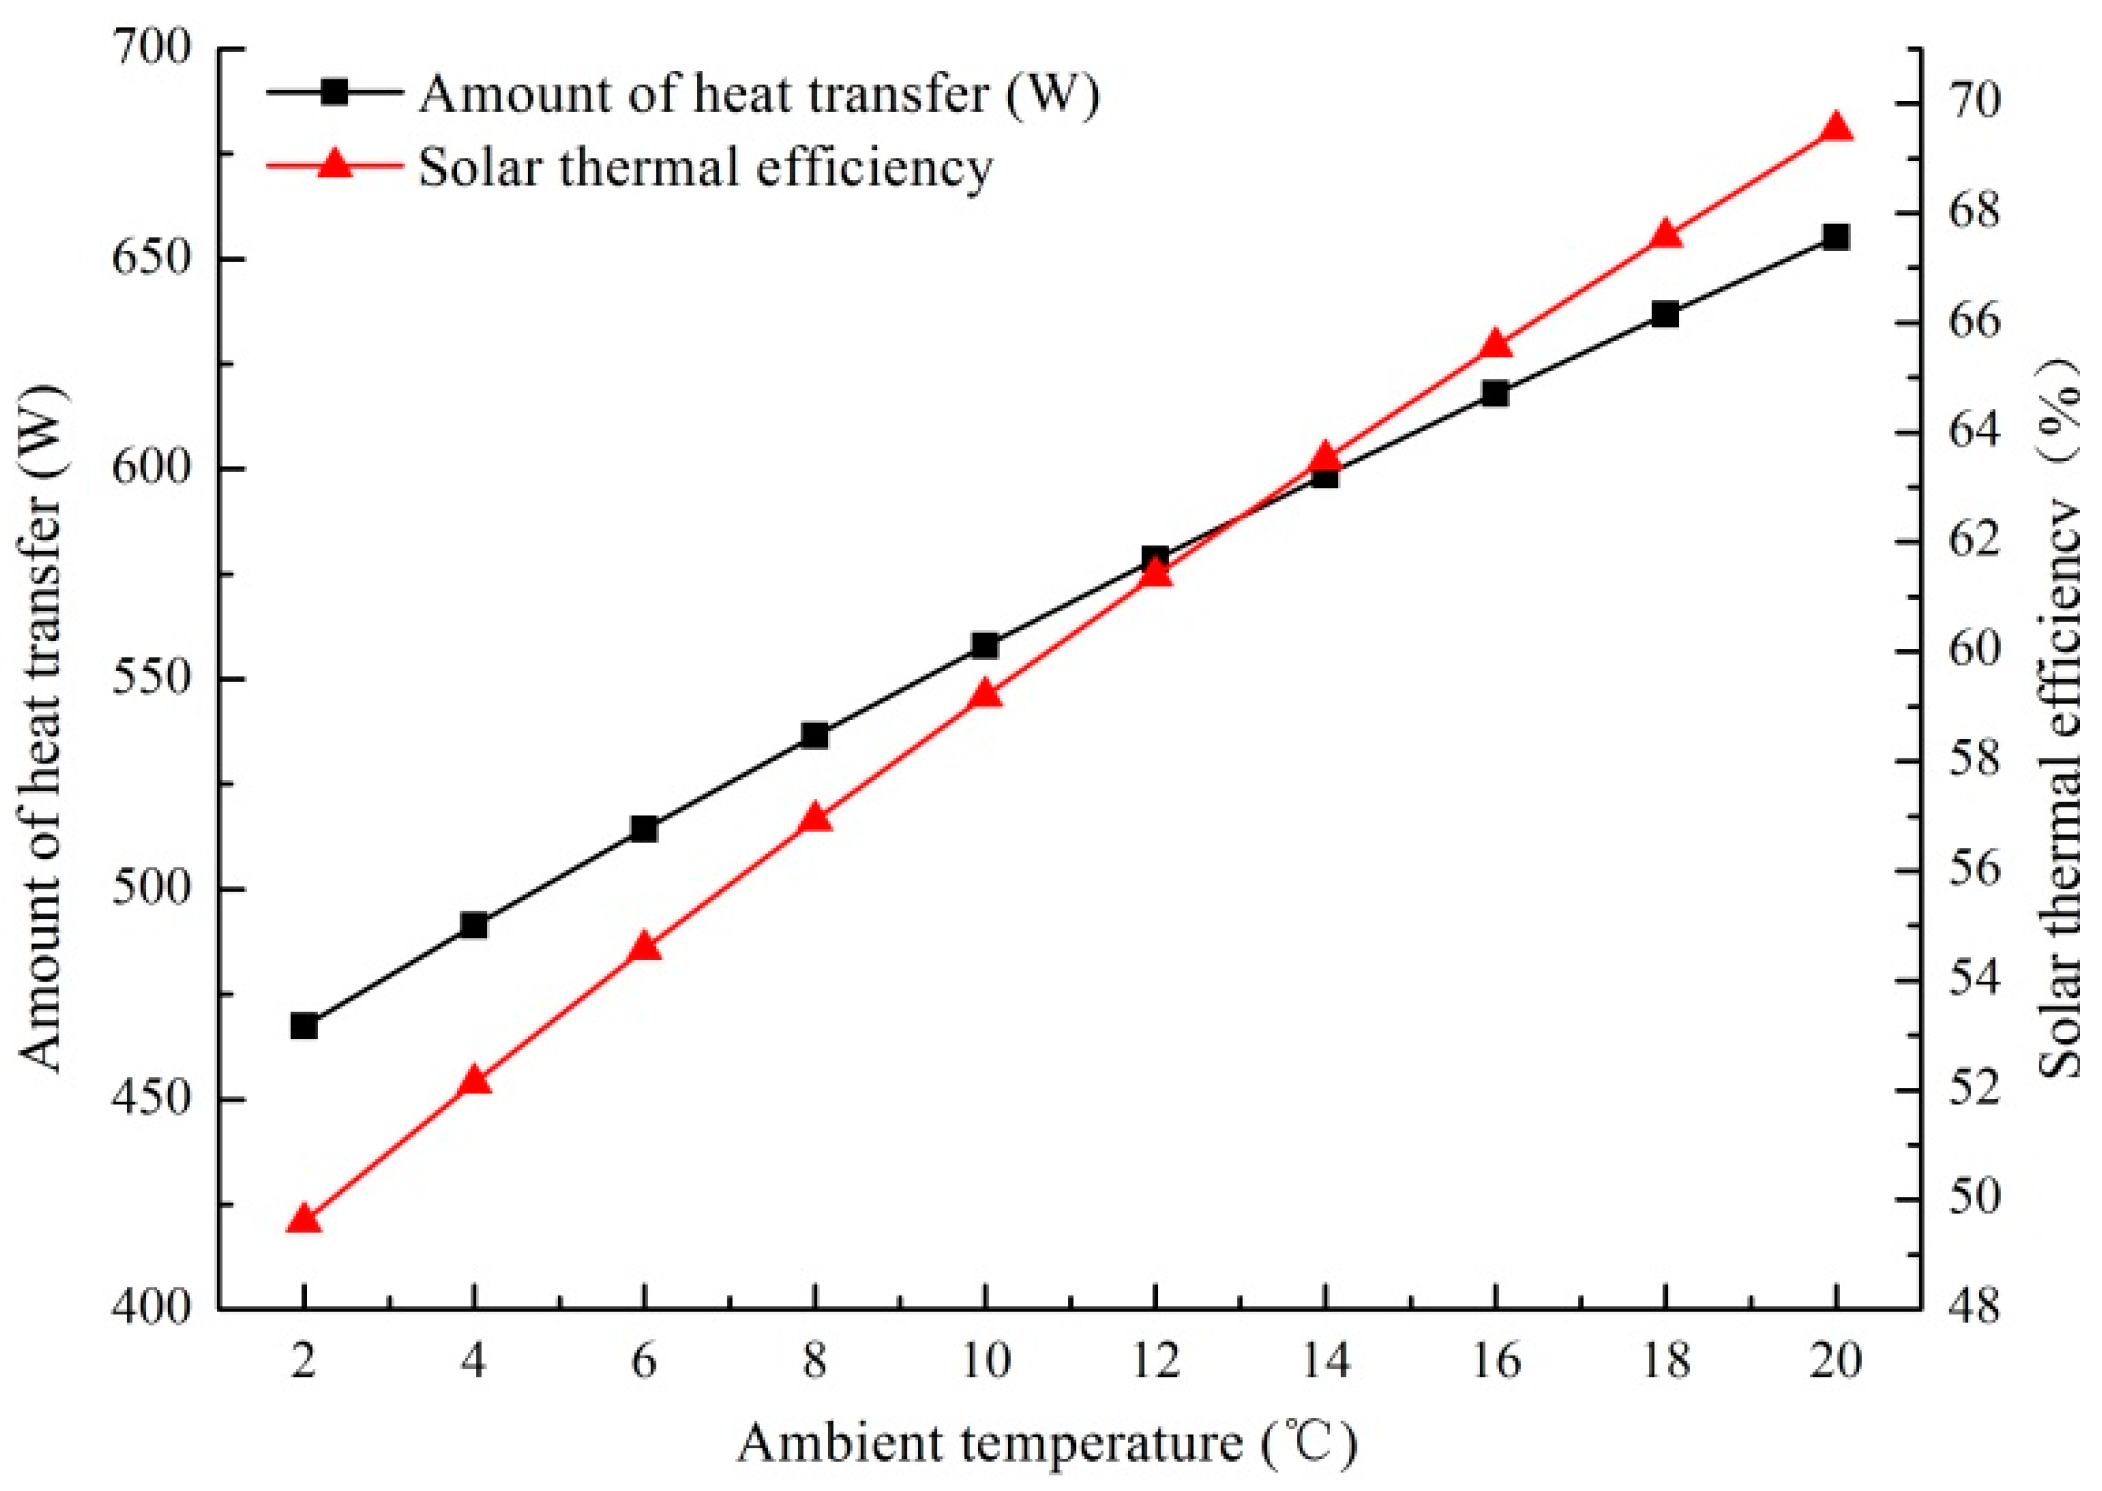
When solar irradiance on the façade’s vertical surface was 620 W/m2, under different outdoor ambient air temperatures, the water temperatures at the radiation plate’s outlet and inlet, their corresponding temperature difference, the heat released into indoors, and the solar heat efficiency of this system can be obtained, as shown in Figure 10 and Figure 11, respectively.
Figure 10 indicates that under the constant solar irradiance, the water temperature at outlet and inlet and their temperature difference increased as the outdoor ambient air temperature increased, and changed linearly along with the ambient temperature. As the outdoor air temperature rose from 2.0 °C to 20.0 °C, the heat loss from the solar collector to the surroundings decreased, the inlet water temperature of radiation plate increased from 54.8 °C to 64.8 °C, the outlet temperature was increased from 36.8 °C to 43.0 °C, and their temperature difference enlarged from 18.0 °C to 21.8 °C.
Figure 11 indicates that both the heat transfer amount through the façade to indoor and solar heat efficiency of this façade system are positive proportional to outdoor ambient air temperature. with the rise of ambient temperature from 2 °C to 20 °C, the solar heat obtained by collector was 942.4 W, the heat transfer from the façade system to indoor raised from 468 W to 655 W, the solar heat efficiency improved from 49% to 69%. This is because, with constant solar radiation, the collector’s heat gain did not change. The higher the ambient temperature, the less the heat delivered from collector to outside through glass cover, the more heat that was delivered indoors.
From above analysis, it can be found that both solar irradiance and outdoor ambient air temperature will affect the heating performance of the façade. The greater the solar irradiance or the higher the outdoor ambient air temperature, the more the heat delivered through the wall to the indoor environment. Moreover, within the range of changes in outdoor meteorological parameters, the impact of the change in solar irradiance is more significant. It is obvious that this system could be applied in zones with high solar irradiance and a night temperature which is not lower than 0 °C (like Tibet), the wall could obtain a favorable heating effect.

5.2. Effect of the Height Difference between the Thermal Radiation Plate Center and Solar Collector Center

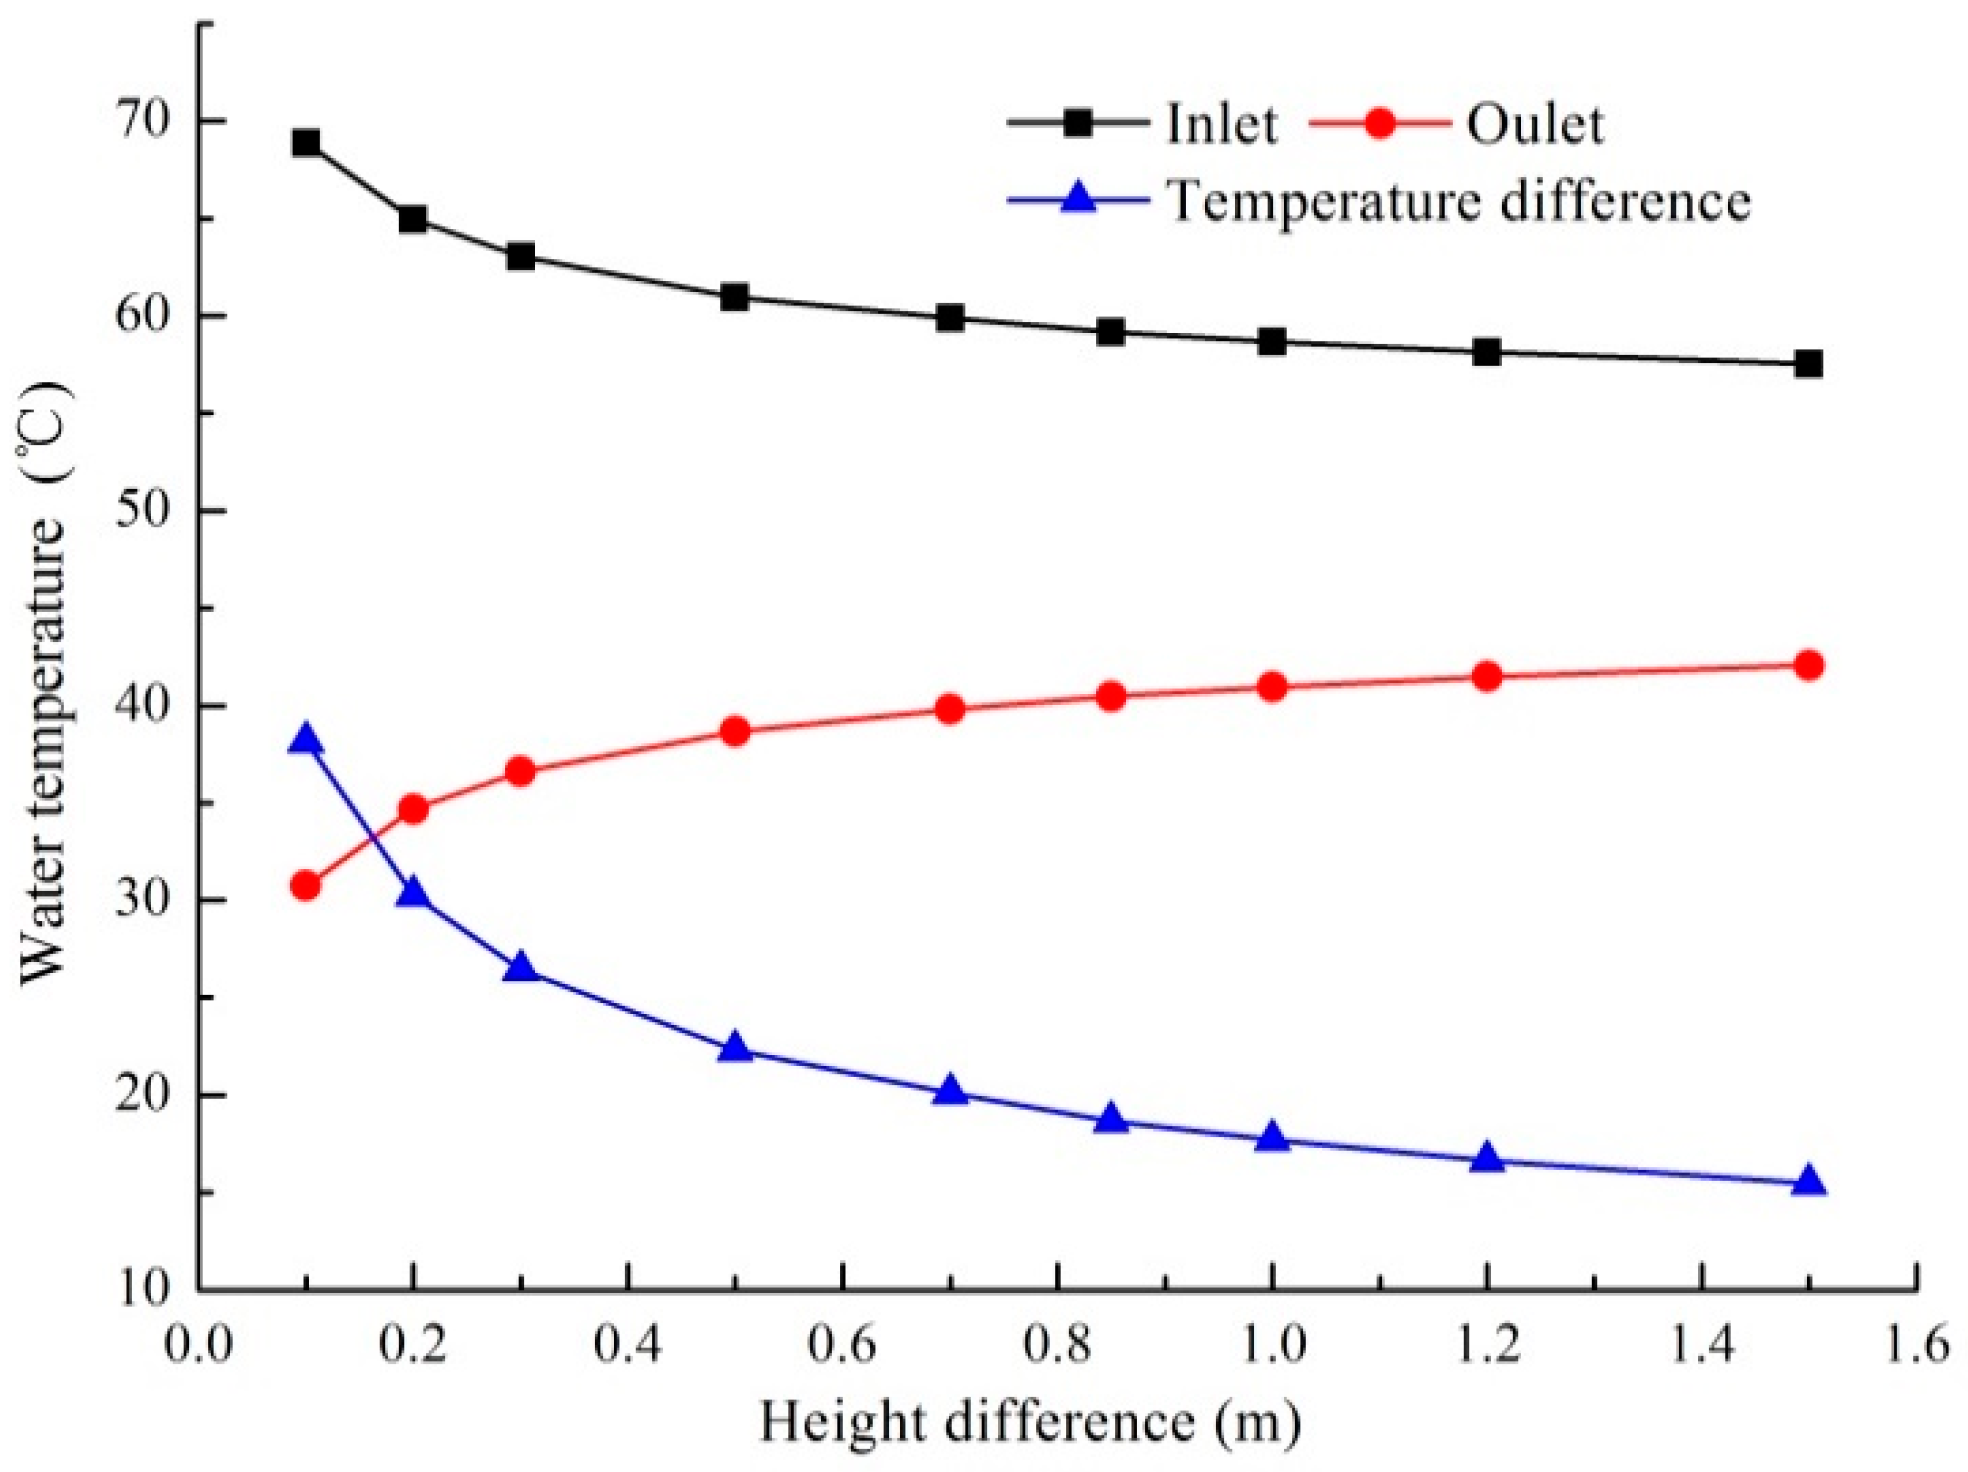
The simulation was performed under the conditions of a 10 °C outdoor temperature, 20 °C indoor temperature, 10 °C initial water temperature, 7 °C initial temperature of collector, and the solar radiation was set to 620 W/m2. Under different height differences between the radiation plate center and the collector center, the inlet and outlet water temperatures of the radiation plate, their temperature difference, the heat delivered indoors, and the solar heat efficiency of this system can be obtained, as presented in Figure 12 and Figure 13, respectively.
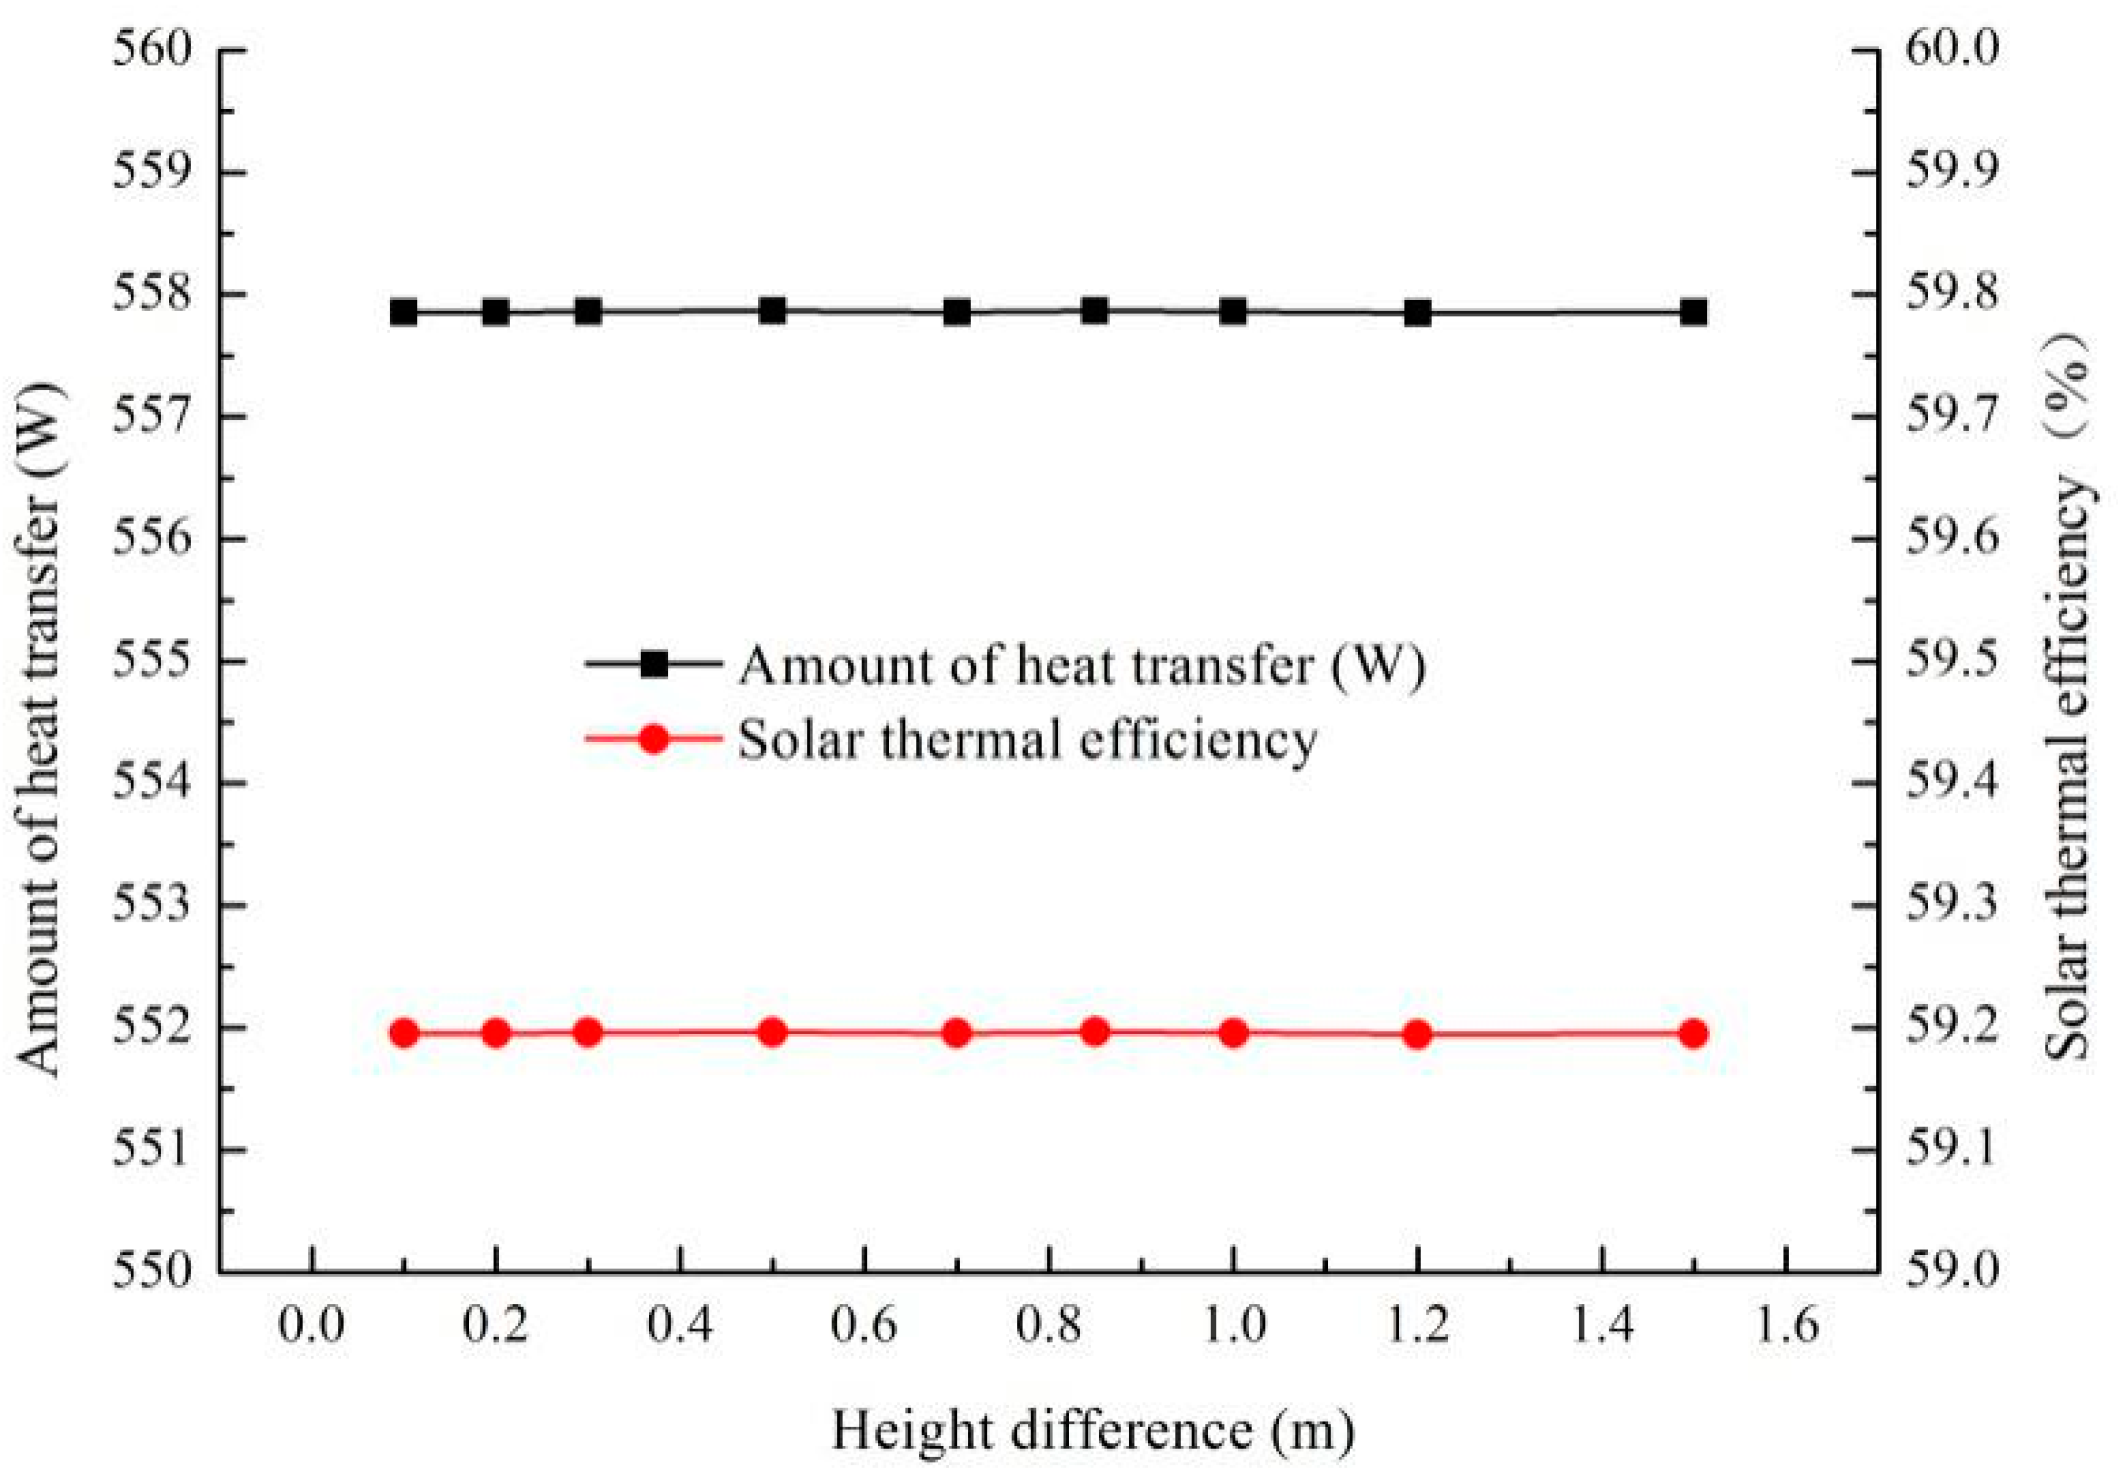
Figure 12 and Figure 13 illustrate that the inlet water temperature and temperature difference declined as the height difference between the cold and hot cores increased, whereas the outlet water temperature increased. The variation speed of the water temperature at the outlet and the inlet and their temperature difference reduced as the core’s height difference increased. However, the heat transfer via the façade to the indoor environment and the solar heat efficiency of this system basically did not change with the height difference. When height difference raised from 0.1 m to 1.5 m, the inlet water temperature declined from 68.9 °C to 57.5 °C, the outlet water temperature raised from 30.7 °C to 42 °C, while the corresponding temperature difference decreased from 38.2 °C to 15.5 °C. The total heat transfer and solar heat efficiency were basically unchanged, which were 559 W and 59%, respectively. This is because the change in the height difference between the cold and hot cores will affect the driving force of the circulation system. The greater the height difference, the faster the circulation speed, the shorter the heating time the hot water passing through the solar collector and the heat release time of hot water passing through the radiation plate, resulting in lowering the radiation plate’s inlet water temperature, and increasing the outlet water temperature.
In addition, the simulation was to calculate the heat transfer amount and water temperature when the system reached heat balance, and the cycle time to reach balance was not considered. Therefore, although the cores height difference affects the cycle time, under constant and stable solar irradiance (the thermal supply is unchanged), the height difference between the hot and cold cores has almost no effect on the final heat transferred into indoor and solar heat efficiency. Under actual climate conditions, the solar irradiance changes at any time, and the cold and hot cores’ height difference may affect the indoor heating effect.

5.3. Effect of the Pipeline Impedance of the System

The pipeline impedance includes the effects of resistance along pipeline and the local resistance and changes in pipe diameter (Equation (27)). Under the conditions that 10 °C outdoor temperature, 20 °C indoor temperature, 10 °C initial water temperature, 7 °C initial temperature of collector, and the solar radiation was set to 620 W/m2, the outlet and inlet water temperatures of the radiation plate, their temperature difference, the heat delivered into the indoor environment, and the solar heat efficiency of this system under different pipeline impedance could be acquired, as shown in Figure 14 and Figure 15, respectively.
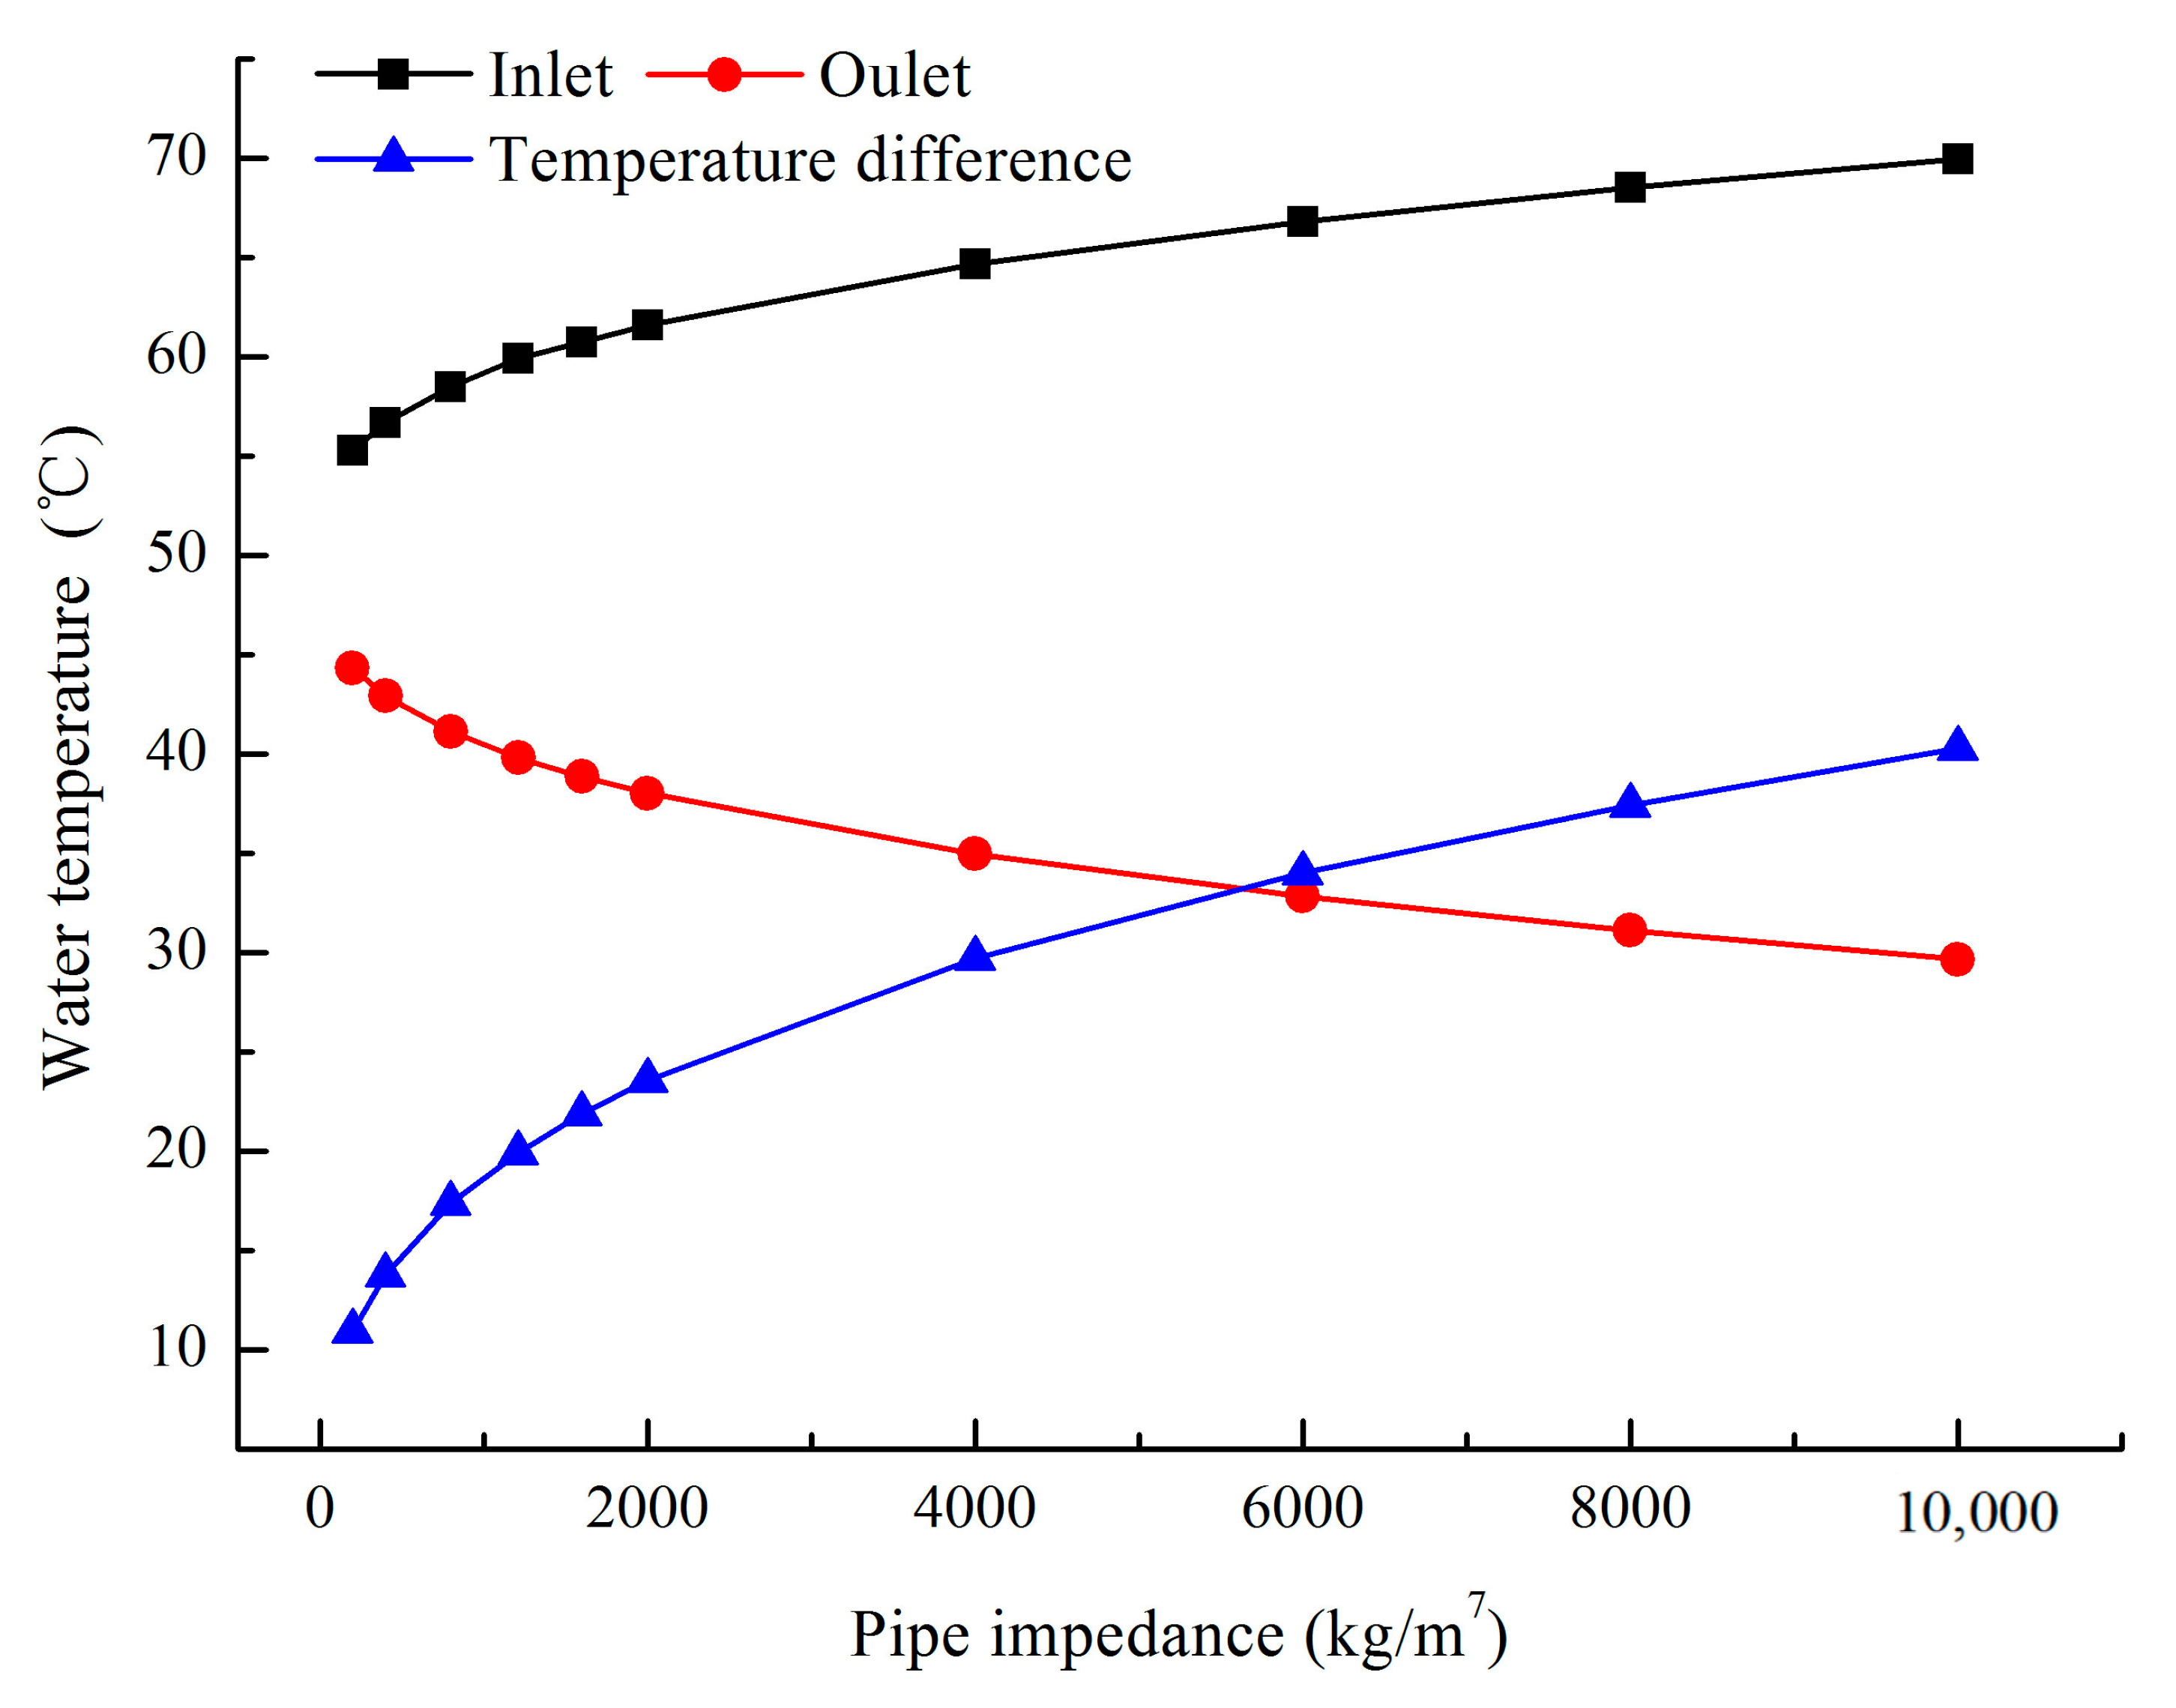
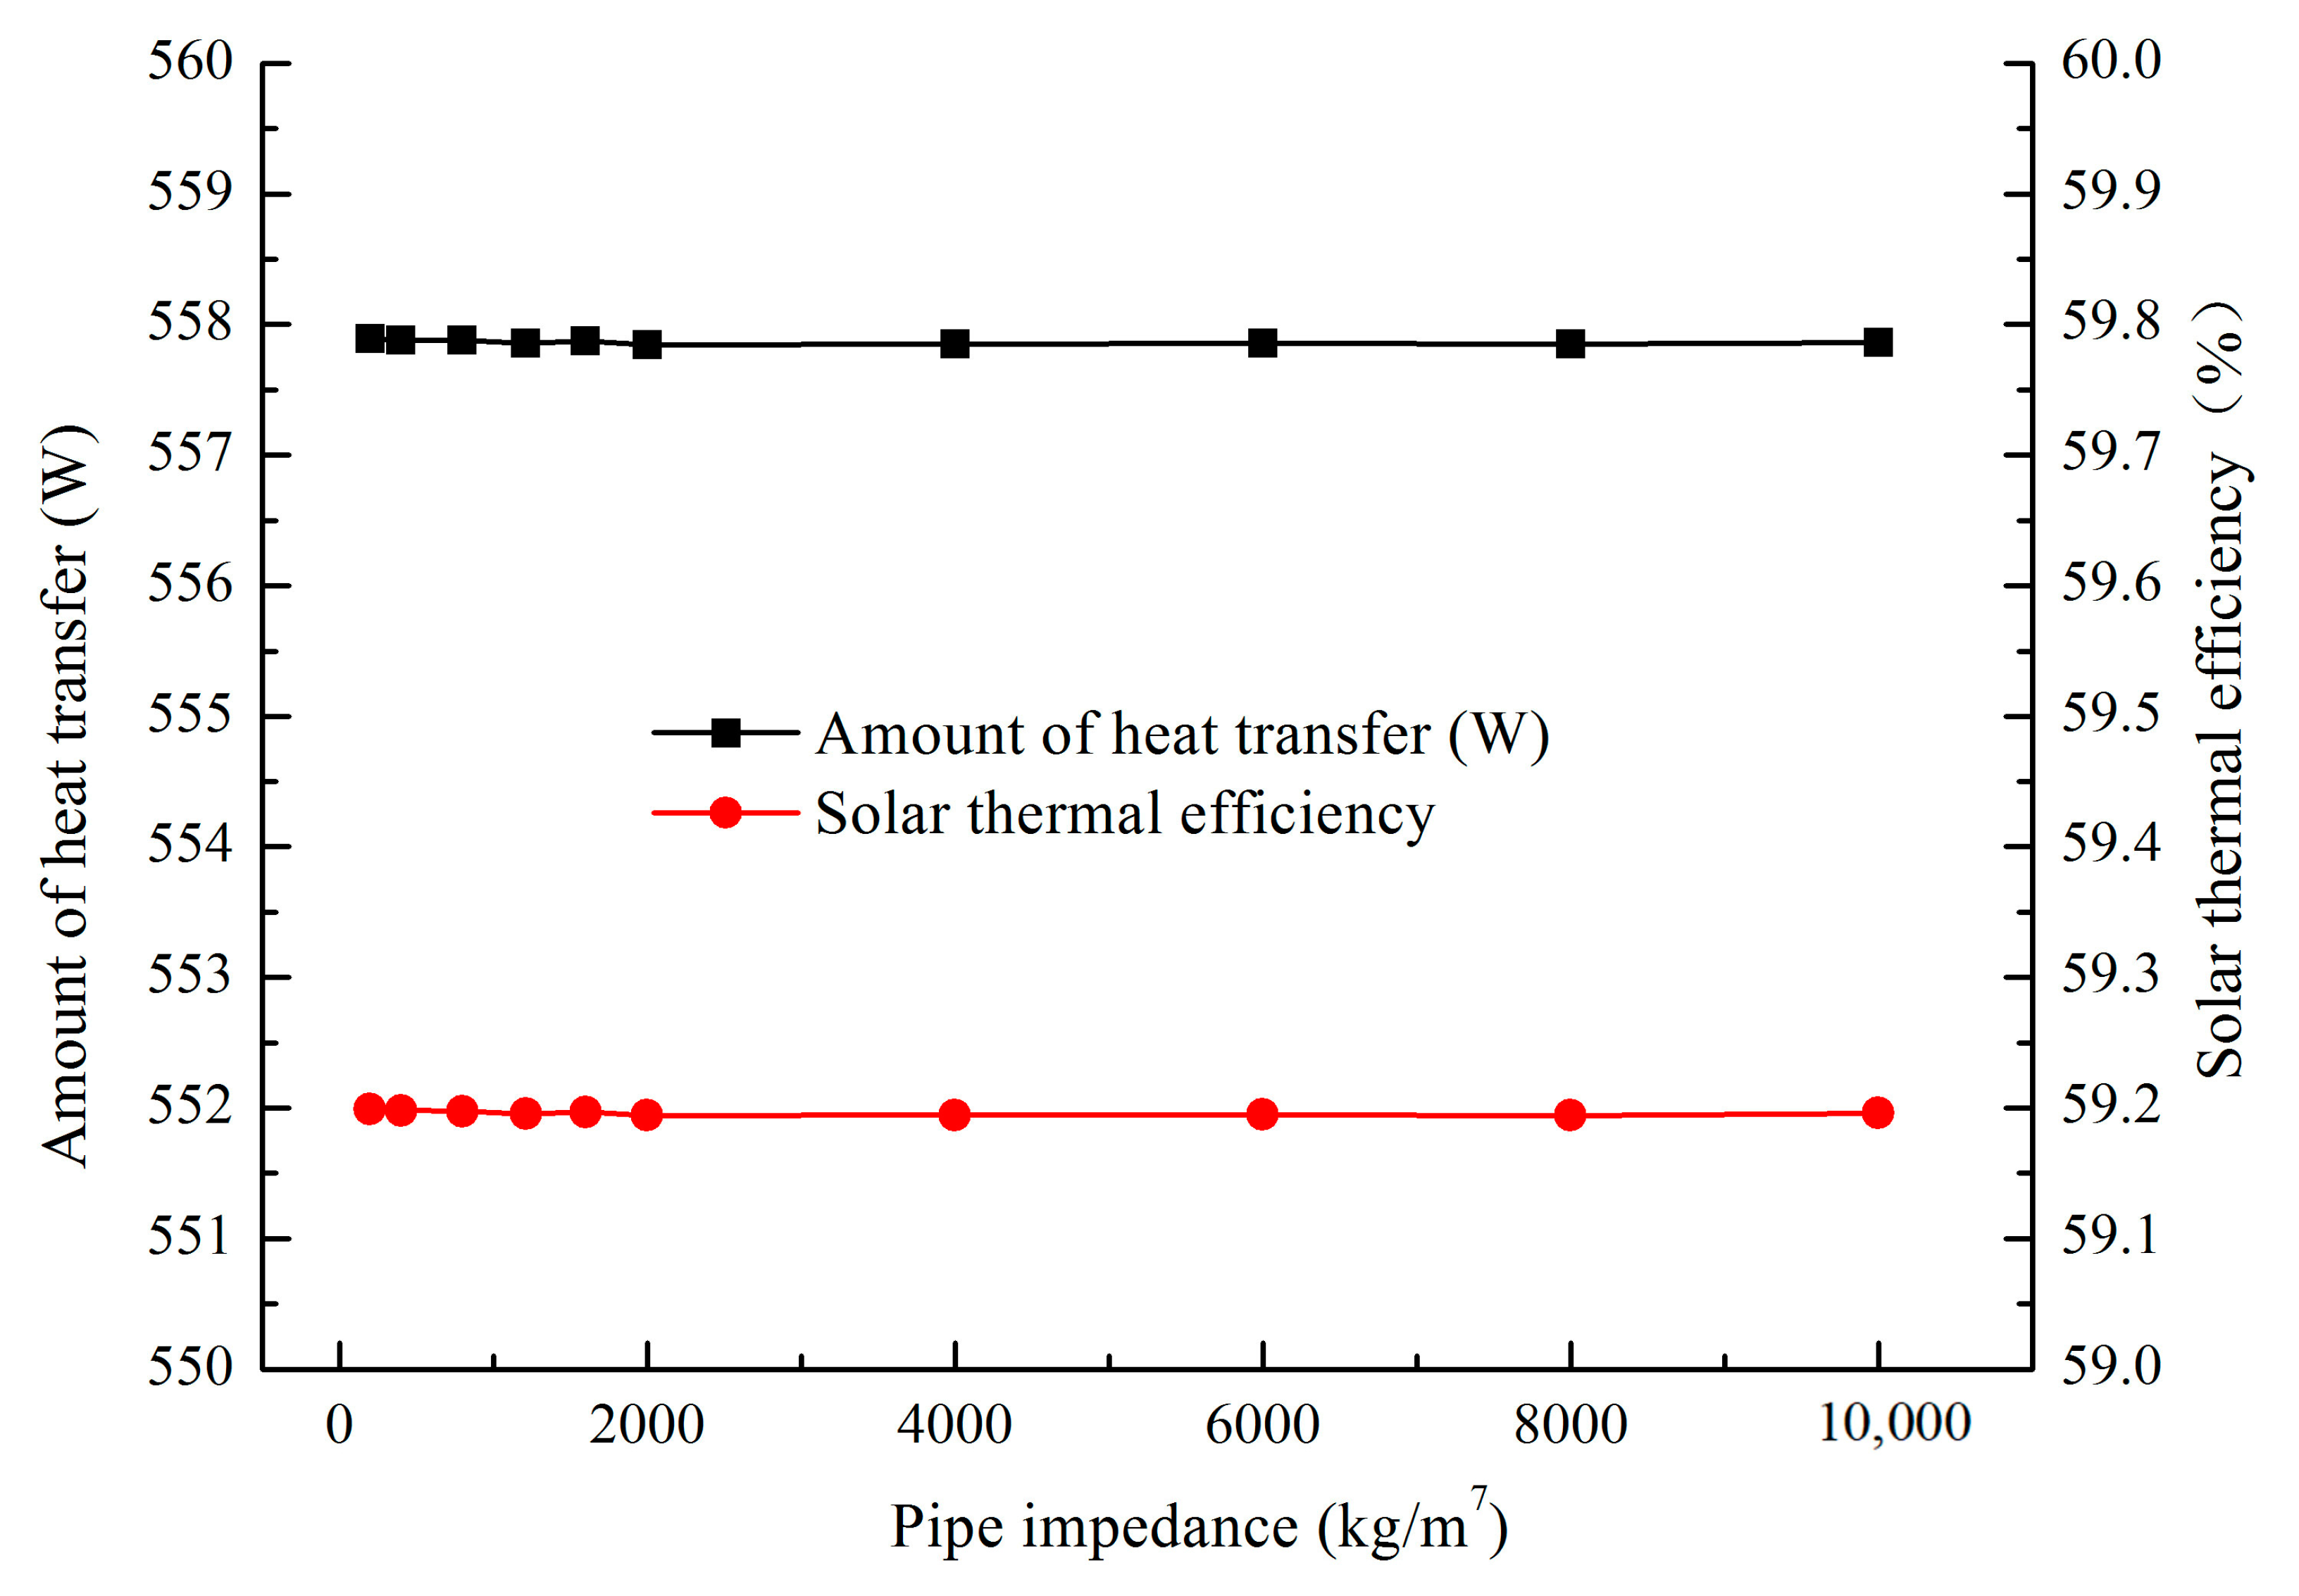
Figure 14 and Figure 15 indicate that both the indoor radiation plate’s inlet water temperature and the corresponding temperature difference increased with the increase of pipeline impedance, while the outlet water temperature declined. The reason is that when other parameters were unchanged, the pipeline impedance increased and the total resistance of natural circulation of the hot water increased. While under the constant driving pressure in the natural circulation system, the water flow of natural circulation would be reduced, and the system would reduce the total operation resistance of the hot water to adapt to the driving pressure of natural circulation. The smaller the water flow, the higher the collector’s outlet water temperature could obtain, and the greater the water temperature difference could reach. It can also be obtained from the Figure 13 and Figure 14 that, when the pipeline impedance was small, the change of the pipeline impedance had a greater influence on radiation plate’s outlet and inlet water temperature and the solar heat efficiency. The simulation results show that when the pipeline impedance increased from 200 kg/m7 to 22,000 kg/m7, the inlet water temperature raised from 55.3 °C to 76 °C, the outlet water temperature decreased from 44.3 °C to 23.6 °C, and their corresponding temperature difference increased from 10.9 °C to 52.4 °C. Although the water temperature changed when the pipeline impedance changed, the heat transfer and solar heat efficiency in the system were basically unchanged, which were 558 W and 59%, respectively. When the pipeline impedance increases to make the collector outlet water temperature reach the boiling point, the operating parameters of the system will also change dramatically.
From the above analysis, it can be obtained that when the pipeline impedance changes within a certain range, the radiation plate’s outlet and inlet water temperature can be changed, but the thermal supply and solar heat efficiency are unchanged. Therefore, the pipeline impedance can be adjusted by setting a valve on the pipeline to reach the required outlet and inlet water temperature of the radiation plate. In addition, the simulation results were obtained under the constant heat gain of the collector. In actual adjustment, the increase of the pipe impedance not only increases the radiation plate’s inlet water temperature, but also increases the solar collector’s water outlet temperature, and the collector’s heat loss will also increase. At this time, the thermal supply and solar heat efficiency of the thermal radiation plate will decrease.

6. Conclusions

In this paper, a building façade combined with photothermal technology was proposed, which was arranged with a thermal radiation plate and a solar collector connected by a pipeline with a control valve. Under cold climate, experiments and simulation studies performed with MATLAB were conducted to evaluate the passive heating performance of the façade. Based on the above results, the following conclusions are drawn:
The numerical model was solved by MATLAB, and the experimental measured values of water temperatures agreed well with the simulated values. The maximum error of the inlet and outlet water temperature of radiation plate between simulation and experiments was within ±2 °C, while the maximum relative error was 2.93%. The numerical simulation method adopted in this study can deal well with the problem of the change of the natural circulation flow rate with solar radiation.
With the help of the natural circulation driving force caused by the density difference of the working fluid in the circulation system when heated by solar energy, the wall could obtain good solar energy utilization efficiency. Both solar heat efficiency and heat transfer amount increased as solar irradiance or outdoor air temperature increased. Under 1100 W/m2 solar irradiance, the heat gain obtained by the collector was 1672 W, the heat transfer was 1184 W, and the thermal efficiency was up to 71%. Within the range of changes in outdoor meteorological parameters, the change of solar irradiance has a more significant impact on solar heat efficiency and the heat transfer amount.
The impedance of the pipeline and the height difference between the radiant plate center and solar collector center were influential factors that impacted the water supply temperature of the system. Within a certain range, increasing the height difference between the radiation plate center and solar collector center or reducing the pipeline impedance could decrease the radiation plate’s inlet temperature, increase the outlet temperature, and reduce the water temperature difference between the outlet and inlet. However, the height difference between the collector center and radiation plate center, as well as the change of pipeline impedance, had little influence on the thermal supply and solar heat efficiency of the system.

Author Contributions

Conceptualization: X.S.; methodology: X.S.; software: X.S. and Y.A; validation: X.S. and J.L.; writing—original draft preparation: X.S. and J.L.; writing—review and editing: N.L. and Y.A; supervision: N.L. All authors have read and agreed to the published version of the manuscript.

Funding

This research received no external funding.

Conflicts of Interest

The authors declare no conflict of interest.

Nomenclature

A Area, m2
c Heat capacity, J/(kg·K)
d Circulation tube diameter, m
FRadiation angle coefficient
f Friction factor
Mass flow rate, kg/s
gGravitational acceleration, m2/s
h Heat transfer coefficient, W/(m2·K)
ISolar radiation illumination, W/m2
k Thermal conductivity, W/(m·K)
L The length of collector plate, m
M Mass, kg
N The number of glass cover
Nu Nusselt number
PPressure, Pa
Q Heat flux, W
R Thermal resistance, (m2·K)/W
Ra Rayleigh number
SPipe impedance, kg/m7
TTemperature, °C
Time, s
ULHeat loss coefficient, W/(m2·K)
vVelocity, m/s

Greek Letters

τ Glass cover transmittance
α Absorptivity
σStefan Boltzmann constant, W/(m2·K4)
ε Emissivity
θ Incidence angle, °
γ kinematic viscosity of air, m2/s
β Volumetric expansion coefficient, 1/K
ΨThermal diffusivity of air, m2/s
δ Thickness, m
ρ Density, kg/m3
η Solar heat efficiency of the circulation system

Subscripts

a Air, ambient
pSolar collector plate
wWater
gGlass cover
r Radiation
i Inlet, inside
oOutlet
tThermal radiation plate
jNon-heated surface

References

  1. Tian, Z.; Zhang, X.; Jin, X.; Zhou, X.; Si, B.; Shi, X. Towards adoption of building energy simulation and optimization for passive building design: A survey and a review. Energy Build. 2018, 158, 1306–1316. [Google Scholar] [CrossRef]
  2. Daigle, Q.; O’Brien, P.G. Heat Generated Using Luminescent Solar Concentrators for Building Energy Applications. Energies 2020, 13, 5574. [Google Scholar] [CrossRef]
  3. Zarrella, A.; Zecchin, R.; Pasquier, P.; Guzzon, D.; Prataviera, E.; Vivian, J.; De Carli, M.; Emmi, G. Analysis of Retrofit Solutions of a Ground Source Heat Pump System: An Italian Case Study. Energies 2020, 13, 5680. [Google Scholar] [CrossRef]
  4. Wang, D.; Hu, L.; Du, H.; Liu, Y.; Huang, J.; Xu, Y.; Liu, J. Classification, experimental assessment, modeling methods and evaluation metrics of Trombe walls. Renew. Sustain. Energy Rev. 2020, 124, 178–191. [Google Scholar] [CrossRef]
  5. Chang, C.; Zhu, N.; Yang, K.; Yang, F. Data and analytics for heating energy consumption of residential buildings: The case of a severe cold climate region of China. Energy Build. 2018, 172, 104–115. [Google Scholar] [CrossRef]
  6. Liu, Z.; Zhou, Q.; Tian, Z.; He, B.-J.; Jin, G. A comprehensive analysis on definitions, development, and policies of nearly zero energy buildings in China. Renew. Sustain. Energy Rev. 2019, 114, 109314. [Google Scholar] [CrossRef]
  7. Omrany, H.; GhaffarianHoseini, A.; GhaffarianHoseini, A.; Raahemifar, K.; Tookey, J. Application of passive wall systems for improving the energy efficiency in buildings: A comprehensive review. Renew. Sustain. Energy Rev. 2016, 62, 1252–1269. [Google Scholar] [CrossRef]
  8. Ali, I.; Shafiullah, G.; Urmee, T. A preliminary feasibility of roof-mounted solar PV systems in the Maldives. Renew. Sustain. Energy Rev. 2018, 83, 18–32. [Google Scholar] [CrossRef]
  9. Brito, M.; Freitas, S.; Guimarães, S.; Catita, C.; Redweik, P. The importance of facades for the solar PV potential of a Mediterranean city using LiDAR data. Renew. Energy 2017, 111, 85–94. [Google Scholar] [CrossRef]
  10. Liang, R.; Wang, P.; Zhou, C.; Pan, Q.; Riaz, A.; Zhang, J. Thermal performance study of an active solar building façade with specific PV/T hybrid modules. Energy 2020, 191, 116532. [Google Scholar] [CrossRef]
  11. Yu, B.; Liu, X.; Li, N.; Liu, S.; Ji, J. The performance analysis of a purified PV/T-Trombe wall based on thermal catalytic oxidation process in winter. Energy Convers. Manag. 2020, 203, 112262. [Google Scholar] [CrossRef]
  12. Hu, Z.; He, W.; Ji, J.; Hu, D.; Lv, S.; Chen, H.; Shen, Z. Comparative study on the annual performance of three types of building integrated photovoltaic (BIPV) Trombe wall system. Appl. Energy 2017, 194, 81–93. [Google Scholar] [CrossRef]
  13. Briga-Sá, A.; Boaventura-Cunha, J.; Lanzinha, J.C.G.; Paiva, A. An experimental analysis of the Trombe wall temperature fluctuations for high range climate conditions: Influence of ventilation openings and shading devices. Energy Build. 2017, 138, 546–558. [Google Scholar] [CrossRef] [Green Version]
  14. Hu, Z.; He, W.; Hong, X.; Ji, J.; Shen, Z. Numerical analysis on the cooling performance of a ventilated Trombe wall combined with venetian blinds in an office building. Energy Build. 2016, 126, 14–27. [Google Scholar] [CrossRef]
  15. Abbassi, F.; Dehmani, L. Experimental and numerical study on thermal performance of an unvented Trombe wall associated with internal thermal fins. Energy Build. 2015, 105, 119–128. [Google Scholar] [CrossRef]
  16. Chen, W.; Liu, W. Numerical analysis of heat transfer in a passive solar composite wall with porous absorber. Appl. Therm. Eng. 2008, 28, 1251–1258. [Google Scholar] [CrossRef]
  17. Chen, W.; Liu, W. Numerical analysis of heat transfer in a composite wall solar-collector system with a porous absorber. Appl. Energy 2004, 78, 137–149. [Google Scholar] [CrossRef]
  18. Zhu, N.; Li, S.; Hu, P.; Lei, F.; Deng, R. Numerical investigations on performance of phase change material Trombe wall in building. Energy 2019, 187, 116057. [Google Scholar] [CrossRef]
  19. Leang, E.; Tittelein, P.; Zalewski, L.; Lassue, S. Design Optimization of a Composite Solar Wall Integrating a PCM in a Individual House: Heating Demand and Thermal Comfort Considerations. Energies 2020, 13, 5640. [Google Scholar] [CrossRef]
  20. Pasquay, T. Natural ventilation in high-rise buildings with double facades, saving or waste of energy. Energy Build. 2004, 36, 381–389. [Google Scholar] [CrossRef]
  21. Chan, A.; Chow, T.; Fong, K.; Lin, Z. Investigation on energy performance of double skin façade in Hong Kong. Energy Build. 2009, 41, 1135–1142. [Google Scholar] [CrossRef]
  22. Su, Z.; Li, X.; Xue, F. Double-skin façade optimization design for different climate zones in China. Sol. Energy 2017, 155, 281–290. [Google Scholar] [CrossRef]
  23. Lee, K.O.; Medina, M.A.; Raith, E.; Sun, X. Assessing the integration of a thin phase change material (PCM) layer in a residential building wall for heat transfer reduction and management. Appl. Energy 2015, 137, 699–706. [Google Scholar] [CrossRef]
  24. Radhi, H. Viability of autoclaved aerated concrete walls for the residential sector in the United Arab Emirates. Energy Build. 2011, 43, 2086–2092. [Google Scholar] [CrossRef]
  25. Shen, C.; Li, X. Energy saving potential of pipe-embedded building envelope utilizing low-temperature hot water in the heating season. Energy Build. 2017, 138, 318–331. [Google Scholar] [CrossRef]
  26. Ibrahim, M.; Wurtz, E.; Biwole, P.H.; Achard, P. Transferring the south solar energy to the north facade through embedded water pipes. Energy 2014, 78, 834–845. [Google Scholar] [CrossRef]
  27. Zhang, Z.; Sun, Z.; Duan, C. A new type of passive solar energy utilization technology—The wall implanted with heat pipes. Energy Build. 2014, 84, 111–116. [Google Scholar] [CrossRef]
  28. Sakhaei, S.A.; Valipour, M.S. Performance enhancement analysis of The flat plate collectors: A comprehensive review. Renew. Sustain. Energy Rev. 2019, 102, 186–204. [Google Scholar] [CrossRef]
  29. Shi, Q.; Lv, J.; Guo, C.; Zheng, B. Experimental and simulation analysis of a PV/T system under the pattern of natural circulation. Appl. Therm. Eng. 2017, 121, 828–837. [Google Scholar] [CrossRef]
  30. Kalogirou, S. Solar Energy Engineering: Processes and Systems; Elsevier/Academic Press: Amsterdam, The Netherlands, 2009. [Google Scholar]
  31. Klein, S. Calculation of flat-plate collector loss coefficients. Sol. Energy 1975, 17, 79–80. [Google Scholar] [CrossRef]
  32. ASHRAE. ASHRAE Handbook 2016, HVAC Systems and Equipment: American Society of Heating, Refrigerating, and Air-Conditioning Engineers; ASHRAE: Atlanta, GA, USA, 2016. [Google Scholar]
Figure 1. Photograph of the experimental room.
Energies 13 06288 g001
Figure 2. Schematic diagram of the façade structure.
Energies 13 06288 g002
Figure 3. Experiment results of natural circulation.
Energies 13 06288 g003
Figure 4. Physical model of the façade system.
Energies 13 06288 g004
Figure 5. Schematic diagram of the entire wall system heat transfer network.
Energies 13 06288 g005
Figure 6. Simulation flow chart.
Energies 13 06288 g006
Figure 7. Comparison of experimental and simulated water temperature at the radiation plate’s inlet and outlet under different climates and solar irradiance.
Energies 13 06288 g007
Figure 8. Influence of solar irradiance variation on water temperatures at the outlet and inlet and their temperature difference.
Energies 13 06288 g008
Figure 9. Influence of solar irradiance variation on the heat transfer amount and solar heat efficiency.
Energies 13 06288 g009
Figure 10. Influence of outdoor ambient air temperature on water temperature at the outlet and inlet and their temperature difference.
Energies 13 06288 g010
Figure 11. Influence of outdoor ambient air temperature on the heat transfer amount and solar heat efficiency.
Energies 13 06288 g011
Figure 12. Influence of the height difference on water temperature at the outlet and inlet and their temperature difference.
Energies 13 06288 g012
Figure 13. Influence of the height difference on the heat transfer amount and solar heat efficiency.
Energies 13 06288 g013
Figure 14. Influence of the pipeline impedance on hot water temperatures at the outlet and inlet and their temperature difference.
Energies 13 06288 g014
Figure 15. Influence of the pipeline impedance on the heat transfer amount and solar heat efficiency.
Energies 13 06288 g015
Table 1. Dimensions and physical parameters of the wall system.
Material LayersThickness (mm)Length (mm)Height (mm)Density kg/m3Specific Heat Capacity J/(kg·K)Thermal Conductivity W/(m·K)
Glass cover52000200025008400.76
Air interlayer50200020001.2051005-
Solar collector2200020002719871202.4
Massive wall80200023005013800.037
Copper pipe8820008978381387.6
Thermal radiation plate2200015002719871202.4
Table 2. Test instrument, type, and parameter.
Test ParametersTest InstrumentTypeAccuracy
Solar radiation intensitySolar pyrometerTBQ-2≤0.2%
TemperatureThermocoupleNi-Cr and Ni-Si≤0.2%
Data acquisition unitXSR-70 A≤0.2%
Air velocityMulti-parameter ventilatorTSI-9555 A±0.015 m/s
Water flowWater meterLXS±2%
RotameterLZB-15±1.5%
Differential pressureU-tube liquid pressure gaugeBYY-100±2.5%
Table 3. Pipe impedance.
Water Flow (m3/s)Differential Pressure (Pa)Pipe Impedance (kg/m7)
3.5 × 10−31.2 × 10−2980.2
3.8 × 10−31.5 × 10−21038.8
4.3 × 10−32.2 × 10−21189.8
7.6 × 10−36.9 × 10−21211.2
9.9 × 10−313.3 × 10−21359.9
12.7 × 10−221.4 × 10−21486.1
Table 4. The experimental Ur of the variables.
VariableTvIQvΔPρGSη
Ur0.08%1.70%1.82%3.24%2.04%1.02%2.98%6.47%3.12%
Publisher’s Note: MDPI stays neutral with regard to jurisdictional claims in published maps and institutional affiliations.