Fuzzy Complex Proportional Assessment Applied in Location Selection for Installation of Photovoltaic Plants


Abstract
1. Introduction
Literature Review
- Tomosk et al. [4] demonstrated that only the use of geographical criteria for the location of photovoltaic plants is insufficient. The authors concluded that financial return rate maps differ substantially from solar irradiation maps in the United States. Thus, the prediction that climate is always directly related to the rate of return of a solar project is mistaken. The reason for that is because, in this case, the rate of economic return is directly related to the tax model and time of use;
- Vafaeipour et al. [5] stated, “that in contrast to common assumptions, the identification of suitable geographical locations for the implementation of large photovoltaic plants is not only related to the amount of solar radiation received, but there are also many other economic, environmental, social, and risk factors that must be taken into account”.
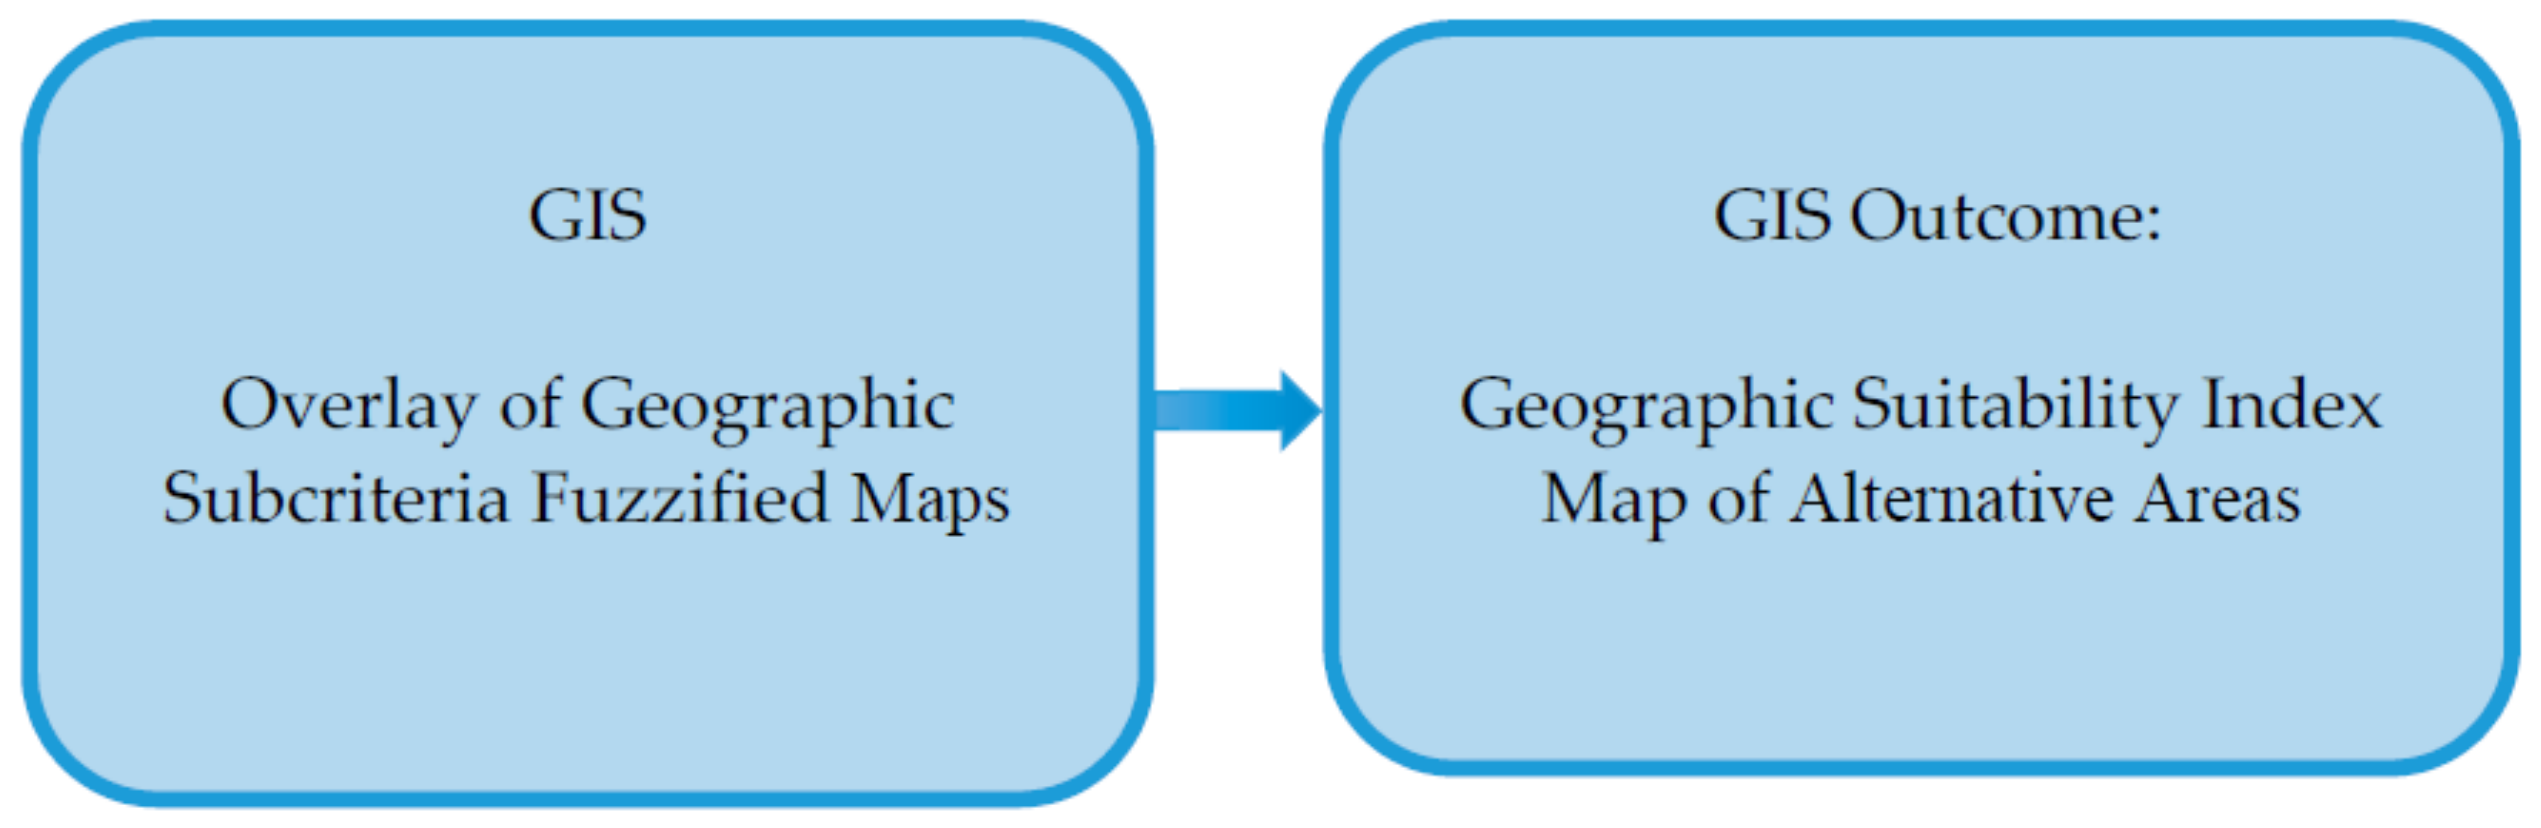
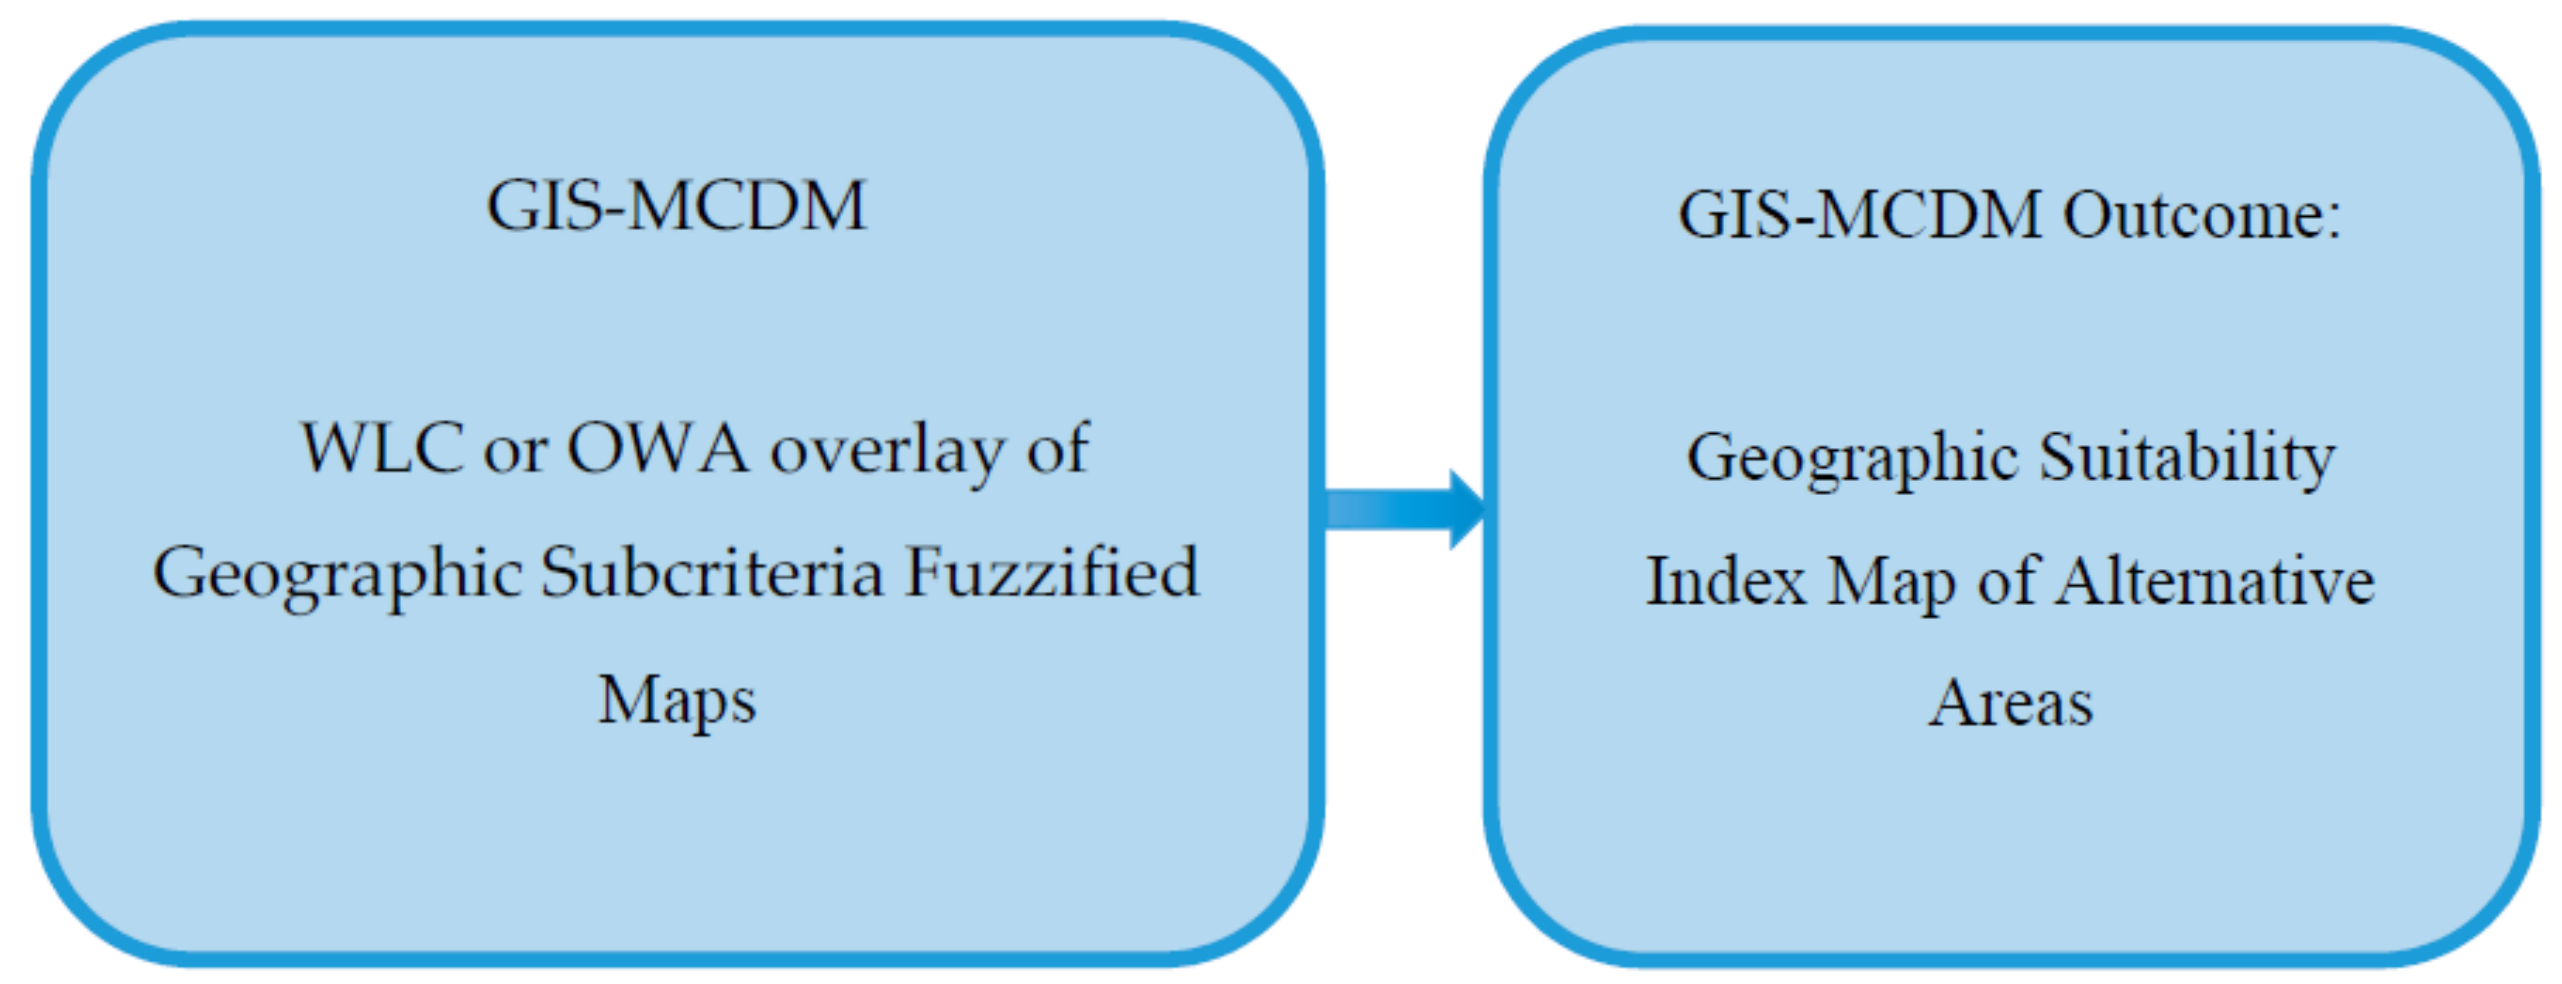
- The GIS and GIS-MCDM methods present strengths when selecting and classifying alternative areas from a geographic point of view, but they present weaknesses when technical-economic and socio-environmental characteristics are not considered;
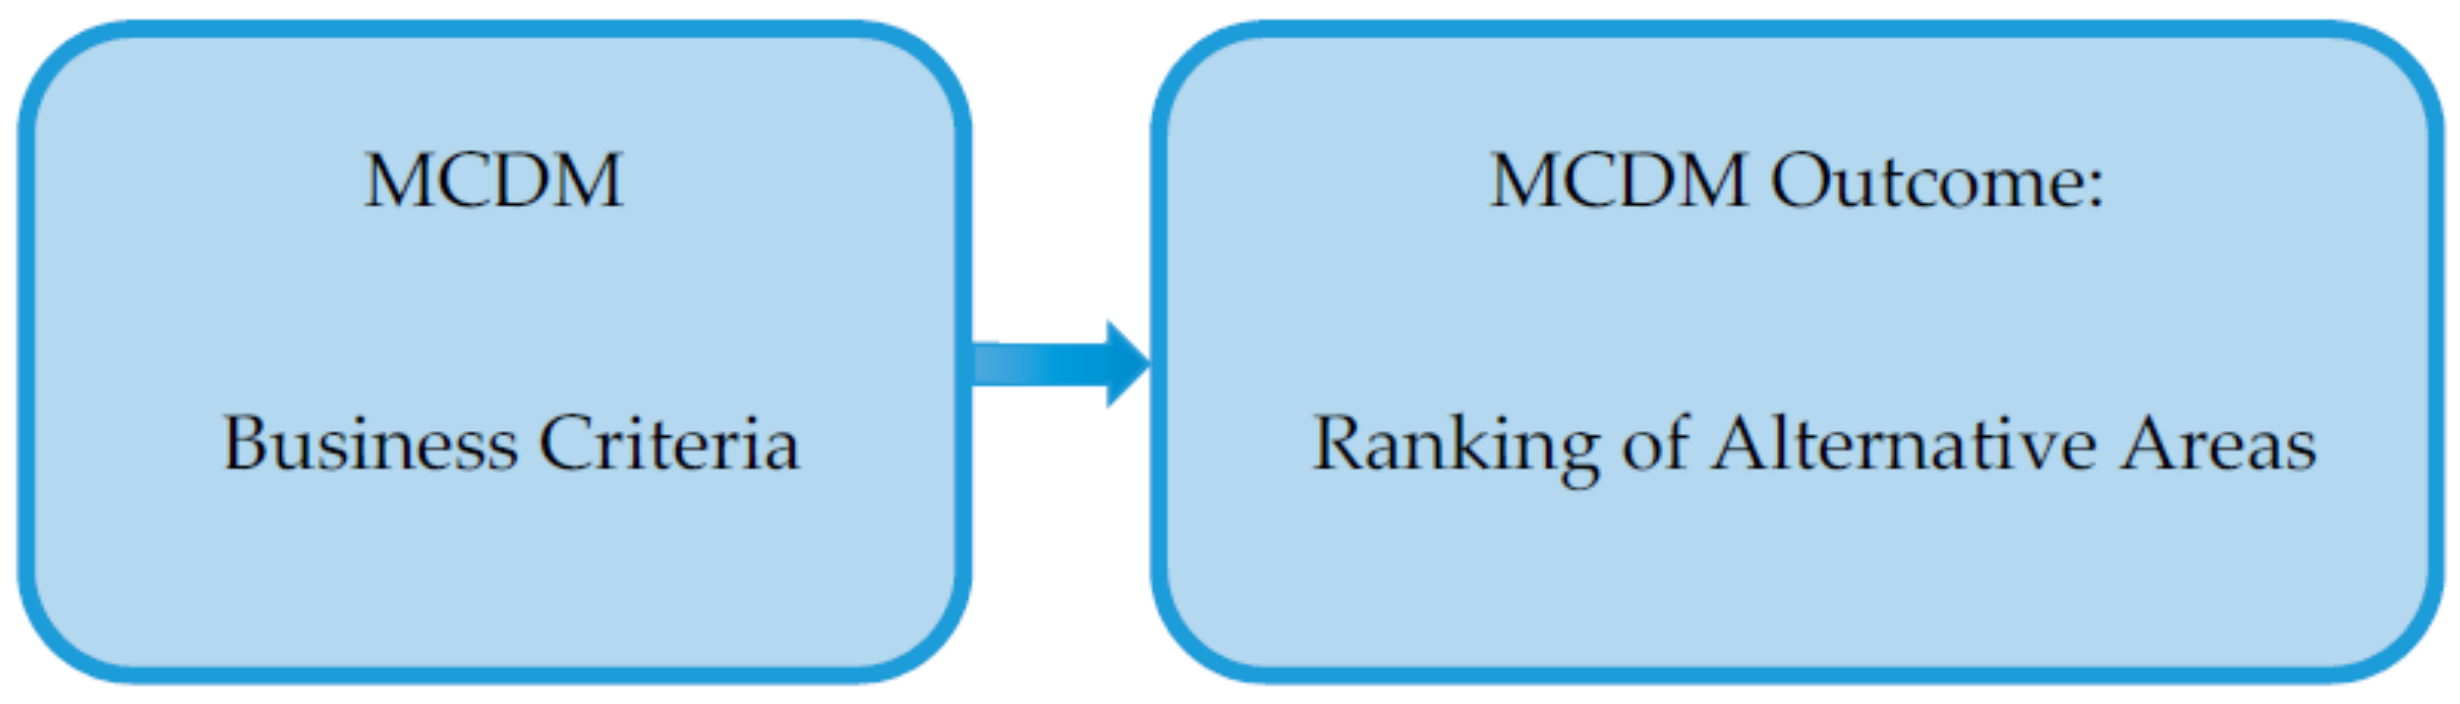
- The MCDM methods present strengths when selecting and classifying alternative areas from a business point of view, but they present weaknesses when climatic, geomorphological, location and land use characteristics are not considered.
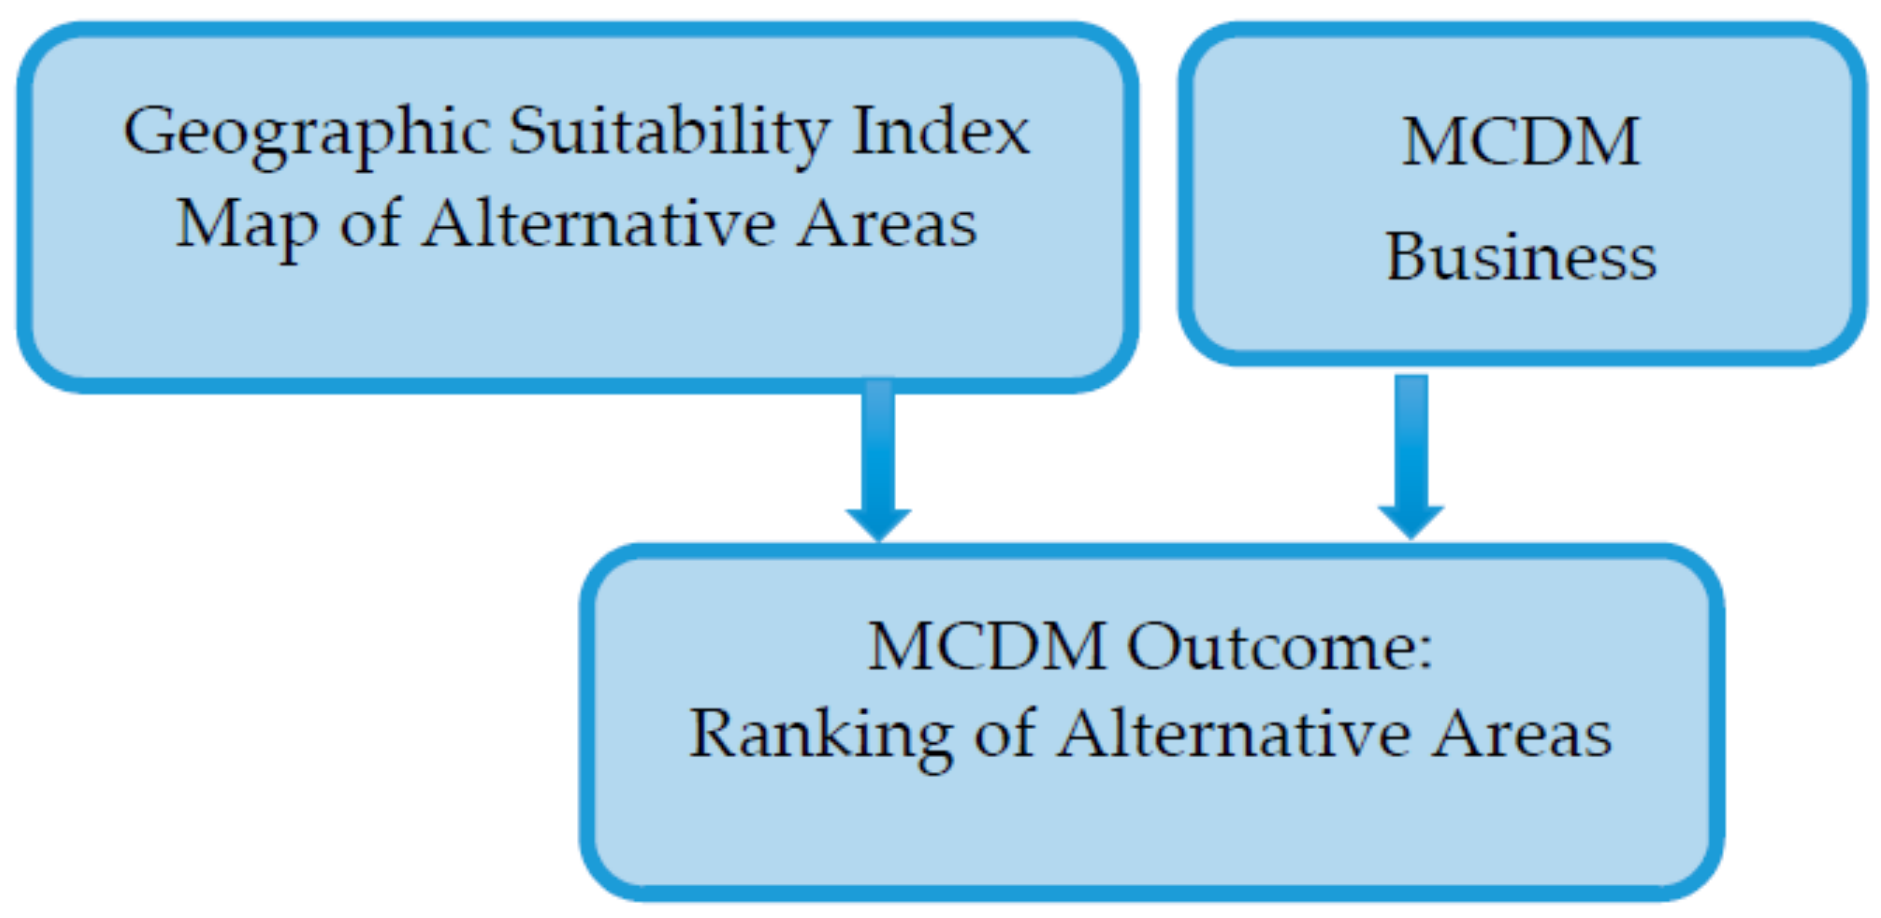
- Selection of alternative sites from a geographic suitability index map developed in current GIS-MCDM from geographic subcriteria;
- Application of the MCDM method based in business criteria to rank specific alternatives of sites for the installation of photovoltaic plants.
2. The Model
- The problem: consists in the selection and classification of alternatives of suitable areas for the installation of photovoltaic plants, localized in different regions of a large territory, presenting climatic, geomorphological, location, land use, economic, social, and environmental heterogeneities;
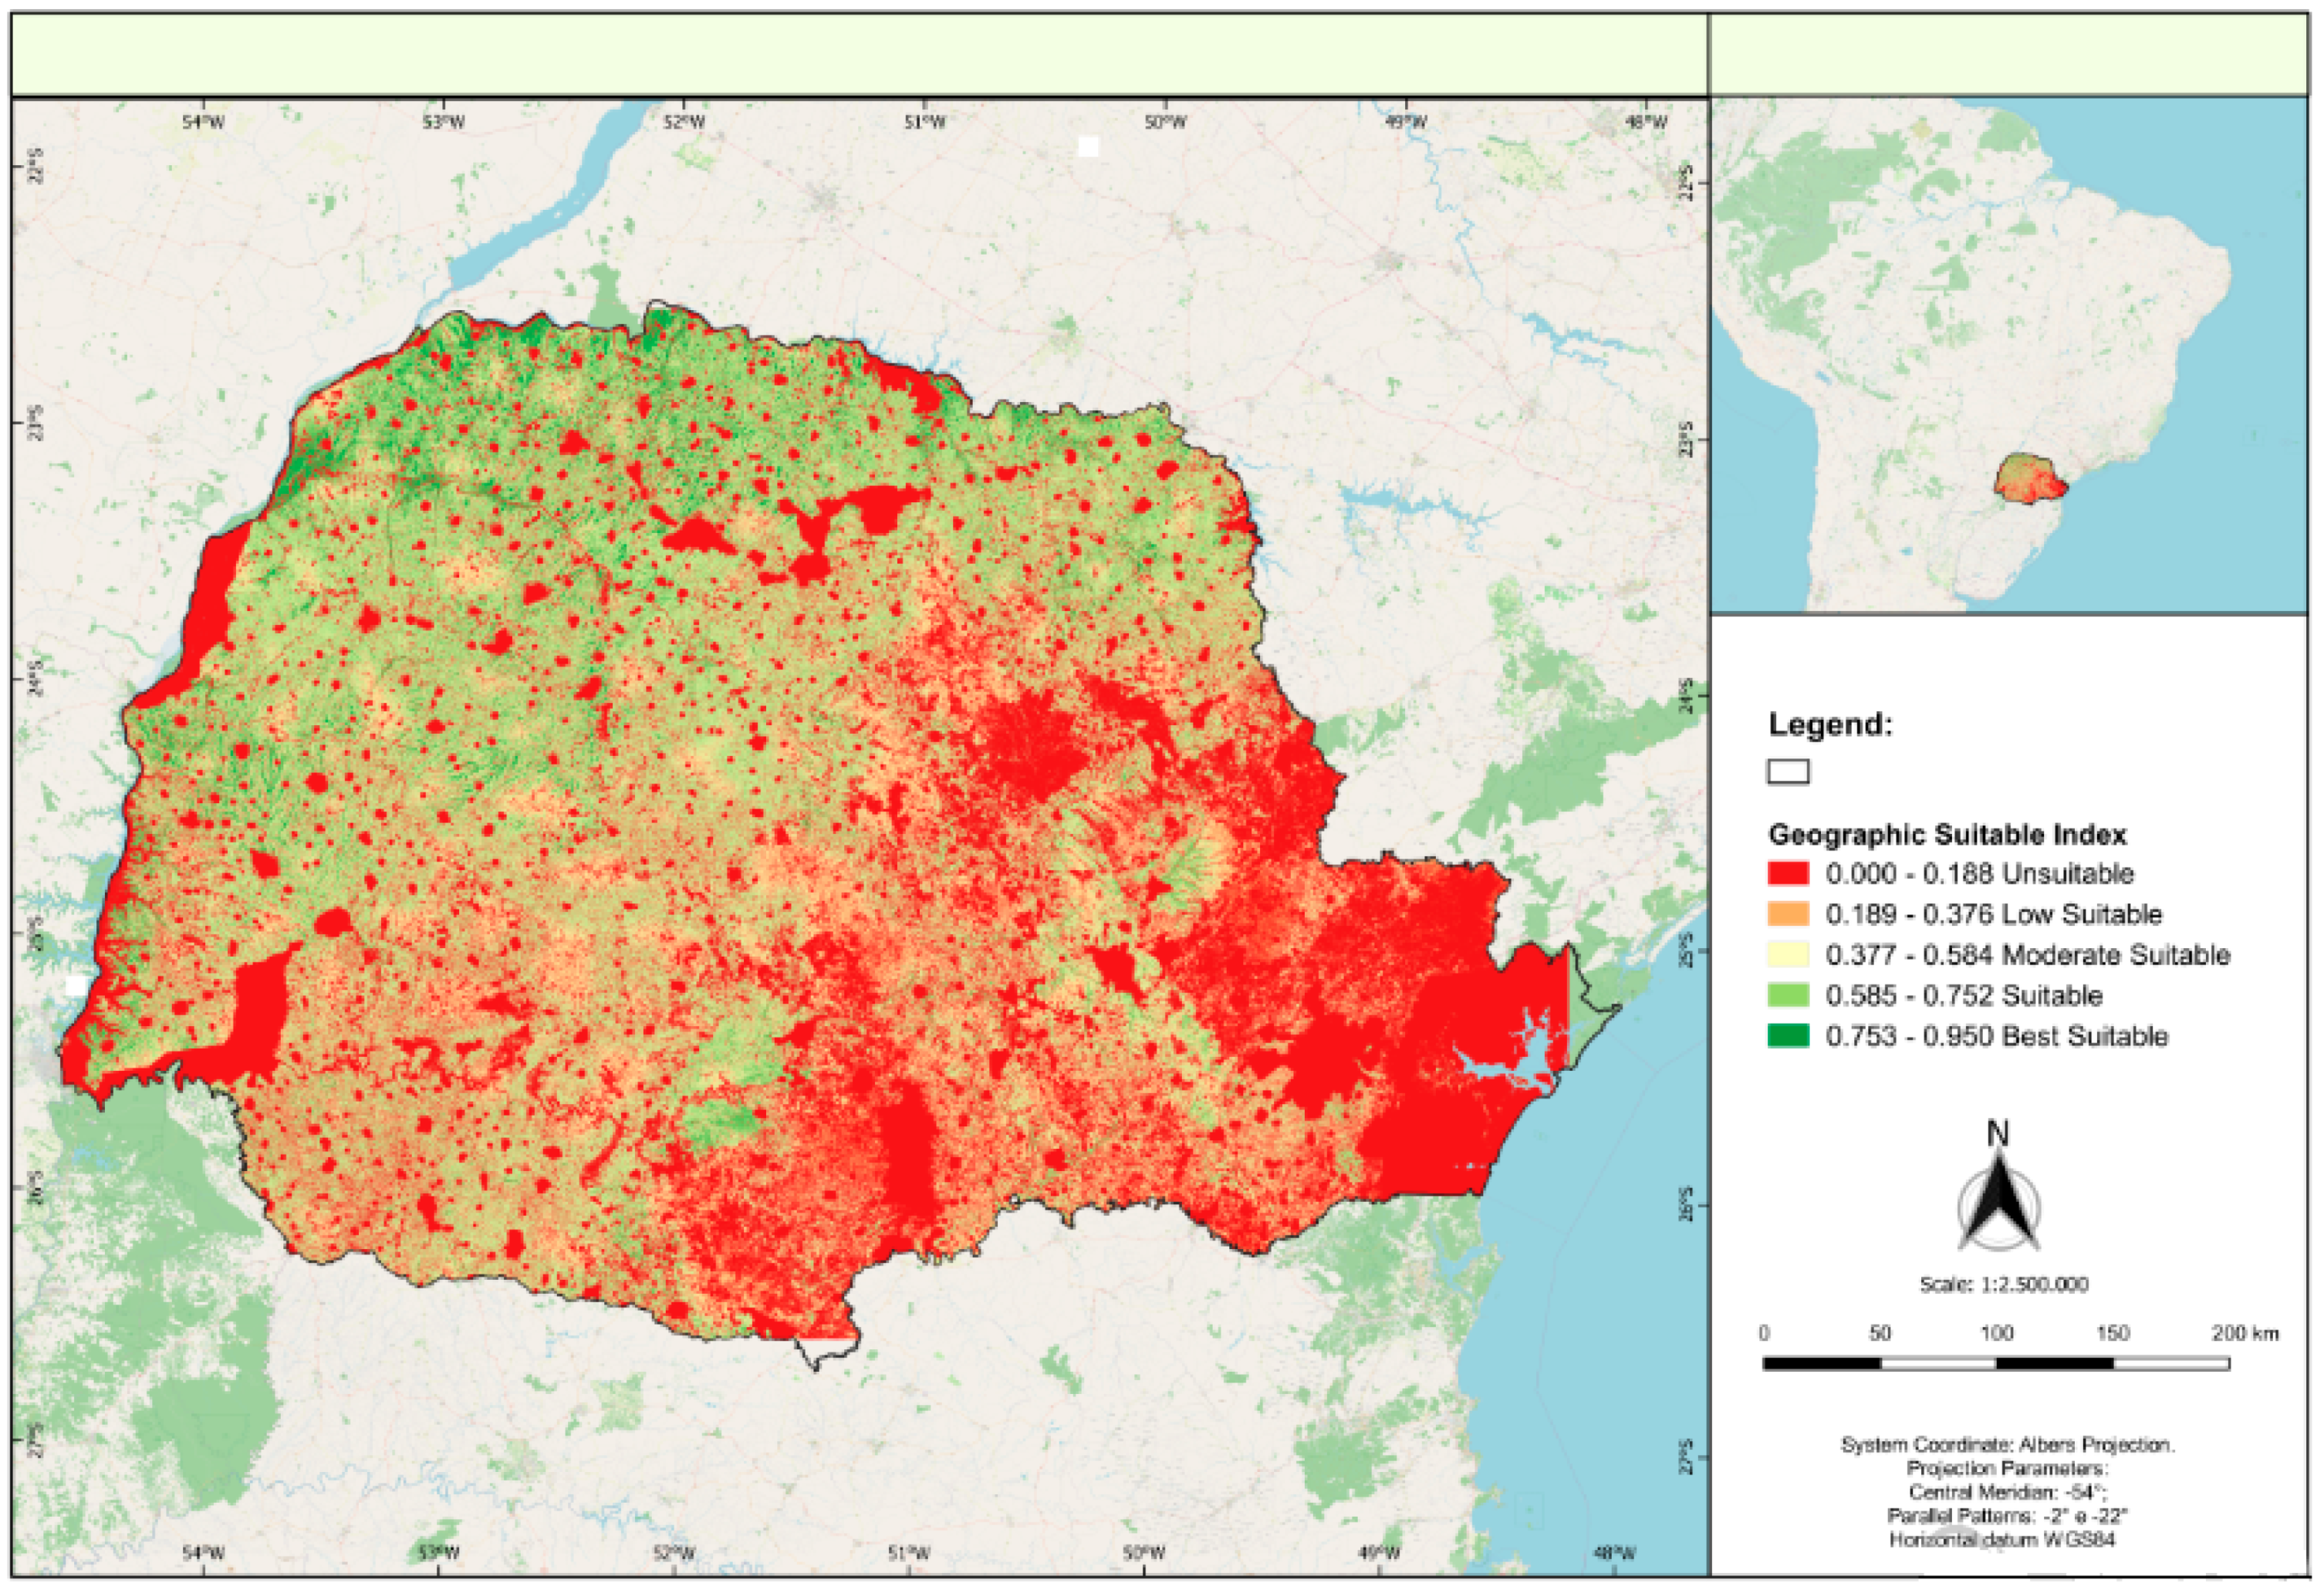
- The alternatives: are selected from the geographic suitability index map of the area under evaluation, obtained by overlaying fuzzified geographical subcriteria maps;
- The stakeholders: the choice of stakeholders must take into account the complexity of the decision-making process and must come from different groups of stakeholders with different scenarios of interests, such as public and private investors, different spheres of public administration, environmentalists, and communities;
- The business criteria and subcriteria: stakeholders are responsible for evaluating, based on the literature, which economic, technical and environmental criteria of the business with their respective subcriteria are in the interest of business, considering the availability of public or private databases, for research on the values of the business subcriteria;
- The MCDM method: the application of MCDM methods using business criteria is widely used in energy planning [22]. Among other advantages, it allows stakeholders to reach an agreement based on the evaluation of numerous conflicting criteria from multiple dimensions. In the decision-making process for locating decentralized energy projects, typical for several renewable energies, some factors significantly influence the choice of the multi-criteria method:
- ⮚
- The context of the decision-making process of companies investing in the energy sector, in which there are usually multiple decision makers or investors, thus hindering the reaching of a consensus and leading decision makers to act more individually due to economic issues;
- ⮚
- Uncertainty plays an important role in the project’s decision-making problems that involve incomplete and imperfect information of real-world situations [23];
- ⮚
- Conflicts among decision makers and investors regarding the real importance of interests from multiple dimensions, represented in practice by those criteria with accompanying business-related subcriteria;
- ⮚
- The uncertainties surrounding the real values of the multiple interest dimensions regarding alternative sites for photovoltaic plants.
3. Model Application-Location Selection for Photovoltaic Plant in Vast and Heterogeneous Regions
3.1. Identification of the Problem
3.2. Identification of Alternative Sites Based on a Geographic Suitability Index Map
3.3. Identification of Stakeholders
- Two male and two female engineers from the superintendence of energy distribution of an energy utility, with technical-economic and socio-environmental experience and a point of view aligned with government and investor interests alike;
- Four managerial engineers from three multinational companies that supply the energy sector, with technical-economic experience and a point of view aligned with the interests of private supplier industries;
- A state social worker with a point of view aligned with the government’s and society’s interests alike;
- A chemical industry director engineer with technical administrative experience with a point of view aligned with environmental interests.
3.4. Identification of Criteria and Subcriteria
- The economic subcriteria of net present cost and cost-benefit were eliminated because they need extensive and complex economic feasibility studies for each site alternative, in addition to the limited availability of national public data for smaller projects involving photovoltaic plants;
- The technical subcriterion of net generation efficiency was eliminated for presenting calculations with inaccurate future forecasts. The annual availability factor was replaced by the duration of interruption per consumer unit (DEC), for having values for each alternative site in a public database;
- Technical subcriteria for reliability, maturity and safety of solar technology were eliminated due to the subcriterion Duration of interruption per consumer unit (DEC) having already encompassed failures of this type of power generation;
- Political and legal risk subcriteria were eliminated because it is a region with the same political and legal risks.
3.5. Identification of the Multi-Criteria Decision-Making Method
3.6. Description of the Fuzzy Complex Proportional Assessment Method
- It allows benefit and cost criteria to be used in the decision matrix [38] and criteria values to be normalized so that different units of measure can be used and compared;
- It determines the best among a set of viable alternatives and the remaining alternatives as reasons for the best one, assuming direct and proportional dependence on the degrees of significance and utility of the alternatives in a criteria system [38];
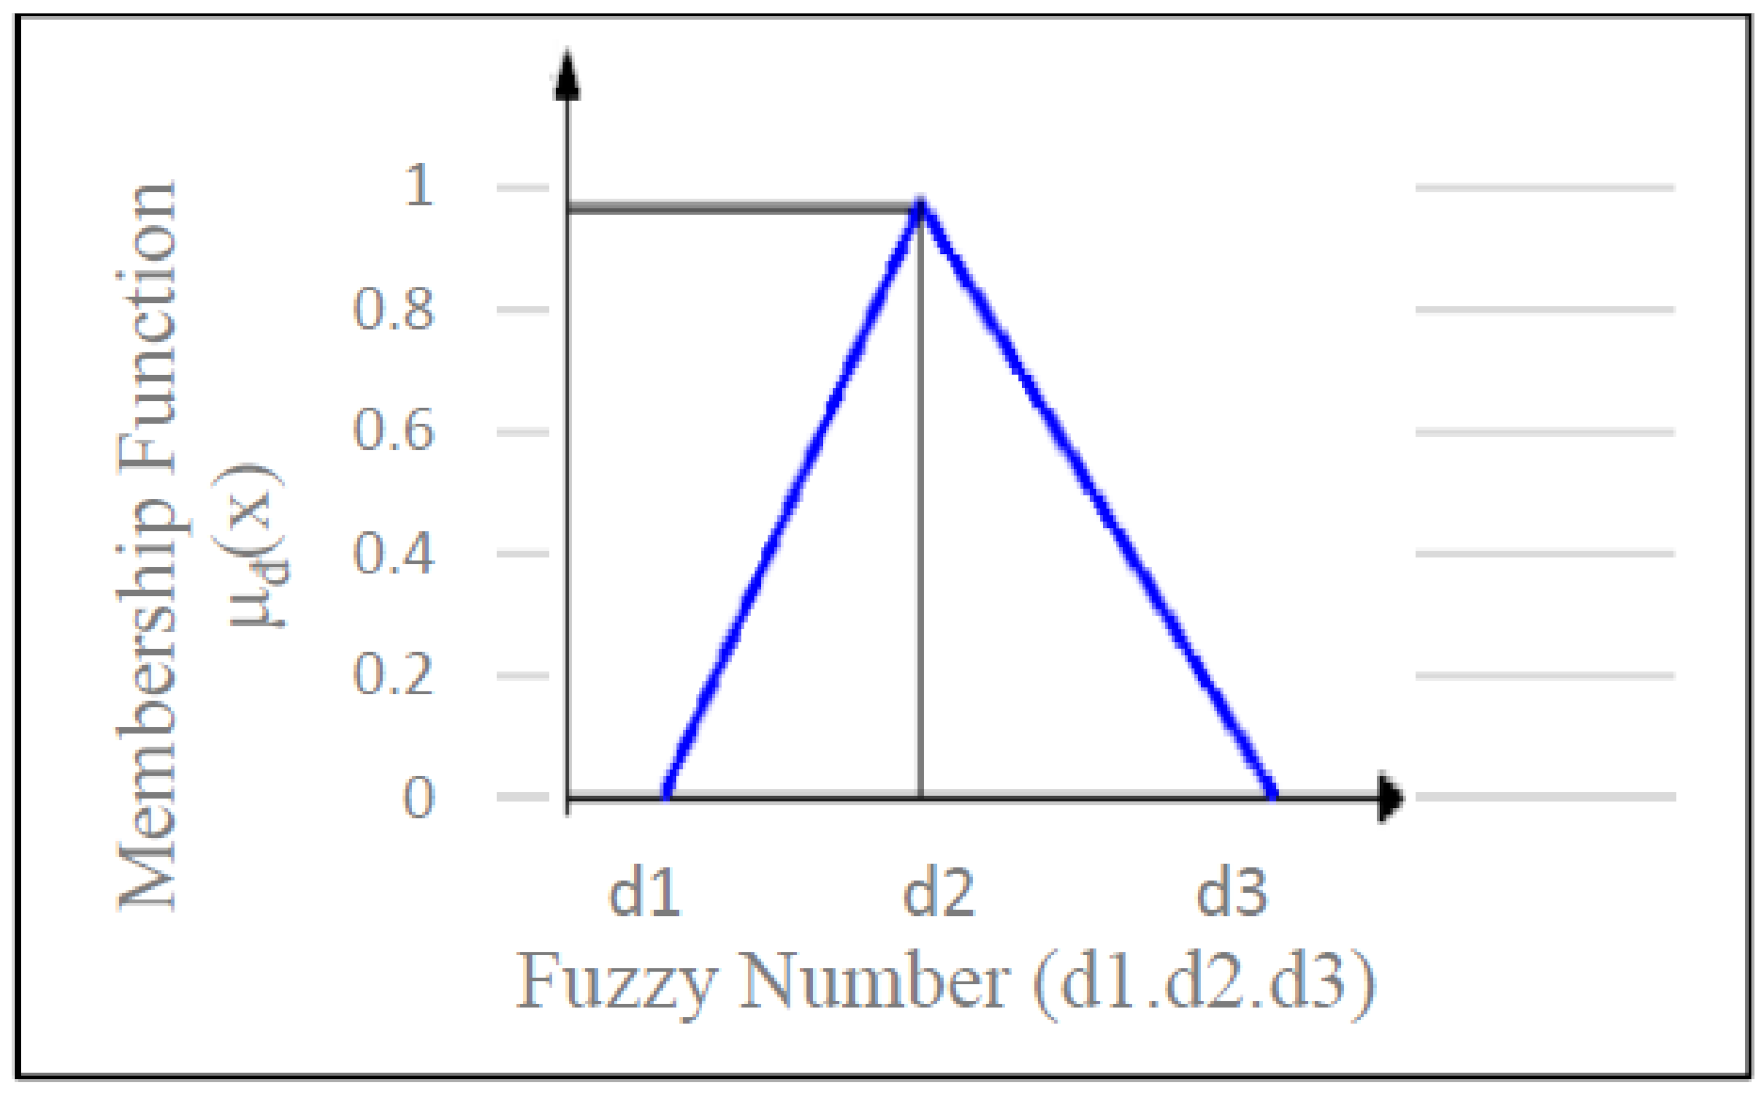
- It uses fuzzy logic that can model the existing uncertainty by applying a linguistic variable associated with fuzzy numbers, identifying the degree of relevance in a closed range from 0 to 1, which makes it a useful concept to deal with complex or not well-defined situations;
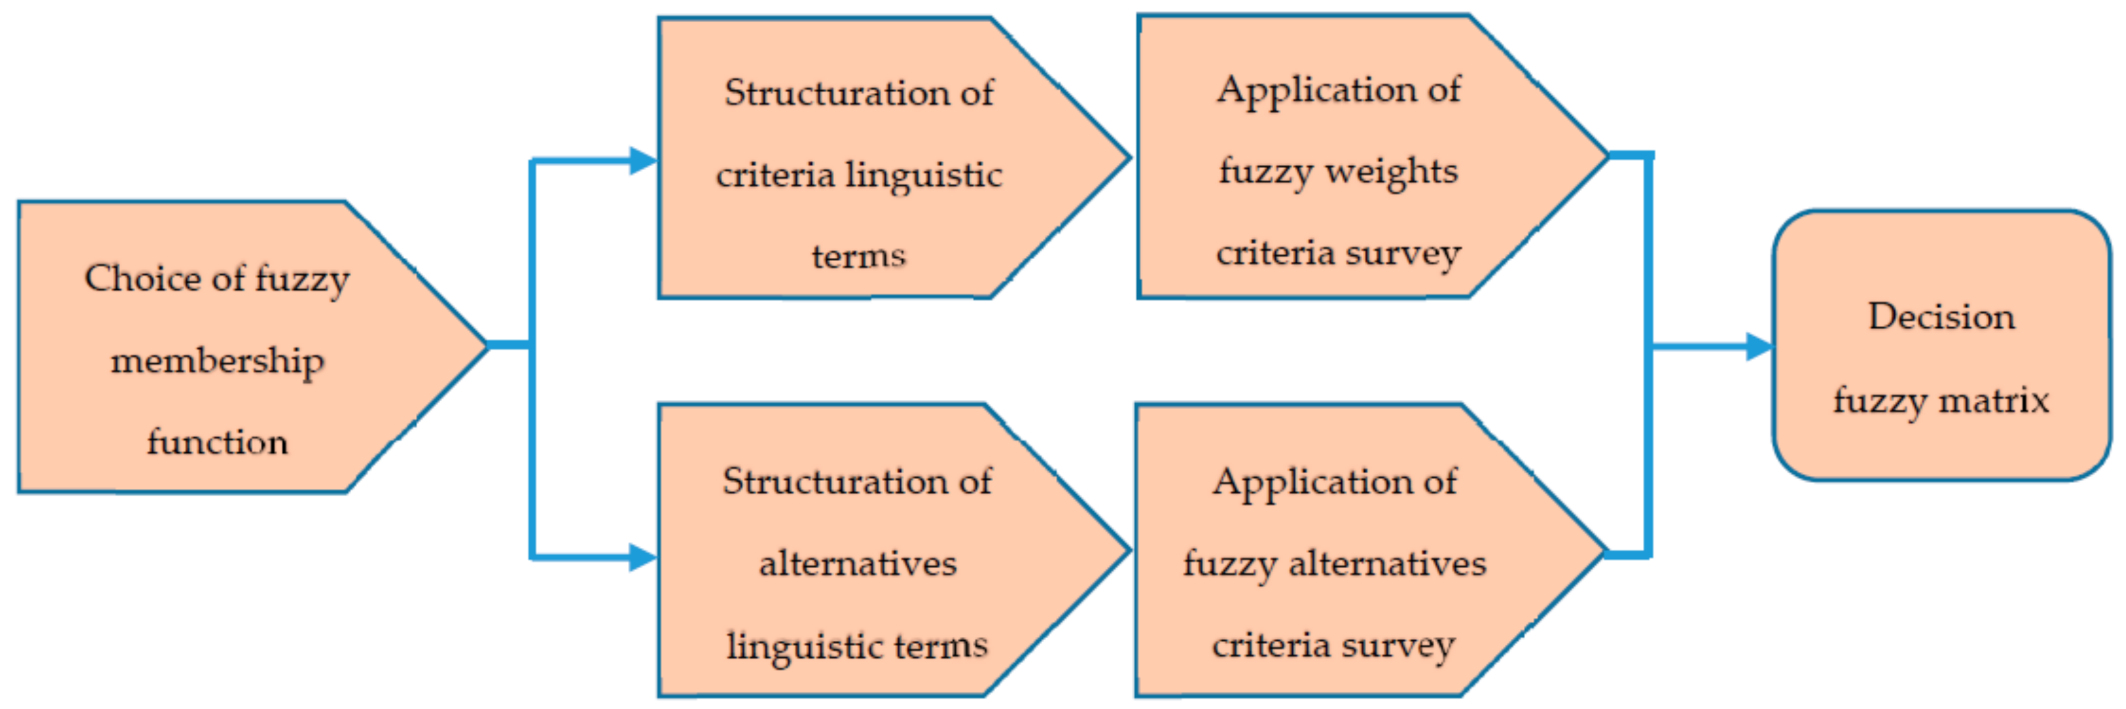
- Development of the fuzzy decision matrix: for each decision maker, a fuzzy number decision matrix will be obtained with m rows and n columns, considering that the number of criteria is n and the number of alternatives is m:
- DMk is the kth decision maker
- Am is the mth alternative
- Cn is the nth criterion
- Subsequently, applying the fuzzy weighted averaging (FWA) operator, the responses from decision makers are aggregated (Xu and Da, 2003), considering k the diffuse significance coefficient of the kth decision maker. If k is homogeneous, then k= (1/k, 1/k, 1/k). Therefore, the aggregated fuzzy decision matrix using Equation (2) will be represented as follows:where:
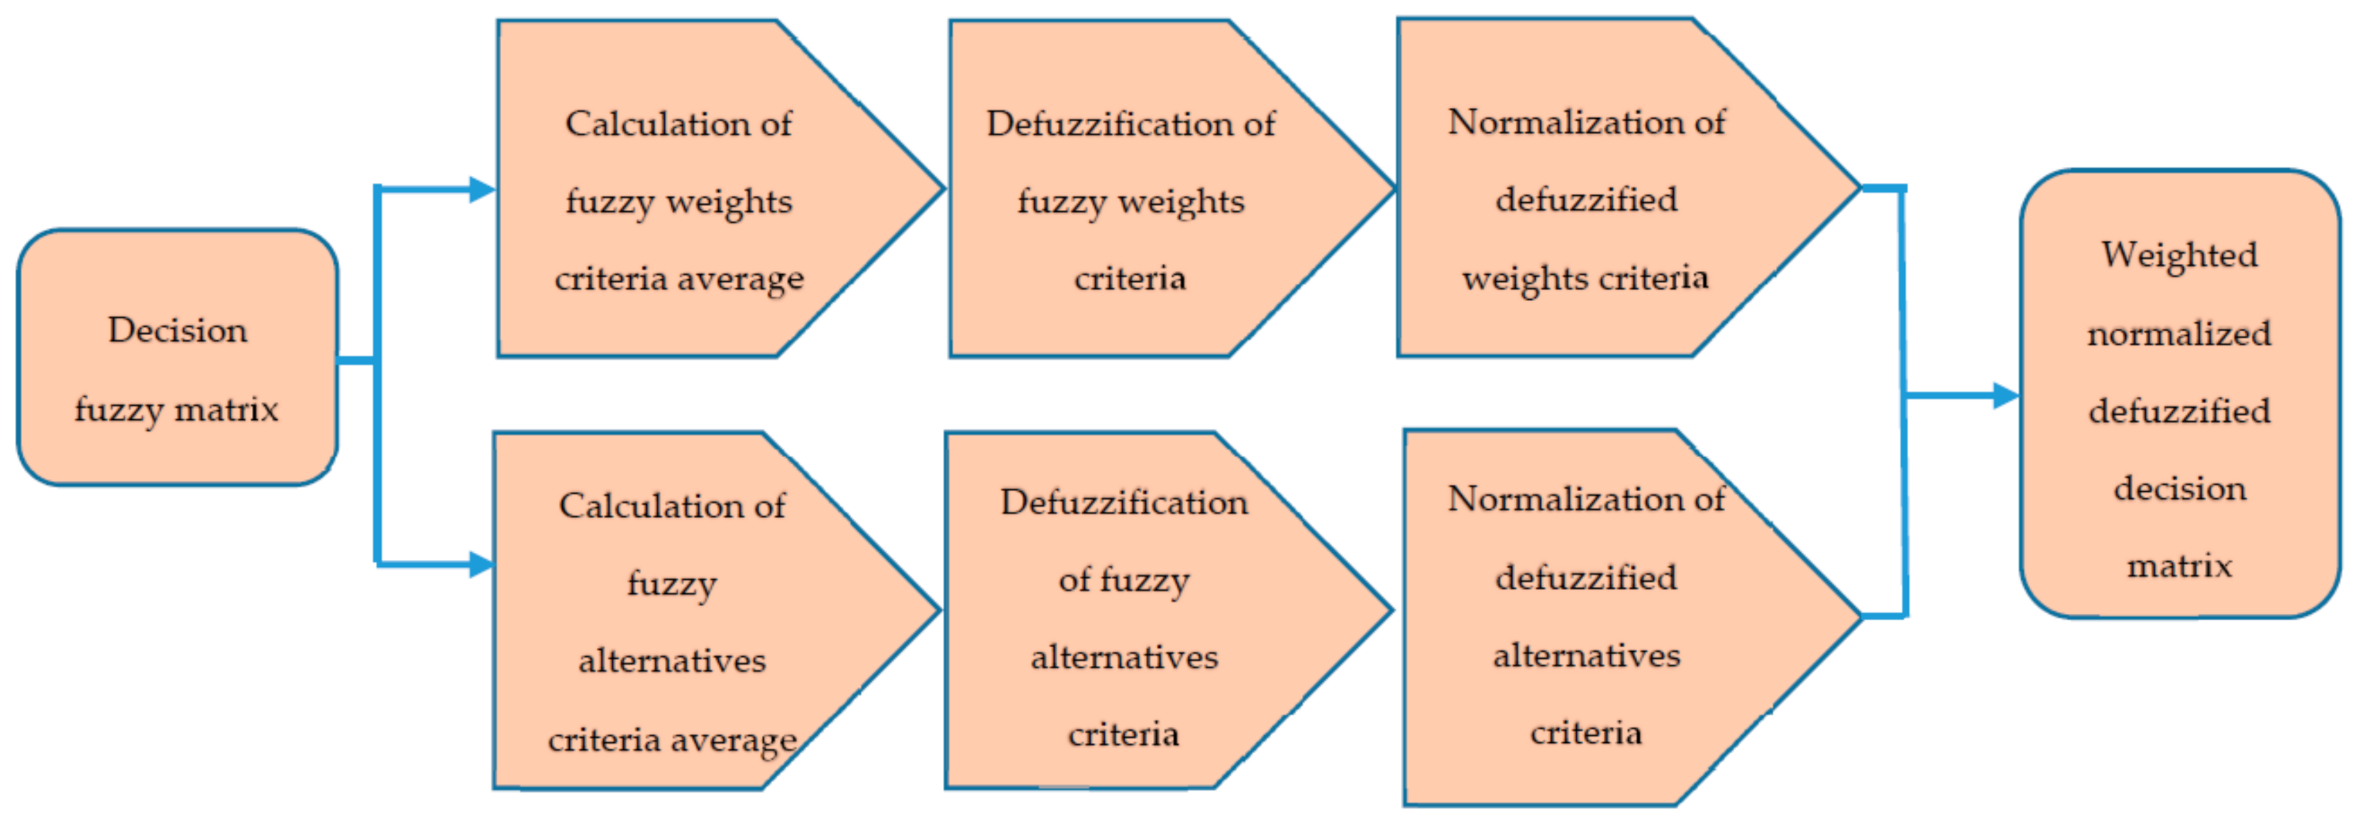
- Defuzzification: to defuzzify the fuzzy weight of each criterion into crisp values, the centre of area (COA) defuzzification method is applied. This method is simple and practical, with no need of including the preferences of any evaluator. The value of best non-fuzzy performance (BNP) for the fuzzy number can be found by using the following equation for a triangular fuzzy function:
- Normalization of defuzzified decision-making matrix: the normalized values of this matrix are calculated by the equation:
- Calculation of criteria weight: defuzzify the fuzzy weight of each criterion (w1, w2, w3) in crisp values (wj):
- Calculation of the weight of the jth criterion is depicted as follows:
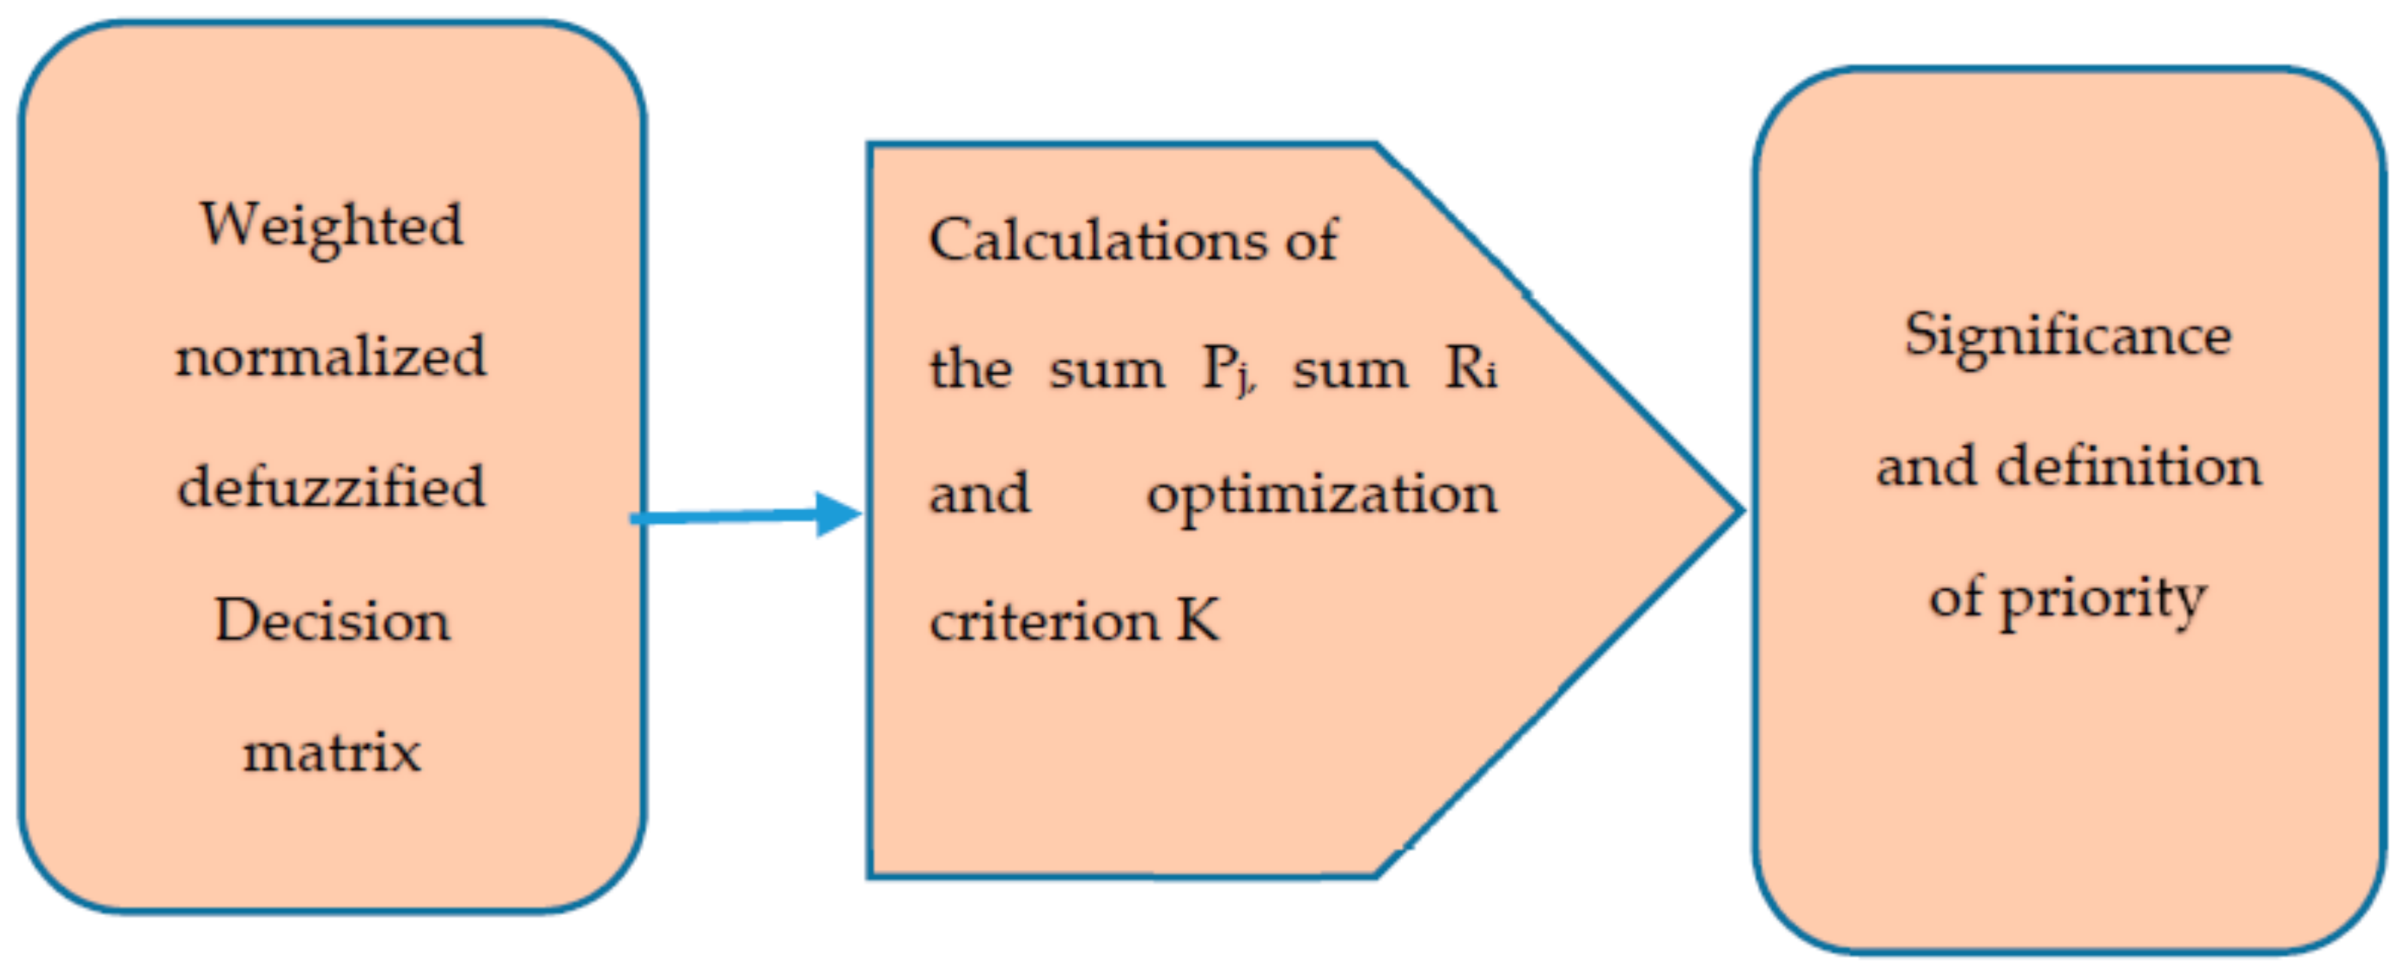
- Calculation of the weighted normalized fuzzified decision matrix: the weighted normalized fuzzified values are calculated by the equation:
- Calculation of the sum Pj: for each alternative of the fuzzified normalized and weighted values of the criteria of benefits, as they are preferable in optimization aimed at maximization
- Calculation of the sum Ri: for each alternative of the fuzzified normalized and weighted values of the criteria of costs, as they are preferable in optimization aimed at minimization:
- Calculation of significance of the alternatives or relative weight of each alternative of Qi project:
- Calculation of the optimization criterion K, i.e., the maximum Qi (Qmax)
- Definition of priority regarding design alternative: the greater the relative weight of the alternative Qi, the higher the priority or significance of the design alternative. This way, the Qmax significance of the more rational alternative will always be that of the highest degree of satisfaction.
- Calculation of the degree of utility Nj from 0% to 100% of the alternatives: calculated by comparing each alternative analyzed Aj with the most efficient alternative, which has a degree of utility equal to 100%, so it is possible to assess the extent to which an alternative Aj is better or worse than the others being compared:
3.7. Application of the Fuzzy Complex Proportional Assessment Method
3.7.1. Research of Linguistic Classifications for Criteria Importance
3.7.2. Survey of Linguistic Classifications for Alternatives
3.7.3. Fuzzified Linguistic Matrix of Weight Importance and Defuzzified by the Average with Calculation of Criteria Weight
3.7.4. Fuzzified and Defuzzified Linguistic Matrix and Ranking Calculation
4. Discussion of Application and Results of the Application of the MCDM COPRAS-F METHOD
- COPRAS: due to the direct application of benefit and cost subcriteria, in addition to calculating the degree of utility (significance) of the alternatives. This demonstrated, in percentage, to what extent an alternative is better or worse than other alternatives, which visually helps in decision making;
- FUZZY: practicality of calculating fuzzy logic in resolving conflicts between decision makers, without the need for consensus meetings.
5. Conclusions
5.1. Analysis and Discussion of the Proposed Decision-Making Model
- Eliminate the weaknesses of the GIS and GIS-MCDM models in the impossibility of mapping business subcriteria, and the weaknesses of the MCDM method in the impossibility of mapping geographical subcriteria;
- Demonstrate the complementarity between geographical subcriteria, which can be excellent in the selection of geographically suitable areas, and business subcriteria, which can be excellent for the classification of site alternatives regarding the viability of an enterprise.
- Regions characterized by economic, social, and environmental homogeneity, in which case the direct use of the GIS or GIS-MCDM methods prevails;
- Regions characterized by climatic, geomorphological, location and land use homogeneity, in which case the direct use of MCDM methods prevails.
5.2. Analysis and Discussion of Future Decision-Making Models
- Develop research involving structuring criteria for localization applications for distributed renewable energies, primarily wind energy, wind-photovoltaic and hydraulic hybrids aimed at small hydroelectric plants;
Author Contributions
Funding
Acknowledgments
Conflicts of Interest
Nomenclature
| COPRAS-F | Fuzzy Complex Proportional Assessment |
| MCDM | Multi-Criteria Decision-Making |
| GIS | Geographic Information Systems |
| WLC | Weighted Linear Combination |
| OWA | Ordered Weighted Average |
| FLOWA | Ordered Weighted Average Fuzzy |
| AHP | Analytic Hierarchy Process |
| SWARA | Step-Wise Weight Assessment Ratio Analysis |
| WASPAS | Weighted Aggregates Sum Product Assessment |
| CODAS | Applied the Combinative Distance Based Assessment |
| TOPSIS | Technique for Order of Preference by Similarity to Ideal Solution |
| F-PROMETHEE Evaluation | Fuzzy Preference Ranking Organization METHod Enrichment |
Appendix A. Linguistic Matrix of Importance of Criteria Weights

| Criteria i | Z Cost (−)/Benefits (+) | Decision Makers | |||
|---|---|---|---|---|---|
| D1 | D2 | D3 | D4 | ||
| C1 | − | VH | VH | H | VH |
| C2 | − | VH | H | H | MH |
| C3 | − | H | MH | M | H |
| C4 | − | H | MH | ML | MH |
| C5 | + | VH | VH | MH | VH |
| C6 | + | VH | M | MH | H |
| C7 | − | VL | L | H | M |
| C8 | − | L | L | VH | M |
| C9 | − | MH | MH | VH | MH |
| C10 | + | M | L | MH | M |
| C11 | + | M | L | MH | MH |
| C12 | + | M | H | H | M |
Appendix B. Linguistic Matrix of Alternatives A1–A2–A3–A4–A5–A6–A7–A8–A9–A10
| Criteria | Z | Decision Makers | |||||||||||||||
|---|---|---|---|---|---|---|---|---|---|---|---|---|---|---|---|---|---|
| D1 | D2 | D3 | D4 | ||||||||||||||
| A1 | A2 | A3 | A4 | A1 | A2 | A3 | A4 | A1 | A2 | A3 | A4 | A1 | A2 | A3 | A4 | ||
| C1 | - | VP | M | VG | VG | MP | MG | VG | VG | MP | M | G | G | VP | MP | VG | VG |
| C2 | - | G | MG | MG | M | MG | MG | MG | MP | M | MP | M | MP | MG | MG | MG | M |
| C3 | - | M | MG | VG | VG | M | MG | G | G | MP | MP | MP | MP | MG | G | VG | VG |
| C4 | - | MP | MP | G | M | M | MG | G | MG | VP | VP | P | P | P | MP | VG | MG |
| C5 | + | G | MG | MP | MP | VG | MG | MP | MP | MG | M | MP | MP | VG | G | M | M |
| C6 | + | MG | MG | MG | M | G | MG | MG | M | MG | MG | MG | MG | MG | MG | MG | MG |
| C7 | - | M | VP | P | P | G | VP | M | M | MP | VP | MP | MP | MG | MP | M | M |
| C8 | - | G | MG | MP | M | VG | MG | VP | VP | M | M | VP | VP | VG | VG | G | G |
| C9 | - | VP | MP | G | G | MP | MG | VG | VG | MP | MP | M | M | M | MG | VG | VG |
| C10 | + | VG | G | MG | MG | G | MG | MG | MG | M | M | M | M | M | M | M | M |
| C11 | + | VG | MG | MG | MG | G | MG | MG | MG | MG | MG | MG | MG | MG | MG | MG | MG |
| C12 | + | MG | G | MG | VG | M | MG | MP | G | M | M | M | MG | G | G | MG | VG |
| Criteria | Z | Decision Makers | |||||||||||||||
|---|---|---|---|---|---|---|---|---|---|---|---|---|---|---|---|---|---|
| D1 | D2 | D3 | D4 | ||||||||||||||
| A5 | A6 | A7 | A8 | A5 | A6 | A7 | A8 | A5 | A6 | A7 | A8 | A5 | A6 | A7 | A8 | ||
| C1 | - | M | MP | VP | VG | MG | M | MP | VG | M | MP | MP | G | MP | P | VP | VG |
| C2 | - | G | G | G | G | G | G | G | MG | M | M | M | M | MG | MG | MG | MG |
| C3 | - | MG | M | M | VG | MG | M | M | G | MP | MP | MP | MP | G | MG | MG | VG |
| C4 | - | MG | P | VP | G | G | M | MP | VG | P | VP | VP | P | G | VP | P | VG |
| C5 | + | MG | G | G | MP | MG | G | VG | MP | M | MG | MG | MP | G | G | VG | M |
| C6 | + | MG | MG | MG | MG | VG | VG | VG | MG | MG | MG | MG | MG | MG | MG | MG | MG |
| C7 | - | M | MG | MG | MP | G | VG | VG | MG | MP | M | M | MP | MG | VG | VG | M |
| C8 | - | G | MP | MP | MG | G | VP | VP | MG | M | VP | VP | M | VG | G | G | VG |
| C9 | - | MP | P | VP | G | MG | M | MP | VG | MP | MP | MP | M | MG | MG | MG | VG |
| C10 | + | G | G | VG | MG | MG | MG | G | MG | M | M | M | M | M | M | M | M |
| C11 | + | MG | G | VG | MG | MG | G | G | MG | MG | MG | MG | MG | MG | MG | MG | MG |
| C12 | + | M | G | MG | VG | M | MG | MP | G | M | M | M | MG | G | G | MG | VG |
| Criteria | Z | Decision Makers | |||||||
|---|---|---|---|---|---|---|---|---|---|
| D1 | D2 | D3 | D4 | ||||||
| A9 | A10 | A9 | A10 | A9 | A10 | A9 | A10 | ||
| C1 | - | M | M | MG | MG | M | M | MP | MP |
| C2 | - | M | MG | M | MG | MP | M | MG | MG |
| C3 | - | MG | MG | MG | MG | MP | MP | G | G |
| C4 | - | MP | MP | MG | MG | VP | VP | MP | MP |
| C5 | + | MG | MG | MG | MG | M | M | G | G |
| C6 | + | MG | MG | MG | MG | MG | MG | MG | MG |
| C7 | - | VP | P | P | M | VP | MP | MP | M |
| C8 | - | M | VG | P | VG | VP | M | VG | VG |
| C9 | - | MP | MP | MG | MG | MP | MP | MG | MG |
| C10 | + | G | G | MG | MG | M | M | M | M |
| C11 | + | MG | MG | MG | MG | MG | MG | MG | MG |
| C12 | + | MG | VG | M | VG | M | MG | G | VG |
References
- Jemai, K. Intelligent integration strategies of wind farms in a super grid. J. Intell. Fuzzy Syst. 2016, 31, 275–290. [Google Scholar] [CrossRef]
- Bhuvanesha, A.; Christab, S.T.J.; Kannanc, S.; Pandiyand, M.K.; Gangatharane, K. Application of optimization algorithms to generation expansion planning problem. J. Intell. Fuzzy Syst. 2018, 35, 1387–1398. [Google Scholar] [CrossRef]
- Castillo, C.P.; Silva, F.B.; Lavalle, C. An assessment of the regional potential for solar power generation in EU-28. Energy Policy 2016, 88, 86–99. [Google Scholar] [CrossRef]
- Tomosk, S.; Haysom, J.E.; Hinzer, K.; Schriemer, H.; Wrig, D. Mapping the geographic distribution of the economic viability of PV load displacement projects in SW USA. Renew Energy 2017, 107, 101–112. [Google Scholar] [CrossRef]
- Vafaeipour, M.; Zolfani, S.H.; Varzandeh, M.H.M.; Derakhti, A.; Eshkalag, M.K. Assessment of regions priority for implementation of solar projects in Iran: New application of a hybrid multi-criteria decision making approach. Energy Convers. Manag. 2014, 86, 653–663. [Google Scholar] [CrossRef]
- Brewer, J.; Ames, D.P.; Solan, D.; Lee, R.; Carlisle, J. Using GIS analytics and social preference data to evaluate utility-scale solar power site suitability. Renew. Energy Rev. 2015, 81, 825–836. [Google Scholar] [CrossRef]
- Janke, J.R. Multicriteria GIS modeling of wind and solar farms in Colorado. Renew. Energy Rev. 2010, 35, 2228–2234. [Google Scholar] [CrossRef]
- Sabo, M.L.; Mariun, N.; Hizam, H.; Radzi, M.A.M.; Zakaria, A. Spatial energy predictions from large-scale photovoltaic power plants located in optimal sites and connected to a smart grid in Peninsular Malaysia. Renew. Sustain. Energy Rev. 2016, 66, 79–94. [Google Scholar] [CrossRef]
- Wang, S.; Zhang, L.; Fu, D.; Lu, X.; Wu, T.; Tong, Q. Selecting photovoltaic generation sites in Tibet using remote sensing and geographic analysis. Sol. Energy 2016, 133, 85–93. [Google Scholar] [CrossRef]
- Maleki, A.; Pourfayaz, F.; Hafeznia, H.; Rosen, M.A. A novel framework for optimal photovoltaic size and location in remote areas using a hybrid method: A case study of eastern Iran. Energy Convers. Manag. 2017, 153, 129–143. [Google Scholar] [CrossRef]
- Charabi, Y.; Gastli, A. PV site suitability analysis using GIS-based spatial fuzzy multi-criteria evaluation. Renew. Energy 2011, 36, 2554–2561. [Google Scholar] [CrossRef]
- Al Garni, H.Z.; Awasthi, A. Solar PV power plant site selection using a GIS-AHP based approach with application in Saudi Arabia. Appl. Energy 2017, 206, 1225–1240. [Google Scholar] [CrossRef]
- Aydin, N.Y.; Kentel, E.; Duzgun, H.S. GIS-based site selection methodology for hybrid renewable energy systems: A case study from western Turkey. Energy Convers. Manag. 2013, 70, 90–106. [Google Scholar] [CrossRef]
- Wanderer, T.; Herle, S. Creating a spatial multi-criteria decision support system for energy related integrated environmental impact assessment. Environ. Impact Assess. Rev. 2015, 52, 2–8. [Google Scholar] [CrossRef]
- Watson, J.J.W.; Hudson, M.D. Regional Scale wind farm and solar farm suitability assessment using GIS-assisted multi-criteria evaluation. Landsc. Urban Plan. 2015, 138, 20–31. [Google Scholar] [CrossRef]
- Merrouni, A.A.; Elalaoui, F.E.; Mezrhab, A.; Mezrhab, A.; Ghennioui, A. Large scale PV sites selection by combining GIS and Analytical Hierarchy Process. Case study: Eastern Morocco. Renew. Energy 2018, 119, 863–873. [Google Scholar] [CrossRef]
- Mourmouris, J.C.; Potolias, C. A multi-criteria methodology for energy planning and developing renewable energy sources at a regional level: A case study Thassos. Greece Energy Policy 2013, 52, 522–530. [Google Scholar] [CrossRef]
- Wang, C.N.; Nguyen, V.T.; Thai, H.T.N.; Duong, D.H. Multi-Criteria Decision Making (MCDM) Approaches for Solar Power Plant Location Selection in Vietnam. Energies 2018, 11, 1504. [Google Scholar] [CrossRef]
- Barin, A.; Canha, L.N.; Abaide, A.R.; Magnago, K.F.; Matos, M.A.; Orling, R.B. A novel fuzzy-based expert system for RET selection. J. Intell. Fuzzy Syst. 2013, 25, 325–333. [Google Scholar] [CrossRef]
- Karasan, A.; Bolturk, E.; Kahraman, C. A novel neutrosophic CODAS method: Selection among wind energy plant locations. J. Intell. Fuzzy Syst. 2019, 36, 1491–1504. [Google Scholar] [CrossRef]
- Samanlioglu, F.; Ayag, Z. A fuzzy AHP-PROMETHEE II approach for evaluation of solar power plant location alternatives in Turkey. J. Intell. Fuzzy Syst. 2017, 33, 859–871. [Google Scholar] [CrossRef]
- Zerpa, J.C.R.; Yusta, J.M. Application of multicriteria decision methods for electric supply planning in rural and remote areas. Renew. Sustain. Energy Rev. 2015, 52, 557–571. [Google Scholar] [CrossRef]
- Dorfeshan, Y.; Mousavi, S.M. A group TOPSIS-COPRAS methodology with Pythagorean fuzzy sets considering weights of experts for project critical path problem. J. Intell. Fuzzy Syst. 2019, 36, 1375–1387. [Google Scholar] [CrossRef]
- Beltrán, P.A.; González, F.C.; Pascual, J.; Ferrando, P.; Rubio, A.P. An AHP (Analytic Hierarchy Process)/ANP (Analytic Network Process)-based multi-criteria decision approach for the selection of solar-thermal power plant investment projects. Energy 2014, 66, 222–238. [Google Scholar] [CrossRef]
- Haddad, B.; Liazid, A.; Ferreira, P. A multi-criteria approach to rank renewables for the Algerian electricity system. Renew. Energy 2017, 107, 462–472. [Google Scholar] [CrossRef]
- Klein, S.J.W.; Whalley, S. Comparing the sustainability of U.S. electricity options through multi-criteria decision analysis. Energy Policy 2015, 79, 127–149. [Google Scholar] [CrossRef]
- La Rovere, E.L.; Soares, J.B.; Oliveira, L.B.; Lauria, T. Sustainable expansion of electricity sector: Sustainability indicators as an instrument to support decision making. Renew. Sustain. Energy Rev. 2010, 14, 422–429. [Google Scholar] [CrossRef]
- Stein, E.W. A comprehensive multi-criteria model to rank electric energy production Technologies. Renew. Sustain. Energy Rev. 2013, 22, 640–654. [Google Scholar] [CrossRef]
- Tsoutsos, T.; Drandaki, M.; Frantzeskaki, N.; Iosifidis, E.; Kiosses, I. Sustainable energy planning by using multi-criteria analysis application in the island of Crete. Energy Policy 2009, 37, 1587–1600. [Google Scholar] [CrossRef]
- Wang, J.J.; Jing, Y.Y.; Zhang, C.F.; Zhao, J.H. Review on multi-criteria decision analysis aid in sustainable energy decision-making. Renew. Sustain. Energy Rev. 2009, 13, 2263–2278. [Google Scholar] [CrossRef]
- Maxim, A. Sustainability assessment of electricity generation technologies using weighted multi-criteria decision analysis. Energy Policy 2014, 65, 284–297. [Google Scholar] [CrossRef]
- Grossmann, W.D.; Grossmann, I.; Steininger, K.W. Solar electricity generation across large geographic areas, Part II: A Pan-American energy system based on solar. Renew. Sustain. Energy Rev. 2014, 32, 983–993. [Google Scholar] [CrossRef]
- Onat, N.; Bayar, H. The sustainability indicators of power production systems. Renew. Sustain. Energy Rev. 2010, 14, 3108–3115. [Google Scholar] [CrossRef]
- Zhang, L.; Zhou, P.; Newton, S.; Fang, J.X.; Zhou, D.; Zhang, L. Evaluating clean energy alternatives for Jiangsu, China: An improved multi-criteria decision making method. Energy 2015, 90, 953–964. [Google Scholar] [CrossRef]
- Chatterjee, N.C.; Bose, G.K. A COPRAS-F base multi-criteria group decision making approach for site selection of wind farm. Decis. Sci. Lett. 2012, 2, 1–10. [Google Scholar] [CrossRef]
- Nezhad, M.R.G.; Zolfani, S.H.; Moztarzadeh, F.; Zavadskas, E.K.; Bahrami, M. Planning the priority of high tech industries based on SWARA-WASPAS methodology. The case of the nanotechnology industry in Iran. Econ. Res. 2015, 28, 1111–1137. [Google Scholar] [CrossRef]
- Yazdani, M.; Alidoosti, A.; Zavadskas, E.K. Risk Analysis of Critical Infrastructures Using Fuzzy Copras. Econ. Res. Ekon. Istraživanja 2011, 24, 27–40. [Google Scholar] [CrossRef]
- Mulliner, E.; Malys, N.; Maliene, V. Comparative analysis of MCDM methods for the assessment of sustainable housing affordability. Omega 2016, 59, 146–156. [Google Scholar] [CrossRef]
- Zoghi, M.; Ehsani, A.H.; Sadat, M.; Amiri, M.J.; Karimi, S. Optimization solar site selection by fuzzy logic model and weighted linear combination method in arid and semi-arid region: A case study Isfahan-IRAN. Renew. Sustain. Energy Rev. 2017, 68, 986–996. [Google Scholar] [CrossRef]
- Juodagalviené, B.; Turskis, Z.; Šaparauskas, J.; Endriukaityté, A. Integrated Multi-Criteria Evaluation House’s Plan Shape based on the EDAS and SWARA Methods. Eng. Struct. Technol. 2017, 9, 117–125. [Google Scholar] [CrossRef]
- Mardani, A.; Nilashi, M.; Zakuan, N.; Loganathan, N.; Soheilirad Saman, M.Z.M.; Ibrahim, O. A systematic review and meta-Analysis of SWARA and WASPAS methods: Theory and applications with recent fuzzy developments. Appl. Soft Comput. 2017, 57, 265–292. [Google Scholar] [CrossRef]
- Panahi, S.; Khakzad, A.; Afzal, P. Application of stepwise weight assessment ratio analysis (SWARA) for copper prospectivity mapping in the Anarak region, central Iran. Arab. J. Geosci. 2017, 10, 484. [Google Scholar] [CrossRef]


| Authors | Results |
|---|---|
| Brewer et al. [6] | Generated maps of the solar energy potential of southwestern USA, including social acceptance data. |
| Janke [7] | Identified 191 km2 of highly suitable areas for solar farms in Northwest Colorado, in the USA. |
| Sabo et al. [8] | Identified 10,092.08 km2 for the installation of large photovoltaic plants in Malaysia. |
| Wang et al. [9] | Applied GIS to select 4005 sites suitable for photovoltaic energy projects, with the majority in the Shigatse and Ngari regions in Tibet, China. |
| Maleki et al. [10] | Applied GIS to assess the size and location of rural areas for photovoltaic projects, considering energy quality and cost for the Birjand region in Iran. |
| Authors | Methods and Results |
|---|---|
| Charabi and Gastli [11] | Applied the MCDM ordered weighted average fuzzy (FLOWA) to define weights used in GIS when generating a map of Oman that showed high suitability for the installation of large photovoltaic plants in 0.5% of the country’s area |
| Al Garni and Awasthi [12] | Applied the MCDM analytic hierarchy process (AHP) to define weights used in GIS-MCDM (WLC) when generating a suitability map of Saudi Arabia that showed that 16% of the country is suitable for installing small-scale photovoltaic plants |
| Aydin et al. [13] | Applied GIS-MCDM (OWA) to generate maps of global performance indexes for environmental objectives and economic viability, indicating the provinces of Aydin, Usak, Burdur, Denizli, and Mugla in Turkey as priorities for photovoltaic energy sites. |
| Wanderer and Herle [14] | Applied MCDM (AHP) to define the weights used in GIS-MCDM (WLC and OWA) methods, generating a map of suitability for Andalusia, in Spain, regarding solar energy, presenting more sites that are suitable-located in the Guadalquivir Valley. |
| Watson et al. [15] | Applied GIS-MCDM (AHP) to generate a map of the south of England, which showed an added 345 km2 of suitable areas. |
| Merrouni et al. [16] | Applied MCDM (AHP) to define the weights used to aggregate the suitability index of categorized subcriteria maps, when determining that eastern Morocco is highly suitable, with 19% of the land proven as appropriate for the installation of large photovoltaic plants. |
| Authors | Methods and Results |
|---|---|
| Mourmouris and Potolias [17] | Applied the REGIME method with business criteria to classify renewable energy systems based on energy efficiency for installation on the island of Thassos, in Greece |
| Vafaeipour [5] | Applied step-wise weight assessment ratio analysis-weighted aggregates sum product assessment (SWARA-WASPAS) with business criteria in prioritizing city alternatives for photovoltaic plant location in Iran |
| Wang et al. [18] | Applied MCDM methods fuzzy analytic hierarchy process-technique for order of preference by similarity to ideal solution (FAHP-TOPSIS) to rank locations for the construction of a solar power plant in Vietnam. |
| Barin et al. [19] | Applied a novel fuzzy-based expert system with business criteria for selecting renewable energy technologies, along with technical-economic and environmental criteria in Brazil. |
| Karasan et al. [20] | Applied the combinative distance based assessment (CODAS) method, crisp and ordinary fuzzy CODAS methods, with business criteria to select sites for the construction of a wind farm in Turkey. |
| Samanlioglu and Ayag [21] | Applied MCDM Fuzzy AHP (F-AHP) and fuzzy preference ranking organization method enrichment evaluation (F-PROMETHEE) methods to evaluate alternative solar plant locations in Turkey. |
| Variables | Alternatives | |||||||||
|---|---|---|---|---|---|---|---|---|---|---|
| A1 | A2 | A3 | A4 | A5 | A6 | A7 | A8 | A9 | A10 | |
| Geographic Suitability Index | 0.91 | 0.85 | 0.86 | 0.75 | 0.95 | 0.94 | 0.93 | 0.9 | 0.83 | 0.89 |
| Ranking (GIS) | 4 | 8 | 7 | 10 | 1 | 2 | 3 | 5 | 9 | 6 |
| Criteria | Subcriteria | Literature |
|---|---|---|
| Economic | C1-Investment cost | Beltrán et al. [24], Haddad et al. [25], Klein and Whalley [26], La Rovere et al. [27], Mourmouris and Potolias [17], Stein [28], Tsoutsos et al. [29], Wang JJ et al. [30]. |
| C2-Payback period | Haddad et al. [25], Wang JJ et al. [30]. | |
| C3-Construction period | La Rovere et al. [26]. | |
| C4-Operation and maintenance team cost | Haddad et al. [25], Mourmouris and Potolias [17], Stein [28], Wang JJ et al. [30], Zerpa e Yusta [22]. | |
| Technical | C5-Eletricity generation potential | La Rovere et al. [26]. |
| C6-Capacity factor | Haddad et al. [25], Klein and Whalley [26], Maxim [31], Stein [28], Zerpa and Yusta [22]. | |
| C7-Duration of interruption per consumer unit (DEC) | Grossmann et al. [32] (Intermittency of Power Supply). | |
| Environmental | C8-Monthly CO2 emission in transport | Castillo et al. [3]; Klein and Whalley [26], La Rovere et al. [27], Mourmouris and Potolias [17], Onat and Bayar [33], Stein [28], Zerpa and Yusta [22], Zhang et al. [34]. |
| C9-Photovoltaic module disposal (Service Life) | Klein and Whalley [26], Mourmouris and Potolias [17], Wang JJ et al. [30]. | |
| Social | C10-Seasonal jobs numbers | Stein [28], Zerpa and Yusta [22], Wang JJ et al. [30], Zhang et al. [34]. |
| C11-Long-term jobs numbers | Stein [28], Zerpa and Yusta [22], Wang JJ et al. [30], Zhang et al. [34]. | |
| C12-Benefited population | Beltrán et al. [24], Klein and Whalley [26], La Rovere et al. [27], Maxim [31], Mourmouris and Potolias [17], Wang JJ et al. [30], Zerpa and Yusta [22], Zhang et al. [34]. |
| Linguistic Terms for Criteria | Fuzzy Numbers | Linguistic Terms for Alternatives | Fuzzy Numbers |
|---|---|---|---|
| Very High (VH) | (0.9, 1.0, 1.0) | Very Good (VG) | (0.9, 1.0, 1.0) |
| High (H) | (0.7, 0.9, 1.0) | Good (G) | (0.7, 0.9, 1.0) |
| Moderate High (MH) | (0.5, 0.7, 0.9) | Medium Good (MG) | (0.5, 0.7, 0.9) |
| Moderate (M) | (0.3, 0.5, 0.7) | Medium (M) | (0.3, 0.5, 0.7) |
| Moderate Low (ML) | (0.1, 0.3, 0.5) | Medium Poor (MP) | (0.1, 0.3, 0.5) |
| Low (L) | (0.0, 0.1, 0.3) | Poor (P) | (0.0, 0.1, 0.3) |
| Very Low (VL) | (0.0, 0.0, 0.1) | Very Poor (VP) | (0.0, 0.0, 0.1) |
| Criteria | Z | Decision Makers | Average | Weights Defuzzified (COA) | qj (Normalized Weights) | |||||||||||||
|---|---|---|---|---|---|---|---|---|---|---|---|---|---|---|---|---|---|---|
| D1 | D2 | D3 | D4 | |||||||||||||||
| C1 | - | 0.9 | 1.0 | 1.0 | 0.9 | 1.0 | 1.0 | 0.7 | 0.9 | 1.0 | 0.9 | 1.0 | 1.0 | 0.850 | 0.975 | 1.000 | 0.942 | 0.117 |
| C2 | - | 0.9 | 1.0 | 1.0 | 0.7 | 0.9 | 1.0 | 0.7 | 0.9 | 1.0 | 0.5 | 0.7 | 0.9 | 0.700 | 0.875 | 0.975 | 0.850 | 0.105 |
| C3 | - | 0.7 | 0.9 | 1.0 | 0.5 | 0.7 | 0.9 | 0.3 | 0.5 | 0.7 | 0.7 | 0.9 | 1.0 | 0.550 | 0.750 | 0.900 | 0.733 | 0.091 |
| C4 | - | 0.7 | 0.9 | 1.0 | 0.5 | 0.7 | 0.9 | 0.1 | 0.3 | 0.5 | 0.5 | 0.7 | 0.9 | 0.450 | 0.650 | 0.825 | 0.642 | 0.080 |
| C5 | + | 0.9 | 1.0 | 1.0 | 0.9 | 1.0 | 1.0 | 0.5 | 0.7 | 0.9 | 0.9 | 1.0 | 1.0 | 0.800 | 0.925 | 0.975 | 0.900 | 0.112 |
| C6 | + | 0.9 | 1.0 | 1.0 | 0.3 | 0.5 | 0.7 | 0.5 | 0.7 | 0.9 | 0.7 | 0.9 | 1.0 | 0.600 | 0.775 | 0.900 | 0.758 | 0.094 |
| C7 | - | 0.0 | 0.0 | 0.1 | 0.0 | 0.1 | 0.3 | 0.7 | 0.9 | 1.0 | 0.3 | 0.5 | 0.7 | 0.250 | 0.375 | 0.525 | 0.383 | 0.048 |
| C8 | - | 0.0 | 0.1 | 0.3 | 0.0 | 0.1 | 0.3 | 0.9 | 1.0 | 1.0 | 0.3 | 0.5 | 0.7 | 0.300 | 0.425 | 0.575 | 0.433 | 0.054 |
| C9 | - | 0.5 | 0.7 | 0.9 | 0.5 | 0.7 | 0.9 | 0.9 | 1.0 | 1.0 | 0.5 | 0.7 | 0.9 | 0.600 | 0.775 | 0.925 | 0.767 | 0.095 |
| C10 | + | 0.3 | 0.5 | 0.7 | 0.0 | 0.1 | 0.3 | 0.5 | 0.7 | 0.9 | 0.3 | 0.5 | 0.7 | 0.275 | 0.450 | 0.650 | 0.458 | 0.057 |
| C11 | + | 0.3 | 0.5 | 0.7 | 0.0 | 0.1 | 0.3 | 0.5 | 0.7 | 0.9 | 0.5 | 0.7 | 0.9 | 0.325 | 0.500 | 0.700 | 0.508 | 0.063 |
| C12 | + | 0.3 | 0.5 | 0.7 | 0.7 | 0.9 | 1.0 | 0.7 | 0.9 | 1.0 | 0.3 | 0.5 | 0.7 | 0.500 | 0.700 | 0.850 | 0.683 | 0.085 |
| Criteria | Z | Decision Makers | |||||||||
|---|---|---|---|---|---|---|---|---|---|---|---|
| D1 D2 D3 D4 | |||||||||||
| A1 | A2 | A3 | A4 | A5 | A6 | A7 | A8 | A9 | A10 | ||
| C1 | - | 0.004 | 0.011 | 0.020 | 0.020 | 0.011 | 0.007 | 0.004 | 0.020 | 0.011 | 0.011 |
| C2 | - | 0.011 | 0.010 | 0.011 | 0.007 | 0.012 | 0.012 | 0.012 | 0.011 | 0.008 | 0.011 |
| C3 | - | 0.007 | 0.009 | 0.011 | 0.011 | 0.009 | 0.007 | 0.007 | 0.011 | 0.009 | 0.009 |
| C4 | - | 0.005 | 0.006 | 0.014 | 0.010 | 0.012 | 0.003 | 0.002 | 0.014 | 0.006 | 0.006 |
| C5 | + | 0.015 | 0.012 | 0.006 | 0.006 | 0.012 | 0.014 | 0.015 | 0.006 | 0.012 | 0.012 |
| C6 | + | 0.010 | 0.009 | 0.009 | 0.008 | 0.010 | 0.010 | 0.010 | 0.009 | 0.009 | 0.009 |
| C7 | - | 0.006 | 0.001 | 0.004 | 0.004 | 0.006 | 0.008 | 0.008 | 0.005 | 0.001 | 0.004 |
| C8 | - | 0.008 | 0.007 | 0.003 | 0.003 | 0.008 | 0.003 | 0.003 | 0.007 | 0.004 | 0.008 |
| C9 | - | 0.005 | 0.009 | 0.014 | 0.014 | 0.009 | 0.007 | 0.006 | 0.014 | 0.009 | 0.009 |
| C10 | + | 0.006 | 0.006 | 0.005 | 0.005 | 0.006 | 0.006 | 0.006 | 0.005 | 0.006 | 0.006 |
| C11 | + | 0.007 | 0.006 | 0.006 | 0.006 | 0.006 | 0.007 | 0.007 | 0.006 | 0.006 | 0.006 |
| C12 | + | 0.008 | 0.009 | 0.007 | 0.010 | 0.007 | 0.009 | 0.007 | 0.010 | 0.008 | 0.011 |
| Alternatives | Pi Sum of Benefit Criteria (Maximization) | Ri-Sum of Cost Criteria (Minimization) | 1/Ri | Qi | Ui-Alternative Priority (Significance) | Ranking |
|---|---|---|---|---|---|---|
| A1 | 0.05 | 0.05 | 21.81 | 0.118 | 0.956 | 2 |
| A2 | 0.04 | 0.05 | 18.96 | 0.105 | 0.846 | 5 |
| A3 | 0.03 | 0.08 | 13.06 | 0.076 | 0.619 | 10 |
| A4 | 0.04 | 0.07 | 14.48 | 0.084 | 0.678 | 8 |
| A5 | 0.04 | 0.07 | 14.95 | 0.090 | 0.732 | 7 |
| A6 | 0.05 | 0.05 | 21.05 | 0.115 | 0.934 | 3 |
| A7 | 0.05 | 0.04 | 23.69 | 0.124 | 1.000 | 1 |
| A8 | 0.04 | 0.08 | 12.10 | 0.077 | 0.625 | 9 |
| A9 | 0.04 | 0.05 | 20.66 | 0.109 | 0.882 | 4 |
| A10 | 0.04 | 0.06 | 17.37 | 0.101 | 0.819 | 6 |
| 0.59 | 178.13 |
| Variables | Alternatives | |||||||||
|---|---|---|---|---|---|---|---|---|---|---|
| A1 | A2 | A3 | A4 | A5 | A6 | A7 | A8 | A9 | A10 | |
| Priority | 0.96 | 0.85 | 0.62 | 0.68 | 0.73 | 0.93 | 1.00 | 0.63 | 0.88 | 0.82 |
| Ranking COPRAS-F | 2 | 5 | 10 | 8 | 7 | 3 | 1 | 9 | 4 | 6 |
| Method | Alternatives | |||||||||
|---|---|---|---|---|---|---|---|---|---|---|
| A1 | A2 | A3 | A4 | A5 | A6 | A7 | A8 | A9 | A10 | |
| Geographic Suitability Index | 0.91 | 0.85 | 0.86 | 0.75 | 0.95 | 0.94 | 0.93 | 0.9 | 0.83 | 0.89 |
| Ranking GIS | 4 | 8 | 7 | 10 | 1 | 2 | 3 | 5 | 9 | 6 |
| Priority | 0.96 | 0.85 | 0.62 | 0.68 | 0.73 | 0.93 | 1.00 | 0.63 | 0.88 | 0.82 |
| Ranking COPRAS-F | 2 | 5 | 10 | 8 | 7 | 3 | 1 | 9 | 4 | 6 |
Publisher’s Note: MDPI stays neutral with regard to jurisdictional claims in published maps and institutional affiliations. |
© 2020 by the authors. Licensee MDPI, Basel, Switzerland. This article is an open access article distributed under the terms and conditions of the Creative Commons Attribution (CC BY) license (http://creativecommons.org/licenses/by/4.0/).
Share and Cite
Furtado, P.A.X.; Sola, A.V.H. Fuzzy Complex Proportional Assessment Applied in Location Selection for Installation of Photovoltaic Plants. Energies 2020, 13, 6260. https://doi.org/10.3390/en13236260
Furtado PAX, Sola AVH. Fuzzy Complex Proportional Assessment Applied in Location Selection for Installation of Photovoltaic Plants. Energies. 2020; 13(23):6260. https://doi.org/10.3390/en13236260
Chicago/Turabian StyleFurtado, Paulo Antônio Xavier, and Antônio Vanderley Herrero Sola. 2020. "Fuzzy Complex Proportional Assessment Applied in Location Selection for Installation of Photovoltaic Plants" Energies 13, no. 23: 6260. https://doi.org/10.3390/en13236260
APA StyleFurtado, P. A. X., & Sola, A. V. H. (2020). Fuzzy Complex Proportional Assessment Applied in Location Selection for Installation of Photovoltaic Plants. Energies, 13(23), 6260. https://doi.org/10.3390/en13236260