Article

Quantitative Analysis of Amorphous Silica and Its Influence on Reservoir Properties: A Case Study on the Shale Strata of the Lucaogou Formation in the Jimsar Depression, Junggar Basin, China

1
School of Geosciences, China University of Petroleum (East China), Qingdao 266580, China
2
School of Earth Resources, China University of Geosciences, Wuhan 430074, China
3
Key Laboratory of Theory and Technology of Petroleum Exploration and Development in Hubei Province, China University of Geosciences, Wuhan 430074, China
4
Exploration and Development Research Institite, PetroChina Tarim Oilfield Company, Korla 841000, China
*
Author to whom correspondence should be addressed.
Energies 2020, 13(23), 6168; https://doi.org/10.3390/en13236168
Submission received: 30 October 2020 / Revised: 19 November 2020 / Accepted: 23 November 2020 / Published: 24 November 2020
(This article belongs to the Special Issue Development of Unconventional Reservoirs 2020)

Abstract

:
To establish a new quantitative analysis method for amorphous silica content and understand its effect on reservoir properties, the amorphous silica (SiO2) in the shale strata of the Lucaogou Formation in the Jimsar Depression was studied by scanning electron microscopy (SEM) observation, X-ray diffraction (XRD), and X-ray fluorescence spectrometry (XRF). Amorphous silica shows no specific morphology, sometimes exhibits the spherical or ellipsoid shapes, and usually disorderly mounds among other mineral grains. A new quantitative analysis method for observing amorphous SiO2 was established by combining XRD and XRF. On this basis, while the higher content of amorphous SiO2 lowers the porosity of the reservoir, the permeability shows no obvious changes. The higher the content of amorphous SiO2, the lower the compressive strength and Young’s modulus and the lower the oil saturation. Thus, amorphous SiO2 can reduce the physical properties of reservoir rocks and increase the reservoir plasticity, which is not only conducive to the enrichment of shale oil but also increases the difficulty of fracturing in later reservoir development.

1. Introduction

The success of shale gas exploration and development in North America has promoted the development of the shale gas industry around the world. At present, successful exploration and development of shale gas in China is mainly concentrated in the Sichuan Basin and surrounding areas, such as the Weiyuan, Zhaotong, Zhengan, and Jiaoshiba areas [1,2,3]. The shale sections containing commercial scale gas in these areas are located at the top of the Wufeng and the bottom of the Longmaxi Formations, corresponding to the 2-3 graphitic biozones of the Wufeng Formation and the 1-4 graphitic biozones of the Longmaxi Formation [4,5]. These high-quality shale sections contain high content of silica: as much as 60% [6,7,8,9,10,11]. Although there are different opinions about the evidence of biogenesis, most researchers consider that the silica in these high-quality shale sections has biogenic sources [12,13,14,15,16,17]. Shale oil sources are mainly concentrated in basins in China, where lacustrine shale is widely developed, such as the Ordos, Songliao, and Bohai Bay Basins. Shale oil exploration has been particularly successful in the second member of the Kongdian Formation in Cangdong Depression of Bohai Bay Basin, where commercial-scale oil has been obtained in several wells [18]. This quartz-feldspathic shale exhibits good quality, high TOC content, and high hydrocarbon potential [18]. The tuffaceous shale sections of the Lucaogou Formation shale strata in the oil reservoir of the Malang Depression contain high total organic carbon and exhibit high hydrocarbon generation potential. These tuffaceous shales are also mainly composed of quartz and feldspar [19]. In both marine shale gas and or lacustrine shale oil reservoirs, silica is an important component, having a significant impact on shale reservoir properties, organic matter enrichment, shale oil and gas accumulation, and fracturing potential [14,15,20,21,22,23,24,25]. Hence, silica is a hot spot in shale reservoir research at present.
Studies on silica diagenesis have shown that the end members are amorphous SiO2 and crystalline quartz. The quartz can be further divided into authigenic quartz formed during diagenesis and detrital quartz from deposition. During diagenesis, amorphous SiO2 will gradually change from the amorphous state (opal-A) to the cryptocrystalline state and finally to the fully crystalline state (α-quartz), which is authigenic quartz. Amorphous SiO2 can be from biological organisms or an abioticearly diagenesis stage. Some studies suggest that amorphous SiO2 has already transformed into crystalline quartz during early diagenesis (Ro is 0.35%~0.5%) [23,24]. Others suggest that the conversion of amorphous SiO2 to crystalline quartz in shale reservoirs may be much later, because amorphous SiO2 has been seen in the middle diagenetic stage A (Ro is 0.5%~1.3%) [21]. During clay mineral conversion, a large amount of silica is generated, and its content is closely related to mineral composition, crystallinity, and thermal conditions; it also affects the physical properties and brittleness of the reservoir [26,27,28]. The influence of amorphous SiO2 on reservoir properties can make a large difference in different evolution stages. From the beginning of diagenesis to the cryptocrystalline state, formation porosity has been shown to be reduced from about 45% to less than 25%, and the permeability declines to be difficult to be measured [29]. In the authigenic quartz stage, reservoir physical properties and brittleness increases instead, which improves reservoir fracturability [29]. Thus, it can be seen that amorphous SiO2 also plays a great impact on reservoir properties. If the influence of amorphous SiO2 on reservoirs can be clarified, it will be of great significance for evaluating shale oil reservoirs and fracturing potential, especially for immature lacustrine shale oil reservoirs.
Accurate calculation of amorphous SiO2 content is the key problem to understand the influence of amorphous SiO2 on reservoir properties. There are currently four methods for the quantitative analysis of amorphous SiO2 in heterogeneous systems. The first is chemical dissolution, which means removing minerals other than amorphous SiO2. However, chemical dissolution incudes crystalline, which affects the accuracy of quantitative analysis. The second is quantitative analysis using XRD as proposed by Lin (1997) [30]. Although the method is correct in theory, human error enters into in the quantification [31]. Thirdly, Chu (1998) proposed a new quantitative XRD method based on the increment method proposed by Popović et al. (1983) [32,33], but this method required preparation of a standard sample having a known mineral composition and proportions; the error was relatively large in the actual experiment. Fourth, Huang et al. (2015) established a calculation method for amorphous SiO2 in the Yanchang Formation shale of the Ordos Basin by using XRD combined with QEMSCAN analysis [34]. However, this method has two disadvantages. Firstly, it is too expensive to conduct large-scale tests. Secondly, the mineral composition obtained by QEMSCAN analysis can be understood as a volume percentage. Hence, it needs to be converted into a mass percentage, but the density of minerals was not determined in Huang et al. (2015) [34].
In view of the shortcomings of previous methods for calculating the content of amorphous silica [30,31,32,33,34], a new quantitative analysis method for amorphous silica content was established in this research, based on XRD and XRF analysis of core samples from the Lucaogou Formation in the Jimsar Depression. Through the analysis of the relationship between physical parameters, rock mechanical parameters, oil saturation, and amorphous silica content in shale strata, the effect of amorphous SiO2 on reservoir properties and its geological significance was determined.

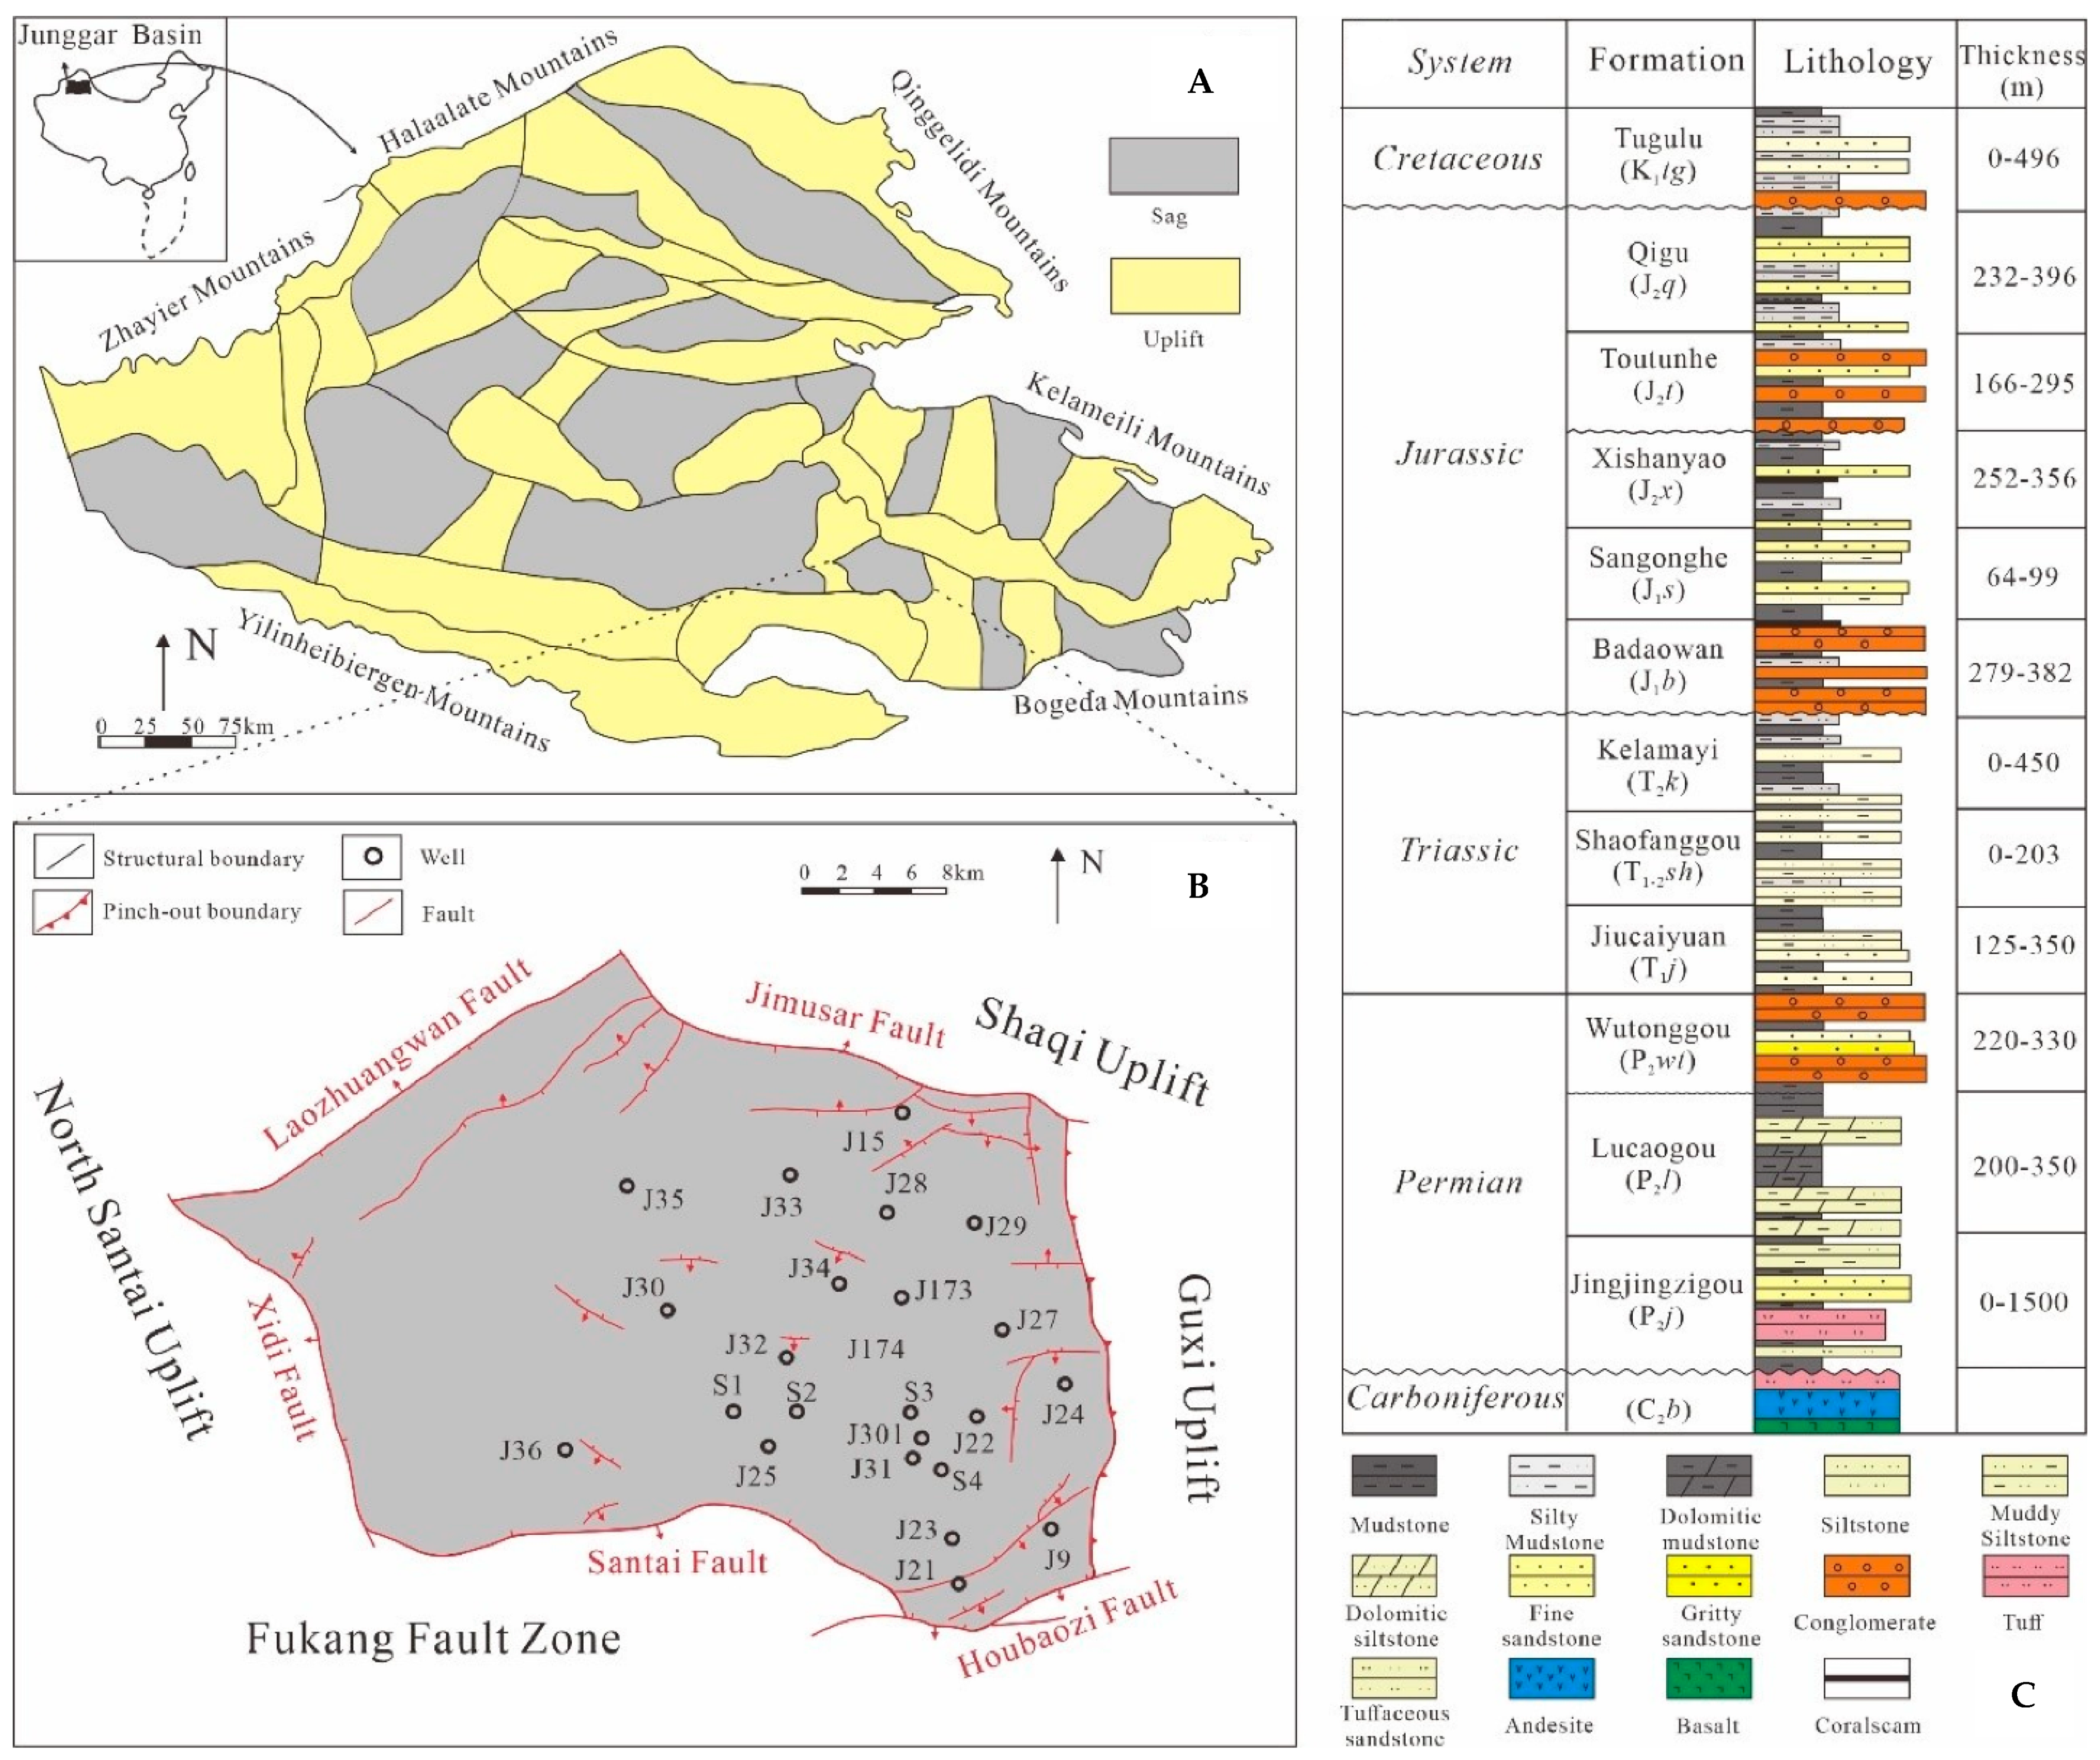
2. Geological Settings

The Junggar Basin is located in the northwestern part of China with an area of about 1.30 × 10⁵ km2 (Figure 1A); it is geotectonically located at the intersection of Kazakhstan, Siberian, and Tarim plates. The Jimusar Depression is in the southeast of Junggar Basin, covering an area of 1.278 × 10³ km2; it is surrounded by the Shaqi Uplift to the north, the Guxi Uplift to the east, the Fukang faults zone to the south, and the Santai Uplift to the west (Figure 1B). The periphery of the Jimsar Depression is bounded by six faults (Figure 1B). The Permian Lusaogou Formation has a thickness of 200~350 m and is in conformable contact with the lower Jingjingzigou Formation and in unconformable contact with the upper Wutonggou Formation (Figure 1C). The Lucaogou Formation is mainly composed of deep and semideep lake facies formed of fine-grained, mixed sedimentary rocks [35,36]. It was formed in an intracontinental rifted saline lake basin environment, accompanied by volcanic eruptions and hydrothermal activity [37,38]. Since September 2011, J25, J23, J28, J30, and other exploration and evaluation wells have been successively drilled in the Jimusar Depression, oil testing shows industrial potential, and shale oil was discovered in the Lucaogou Formation. After nine years of development, the calculated reserves of shale reservoir have reached 11.12 × 10⁸ t [39].

3. Materials and Methods

3.1. Materials

The samples of the Lucaogou Formation in this study are from four cored wells (S1–S4) in the Jimsar Depression (Figure 1B). We selected 42 samples that met experimental needs. Their lithology includes tuffaceous shale (also called siliceous shale), shale, dolomite, and dolomitic mudstone. Generally, the lithology can be divided into three lithofacies: tuffaceous shale lithofacies, transitional lithofacies (also called mixed lithofacies), and carbonate lithofacies [41,42].

3.2. Experimental Method

XRD analysis was completed at Sichuan Keyuan Engineering Technology Testing Center. XRF analysis, rock mechanics experiments, and reservoir physical properties analysis were completed at the Experimental Research Center of East China Oil and Gas Branch of Sinopec.

3.2.1. XRD and XRF Analysis

The mineral composition of samples was obtained by XRD, which was determined on the premise of deducting background values through the Jade 5.0 software package. The principle of XRD analysis is that different minerals show different XRD diffraction effects. Data calculated by the XRD accurately represents the relative content of each mineral. However, XRD cannot measure the content of amorphous silica because it shows no diffraction peaks.
The secondary X-rays were emitted when the X-ray irradiated on the material. Different elements show their specific secondary X-ray with certain features or wavelength characteristics. XRF analysis uses secondary X-rays to convert the data into specific elements and their abundance. Elemental Si occurs in quartz, plagioclase, k-feldspar, clay minerals, and amorphous silica.

3.2.2. Rock Mechanics Experiment

Samples were tested using a TAW-2000 computer-controlled electrohydraulic servo testing machine under constant confining pressure conditions. The size of test samples is 25 mm (diameter) × 50 mm (length). In the process of testing, strain rate was controlled by the DUOLI microcomputer control system, mostly 0.01–0.03, which was convenient to obtain smooth stress–strain curves. The compressive strength, Young’s modulus, and Poisson’s ratio can be calculated by the stress–strain curves.

3.2.3. Reservoir Physical Properties

The total porosity was obtained by calculating the difference between the bulk density and the skeleton density. Permeability was obtained by calculating the expansion of He with increasing pressure (5 MPa–30 Mpa) at a constant temperature. Oil saturation was measured by nuclear magnetic resonance (NMR).

3.3. A New Method for Calculating the Content of Amorphous SiO2

In this study, a new method for quantitative analysis of amorphous SiO2 in the Lucaogou Formation of the Jimusar Depression was established by using a combination of XRD and XRF. Through XRD analysis, the shale strata mainly consist of quartz, plagioclase, potash feldspar, dolomite, calcite, pyrite, and clay minerals (Figure 2A). Elemental Si is in quartz, plagioclase, potash feldspar, and clay minerals.
The combination of XRD and XRF can calculate amorphous silica as follows. Suppose the sample mass is M , where the mass of amorphous SiO2, quartz, plagioclase, K-feldspar, and clay minerals are respectively represented by m S i O 2 , m q u a r t z , m p l a g i o c l a s e , m K f e l d s p a r , and m c l a y .
According to XRD analysis:
m q u a r t z M m S i O 2 = W q u a r t z .
m p l a g i o c l a s e M m S i O 2 = W p l a g i o c l a s e
m K f e l d s p a r M m S i O 2 = W K f e l d s p a r
m c l a y M m S i O 2 = W c l a y
The W q u a r t z , W p l a g i o c l a s e , W K f e l d s p a r , and W c l a y represent the percentage of quartz, plagioclase, k-feldspar, and clay minerals measured by XRD analysis.
According to XRF analysis:
m S i O 2 × P S i S i O 2 + m q u a r t z × P S i - q u a r t z + m p l a g i o c l a s e × P S i - p l a g i o c l a s e M + m K f e l d s p a r × P S i K f e l d s p a r + m C l a y × P S i c l a y M = W Si
The mass percentages of Si in amorphous SiO2, quartz, plagioclase, k-feldspar, clay minerals, and the sample are represented by P S i S i O 2 , P S i q u a r t z , P S i p l a g i o c l a s e , P S i K f e l d s p a r , P S i c l a y , and W S i , respectively.
Placing Formulas (1)–(4) into Formula (5), thus creating Formula (6)
m S i O 2 × P S i S i O 2 + W q u a r t z × ( M m S i O 2 ) × P S i q u a r t z + W p l a g i o c l a s e × ( M m S i O 2 ) × P S i p l a g i o c l a s e M + W K f e l d s p a r × ( M m S i O 2 ) × P S i K f e l d s p a r + W c l a y × ( M m S i O 2 ) × P S i c l a y M = W S i
Formula (6) can be changed to Formula (7):
W S i O 2 = m S i O 2 M = W S i W q u a r t z × P S i q u a r t z W p l a g i o c l a s e × P S i p l a g i o c l a s e W K f e l d s p a r × P S i K f e l d s p a r W c l a y × P S i c l a y P S i S i O 2 W q u a r t z × P S i q u a r t z W p l a g i o c l a s e × P S i p l a g i o c l a s e W K f e l d s p a r × P S i K f e l d s p a r W c l a y × P S i c l a y
In Formula (7), only the mass percentage of element Si in clay minerals is difficult to determine, because the molecular formulas of other minerals are known. The molecular formulas of clay minerals are variable. Therefore, the ideal molecular formulas of different types of clay minerals are applied in this research. For the mass percentage of Si in mixed clay minerals, it is calculated according to the mixed layer ratio based on XRD measurements. Molecular formulas used for kaolinite, montmorillonite, chlorite, and illite are respectively Al4(Si4O10)(OH)8, Al4Si8O2(OH)2, Al6Si4O10(OH)8, and Al4(Si8O20)(OH)4. The mass percentages of element Si in these are 21.7%, 56.3%, 19.6%, and 31.1%, respectively. The P c l a y of the tuffaceous shale lithofacies, transitional lithofacies, and carbonate lithofacies samples can be calculated. Then, the contents of amorphous SiO2 in these samples can be calculated by Formula (7).

4. Results

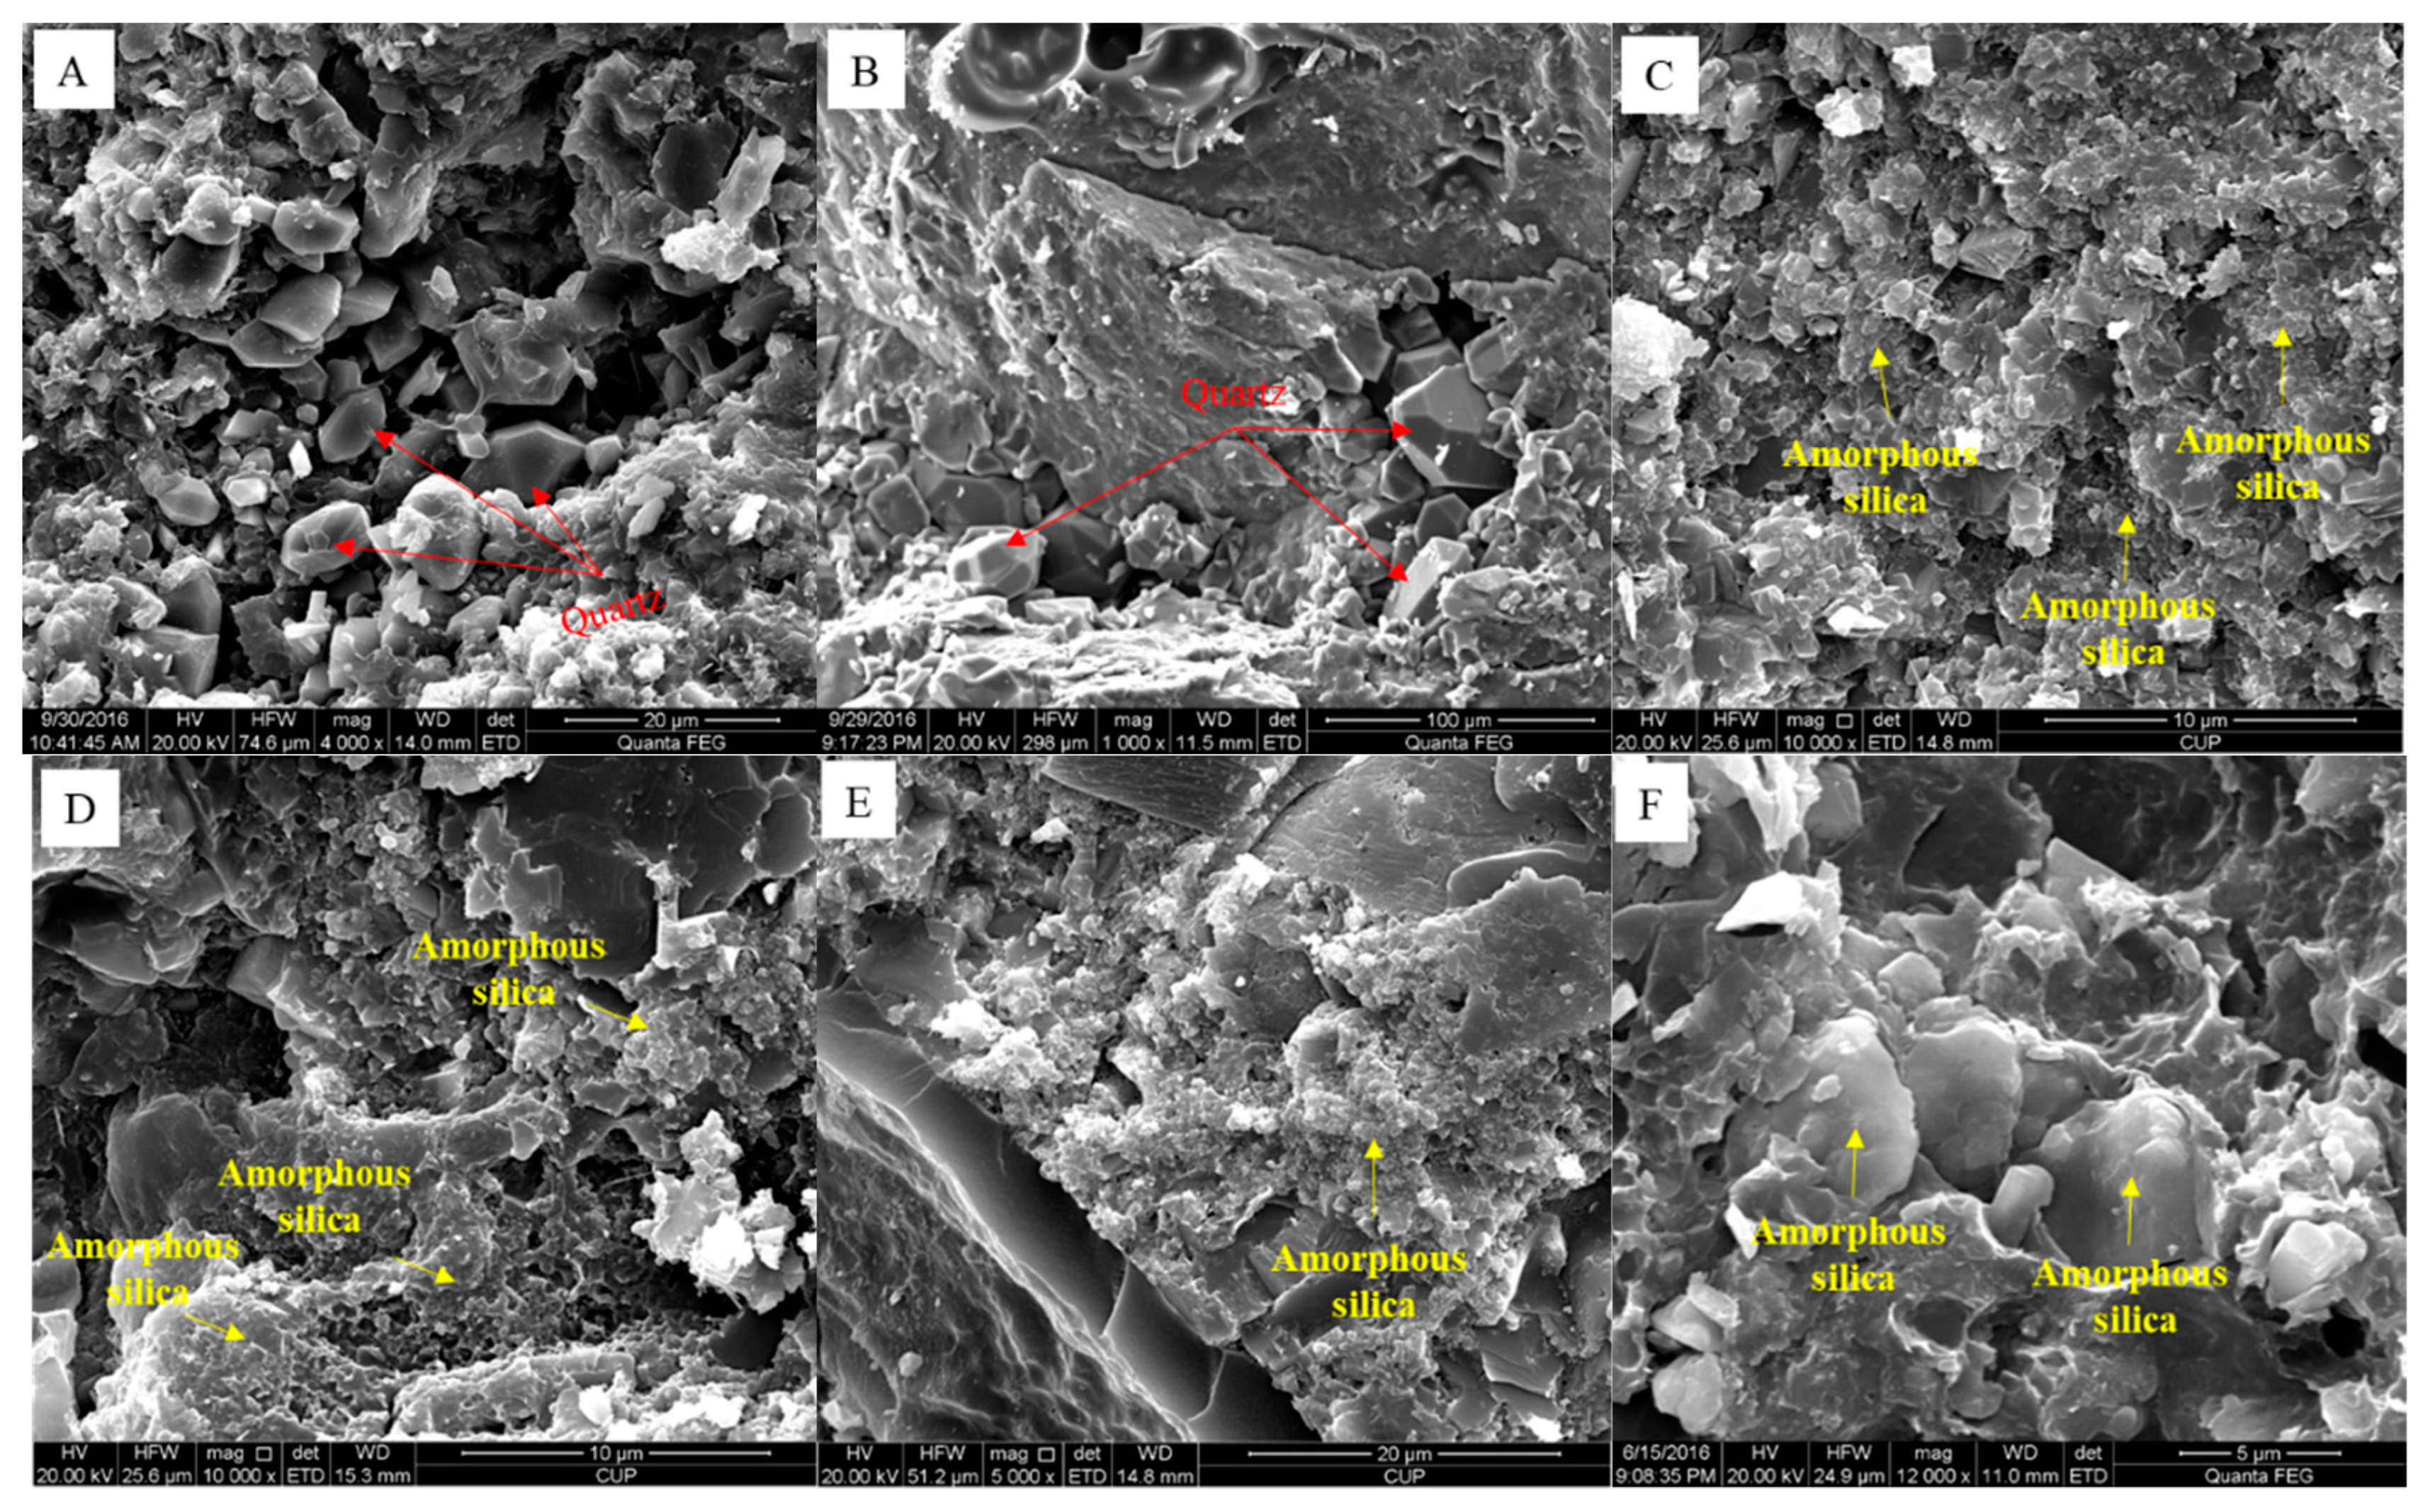
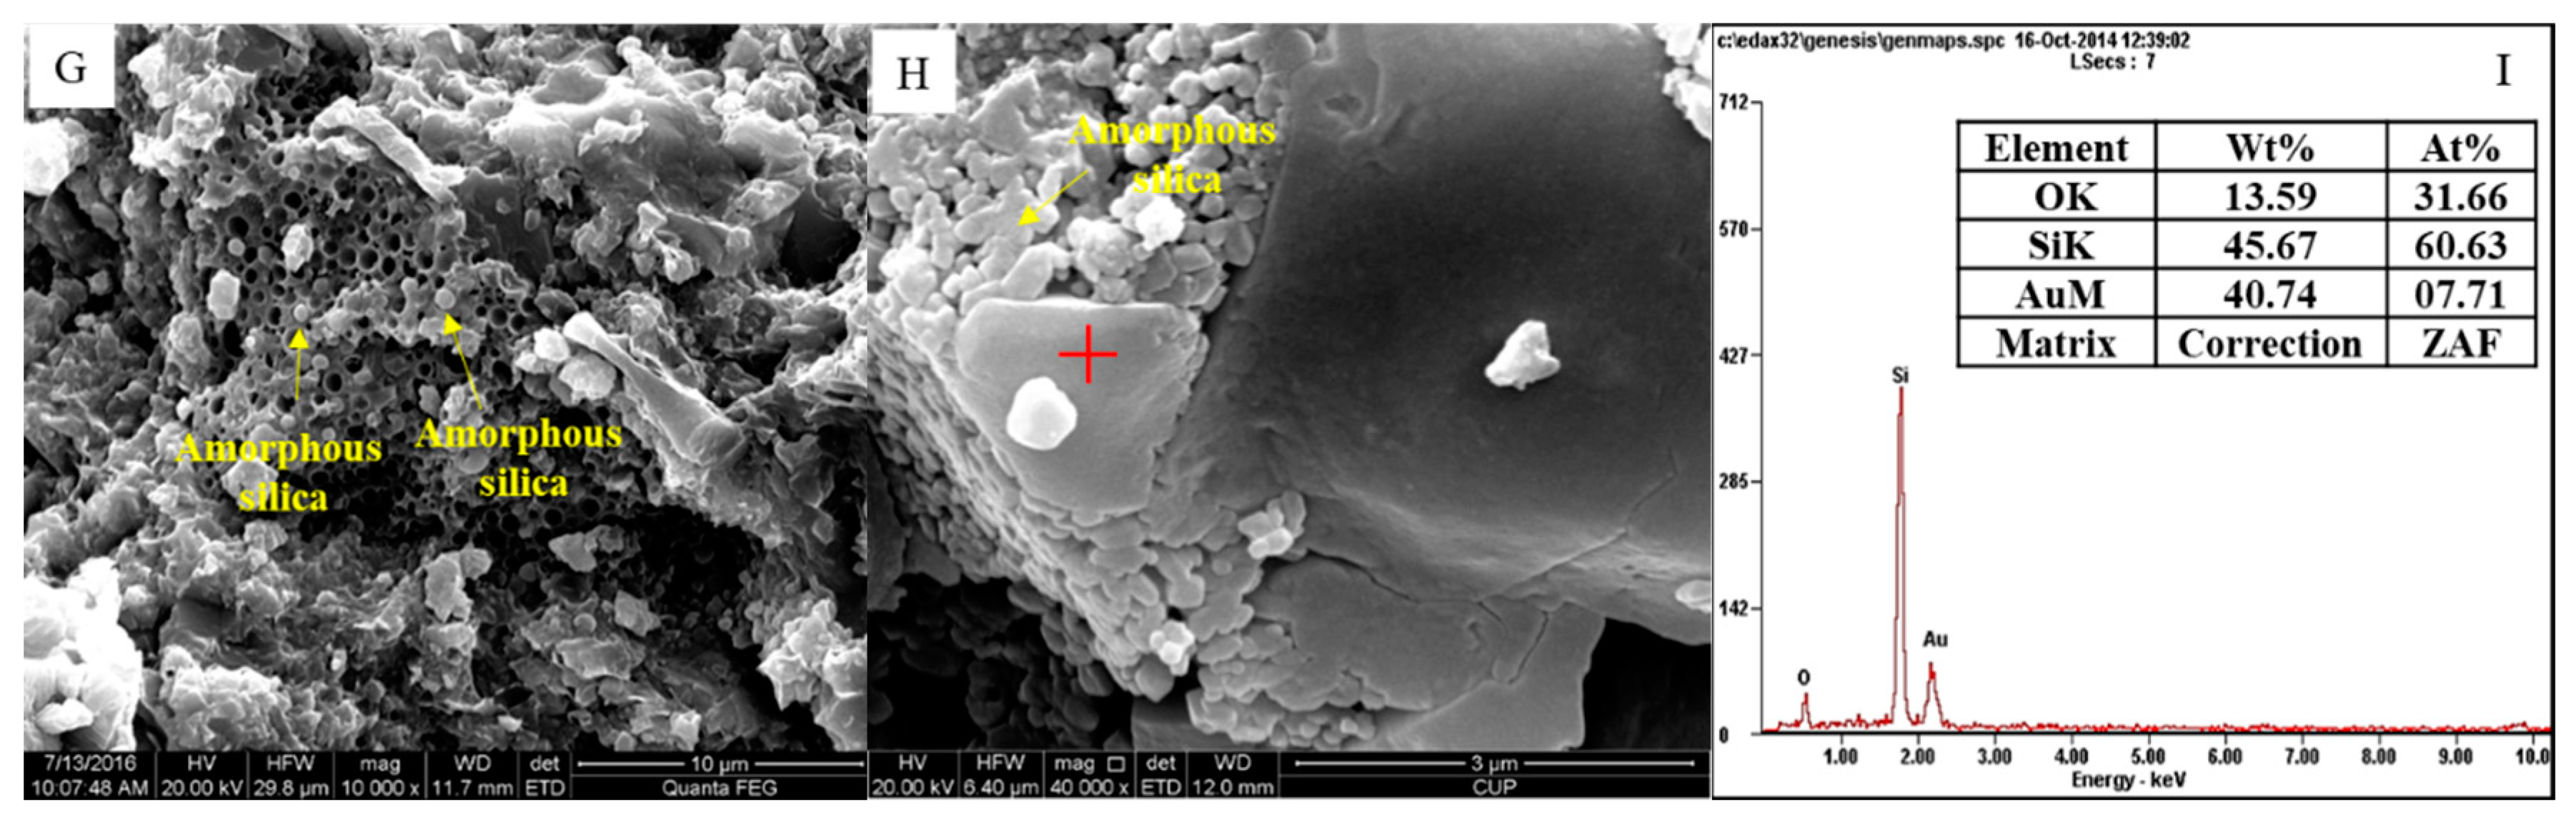
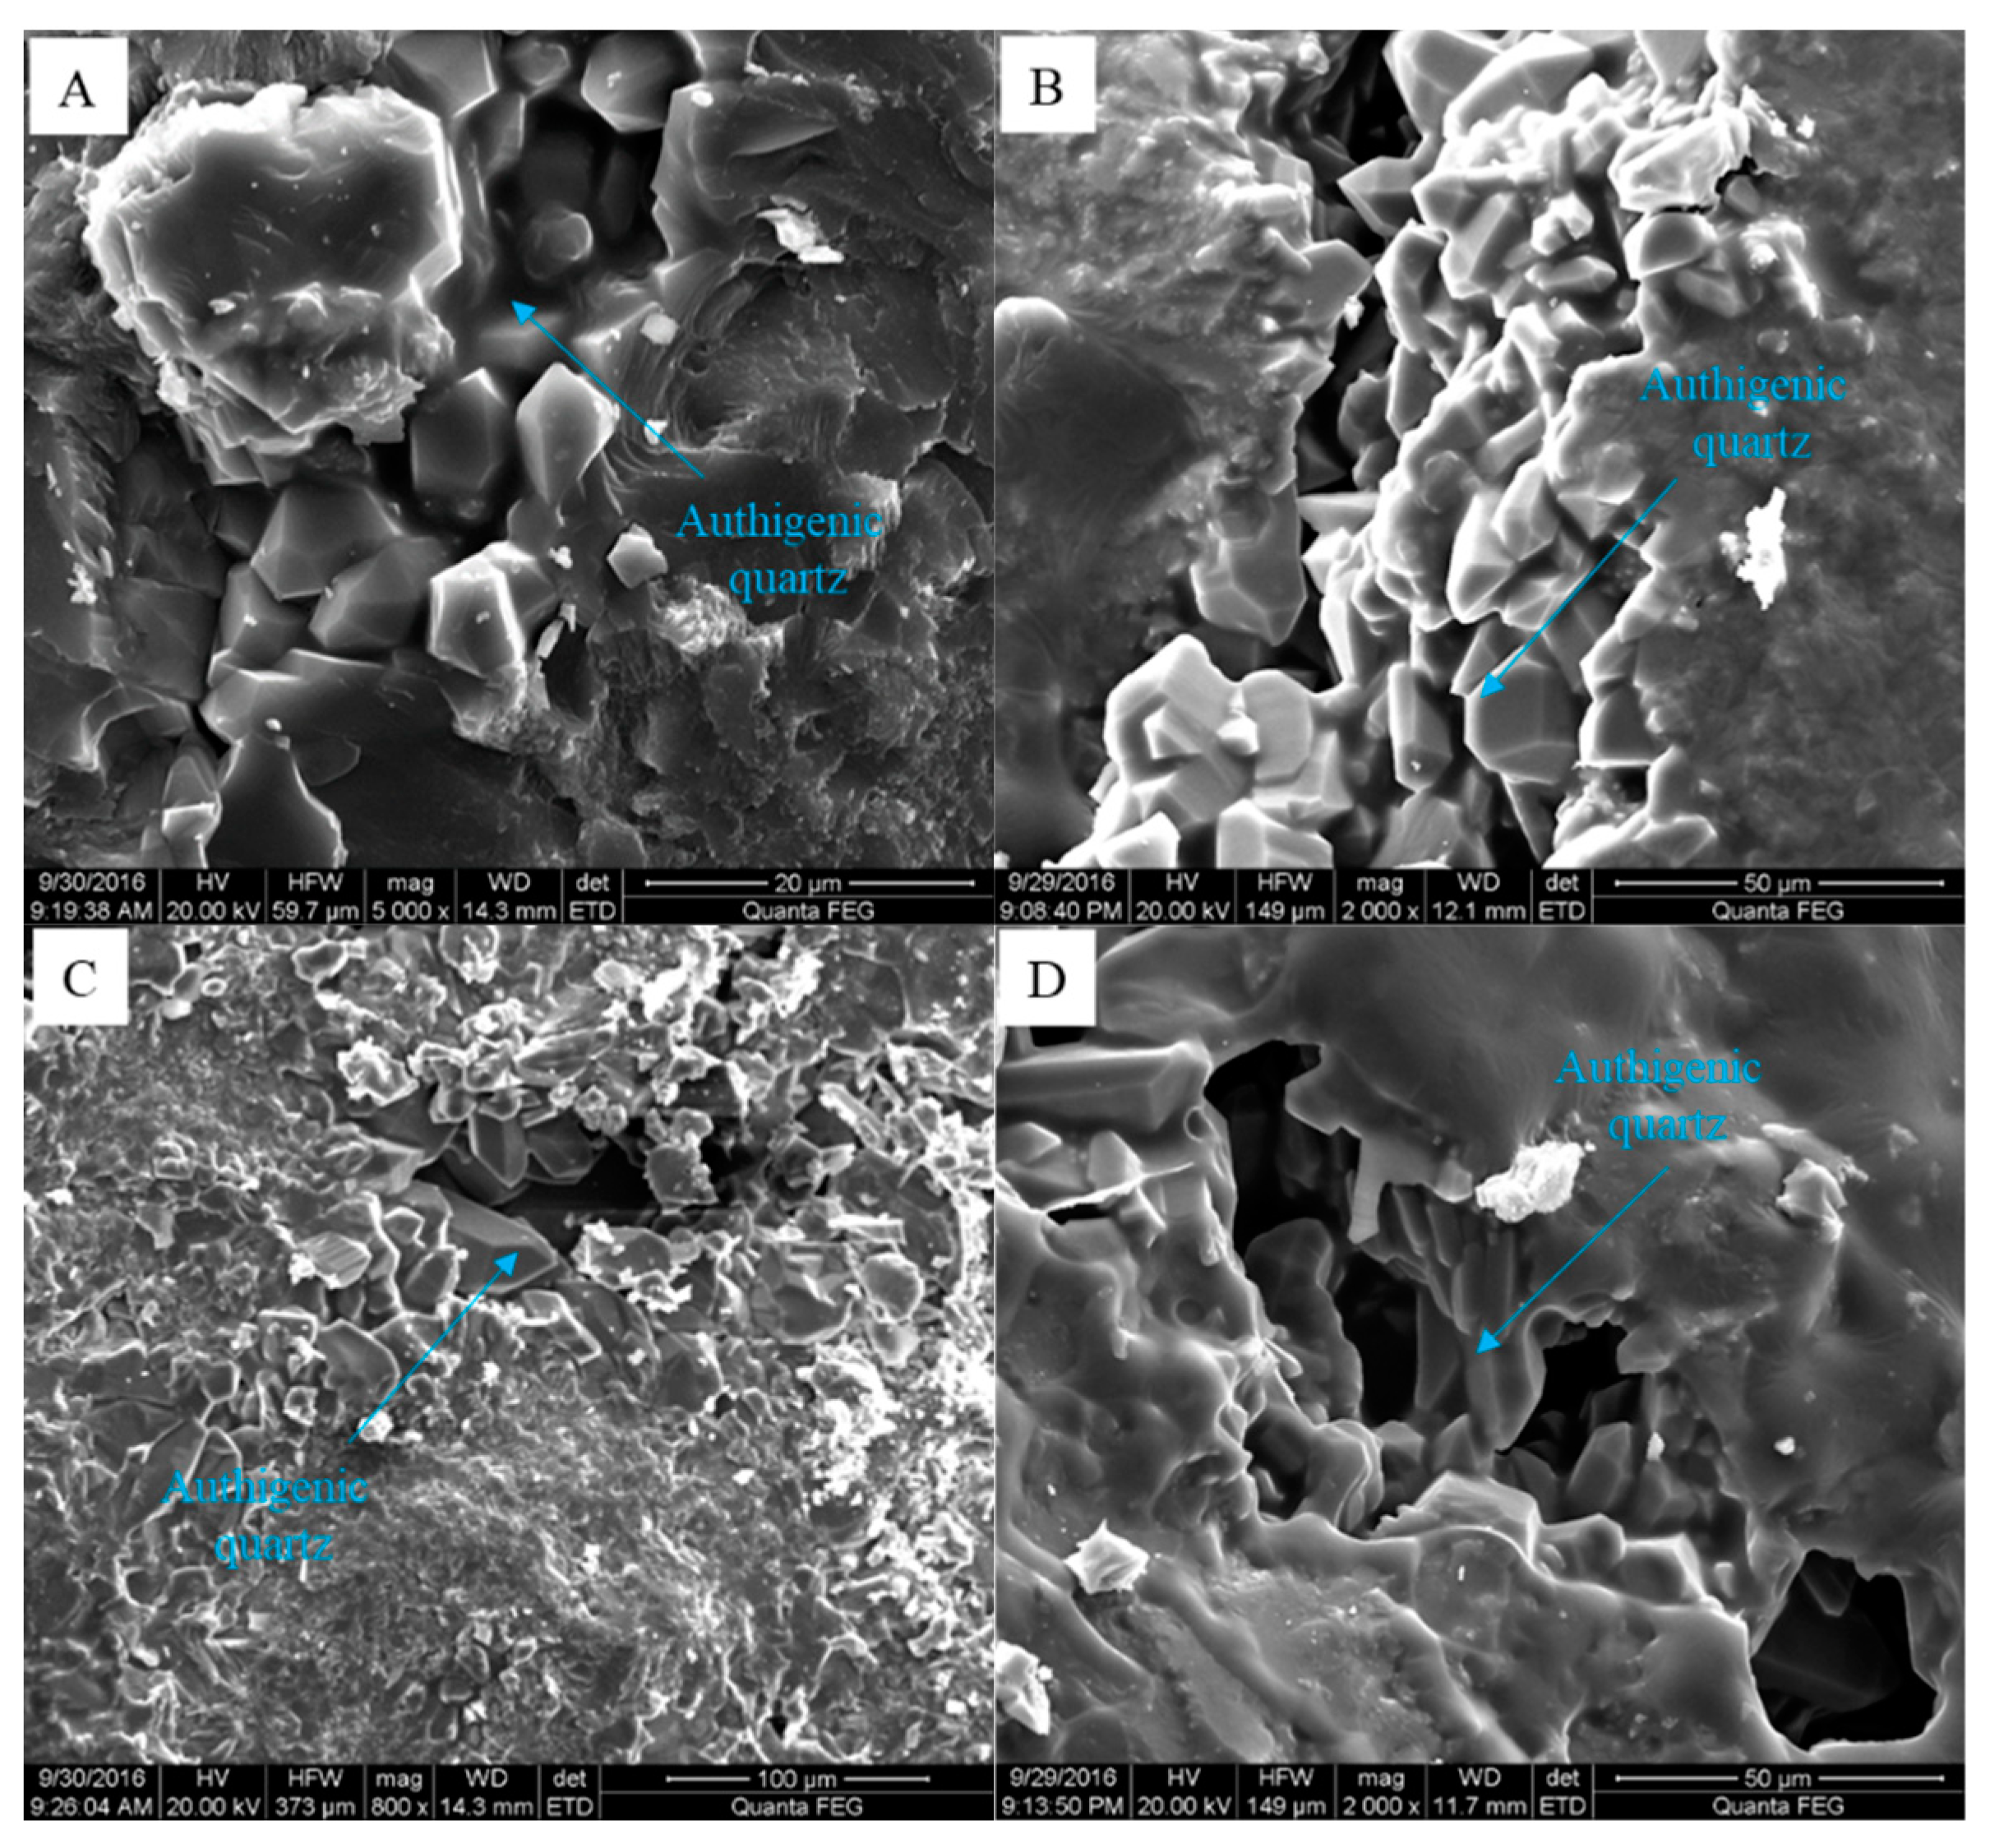
4.1. Occurrence and Characteristics of Amorphous SiO2

The shale strata of the Lucaogou Formation in the Jimusar Depression can be divided into tuffaceous shale lithofacies, transitional lithofacies, and carbonate lithofacies [41,42]. The tuffaceous shale lithofacies is mainly composed of feldspathic minerals including quartz and feldspar. The carbonate lithofacies mainly consists of dolomite and includes dolomite and argillaceous dolomite. The mineral composition and lithology of the transitional lithofacies is primarily a hybrid of the other two lithofacies. It can be seen by SEM that in addition to the development of authigenic quartz in the shale strata (Figure 3A,B), amorphous SiO2 is also present (Figure 3C–H). Amorphous SiO2 shows no fixed form and usually fills randomly between mineral grains (Figure 3C–E). Some of the amorphous SiO2 was wrapped in tuffaceous components (Figure 3F), and other forms were spherical or ellipsoid shapes having varying sizes (Figure 3G,H).

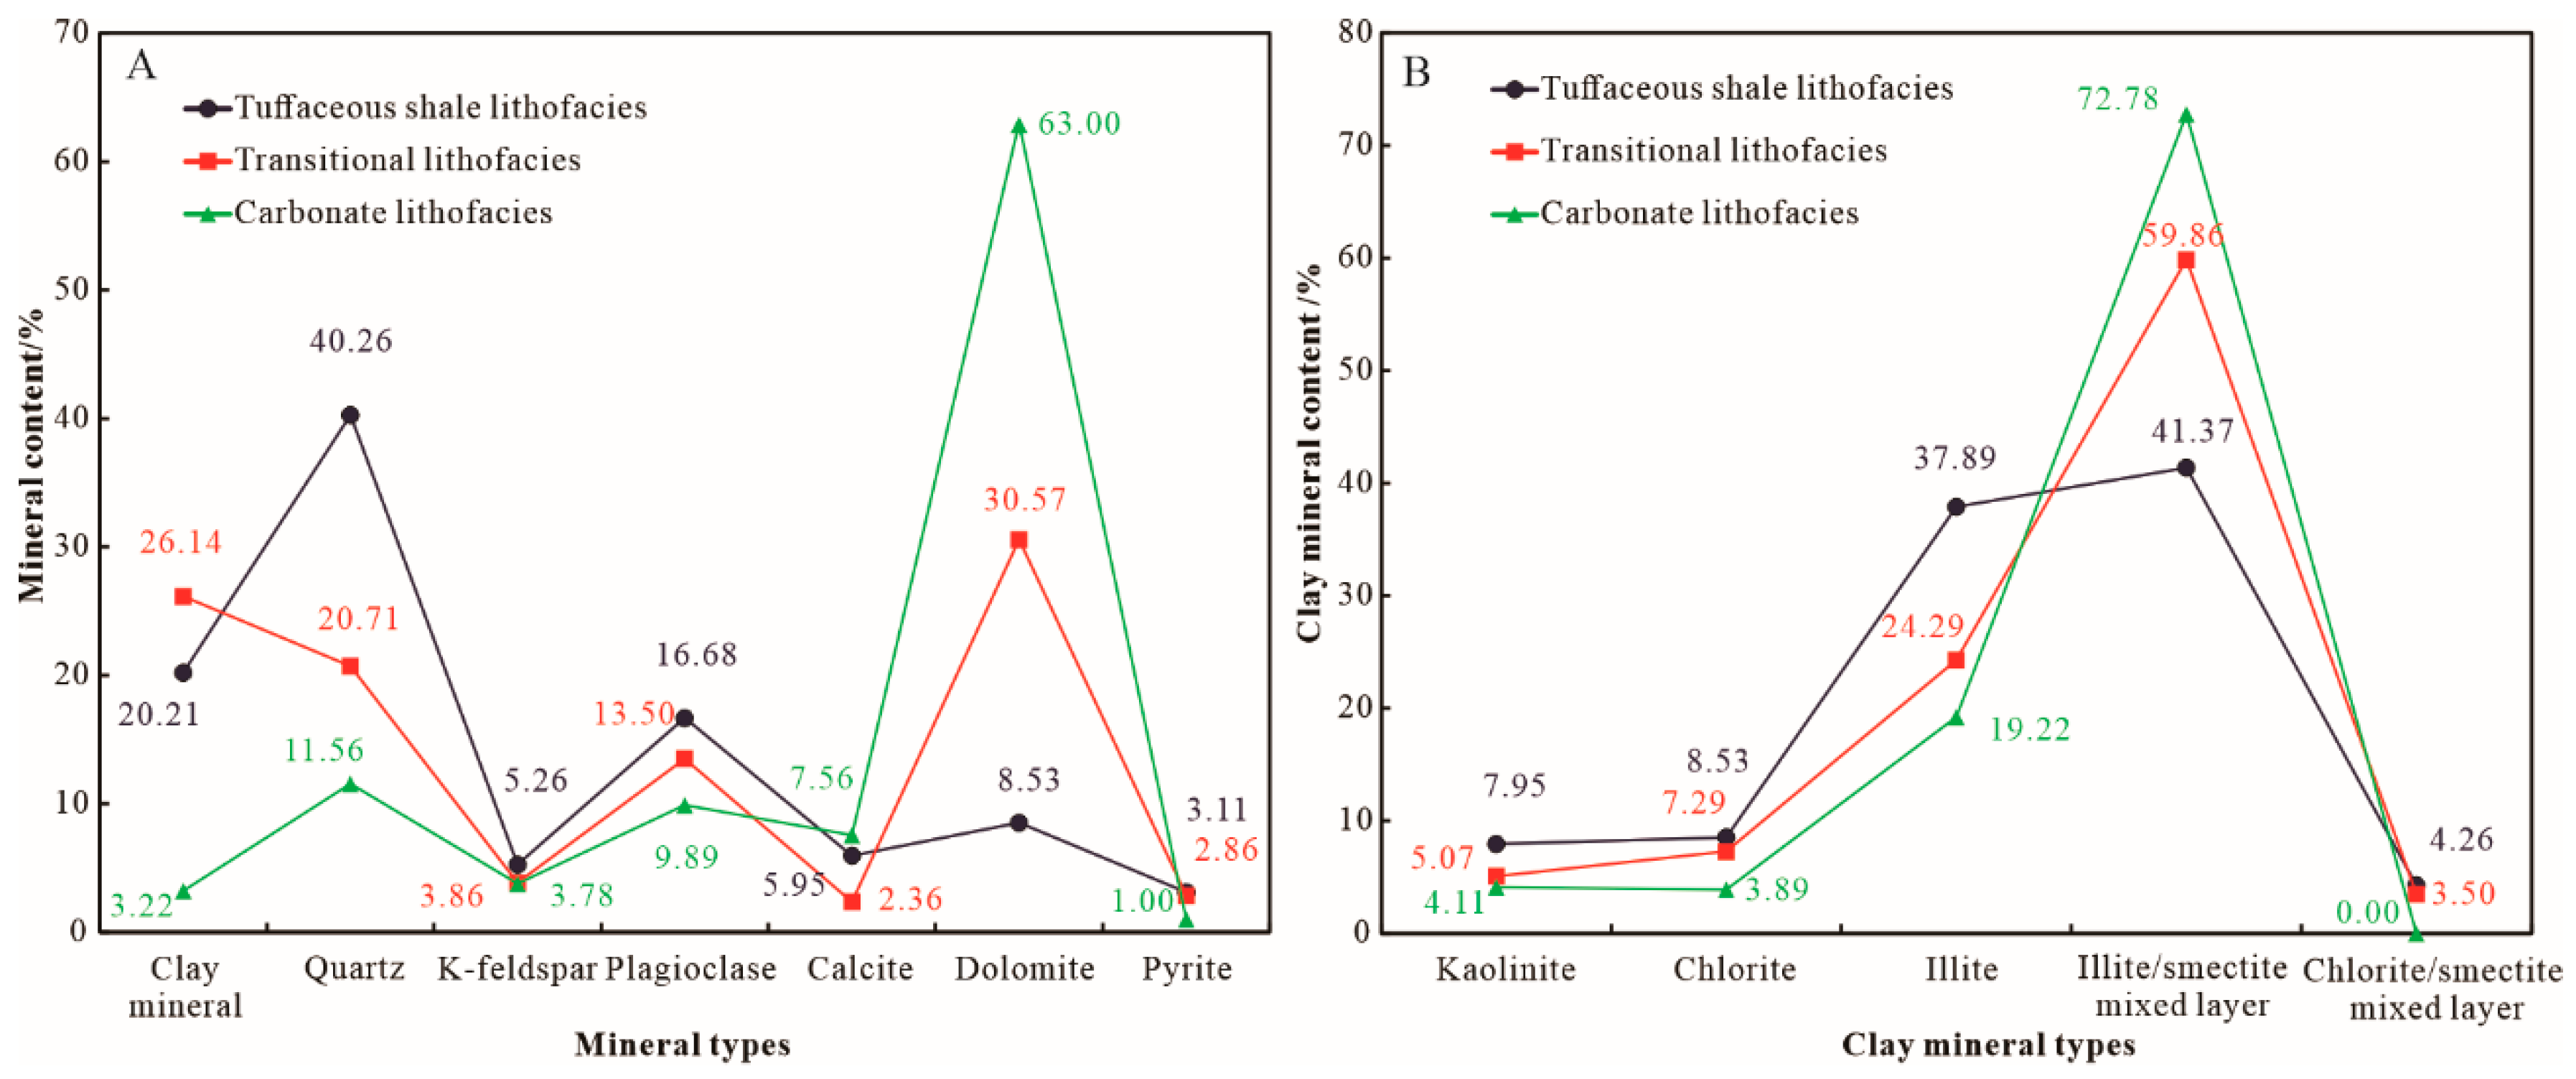
4.2. Composition Characteristics of Crystalline Minerals

Analysis of the XRD test results (Table 1) shows that the tuffaceous shale lithofacies samples exhibit the highest content of quartz-feldspathic minerals. The average content of quartz is as much as 40.26%; the average content of plagioclase and k-feldspar are as much as 16.68% and 5.26% respectively (Figure 2A). The carbonate lithofacies samples show the highest content of dolomite, reaching 63% on average. The transitional lithofacies samples present the highest content of clay minerals, which is as much as 26.14% (Figure 2A). In clay minerals, the content of the illite/smectite mixed layer is the highest, followed by illite. The average contents of the illite/smectite mixed layer in tuffaceous shale lithofacies, transitional lithofacies, and carbonate lithofacies are 41.37%, 59.86%, and 72.78%, respectively (Figure 2B). The tuffaceous lithofacies show the highest content of illite (average 37.89%), followed by transitional lithofacies (average 24.29%). The content of kaolinite, chlorite, and chlorite/smectite mixed layer is relatively low (Figure 2B).

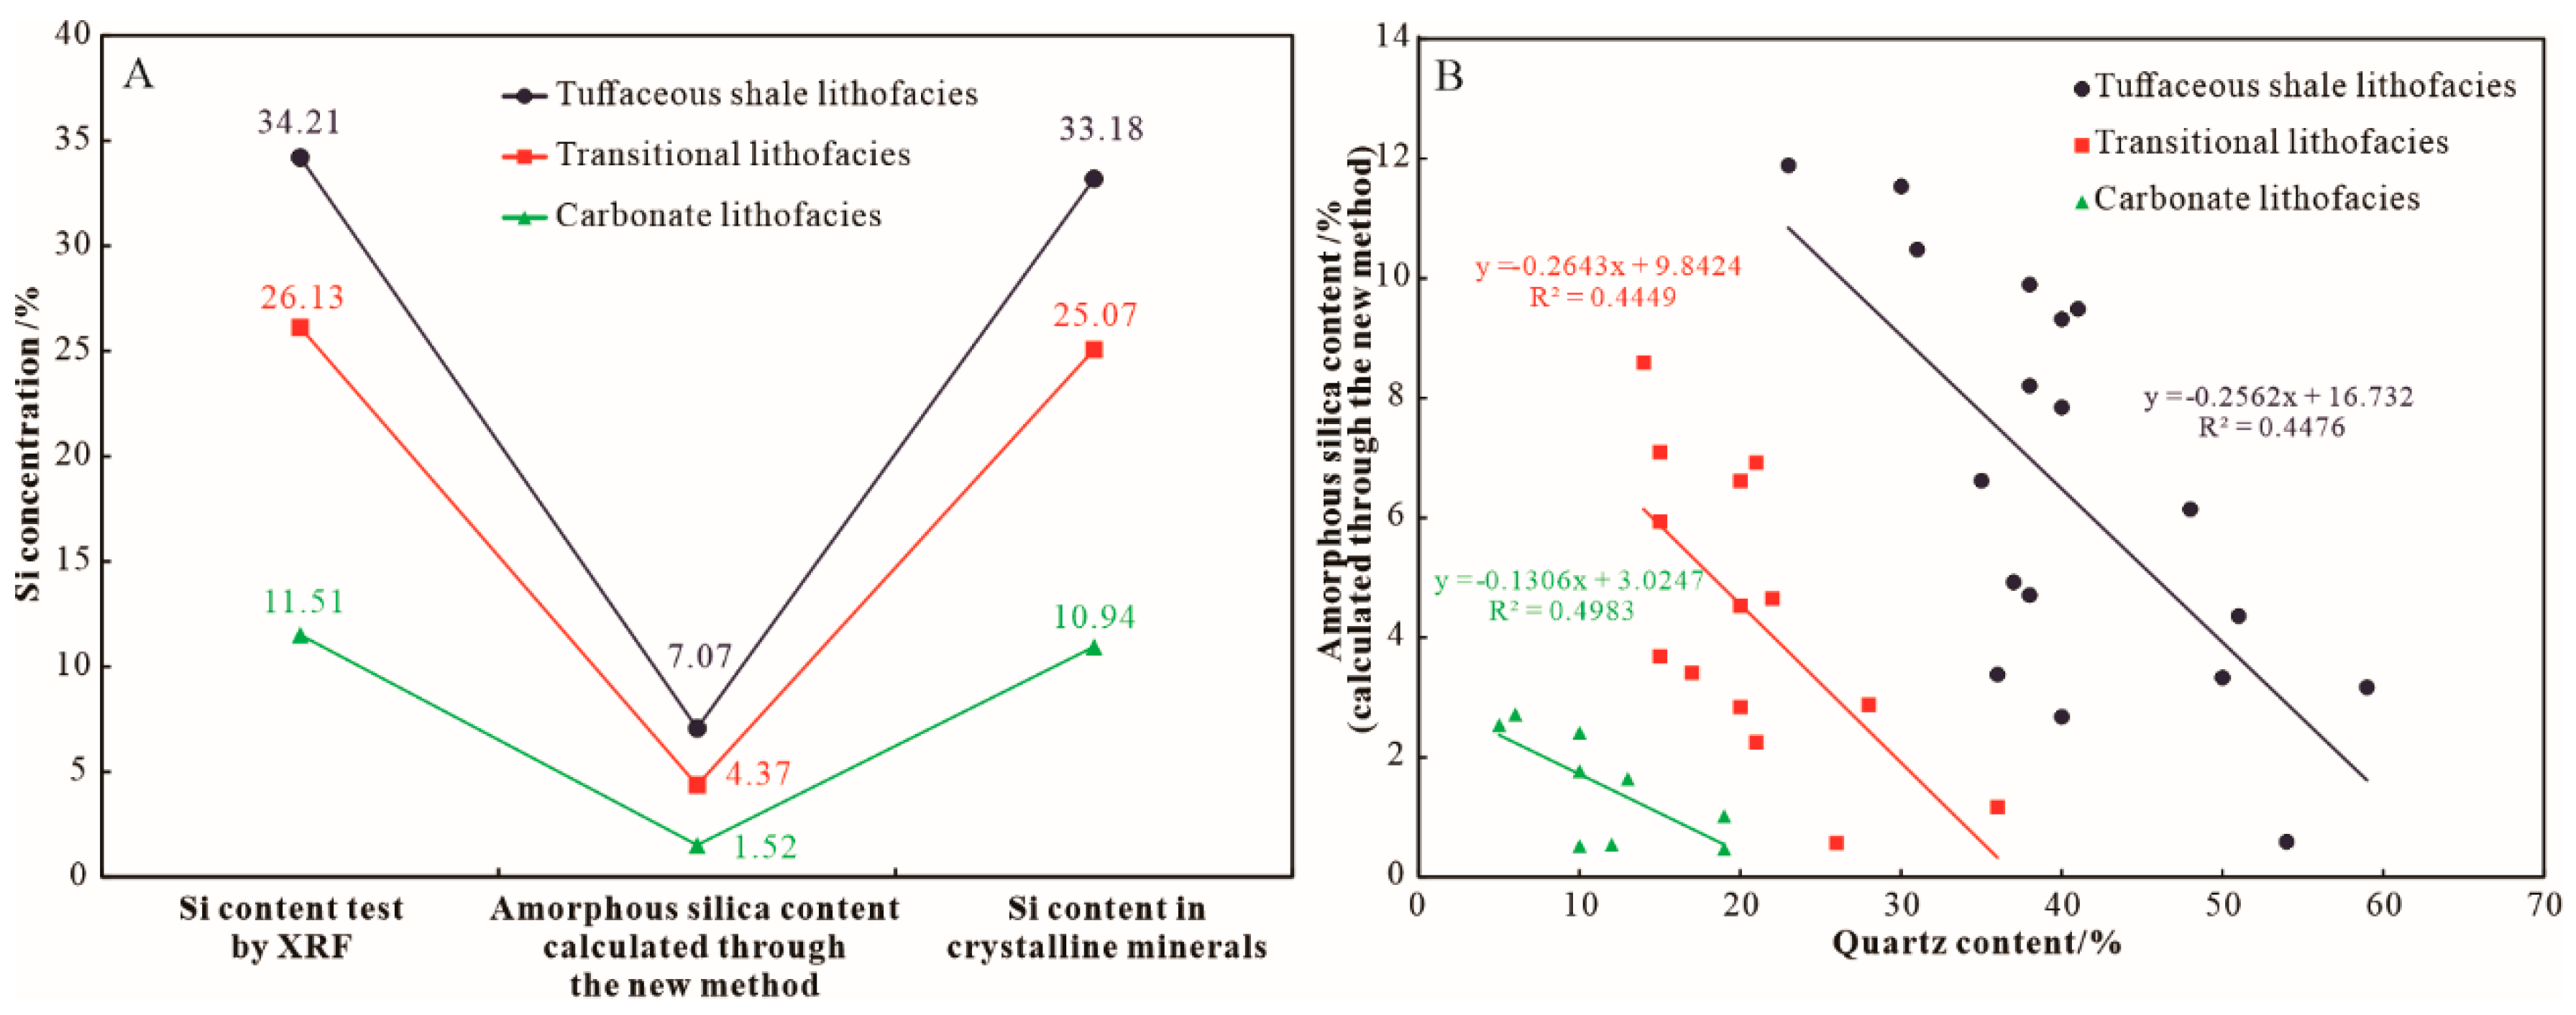
4.3. Content of Amorphous SiO2

Analysis of the XRF test results (Table 2) shows that the tuffaceous shale lithofacies samples have the highest content of Si, reaching 34.21% on average. As expected, the carbonate lithofacies samples exhibit the lowest content of Si, only 11.51% on average (Figure 4A). Moreover, the tuffaceous shale lithofacies samples also exhibit the highest values of Si in crystalline minerals calculated by the above method, reaching 33.18% on average (Figure 4A). According to the calculations, the shale strata of the Lucaogou Formation thereby contains a small amount of amorphous SiO2. The tuffaceous shale lithofacies samples show the highest content of amorphous SiO2, reaching an average of 7.07%, and the carbonate lithofacies samples show the lowest, only 1.52% (Figure 4A). Amorphous SiO2 has a certain negative correlation with crystalline quartz (Figure 4B). During burial diagenesis, amorphous silica will gradually convert to crystalline quartz. The silica in the Lucaogou Formation is mainly derived from tuffaceous materials alteration in previous studies [17,21]. Therefore, the content of amorphous SiO2 in the tuffaceous shale lithofacies sample is the highest among the three lithofacies. The content of silica in a sample is generally definite. Hence, the higher the content of crystalline quartz, the lower the content of amorphous SiO2.

5. Discussion

5.1. Advantages and Disadvantages of the New Method

Compared with the previous quantitative analysis methods for amorphous SiO2, the new method does not require chemical dissolution. The most important is that the cost of this method is much lower. The equipment required has already been widely used for a large-scale sample testing. This method also has some shortcomings: the ideal formula of clay mineral is used to calculate the mass percentage of elemental Si in clay minerals. Using illite as an example, its ideal structural molecular formula is Al4(Si8O20)(OH)4, and the mass percentage of Si is 31.1%. However, due to the fact that the illite in the actual sample contains impurities, its molecular formula is diverse, which introduces small errors into the calculated value.

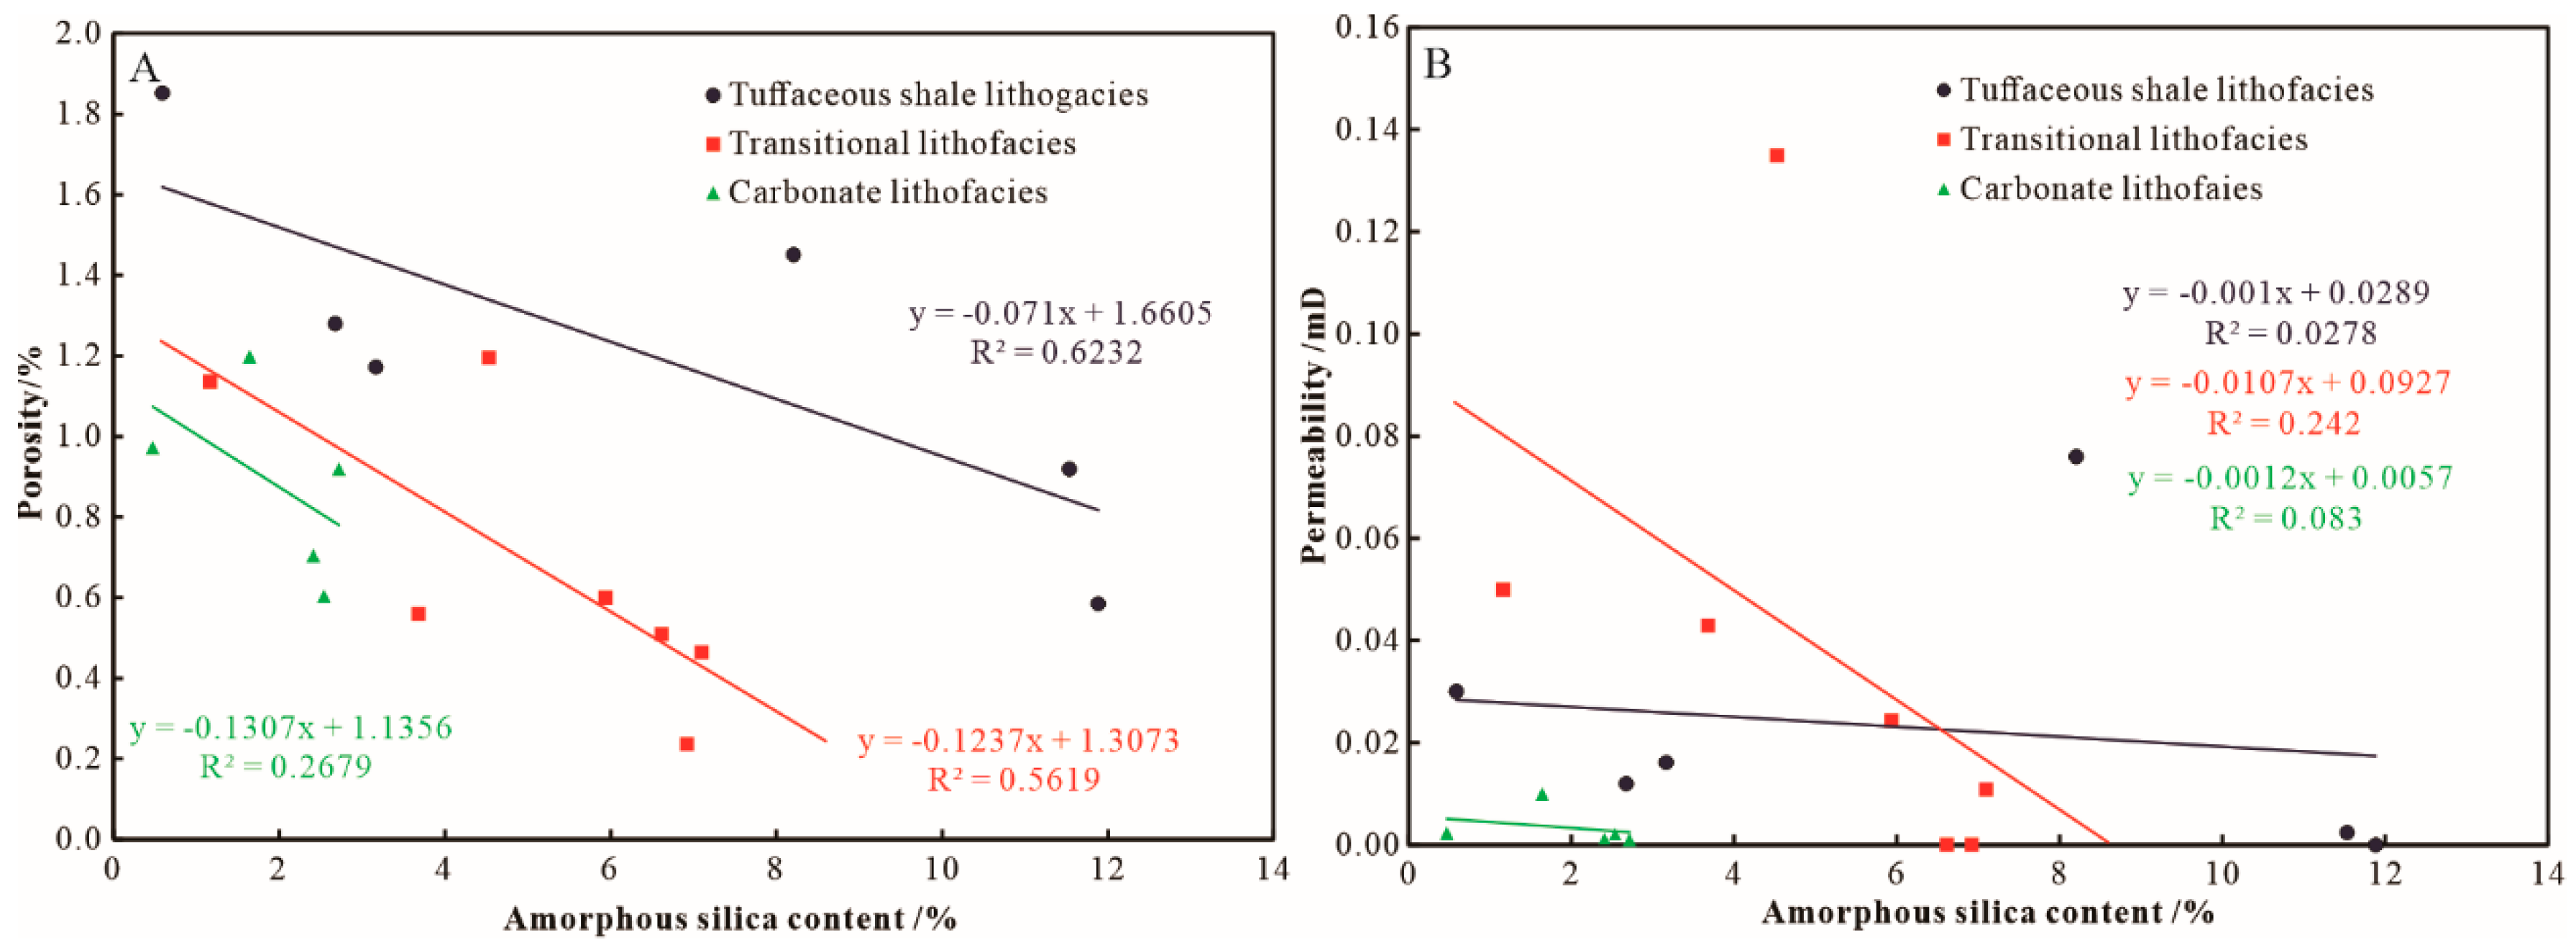
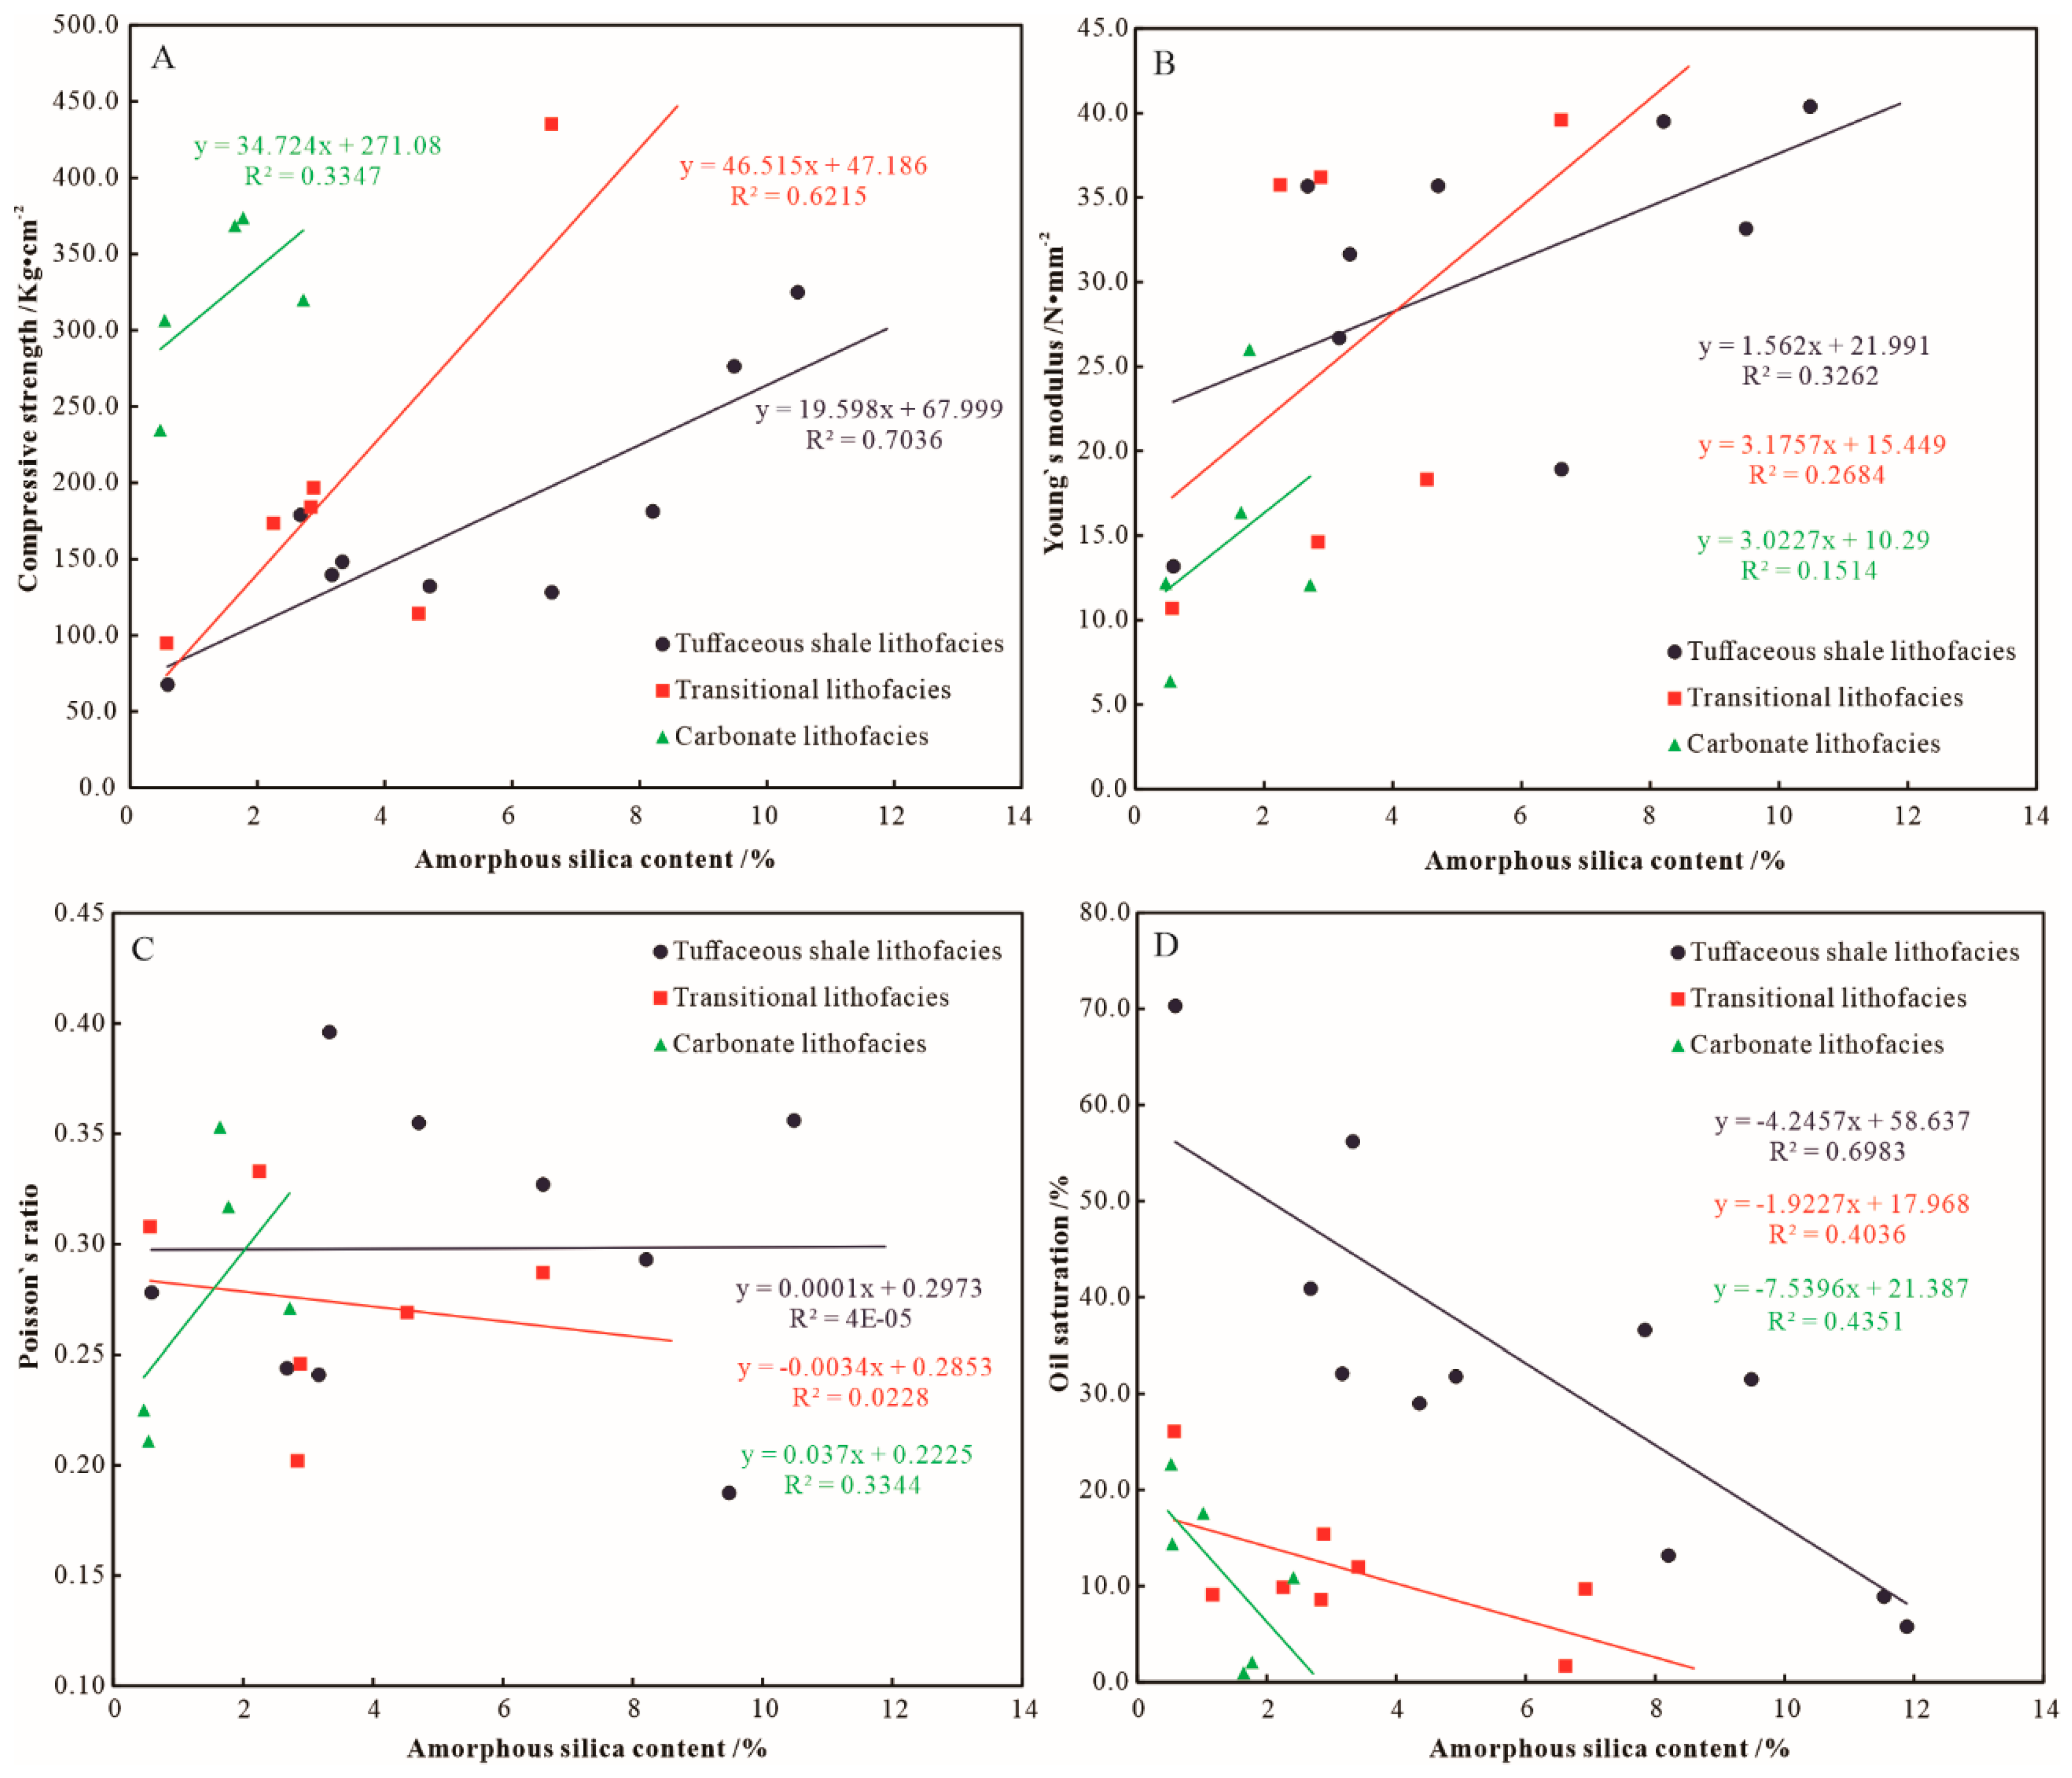
5.2. The Influence of Amorphous SiO2 on Reservoir Properties

The silica content is mainly derived from the alteration of tuffaceous material in the shale strata. It was found through the cross plot between the calculated amorphous SiO2 content and the reservoir physical property data that amorphous SiO2 content was negatively correlated with reservoir porosity and permeability (Figure 5). The content of amorphous SiO2 is negatively correlated with the content of crystalline quartz (Figure 4B). Hence, it indicates that the higher the content of crystalline quartz, the higher the porosity and permeability of the reservoir. Alteration is an important cause of pore formation in the Lucaogou Formation because it is a process of volume reduction for the total material [43,44]. From the perspective of density, it is easy to understand this process of volume reduction. The density of volcanic ash is only 2.3 g/cm3, while the mineral density after its alteration is much higher than 2.3 g/cm3, such as quartz 2.6–2.7 g/cm3. According to the law of conservation of mass, the overall volume must decrease. In other words, a large amount of silica was released during the alteration of tuffaceous components. Some silica crystallized to authigenic quartz, which increases the physical properties of the reservoir, while some silica did not crystallize and occurs between the grains in the form of amorphous SiO2 cement, which reduces the storage space of the reservoir.
The rock mechanical parameters of the Lucaogou Formation were measured by triaxial stress experiment under given confining pressure (Table 2). The calculated content of amorphous SiO2 was positively correlated with Young’s modulus and compressive strength (Figure 6A,B). It indicates that the higher the content of amorphous SiO2 was, the harder the samples were to be deformed and fractured. Amorphous SiO2 cements various grains together, making the reservoir more compacted. Amorphous SiO2 is negatively correlated with oil saturation (Figure 6D). It indicates that the existence of amorphous SiO2 is unfavorable for hydrocarbon enrichment. Previous studies suggested that volcanic ash would lead to algal blooms, and the alteration of volcanic ash would also generate a large number of pore spaces, which provided storage space for hydrocarbon enrichment. During volcanic eruptions, a large amount of volcanic ash was deposited with particulate organic matter and well preserved in a strong reduction environment. At last, they further condensed into kerogen and became source rocks with high organic matter. The organic matter type of Lucaogou Formation shale is mainly I~II1 type, which suggests an origin of bacteria, algae, and other aquatic organisms [19]. However, the presence of amorphous SiO2 makes the tuffaceous shale lithofacies lack sufficient storage space. Furthermore, part of hydrocarbon migrated to the adjacent carbonate lithofacies. On the whole, amorphous SiO2 in Lucaogou Formation in Jimsar Depression is not high in content (Figure 4A and Table 2), which is merely the same to that of K-feldspar. Therefore, the changes in reservoir properties are likely to be caused by other factors, such as the development of laminae, the direction of stress in triaxial stress experiments, and so on. In the early diagenetic stage (Ro is 0.35%~0.5%), amorphous SiO2 has already started to crystallize to quartz in large quantities [23,24]. It can be inferred that the amorphous SiO2 should have a greater physical influence on shale samples in the earlier diagenetic stage.

5.3. Factors Controlling the Conversion of Amorphous SiO2 into Quartz

The conversion of amorphous SiO2 into quartz in diagenesis was affected by many factors, including temperature, properties of fluid medium, burial, and formation pressure, etc. [45,46,47,48]. It was proposed that the hydrocarbon injection and formation overpressure can inhibit the formation of authigenic quartz [46,47,48]. However, in the same one sample, both authigenic quartz and amorphous SiO2 occur (Figure 3 and Figure 7), the contents of amorphous silica in the four samples (Figure 7A–D) are 6.921%, 10.484%, 11.535%, and 9.318% (Table 2). It means temperature, fluid properties, and formation pressure was not the key factor. It was found that authigenic quartz tended to develop in pores, holes, or fractures through a large number of scanning electron microscope observations (Figure 7). It was a reasonable presumption that the authigenic quartz can only grow when there was space. Without growth space, it can only be amorphous SiO2 without crystal morphological characteristics. The silica in shale strata of Lucaogou Formation mainly came from the tuffaceous material alteration. A large amount of silica was released. When these pores were filled with a large amount of amorphous SiO2, there was no room left for the growth of the authigenic quartz. Hence, the amorphous SiO2 merely existed in the amorphous state. Only when the silica-rich fluid entered one of those large pores, holes, or cracks was there enough space for silica to grow to authigenic quartz.

6. Conclusions

The amorphous SiO2 in the shale strata of the Lucaogou Formation of the Jimusar Depression had no specific form and was usually mounded among mineral grains. XRD analysis measured the percentage of crystalline minerals, while XRF measured the percentage of elemental Si. Therefore, a new quantitative analysis method for calculating the percentage of amorphous SiO2 was established by combining the two methods. The content of amorphous SiO2 in the tuffaceous shale lithofacies of the Lucaogou Formation was the highest, with an average of 7.07%.
The calculation confirmed that the higher the content of amorphous SiO2, the lower the porosity of the reservoir. Moreover, amorphous SiO2 was found to be inversely proportional to the compressive strength, Young’s modulus, and oil saturation of the reservoir. It indicates that amorphous SiO2 reduces the physical properties of the reservoir, increases the plasticity, and increases the difficulty of fracturing during development for hydrocarbon extraction. The lack of growing space is the key factor affecting the conversion of amorphous SiO2 into crystalline quartz. Thus, the existence of amorphous SiO2 is harmful to shale reservoirs in many ways and has economic impact deleterious to oil and gas exploration and development.

Author Contributions

Conceptualization, Q.C.; methodology, K.S.; software, K.S. and C.C.; investigation, K.S.; resources, Q.C. and G.C.; writing—original draft preparation, K.S.; writing—review and editing, K.S., Y.L., G.C. and C.C.; supervision, Q.C. and G.C.; project administration, Q.C. and G.C. All authors have read and agreed to the published version of the manuscript.

Funding

This research was funded by National Science and Technology Major Project Foundation of China (2016ZX05006-003-002; 2016ZX05014-002); National Nature Science Foundation of China (41802157); Fundamental Research Funds for the Central Universities, China University of Geoscience (Wuhan) (102-162301202627); China Postdoctoral Science Foundation (2016M592265).

Conflicts of Interest

The authors declare no conflict of interest.

References

  1. Zhang, J.C.; Xu, B.; Nie, H.K.; Wang, Z.Y.; Lin, T. Exploration potential of shale gas resources in China. Natl. Gas Ind. 2008, 28, 136–140. [Google Scholar]
  2. Guo, T.L.; Zhang, H.R. Formation and enrichment mode of Jiaoshiba shale gas field, Sichuan Basin. Pet. Explor. Dev. 2014, 41, 31–40. [Google Scholar] [CrossRef]
  3. Zou, C.; Zhao, Q.; Dong, D.; Yang, Z.; Qiu, Z.; Liang, F.; Wang, N.; Huang, Y.; Duan, A.; Zhang, Q.; et al. Geological characteristics, main challenges and future prospect of shale gas. J. Natl. Gas Geosci. 2017, 2, 273–288. [Google Scholar] [CrossRef]
  4. Jin, Z.J.; Nie, H.K.; Liu, Q.Y.; Zhao, J.H.; Jiang, T. Source and seal coupling mechanism for shale gas enrichment in upper Ordovician Wufeng Formation—Lower Silurian Longmaxi Formation in Sichuan Basin and its periphery. Mar. Pet. Geol. 2018, 97, 78–93. [Google Scholar] [CrossRef]
  5. Chen, X.; Fan, J.X.; Wang, W.H.; Wang, H.Y.; Nie, H.K.; Shi, X.W.; Wen, Z.D.; Chen, D.Y.; Li, W.J. Stage-progressive distribution pattern of the Lungmachi black graptolitic shales from Guizhou to Chongqing, Central China. Sci. China Earth Sci. 2017, 60, 1133–1146. [Google Scholar] [CrossRef]
  6. Bowker, K.A. Barnett Shale gas production, Fort Worth Basin: Issues and discussion. AAPG Bull. 2007, 91, 523–533. [Google Scholar] [CrossRef]
  7. Jarvie, D.M.; Hill, R.J.; Ruble, T.E.; Pollastro, R.M. Unconventional shale-gas systems: The Mississippian Barnett shale of north-central Texas as one model for thermo-genic shale-gas assessment. AAPG Bull. 2007, 91, 475–499. [Google Scholar] [CrossRef]
  8. Ruyue, W.; Wenlong, D.; Dajian, G.; Jigao, L.; Xinghua, W.; Shuai, Y. Gas preservation conditions of marine shale in northern Guizhou area: A case study of the Lower Cambrian Niutitang Formation in the Cen’gong block, Guizhou Province. Oil Gas Geol. 2016, 37, 45–55. [Google Scholar]
  9. Wang, R.; Hu, Z.; Sun, C.; Liu, Z.; Zhang, C.; Gao, B.; Du, W.; Zhao, J.; Tang, W. Comparative analysis and discussion of shale reservoir characteristics in the Wufeng-Longmaxi and Niutitang formations. Pet. Geol. Exp. 2018, 40, 639–649. [Google Scholar]
  10. Dong, T.; Harris, N.B.; Ayranci, K.; Yang, S. The impact of rock composition on geomechanical properties of a shale formation: Middle and Upper Devonian Horn River Group shale, Northeast British Columbia, Canada. AAPG Bull. 2017, 101, 177–204. [Google Scholar] [CrossRef]
  11. Guo, X.S.; Hu, D.F.; Wen, Z.D.; Liu, R.B. Major factors controlling the accumulation and high productivity in marine shale gas in the Lower Paleozoic of Sichuan Basin and its periphery: A case study of the Wufeng-Longmaxi Formation of Jiaoshiba area. Geol. China 2014, 41, 893–901. [Google Scholar]
  12. Lu, L.; Qin, J.; Shen, B.; Teng, G.; Liu, W.; Zhang, Q. Biogenic origin and hydrocarbon significance of siliceous shale from the Wufeng-Longmaxi formations in Fuling area, southeastern Sichuan Basin. Pet. Geol. Exp. 2016, 38, 460–472. [Google Scholar]
  13. Lu, L.; Qin, J.; Shen, B.; Teng, G.; Liu, W.; Zhang, Q. The origin of biogenic silica in siliceous shale from Wufeng-Longmaxi Formation in the Middle and Upper Yangtze region and its relationship with shale gas enrichment. Earth Sci. Front. 2018, 25, 226–236. [Google Scholar]
  14. Zhao, J.; Jin, Z.; Jin, Z.; Wen, X.; Geng, Y.K.; Yan, C.N. The genesis of quartz in Wufeng-Longmaxi gas shales, Sichuan Basin. Natl. Gas Geosci. 2016, 27, 377–386. [Google Scholar]
  15. Wang, S.; Zou, C.; Dong, D.; Wang, Y.; Huang, J.; Guo, Z. Biogenic silica of organic-rich shale in Sichuan Basin and its significance for shale gas. Acta Sci. Nat. Univ. Pekin. 2014, 50, 476–486. [Google Scholar]
  16. Liu, G.; Zhai, G.; Zou, C.; Cheng, L.; Guo, X.; Xia, X.; Shi, D.; Yang, Y.; Zhang, C.; Zhou, Z. A comparative discussion of the evidence for biogenic silica in Wufeng-Longmaxi siliceous shale reservoir in the Sichuan basin, China. Mar. Pet. Geol. 2019, 109, 70–87. [Google Scholar] [CrossRef]
  17. Liu, G.; Zhai, G.; Huang, Z.; Zou, C.; Xia, X.; Shi, D.; Zhou, Z.; Zhang, C.; Chen, R.; Yu, S.; et al. The effect of tuffaceous material on characteristics of different lithofacies: A case study on Lucaogou Formation fine-grained sedimentary rocks in Santanghu Basin. J. Pet. Sci. Eng. 2019, 179, 355–377. [Google Scholar] [CrossRef]
  18. Xianzheng, Z.H.; Lihong, Z.H.; Xiugang, P.U.; Fengming, J.; Wenzhong, H.; Dunqing, X.; Shiyue, C.H.; Zhannan, S.H.; Zhang, W.; Fei, Y.A. Geological characteristics of shale rock system and shale oil exploration breakthrough in a lacustrine basin: A case study from the Paleogene 1st sub-member of Kong 2 Member in Cangdong sag, Bohai Bay Basin, China. Pet. Explor. Dev. 2018, 45, 377–388. [Google Scholar]
  19. Liu, G.; Liu, B.; Huang, Z.; Chen, Z.; Jiang, Z.; Guo, X.; Li, T.; Chen, L. Hydrocarbon distribution pattern and logging identification in lacustrine fine-grained sedimentary rocks of the Permian Lucaogou Formation from the Santanghu basin. Fuel 2018, 222, 207–231. [Google Scholar] [CrossRef]
  20. Liu, G.H.; Huang, Z.L.; Guo, X.B.; Liu, Z.Z.; Gao, X.Y.; Chen, C.C.; Zhang, C.L. The research of SiO2 occurrence in mud shale reservoir of the Yanchang formation in Ordos Basin. Acta Geol. Sin. 2016, 90, 1016–1029. [Google Scholar]
  21. Liu, G.H.; Huang, Z.L.; Guo, X.B.; Liu, Z.Z.; Gao, X.Y.; Chen, C.C.; Zhang, C.L. The SiO2 occurrence and origin in the shale system of middle Permian series Lucaogou Formation in Malang Sag, Santanghu Basin, Xinjiang. Acta Geol. Sin. 2016, 90, 1220–1235. [Google Scholar]
  22. Huang, Z.; Liu, G.; Li, T.; Li, Y.; Yin, Y.; Wang, L. Characterization and control of mesopore structural heterogeneity for low thermal maturity shale: A case study of Yanchang Formation shale, Ordos Basin. Energy Fuels 2017, 31, 11569–11586. [Google Scholar] [CrossRef]
  23. Zhao, J.; Jin, Z.; Jin, Z.; Hu, Q.; Hu, Z.; Du, W.; Yan, C.; Geng, Y. Mineral types and organic matters of the Ordovician-Silurian Wufeng and Longmaxi Shale in the Sichuan Basin, China: Implications for pore systems, diagenetic pathways, and reservoir quality in fine-grained sedimentary rocks. Mar. Pet. Geol. 2017, 86, 655–674. [Google Scholar] [CrossRef]
  24. Zhao, J.; Jin, Z.; Jin, Z.; Wen, X.; Geng, Y. Origin of authigenic quartz in organic-rich shales of the Wufeng and Longmaxi Formations in the Sichuan Basin, South China: Implications for pore evolution. J. Natl. Gas Sci. Eng. 2017, 38, 21–38. [Google Scholar] [CrossRef]
  25. Zhang, L.; Li, B.; Jiang, S.; Xiao, D.; Lu, S.; Zhang, Y.; Gong, C.; Chen, L. Heterogeneity characterization of the lower Silurian Longmaxi marine shale in the Pengshui area, South China. Int. J. Coal Geol. 2018, 195, 250–266. [Google Scholar] [CrossRef]
  26. Peltonen, C.; Marcussen, Ø.; Bjørlykke, K.; Jahren, J. Clay mineral diagenesis and quartz cementation in mudstones: The effects of smectite to illite reaction on rock properties. Mar. Pet. Geol. 2009, 26, 887–898. [Google Scholar] [CrossRef]
  27. Thyberg, B.; Jahren, J.; Winje, T.; Bjørlykke, K.; Faleide, J.I.; Marcussen, Ø. Quartz cementation in Late Cretaceous mudstones, northern North Sea: Changes in rock properties due to dissolution of smectite and precipitation of microquartz crystals. Mar. Pet. Geol. 2010, 27, 1752–1764. [Google Scholar] [CrossRef]
  28. Thyberg, B.; Jahren, J. Quartz cementation in mudstones: Sheet-like quartz cement from clay mineral reactions during burial. Pet. Geosci. 2011, 17, 53–63. [Google Scholar] [CrossRef]
  29. Chaika, C.; Williams, L.A. Density and mineralogy variations as a function of porosity in Miocene Monterey Formation oil and gas reservoirs in California. AAPG Bull. 2001, 85, 149–167. [Google Scholar]
  30. Lin, J.H. Quantitative analysis of amorphous silica in multicomponent system by X-ray diffraction. J. Mineral. Petrol. 1997, 17, 22–25. [Google Scholar]
  31. Liu, G.H. The Formation Mechanism of Authigenic Quartz in Lacustrine Shale and Influence to Reservoir Property [D]. Ph.D. Thesis, China University of Petroleum, Beijing, China, 2017. [Google Scholar]
  32. Chu, G. A Doping Method for Quantitative X-Ray Diffraction Phase Analysis of Samples Containing Amorphous Material. Acta Phys. Sin. 1998, 47, 1143–1148. [Google Scholar]
  33. Popović, S.; Gržeta-plenković, B.; Balić-žunić, T. The doping method in quantitative x-ray diffraction pahase analysis addendum. J. Appl. Crystallogr. 1983, 16, 505–507. [Google Scholar] [CrossRef] [Green Version]
  34. Huang, Z.; Liu, G.; Ma, J.; Xue, D.; Han, W.; Chen, J.; Chen, Z. A new method for semiquantitative analysis of amorphous SiO2 in terrestrial shale: A case study about Yanchang Formation shale, Ordos Basin. Natl. Gas Geosci. 2015, 26, 2017–2028. [Google Scholar]
  35. Cao, Z.; Liu, G.; Kong, Y.; Wang, C.; Niu, Z.; Zhang, J.; Wei, Z. Lacustrine tight oil accumulation characteristics: Permian Lucaogou Formation in jimusaer sag, Junggar Basin. Int. J. Coal Geol. 2016, 153, 37–51. [Google Scholar] [CrossRef]
  36. Qu, C.S.; Qiu, L.W.; Cao, Y.C. Organic petrology characteristics and occurrence of source rocks in Permian Lucaogou Formation, Jimsar sag. J. China Univ. Pet. (Ed. Natl. Sci.) 2017, 41, 30–38. [Google Scholar]
  37. Zhou, D.W.; Liu, Y.Q.; Xing, X.J.; Hao, J.R.; Dong, Y.P.; Ouyang, Z.J. Formation of the Permian basalts and implications of geochemical tracing for paleo-tectonic setting and regional tectonic background in the Turpan-Hami and Santanghu basins, Xinjiang. Sci. China Ser. D 2006, 49, 584–596. [Google Scholar] [CrossRef]
  38. Jiang, Y.Q.; Liu, Y.Q.; Zhao, Y.; Nan, Y.; Wang, R.; Zhou, P.; Yang, Y.J.; Kou, J.Y.; Zhou, N.C. Characteristics and origin of tuff-type tight oil in Jimusar sag, Junggar Basin, NW China. Pet. Explor. Dev. 2015, 42, 810–818. [Google Scholar] [CrossRef]
  39. Wang, J.; Zhou, L.; Liu, J.; Zhang, X.J.; Zhang, F.; Zhang, B. Acid-base alternation diagenesis and its influence on shale reservoirs in the Permian Lucaogou Formation, Jimusar Sag, Junggar Basin, NW China. Pet. Explor. Dev. 2020, 47, 962–976. [Google Scholar] [CrossRef]
  40. Liu, C.; Liu, K.; Wang, X.; Wu, L.; Fan, Y. Chemostratigraphy and sedimentary facies analysis of the Permian Lucaogou Formation in the Jimusaer Sag, Junggar Basin, NW China: Implications for tight oil exploration. J. Asian Earth Sci. 2019, 178, 96–111. [Google Scholar] [CrossRef]
  41. Wang, C.Y.; Kuang, L.C.; Gao, G.; Cui, W.; Kong, Y.H.; Xiang, B.L.; Liu, G.D. Difference in hydrocarbon generation potential of the shaly source rocks in Jimusar sag` Permian Lucaogou formation. Acta Sedimentol. Sin. 2014, 32, 385–390. [Google Scholar]
  42. Zhi, Y.; Lianhua, H.; Senhu, L.; Xia, L.; Lijun, Z.; Songtao, W.; Jingwei, C. Geologic characteristics and exploration potential of tight oil and shale oil in Lucaogou formation in Jimsar sag. China Pet. Explor. 2018, 23, 76–85. [Google Scholar]
  43. Cai, D.M.; Sun, L.D.; Qi, J.S.; Dong, J.H.; Zhu, Y.K. Reservoir characteristics and evolution of volcanic rocks in Xujiaweizi fault depression. Acta Pet. Sin. 2010, 31, 400–407. [Google Scholar]
  44. Hu, W.T.; Liu, C.Z.; Zhao, H.; Luan, K.; Yao, H.P. The Diagenesis of Volcanic Rocks and Its Effects on the Reservior Quality in Xujiaweizi Fault Depression, Soliao Basin. Sci. Technol. Eng. 2011, 11, 1176–1181. [Google Scholar]
  45. Yang, J.S.; Meng, Y.L.; Zhang, H. Kinetic model of quartz cementation and its application. Pet. Geol. Exp. 2002, 24, 372–376. [Google Scholar]
  46. Yuan, D.S.; Zhang, Z.H.; Zhu, L.; Liu, H.J. Effects of oil charge on quartz cement. Acta Petrol. Sin. 2007, 23, 2315–2320. [Google Scholar]
  47. Li, R.; Ge, Y.J.; Chen, Y.; Zhou, Y.Q.; Zhou, H.J. Experimental evidence of influential factor of quartz growth in reservoir. J. China Univ. Pet. 2010, 34, 13–18. [Google Scholar]
  48. Yuanlin, M.; Cheng, X.; Hongyu, X.; Weizhi, T.; Chuanxin, T.; Jinghuan, L.; Youchun, W.A.; Yuting, G.A. A new kinetic model for authigenic quartz formation under overpressure. Pet. Explor. Dev. 2013, 40, 701–707. [Google Scholar]
Figure 1. Diagrams showing (A) Junggar tectonic units and location of the Jimusar Depression, (B) structure and well location map of the Jimsar Depression, and (C) the stratigraphic sequence from Upper Caboniferous to Lower Cretaceous in the Jimsar Depression (modified from [40]).
Energies 13 06168 g001
Figure 2. Mineral composition of different lithofacies samples in the Lucaogou Formation. (A) The mineral content of the different lithofacies; (B) clay mineral composition in the different lithofacies.
Energies 13 06168 g002
Figure 3. SEM images of quartz and amorphous silica in the Lucaogou Formation, Jimsar Depression. (A) Transitional lithofacies, S1 well, 3147.64 m; (B) tuffaceous shale lithofacies, S2 well, 3348.08 m; (C) transitional lithofacies, S1 well, 3147.64 m; (D) tuffaceous shale lithofacies, S2 well, 3343.00 m; (E) tuffaceous shale lithofacies, S2 well, 3348.08 m; (F) transitional lithofacies, S2 well, 3359.95 m; (G) tuffaceous shale lithofacies, S3 well, 2815.21 m; (H) tuffaceous shale lithofacies, S4 well, 2601.81 m; (I) energy spectrum analysis of point “+” in image H.
Energies 13 06168 g003aEnergies 13 06168 g003b
Figure 4. Diagrams showing (A) Si content tested by XRF, amorphous silica content calculated through the new method, and Si content in crystalline minerals. (B) cross plot of the amorphous silica content with crystalline quartz content in samples of the different lithofacies in the Lucaogou Formation.
Energies 13 06168 g004
Figure 5. Cross plot of amorphous silica content with (A) porosity, (B) permeability of different lithofacies in Lucaogou Formation.
Energies 13 06168 g005
Figure 6. Cross plot of amorphous silica content with (A) Young’s modulus, (B) Poisson’s ratio, (C) compressive strength and (D) oil saturation of different lithofacies in Lucaogou Formation.
Energies 13 06168 g006
Figure 7. Scanning electron microscope of authigenic quartz in the pores, cavities, and cracks of Lucaogou Formation. (A) Transitional lithofacies, S1 well, 3147.64 m; (B) tuffaceous shale lithofacies, S2 well, 3348.08 m; (C) tuffaceous shale lithofacies, S3 well, 2815.21 m; (D) tuffaceous shale lithofacies, S4 well, 2601.81 m.
Energies 13 06168 g007
Table 1. Test data table of mineral composition of different lithofacies samples in the Luchaogou Formation.
WellDepth
(m)
LithofaciesClay Mineral/%Quartz/%K-Feldspar /%Plagioclase/%Calcite/%Dolomite/%Pyrite/%Kaolinite/%Chlorite/%Illite/%Illite/Smectite Mixed Layers/%Chlorite/Smectite Mixed Layers/%Illite/Smectite mixed Layer RATIO/%Chlorite/Smectite Mixed Layers Ratio/%
S13063.80Carbonate lithofacies5194386105615740550
S13086.50Carbonate lithofacies2104507900050500560
S13136.85Transitional lithofacies282201333408916670700
S13147.64Transitional lithofacies3121480333252914320440
S13149.00Carbonate lithofacies256308133314800570
S23343.00Tuffaceous shale lithofacies222352202530064360400
S23315.00Carbonate lithofacies312018135315410810500
S23323.00Transitional lithofacies23280173272061035496760
S23332.00Carbonate lithofacies2130185602969760490
S23344.00Transitional lithofacies1717912735301124650560
S23347.00Transitional lithofacies3926010101230715780550
S23348.08Tuffaceous shale lithofacies223181202340085150400
S23351.66Carbonate lithofacies219010244504432600520
S23353.14Carbonate lithofacies21011427108928550560
S23355.13Transitional lithofacies322101103330043570540
S23359.95Transitional lithofacies221481463602281150670
S23379.55Transitional lithofacies23207164255089830610
S23380.01Tuffaceous shale lithofacies1648112000512150730900
S23463.00Transitional lithofacies271561403620038620510
S23477.00Transitional lithofacies262091402830713800650
S23600.34Carbonate lithofacies4109866033315790490
S32794.71Tuffaceous shale lithofacies1840421124113159630870
S32795.80Tuffaceous shale lithofacies14593481200080200400
S32805.21Transitional lithofacies12150270433560890700
S32808.52Carbonate lithofacies761010105700001000520
S32815.21Tuffaceous shale lithofacies2730918655009460400
S32817.81Tuffaceous shale lithofacies185401744311128690890
S32832.89Tuffaceous shale lithofacies22387101913009820400
S32857.65Tuffaceous shale lithofacies22401315325009550400
S32869.14Tuffaceous shale lithofacies23388502600086140400
S32870.01Tuffaceous shale lithofacies19371015511323180590850
S32871.01Tuffaceous shale lithofacies1835132334414170690880
S32873.01Tuffaceous shale lithofacies1836026611315146650830
S32874.01Tuffaceous shale lithofacies233802645414160700860
S32876.81Tuffaceous shale lithofacies2241019693874081050
S42580.81Transitional lithofacies25200160372121149280400
S42585.01Transitional lithofacies211581403754628620590
S42591.91Tuffaceous shale lithofacies215101385213164670860
S42592.21Tuffaceous shale lithofacies263602609316186600860
S42601.21Tuffaceous shale lithofacies175031583412147670860
S42601.81Tuffaceous shale lithofacies164061021340074260400
S42607.60Transitional lithofacies40363301261500850600
Table 2. Statistical table of calculated silica content, porosity, permeability, mechanical properties, and oil saturation in different lithofacies samples of the Lucaogou Formation.
WellDepth (m)LithofaciesOil Saturation/%Young’s Modulus/N*mm−2Poisson’s RatioCompressive Strength/Kg*cm−2Porosity/%Permeability/mDSi Content Test by XRF/%Amorphous Silica Content Calculated Through the New Method/%Calculated Si Content in Crystalline Minerals/%Calculated Si Content in Clay Minerals/%
S13063.80Carbonate lithofacies17.6----------13.5351.01713.18440.196
S13086.50Carbonate lithofacies10.9------0.70410.00139.1972.4108.24638.156
S13136.85Transitional lithofacies------------26.9374.65225.92441.131
S13147.64Transitional lithofacies9.70------0.23670.000092324.3486.92122.61228.963
S13149.00Carbonate lithofacies--------0.60410.002157.0132.5405.93941.964
S23343.00Tuffaceous shale lithofacies5.80------0.58510.00004329.23411.88526.74334.728
S23315.00Carbonate lithofacies14.46.3960.211306.527----12.5450.54212.35340.376
S23323.00Transitional lithofacies15.4036.2120.246196.722----25.3342.87824.67126.948
S23332.00Carbonate lithofacies116.3810.353368.6631.19860.0112.9781.64312.39838.948
S23344.00Transitional lithofacies12.00----------21.9793.41221.07039.007
S23347.00Transitional lithofacies26.1010.7070.30894.94----31.5360.57031.44341.105
S23348.08Tuffaceous shale lithofacies--40.3860.356324.954----30.05610.48427.99032.612
S23351.66Carbonate lithofacies--12.1810.225234.6950.97270.0023613.0280.47212.83638.126
S23353.14Carbonate lithofacies22.7----------10.2240.52210.02737.074
S23355.13Transitional lithofacies9.9035.7390.333173.612----26.2562.25125.76238.856
S23359.95Transitional lithofacies------------22.9438.59420.61533.214
S23379.55Transitional lithofacies8.6014.6250.202184.049 26.9522.83826.34642.938
S23380.01Tuffaceous shale lithofacies------------39.9166.14339.40744.803
S23463.00Transitional lithofacies--------0.46500.010925.4317.09923.72939.068
S23477.00Transitional lithofacies--18.3280.269114.1901.19570.13528.6594.52927.75643.399
S23600.34Carbonate lithofacies2.1026.0130.317373.744----12.1471.77311.50540.227
S32794.71Tuffaceous shale lithofacies40.9035.6750.244178.8491.28070.01234.5252.67634.16341.965
S32795.80Tuffaceous shale lithofacies32.1026.7020.241139.7431.17270.016235.2953.16734.88933.116
S32805.21Transitional lithofacies--------0.60000.024422.3585.93620.75945.639
S32808.52Carbonate lithofacies--12.0890.271319.9960.91940.0010512.9572.71811.98644.204
S32815.21Tuffaceous shale lithofacies8.90------0.91940.0024432.93211.53531.00631.704
S32817.81Tuffaceous shale lithofacies70.3013.1760.27867.7051.85240.030138.876320.58938.82444.161
S32832.89Tuffaceous shale lithofacies------------31.8749.89330.13631.301
S32857.65Tuffaceous shale lithofacies36.60----------35.5117.84134.47431.604
S32869.14Tuffaceous shale lithofacies13.2039.5020.293181.2721.45110.07631.0168.20529.52432.511
S32870.01Tuffaceous shale lithofacies31.80----------33.4294.92232.69039.505
S32871.01Tuffaceous shale lithofacies--18.9270.327128.162----36.1286.62135.30743.130
S32873.01Tuffaceous shale lithofacies------------33.0133.37732.49941.675
S32874.01Tuffaceous shale lithofacies--35.6840.355132.212----36.4254.70535.86843.114
S32876.81Tuffaceous shale lithofacies31.5033.1640.192276.39----30.2439.48628.41314.260
S42580.81Transitional lithofacies1.7039.5940.287435.1740.51000.00008923.9236.61622.23831.529
S42585.01Transitional lithofacies--------0.56000.04322.9733.68122.02739.252
S42591.91Tuffaceous shale lithofacies29.00----------37.6364.35937.17742.558
S42592.21Tuffaceous shale lithofacies------------35.9473.38235.53540.529
S42601.21Tuffaceous shale lithofacies56.2031.6540.396148.228----36.9323.33136.56142.882
S42601.81Tuffaceous shale lithofacies------------31.0129.31829.29733.721
S42607.60Transitional lithofacies9.10------1.13640.0536.1341.16435.99842.542
Publisher’s Note: MDPI stays neutral with regard to jurisdictional claims in published maps and institutional affiliations.

