Abstract
In this study, biodiesel fuel with a ratio of 20% volume (B20) was used on vehicles that are used in common rail injection systems, complying with Euro2 emission regulations. Laboratory and road tests were conducted to evaluate the effects of B20 on performance, emissions and engine components. Using diesel fuel and B20 as reference fuels, tests were conducted using Euro2 vehicle technology to investigate the effects on emissions, fuel consumption, and power. Durability testing was run for travel distances covering 40,000 km under various road and environmental conditions, while vehicle performance and emissions tests were conducted using the ECE R84-03 and ECE R101 test methods, respectively. The results show that B20 has lower CO and hydrocarbon (HC) emissions for every distance travelled, with an average of around 30%. Particulate emission was a bit lower, averaging 3.4% for B20 compared to B0, while NOx was found to slightly increase at around 2% for B20. Due to its lower calorific value, for an average distance traveled, the fuel economy of B20 was around 0.5% higher compared to B0. Furthermore, the maximum power of B20 was 3% lower compared to that of B0 for the entire distance traveled. However, an evaluation of engine components after 40,000 km showed that B20 and B0 were similar. Moreover, vehicles using B20 tend to have a comparable durability of engine components when compared with B0.
1. Introduction
Biodiesel is a potential alternative fuel for diesel engines due to its renewable characteristics as well as its similarity to diesel fuel; it can be utilized in diesel engines without any significant modification. The utilization of biofuel was one of the strategies to achieve a reduction of 26% in greenhouse gas emissions by 2020, as stated in Presidential regulation number 61/2011, concerning the Indonesia national action plan to reduce greenhouse gas emissions, although some improvements, including oil palm plantations and biodiesel processing, must be considered to improve the environmental performance of biodiesel production [1]. Indonesia has implemented a mandatory biodiesel regulation with a ratio of biodiesel to diesel fuel of 20% and 80% by volume (B20) since 2016. The Fatty Acid Methyl Ester (FAME) derived from palm oil is being used for blending with diesel fuel for the Indonesian B20 mandate. Imam Paryanto et al. reported that the impurities of FAME such as saturated monoglycerides (SMG) must be minimized as they could lead to the issue of fuel filter clogging at low temperature. They proposed a limit for SMG depending on biodiesel ratio to avoid precipitation at low temperature [2]. Moreover, the blend ratio of biodiesel should be clarified for engine performance, emissions and durability in relation to vehicle technology [3]. Other concerns regarding the implementation of B20 on road transportation included NOx emissions, performance and long-term effects on engine components. B20 could reduce the emission of carbon monoxide (CO), hydrocarbon (HC), smoke and particulate due to its high cetane number and oxygen content, but it could lead to an increase on NOx emission [3,4,5,6,7,8,9]. The emission of biodiesel could be influenced by the source of biodiesel [6,7] as well as the testing conditions, engine setting and engine technology [5,10]. The trade-off between NOx–particulate was minimized for B20 vehicle with exhausts after treatment [8,9,10]. Biodiesel could lead to a change in combustion phasing due to its shorter ignition delay compared with diesel fuel, which could result in better exhaust emissions (except NOx) [11,12]. Furthermore, biodiesel has some disadvantages in terms of its lower power/torque due to its lower calorific value than diesel fuel [10,11]. In general, biodiesel has a higher cetane number, which results in a shortened ignition delay, and tends to have premixed combustion, which results in lower CO, HC, and smoke emissions. Nevertheless, premixed combustion results in higher combustion temperatures, which lead to increased NOx emissions in biodiesel. A previous study reports similar results, although with different biodiesel sources. They found that the combustion temperature of biodiesel was slightly higher than diesel fuel, which leads to an increase in NOx emissions. However, retarding the injection timing and utilizing a higher Exhaust Gas Recirculation (EGR) ratio would bring the NOx level to a similar level to that of biodiesel [12].
Many studies are concerned with the long-term effects of biodiesel fuel in addition to its performance, emission and combustion characteristics. Most studies report that high ratio biodiesel would have a negative effect on long-term application in diesel engines. Durability tests for biodiesel resulted in problems in several main engine components, including the fuel system, pistons, valves, and fuel filter. Degradation for each component varied, depending on testing conditions, engine technologies, and biodiesel qualities. The studies also report that engine component degradation could be minimized as the quality of biodiesels is improved, even when utilized in modern diesel engines with exhaust gas, after treatment. FAME could be used as the main precursor to deposit formation in engine components due to the possibility of its containing contaminants, such as copper, zinc, aluminum, sodium, magnesium, glycerol residue, water, and additives [13,14,15]. Moreover, such contaminants also have a significant influence on engine oil degradation. Fuel dilution during combustion processes is considered to be the reason for engine oil degradation. M. Lammert et al. and Yolanda Bartoli et al. also report that the utilization of biodiesel fuel with blends up to 20% did not have a significant influence on either engine components or engine oil [13,15].
Those studies showed that biodiesel composition, engine operating conditions, engine technologies, and environmental conditions were the main influencing factors for engine performance, emission and engine components. Utilization of biodiesel fuel was also recommended to control several factors such as fuel quality, adjustments of periodic maintenance, and improving the material of engine components. Therefore, the implementation of the biodiesel mandate (B20) in Indonesia requires comprehensive investigation and a consideration of the results of previous studies. An investigation regarding the effect of the proposed quality of B20 fuel on used cars and new cars with Euro 2 technology is necessary to ensure the quality of B20 from palm oil and also to make necessary adjustments in engine components. Moreover, attention should be paid to the older vehicles available in Indonesia. These important points, related to the utilization of B20 from palm oil on Euro2 vehicle technology, have been comprehensively investigated in real road tests in Indonesia, but the data are not yet available. Therefore, this study has the objective of investigating the effect of B20 on performance, emissions, and engine components on Euro2 vehicles available on the Indonesian market by laboratory and road tests. The B20 used in this study originated from esterified palm oil with saturated mono glyceride impurities controlled at a maximum of 0.8%. However, this paper only discusses the results for Euro2 vehicles equipped with common rail fuel injection systems, as these types of vehicles are starting to dominate the Indonesian market. This study also acts as a reference to set a new Indonesian fuel standard for B20, as well as to give recommendations on suitable engine materials and periodic maintenance for vehicle manufacturers in Indonesia.
2. Materials and Methods
2.1. Tested Fuel
In this study, two types of fuel were utilized in two different vehicles: diesel fuel available on the Indonesian market (referring to diesel fuel with a maximum sulfur content of 2500 ppm), and a blend of diesel fuel with biodiesel, using a volume ratio of 80 to 20 (B20). In this study, biodiesel produced from palm oil, or Palm Methyl Ester, was used. Both diesel fuel and FAME were prepared and produced by Indonesian fuel industries. The properties for the tested fuel are shown in Table 1. The measurement of the properties was conducted at Lemigas Laboratory in Indonesia. B20 showed a higher cetane number, density, viscosity and flash point, but it has lower sulfur content and a better lubricity number when compared with B0. Furthermore, the oxidation stability, water content and acid number of B20 were lower than that of B0.

Table 1.
Fuel properties for base fuel and B20 fuel.
2.2. Tested Vehicle
The vehicles were used in their original diesel fuel settings in the road test. The vehicles were manufactured in 2014 and categorized as light-duty passenger vehicles in compliance with Euro2 emissions regulations. Periodic maintenance during the road test was conducted at every 15,000 km. The specifications of the engine technology of these vehicles is shown in Table 2.
Table 2.
Vehicle Specification.
2.3. Testing Facilities
A laboratory test was conducted at a vehicle test bench belonging to the Agency for Assessment and Application of Technology (BPPT). Road simulation was carried out using a 4 WD chassis dynamometer which simulates road load based on a coefficient stated in the R83 regulation. Here, emission and fuel consumption tests in the chassis dynamometer were carried out in accordance with the New European Driving Cycle (NEDC). The emissions sampling system used constant volume sampling (CVS), which can vary the flow rate up to a maximum of 30 m3/min, and emissions sampling was completed with a dilution tunnel for particulate sampling before the samples were weighed using a microbalance. Gas emissions were analyzed using a bag that collected exhaust gas from the CVS sampling systems. Here, a Non-Dispersive Infrared analyzer was used to analyzed carbon monoxide and carbon dioxide gas emissions, while hydrocarbon (HC) and Nitrogen Oxide (NOX) were analyzed with a Flame Ionization Detector (FID) and Chemiluminescence Detector CLD) respectively. Figure 1 shows a schematic diagram of the whole system and the vehicle testing facility belong to BPPT of Indonesia.
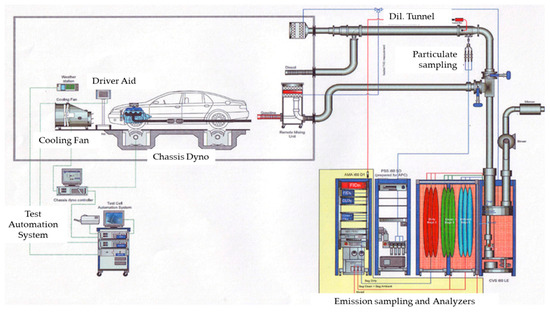
Figure 1.
Schematic diagram of vehicle testing facility.
The test cycle of NEDC consists of an urban and extra-urban cycle, as shown in Figure 2. The test cycle was used for emission and fuel economy testing in this study. This cycle is also used for a Euro2 emission type-approval test in Indonesia which consists of Phase 1 (urban cycle), with a duration of 780 s, and Phase 2 (extra urban cycle) paths.
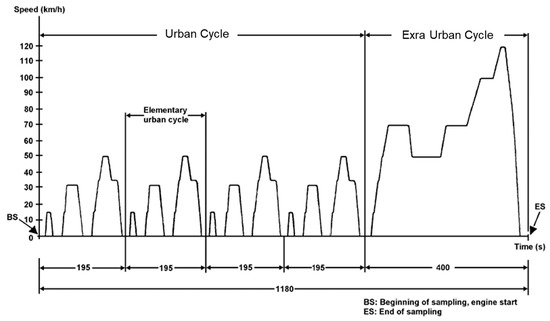
Figure 2.
New European Driving Cycle (NEDC) test cycle.
Component evaluation, in reference to CEC M-02-A-78, was conducted after the vehicle reached a distance of 40,000 km by comparing the condition of the components before and after the road test. The evaluation focused on main components such as the injector, pistons, cylinder head, and oil sump. The condition of the injector, in particular, was comprehensively evaluated using a Scanning Electron Microscope (SME) SU3500 to observe detailed images and deposit formations at the tip surface, hole, and needle, all of which could directly influence engine performance.
3. Results
Vehicles from three different manufacturers were utilized in this study. Each manufacturer was represented by two vehicles: one fueled with diesel fuel (B0) as the reference vehicle and the other one fueled with biodiesel with a volume ratio of 20% (B20). In this paper, we only discuss the results obtained from one manufacturer as the others showed similar trends. The results of the laboratory and the road test consisted of emissions, performance, fuel economy, and engine components. Laboratory testing for emission, performance and fuel economy were conducted at travelled distances of 2500, 5000, 10,000, 20,000, 30,000, and 40,000 km. At 0 km, vehicles were set according to the manufacturer’s recommendations with reference to diesel fuel (B0) characteristics, and periodic maintenance was conducted at traveled distances of 15,000 km and at 30,000 km. At those traveled distances, laboratory tests were conducted after the vehicle finished its periodic maintenance.
3.1. Emissions Test Result
Figure 3 shows the CO emissions for both B0 and B20 for each distance traveled. B20 showed a lower CO emission compared with B0 at almost all distances traveled, except at 20,000 km. The B20 vehicle could comply with the Euro2 limit for the whole travel distance, while the B0 vehicle exceeded the limit except at 5000 km and 20,000 km. It can be considered that the lower CO emission of B20 was due to the higher cetane number, as shown in Table 1, and oxygen content, which could lead to complete combustion compared with B0 [3,4]. Figure 3 also shows that, as the distance traveled increased, CO emissions also tended to increase for both B0 and B20. CO emissions at travel distances of 20,000 km were similar for both B20 and B0, which can be considered due to the engine deterioration, although this could be suppressed by periodic maintenance [14,15]. At this distance, both B0 and B20 were retuned following the periodic maintenance standards of the manufacturer so that this could affect the vehicle performance at the next traveled distance. However, those phenomena could not be confirmed after the second instance of periodic maintenance at 30,000 km, in which the level of CO, especially for B0, was increasing compared to 20,000 km.
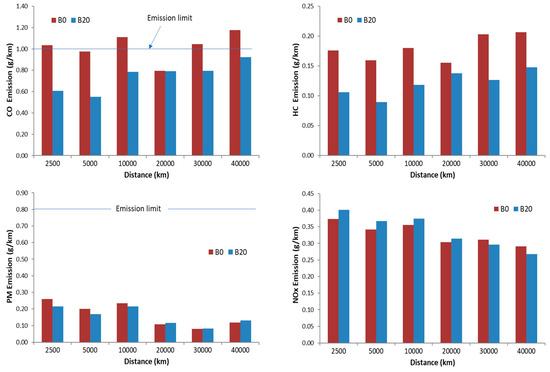
Figure 3.
CO, hydrocarbon (HC), NOx and Particulate Matter (PM) emission for B0 and B20 at each traveled distance.
Figure 4 shows a comparison of the transient CO emission vehicle fueled with B0 and B20 at travel distances of 2500 km and 40,000 km following the test cycle shown in Figure 2. CO emissions appeared in the urban cycle, while they were near to zero in the extra-urban cycle for both B0 and B20 at distances of 2500 km and 40,000 km. The reason for the higher CO emissions in the urban path compared with the extra-urban path may be due to the cold condition of the engine at the beginning of the test cycle and the fact that many engine accelerations are required to follow the test cycle in urban cycle for both B0 and B20. The CO emissions of B0 were higher than that of B20 at a distance of 2500 km at almost all speed profiles, while they were comparable at a distance of 40,000 km. Here, the peak of CO emissions in the urban cycle was dominated by B0 while at 40,000 km B20 dominated the peak of CO emissions. The transient results at 2500 km were higher than 40,000 km for both of B0 and B20, a fact that is represented in the total CO emission results, as shown in Figure 3.
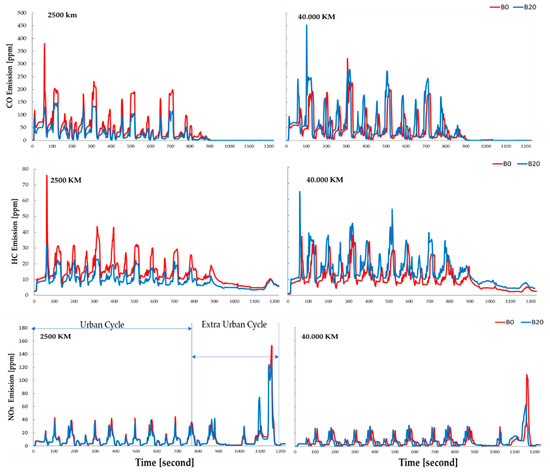
Figure 4.
Transient CO, HC and NOx emissions for B0 and B20 at traveled distances of 2500 km and 40,000 km.
HC emissions for both B0 and B20 showed the same trend with CO whereas HC increased as the traveled distances became greater. B20 has lower HC emissions than B0 for the whole traveled distance with a reduction percentage varying from 13 to 40%. Figure 4 also showed that, at a traveled distance of 20,000 km, the difference in the HC emission was the smallest percentage at around 13%. The oxygen content of B20 could be considered to contribute to complete combustion; moreover, the lower ignition delay of B20 also could increase the temperature combustion and improve high viscosity B20 combustion, resulting in lower HC emissions than B0. However, HC emissions for both of B0 and B20 are low as diesel combustion works at high levels of excess air.
Transient HC emissions for both B0 and B20 were high during acceleration, as shown in Figure 4. Here, B20, with its oxygen content, could suppress unburned fuel so that its HC emissions were lower than that of B0 for both the urban and extra-urban paths at traveled distance of 2500 km, while the B20 peak HC during acceleration was higher than the peak HC of B0 at certain points during the urban cycle at a distance of 40,000 km. Moreover, the B20 HC emissions were higher at almost-idle and constant speed for both the urban and extra-urban paths; however, the total results were still lower than B0, as shown in Figure 3. Vehicle condition could be considered as the reason for the percentage variation in the HC reduction with B20 at various traveled distances [13,14].
B20, with its higher cetane number and oxygen content, could lead to better combustion results at high-combustion temperatures, which lead to higher NOx emissions compared with B0. Figure 4 shows the NOx emissions at distances of 2500 km and 40,000 km for vehicles fueled with B0 and B20. NOx emissions decreased as the distance traveled increased for both B0 and B20, as shown in Figure 3. Similar results were also found by Yolanda et al. [15], but they reported very small differences. Further investigations should be conducted to verify these trends as another study, which focused on the deterioration of NOx emissions in relation to traveled distance, reported that NOx emission for Euro2 vehicle technologies would deteriorate, but for the vehicle without an exhaust, after treatment, NOx emissions were rather stable [16,17]. Moreover, further investigation should also be carried out to study the lower NOx emissions of B20 compared to B0 at travel distances of 30,000 and 40,000 km. Transient NOx emissions formed primarily on the extra-urban path at high running speeds for both B0 and B20. The transient NOx emissions show that the difference was quite small for both B0 and B20 at each traveled distance of 2500 km and 40,000 km. Furthermore, at a distance of 2500 km, higher NOx emissions were observed for of both B0 and B20 when compared with 40,000 km in the urban cycle, while higher NOx emissions were also observed for the extra-urban cycle, which indicates a higher temperature combustion at 2500 km than 40,000 km [18,19]. The PM emissions of B20 showed lower results than that of B0 at almost all distances traveled, except at 20,000 and 40,000 km, where B20 showed 1–3% higher results for PM. B20, with its higher cetane number and oxygen content, should have better mixing characteristics leading to lower PM compared with B0. Therefore, the advantage of B20′s fuel properties play an important role during the early distances traveled, up to 10,000 km. Figure 3 shows that PM decreased as the traveled distance increased. PM emissions at traveled distances from 20,000 km to 40,000 km were about half that of the earlier traveled distances below 10,000 km, which could indicate that the engine ran optimally up to 10,000 km. However, this decreasing trend needs to be clarified in a more detailed study, as well as the trade-off between PM and NOx, which could not be seen from traveled distances of 20,000 km onwards. In general, for PM, both B0 and B20 reached the limit of Euro2 at all traveled distances.
3.2. Fuel Economy
Fuel economy measures energy efficiency, which is indicated by the ratio between the distance traveled and the fuel consumed. One property that significantly influences fuel economy is calorific value. B20 has a 4% lower calorific value than B0; however, testing results show that the difference is less than 2%, as shown in Figure 5. In general, fuel economy gets better as the distance traveled increases, for both B0 and B20. B20 showed less fuel economy than B0 at distances traveled below 10,000 km but became better after 10,000 km. Both tested vehicles were new, with the initial odometer reading below 2000 km, so they were in run-in conditions at the beginning of the road test. Figure 5 showed that, after both vehicles reached 5000 km, the fuel economy was quite stable. This also indicates that, besides the calorific value of the fuel, engine conditions and setting could be considered to play a significant role in fuel economy.
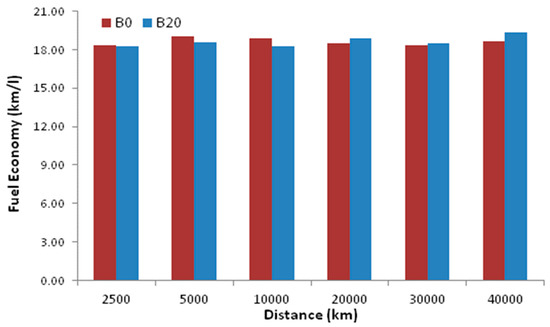
Figure 5.
Fuel economy for B0 and B20 at each distance traveled.
3.3. Power
Figure 6 and Figure 7 show the power curve and power maximum at each traveled distance for vehicles fueled with B0 and B20. The power curve of B20 is comparable with that of B0 from low speed to a medium speed of 70 km/h; on the other hand, at high speed, B20 has a lower power maximum when compared with B0 at distance of both 10,000 and 40,000 km. Figure 6 showed that the power difference between B0 and B20 at low to medium speed was very small, so any effects of the lower heating value of B20 could not be recognized if the vehicle was operated at a low to medium speed.
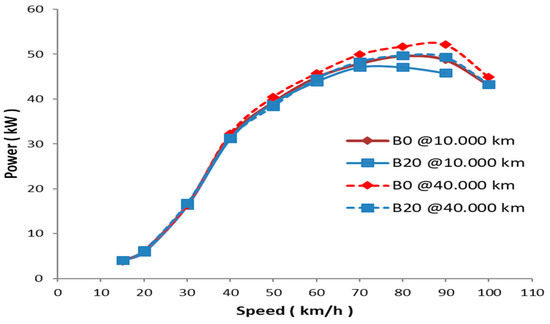
Figure 6.
Power curves for B0 and B20.
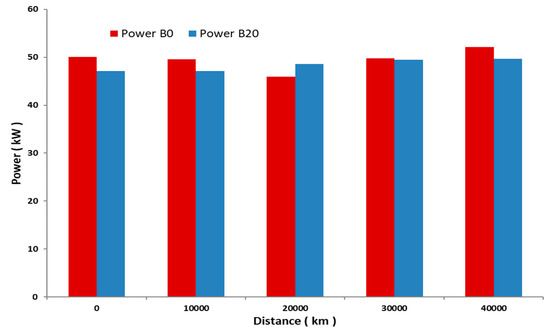
Figure 7.
Power maximums for B0 and B20 at each distance traveled.
The power maximum of B20 was lower than B0 at almost every distance traveled except at 20,000 km, as shown in Figure 7. In general, maximum power tends to increase as the distance traveled increases; this is true for both B0 and B20. The difference in maximum power between B0 and B20 was 3%; this number is similar to the calorific value. Therefore, the lower maximum power of B20 compared to B0 can be considered as being due to its lower calorific value. Although anomalies are shown at 20,000 km, where B20 is higher than B0, it should be considered that engine condition also affects maximum power results.
3.4. Effect on Engine Components
After a vehicle reached a distance of 40,000 km, the engine was dismantled for the evaluation of each component. Table 3 shows a comparison between the engine components of vehicles fueled with B0 and B20 after traveling a distance of 40,000 km. Table 3 shows that carbon deposits were not found on the piston skirt and that piston rings were still in good condition. This indicates that piston rings still function by sealing in gas from the combustion chamber and preventing the occurrence of fuel oil dilution which could degrade oil quality. A deposit had also formed on the pistons and cylinder heads for both B0 and B20. A visual inspection did not show any significant difference between the deposit formed by B0 and B20, indicating that biodiesel with a 20% volume can be considered to have no issues as far as deposit formation on pistons and cylinder heads is concerned. Wear conditions on the upper side of the big end bearing was indicated by light scratches from silicon. The used oil analysis showed that silicon was one of the contaminants in oil which entered the oil sump due to unfiltered debris from the intake air to the combustion chamber, and then through a clearance between the pistons and the cylinder block. A visual analysis of the oil sump found some sludge, but the amount and formation were similar for both B0 and B20. An inspection of other components was also conducted, with the results showing that the engine components were similar. Figure 8, Figure 9 and Figure 10 show a detailed inspection, using Scanning Electron Microscopy (SEM) and energy X-ray Spectroscopy for the injector tip, injector hole, and needle, respectively. A sample nozzle was chosen from four injectors based on the one with the most deposit formed when inspected visually. The injector is one of the components that are placed in high combustion temperatures so it has the strongest possibility of hard deposits forming in the injector tip.
Table 3.
Comparison of engine components for B0 and B20.
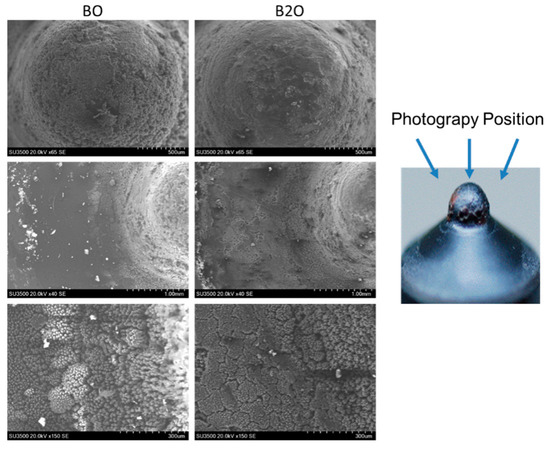
Figure 8.
Injector tip deposits for B0 and B20.
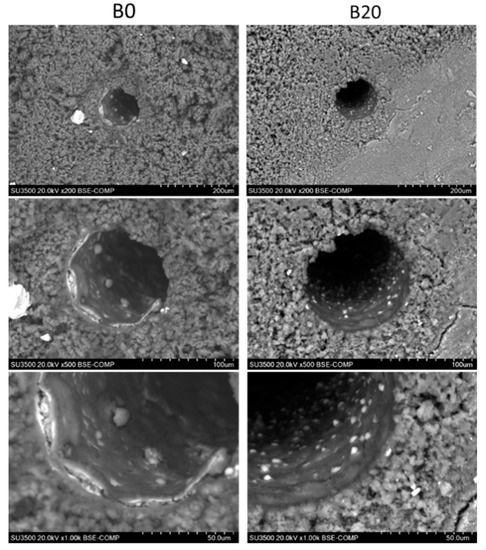
Figure 9.
Injector hole deposits for B0 and B20.
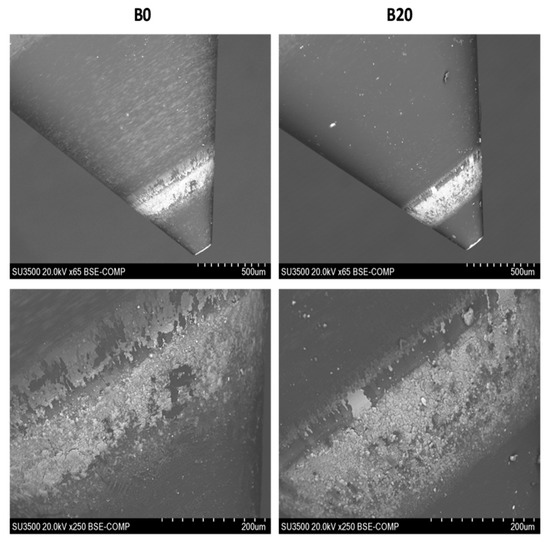
Figure 10.
Injector needle deposits for B0 and B20.
Figure 8 shows that the injector tip at an image magnification of 65 times showed a tendency for B0 to form thicker deposits than B20. However, the B20 deposit showed identical morphology with that of B0 with SEM magnification of 40 and 160 times; however, a small white dot was found in many areas of the injector tip for B0 when compared with B20. Magnifications of 200, 500 and 1000 times of the injector hole are shown in Figure 9.
Deposits inside the injector hole formed after both vehicles fueled with B0 and B20 had travelled for 40,000 km. However, these deposits are not significant when compared to the nozzle hole area for both B0 and B20. This also explains why the emissions, power and fuel consumption for both B0 and B20 did not change significantly since one of the key components was still in good condition. Deposits of white dots also formed in both B0 and B20, but B20 had a more widespread deposit of small dots inside the nozzle hole when compared with B0.
Figure 10 shows the SEM images of the injector needle at magnifications of 65 and 250 times. A sticky deposit was not found on either of the needles for B0 and B20. SEM results showed a similarity of morphology between B0 and B20 for the needles. The white deposits might indicate sodium or calcium carboxylate-based deposits coming from fuel or engine component materials.
4. Discussion
Biodiesel can be produced from various types of feedstock with different characteristics due to its different composition, which could influence engine performance, exhaust emissions and engine components [2,6,7,19]. On the engine side, as current developing engine technology is based on fossil fuel characteristics, the optimization of engine parameters should be performed to obtain the optimum conditions when utilizing biodiesel fuel. Nittin et al. reported suppressed NOx emissions from biodiesel by optimizing EGR [4]. A special study was carried out by Manjunath C. et al., who modified an engine for biodiesel applications. Some engine parts were modified, including the nozzle and piston bowl geometry, then the modified engine was run with varying operational parameters such as injector opening pressure and injection timing. The study reported that an improvement could be achieved with a performance comparable with diesel fuel [10]. Moreover, an engine fueled with B20 does not required alterations in fuel injection time to obtain combustion, performance and emissions comparable to diesel fuel [10]. In this paper, vehicles were tested based on the manufacturer’s recommendations for diesel fuel settings. This study was carried out in real conditions (road tests) and, after a distance of 40,000 km, looking at the effects on performance (fuel economy, power and torque), the exhaust emissions of CO, HC, NOx and PM for any specific mileage, and measuring the effect on engine components affected by fuel.
Laboratory tests at every traveled distance showed that the biodiesel B20 has a lower fuel economy compared with B0, but only after a distance of 20,000 km and only up to 40,000 km. The lower fuel consumption of this biodiesel was caused by the lower heating value of B20 [15,16,17,18,19,20,21], but an improvement in the standard settings of the engine could be considered, as the deterioration of the engine components with B20 was only a little bit better compared to diesel fuel. Moreover, fuel economy testing in this study was conducted in a laboratory following the New European Driving Cycle (NEDC), which did not require full pedals for vehicles to follow the cycle. Therefore, the effect of the lower heating value of B20 did not significantly influence its fuel economy, while B20 has the advantages of its higher cetane number and oxygen content, which promote better combustion. The power maximum of B20 was 3% lower compared with B0 and a similar result has been reported by K.A Abed et al., A.M Liaquat et al. and Luqman R et al. [19,20,21]. The emission testing results showed that B20 could reduce CO and HC emissions at all travel distances. Moreover, B20 could keep the vehicle within the Euro2 emissions limits at each traveled distance. Conversely, NOx and PM emissions did not reveal same trend as CO and HC because, at some traveled distances, the trend was reversed. Moreover, the emission trends for NOx and PM decreased as the traveled distance increased, but these required further and more detailed investigation. One possible consideration was related to vehicle technology, condition and setting during periodic maintenance for each vehicle fueled with B0 and B20. More vehicle tests and a longer distance would be required to validate the data in order to obtain the right trends [17].
The engine component evaluation showed that B20 deterioration was comparable with B0. A.M. Liaquat et al. reported on the evaluation of an injector using B20 from palm oil. They reported that B20 caused a greater carbon deposit compared to diesel fuel [20]. This study reported different results, as the B20 deposit at the injector was comparable to B0. We should underline that Liaquat et al. were using palm biodiesel with monoglyceride contents of 0.49%, while, in our study, monoglyceride contents were in the range of 0.6–0.8%. Here, test operating conditions as well as engine component technology could be considered as parameters that could influence the final results. From this study, it can be seen that the effects of using B20, when compared to B0, are not significant in terms of performance, exhaust emissions or engine components. Therefore, this study can be useful in recommending the mandatory B20 program in Indonesia.
5. Conclusions
This study investigates the effect of B20 on vehicles with common rail injection systems, in terms of performance and emissions, through the use of laboratory tests and the evaluation of engine components after vehicles were run for 40,000 km. The results can be summarized as follows:
- B20 emissions, as far as the entire distance traveled, had an average of around 30% lower carbon monoxide (CO) and total hydrocarbon (THC) emissions compared to B0 due to the fuel’s higher oxygen content and cetane number. A trade-off between particulates and NOx could be seen for distances traveled up to 10,000 km in which particulates of B20 were lower than B0; however, the NOx level was higher for B20. Although the difference in NOx and particulate values was small for B20 and B0, this abnormal trade-off trend between NOx and particulate values requires further investigation.
- The fuel economy of vehicles using B20, showing an average of 0.5%, was slightly higher than that of vehicles using B0, which could be considered as being due to the slightly lower calorific value of the B20 blend.
- The maximum power of B20 was lower, around 3%, than vehicles using B0, which could be due to the lower heating value of B20. However, maximum power until medium speed was comparable between B0 and B20.
- The long-term effect after vehicles reached a distance traveled of 40,000 km reveals that engine components, including piston thrust, piston top, liner, cylinder head, bearing, injector, inlet valve and oil sump, had no significant differences for both B20 and B0 between the condition of the engine at the beginning and the end of the test.
Author Contributions
Conceptualization, I.K.R. and H.S.; methodology, I.K.R. and H.S.; validation, H.S.; investigation, H.S.; data curation, H.S.; writing—original draft preparation, H.S.; writing—review and editing, I.K.R. and H.S.; visualization, H.S.; supervision, D.K.: project administration, R.F.; funding acquisition, E.W. All authors have read and agreed to the published version of the manuscript.
Funding
This research was funded by The Directorate General of the New, Renewable Energy and Energy Conservation Department, Ministry of Energy and Mineral Resources.
Acknowledgments
The authors would like to express their gratitude and highest appreciation to Puslibangtek MIGAS, PT Pertamina, Aprobi, Gaikindo and IKABI for their support in this project.
Conflicts of Interest
The authors declare that they have no known competing financial interests or personal interests that could have influenced the work reported in this paper.
References
- Wahyono, Y.; Hadiyanto, M.; Budihardjo, A.; Joni, S.A. Assessing the environmental performance of palm oil biodiesel production in Indonesia: A life cycle Assessment approach. Energies 2020, 13, 3248. [Google Scholar] [CrossRef]
- Paryanto, I.; Prakoso, T.; Susanto, B.H.; Ghozin, M. The effect of outdoor temperature conditions and Monoglyceride content on the precipitate formation of biodiesel-petrodiesel blended fuel (Bxx). J. Nov. Carbon Resour. Sci. Green Asia Strategy 2019, 6, 59–64. [Google Scholar] [CrossRef]
- Bannister, D.D.; Hawley, J.G.; Ali, H.M.; Cuck, C.J.; Price, P.; Chrysafi, S.S.; Brown, A.; Pickford, W. The impact of biodiesel blend ratio on vehicle performance and emissions. Proc. IMECHE 2009, 224, 405–421. [Google Scholar] [CrossRef]
- Nitin, M.S.; Pankaj, S.S.; Subhash, L. Experimental investigation of effect of exhaust gas recirculation and cottonseed B20 biodiesel fuel on diesel engine. Procedia Technol. 2016, 25, 869–876. [Google Scholar] [CrossRef]
- Thomas, D.D.; John, R.; Collin, J.N.; Mattew, R.S. Effects of Biodiesel, Biodiesel Blends, and a Synthetic Diesel on Emissions from Light Heavy-Duty Diesel Vehicles. Environ. Sci. Technol. 2000, 34, 349–355. [Google Scholar]
- Rakopoulos, C.D.; Antonopoulos, K.A.; Rakopoulos, D.C.; Hountalas, D.T.; Giakoumis, E.G. Comparative performance and emissions study of a direct injection diesel engine using blends of diesel fuel with vegetable oil or biodiesel of various origin. Energy Convers. Manag. 2006, 47, 3272–3287. [Google Scholar] [CrossRef]
- Robert, L.; Mcmormick, M.G.; Alleman, T.; Rew, M. Herring, Impact of Biodiesel Source Material and Chemical Structure onEmissions of Criteria Pollutants froma Heavy-Duty Engine, Environ. Sci. Technol. 2001, 35, 1742–1747. [Google Scholar] [CrossRef]
- Wang, W.G.; Lyons, D.W.; Clark, N.N.M. Gautam, Emissions from Nine Heavy TrucksFueled by Diesel and Biodiesel Blend without Engine Modification. Environ. Sci. Technol. 2000, 34, 933–939. [Google Scholar] [CrossRef]
- Robert, L.M.; Christopher, J.T.; Hayes, R.R.; Black, S.; Ireland, J.; McDaniel, T.; Williams, A.; Frailey, M.; Christopher, A.S. Regulated Emissions from Biodiesel Tested in Heavy-Duty Engines Meeting 2004 Emission Standards; SAE: Warrendale, PA, USA, 2005. [Google Scholar] [CrossRef]
- Manjunath, C.; Ramesh, K.; Manavendra, G. Comparative study of standard engine and modified engine with different piston bowl geometries operated with B20 fuel blend. Renew. Energy 2019, 133, 216–232. [Google Scholar] [CrossRef]
- Thompson, G.J.; Nuszkowski, J. Neat fuel influence on biodiesel blend emissions. Int. J. Engine Res. 2009, 11, 61–77. [Google Scholar] [CrossRef]
- Anand, K.; Sharma, R.P.; Mehta, P.S. Experimental investigations on combustion, performance, and emissions characteristics of a neat biodiesel-fuelled, turbo charged, direct injection diesel engine, Proceedings of the Institution of Mechanical Engineers, Part D. J. Automob. Eng. 2010, 224. [Google Scholar] [CrossRef]
- Lammert, M.; Barnitt, R.; McCormick, R.L. Field Evaluation of Biodiesel (B20) use by Transit Buses. SAE Int. J. Commer.Veh. 2009, 2, 209–221. [Google Scholar] [CrossRef][Green Version]
- Wadumesthrige, K.; Johnson, N.; Winston-Galant, M.; Tang, H.; Simon Ng, K.Y.; Salley, S.O. Deterioration of B20 from Compression Ignition Engine Operation. SAE Int. J. Fuels Lubr. 2010, 3, 638–648. [Google Scholar] [CrossRef]
- Bartoli, Y.; Edward, J.L.P.; John, E.; Lucke, I.A.K.; Feist, M.D.; McCormick, R.L. 1000-hour Durability Evaluation of a Prototype 2007 Diesel Engine with Aftertreatment Using B20 Biodiesel Fuel. SAE Int. J. Fuels Lubr. 2009, 2, 290–304. [Google Scholar] [CrossRef]
- Galle, J.; Verhels, S.; Sierens, R.; Goyos, L.; Castaneda, R.; Verhaege, M.; Vervaeke, L.; Bastian, M. Failure of fuel injectors in a medium speed diesel engine operating on bio oil. Biomass Bioenergy 2012, 40, 27–35. [Google Scholar] [CrossRef]
- Chen, Y.; Jens, B.K. NOx emissions from diesel passenger cars worsen with age. Environ. Sci. Technol. 2016, 50, 3327–3332. [Google Scholar] [CrossRef] [PubMed]
- Deep, A.; Sarbjot, S.S.; Chander, S. Experimental investigation on the influence of fuel injection timing and pressure on single cylinder C.I engine fueled with 20% blend of castor biodiesel in diesel. Fuel 2010, 15–22. [Google Scholar] [CrossRef]
- Abed, K.A.; Gad, M.S.; El Morsi, A.K.; Sayed, M.M.; Elyazeed, A.A. Effect of biodiesel fuels on diesel engine emissions. Egypt. J. Pet. 2019, 28, 183–188. [Google Scholar] [CrossRef]
- Liaquat, A.M.; Masjuki, H.H.; Kalam, M.A.; Fazal, M.A.; Khan, A.F.; Fayaz, H.; Varman, M. Impact of palm biodiesel blend on injector deposit formation. Appl. Energy 2013, 111, 882–893. [Google Scholar] [CrossRef]
- Luqman, R.; Shahid, I.; Zahid, A.M.; Farooq, M.M.; Abbas, H.M.; Khan, T.A.M.; Amjad, M.E.M.; Soudagar, N.S.; Fattah, I.M.R.; Rahman, S.M.A. Maximising yield and engine efficiency using optimized waste cooking oil biodiesel. Energies 2020, 13, 5941. [Google Scholar] [CrossRef]


Publisher’s Note: MDPI stays neutral with regard to jurisdictional claims in published maps and institutional affiliations. |
© 2020 by the authors. Licensee MDPI, Basel, Switzerland. This article is an open access article distributed under the terms and conditions of the Creative Commons Attribution (CC BY) license (http://creativecommons.org/licenses/by/4.0/).