1. Introduction
With the improvement of urban infrastructure construction in China in recent years, the heating energy consumption of residential buildings in winter accounts for a significant proportion of urban energy consumption [
1]. This is important for achieving sustainable energy supply, control, and development as well as assuring environmental protection of the city. Meeting the heating energy demand and regulating it for environmental protection requires two important considerations. On the one hand, extreme weather events, such as haze, occur frequently during the heating period in winter with attendant risks to people’s health and the environment [
2]. On the other hand, people’s inherent pursuit of enhanced living standards and quality of life makes the demand for thermal energy for comfort and pleasure paramount. To balance the contradiction between people’s demand for quality heating energy for comfortable living and enforcing energy-saving regulations for sustainable development, the heat metering of residential buildings was carried out to capture energy heating consumption trends using a technology-based forecasting approach. The method relies on economic and technological means to urge people to adopt energy-saving measures as a lifestyle [
3,
4]. For buildings with heat metering, heat load forecasting is one of the important components of an intelligent district heating system (DHS) and an effective means for the DHS to realize energy-saving regulations and safe operation [
5].
In recent years, the challenges of accurate forecasting of buildings’ heat load have appealed to multitudinous scholars at home and abroad. Several models and algorithms of building heat load prediction were adopted to address this problem. Scholars have used traditional and non-traditional forecasting technologies in their approaches. For example, Zhang et al. [
6] proposed a method to predict the heat load of buildings dynamically based on steady-state white-box models. Buttitta et al. [
7] developed a heat load model with a meticulous time scale based on time use survey (TUS) data. Shen et al. [
8] analyzed heat load performance based on simulation of neighborhood-scale building. Lim et al. [
9] proposed forecasting models for determining heat load with the consideration of the thermal inertia delay and buildings of varying size. Dahl et al. [
10] proposed an approach for improving short-term heat load forecasts with calendar and holiday data. Sholahudin et al. [
11] investigated the effects of individual input parameters on heat load based on the Taguchi method. Ahmad et al. [
12] demonstrated a novel predictive model for heating and cooling load demand based on a data mining approach. The models were designed to enhance the prediction accuracy and the management of heat load. Traditional heat load forecasting methods have insufficient ability to express the inherent complex characteristics, and the prediction accuracy faces difficulties in meeting the actual demand.
However, with the gradual improvement of machine learning algorithms, the field of artificial intelligence has gradually extended to the field of heat load forecasting. In Ref. [
13,
14], multi-layer perception (MLP) and support vector regression (SVR) models were investigated for forecasting the energy consumption of residential buildings, as well as the artificial neural network (ANN) model [
15,
16]. Bui et al. [
17] examined the performance of a hybrid model based on machine learning and evolutionary algorithm. Le et al. [
18] proposed a forecasting algorithm for buildings’ heat load based on the integration of artificial neural network and heuristics algorithms. Le et al. [
19] estimated the heat load of buildings based on PSO-XGBoost. Kiesel et al. [
20] explored the influence of different inputs on the heat load of buildings. Guelpa et al. [
21] presented a fast approach to estimate the daily thermal demand of buildings with smart meters. Moayedi et al. [
22] employed six machine learning techniques for the problem of heat load energy-efficient buildings. Koschwitz et al. [
23] proposed a data-driven thermal load forecasting algorithm based on epsilon-SVM Regression (epsilon-SVM-R). Chou et al. [
24] estimated the heat load of buildings based on various data-mining approaches, such as SVR, ANN, and regression tree, etc. Zhao et al. [
25] proposed a heat load prediction algorithm for working buildings based on machine learning approaches, such as a support vector machine (SVM), and partial least squares (PLS). Roy et al. [
26] explored the predictive algorithm for the heat and cooling loads of residential buildings based on hybrid model of multivariate adaptive regression splines (MARS) and an extreme learning machine (ELM). Liu et al. [
27] proposed a multi-layer model to fully utilize the intrinsic characteristic of meteorological and historical data based on auto-regressive models with exogenous inputs (ARX) and PSO neural network (PSO-NN). Bui et al. [
28] evaluated the application of two robust evolutionary algorithms, namely the genetic algorithm (GA) and the imperialist competition algorithm (ICA), for heating load prediction. Roy et al. [
29] proposed a heat load and cooling load forecasting model based on a deep neural network (DNN). The ensemble of a support vector machine and a discrete wavelet transform algorithm were proposed to forecast consumers’ heat load in district heating systems [
30,
31].
Although the traditional machine-learning based forecasting methodologies listed above have their merits, the non-linear and non-stationary characteristics of building heat load limit their effectiveness for accurate predictions. The traditional machine learning algorithm is not accurate enough to describe the non-linear and non-stationary characteristics of heat load. In this paper, the accuracy of heat load forecasting was improved based on an integrated learning strategy. The most significant feature of complete ensemble empirical mode decomposition with adaptive noise (CEEMDAN) is to solve the problem of adaptive basis function, which could decompose the signal into different time scales automatically [
32,
33,
34,
35]. Compared with the wavelet decomposition algorithm, the CEEMDAN algorithm can effectively solve the problems of wavelet basis function selection and uncertainty principle limitation. It provides a data-driven signal-adaptive decomposition method. To achieve higher accuracy of heat load forecasting, the heat load forecasting model based on the integrated learning algorithm of CEEMDAN and SVR (CEEMDAN-SVR) was investigated in the present work systematically.
The organization of this paper is depicted below.
Section 2 makes an introduction for the working principle of heat metering based on the on-off time-area method (OOTAM);
Section 3 represents the methodology based on proposed hybrid CEEMDAN-SVR;
Section 4 discusses the comprehensive experiments and prediction results; and the overall conclusion is summarized in
Section 5.
2. The Principle of Heat Metering Based on an On-Off Control Strategy in DHS
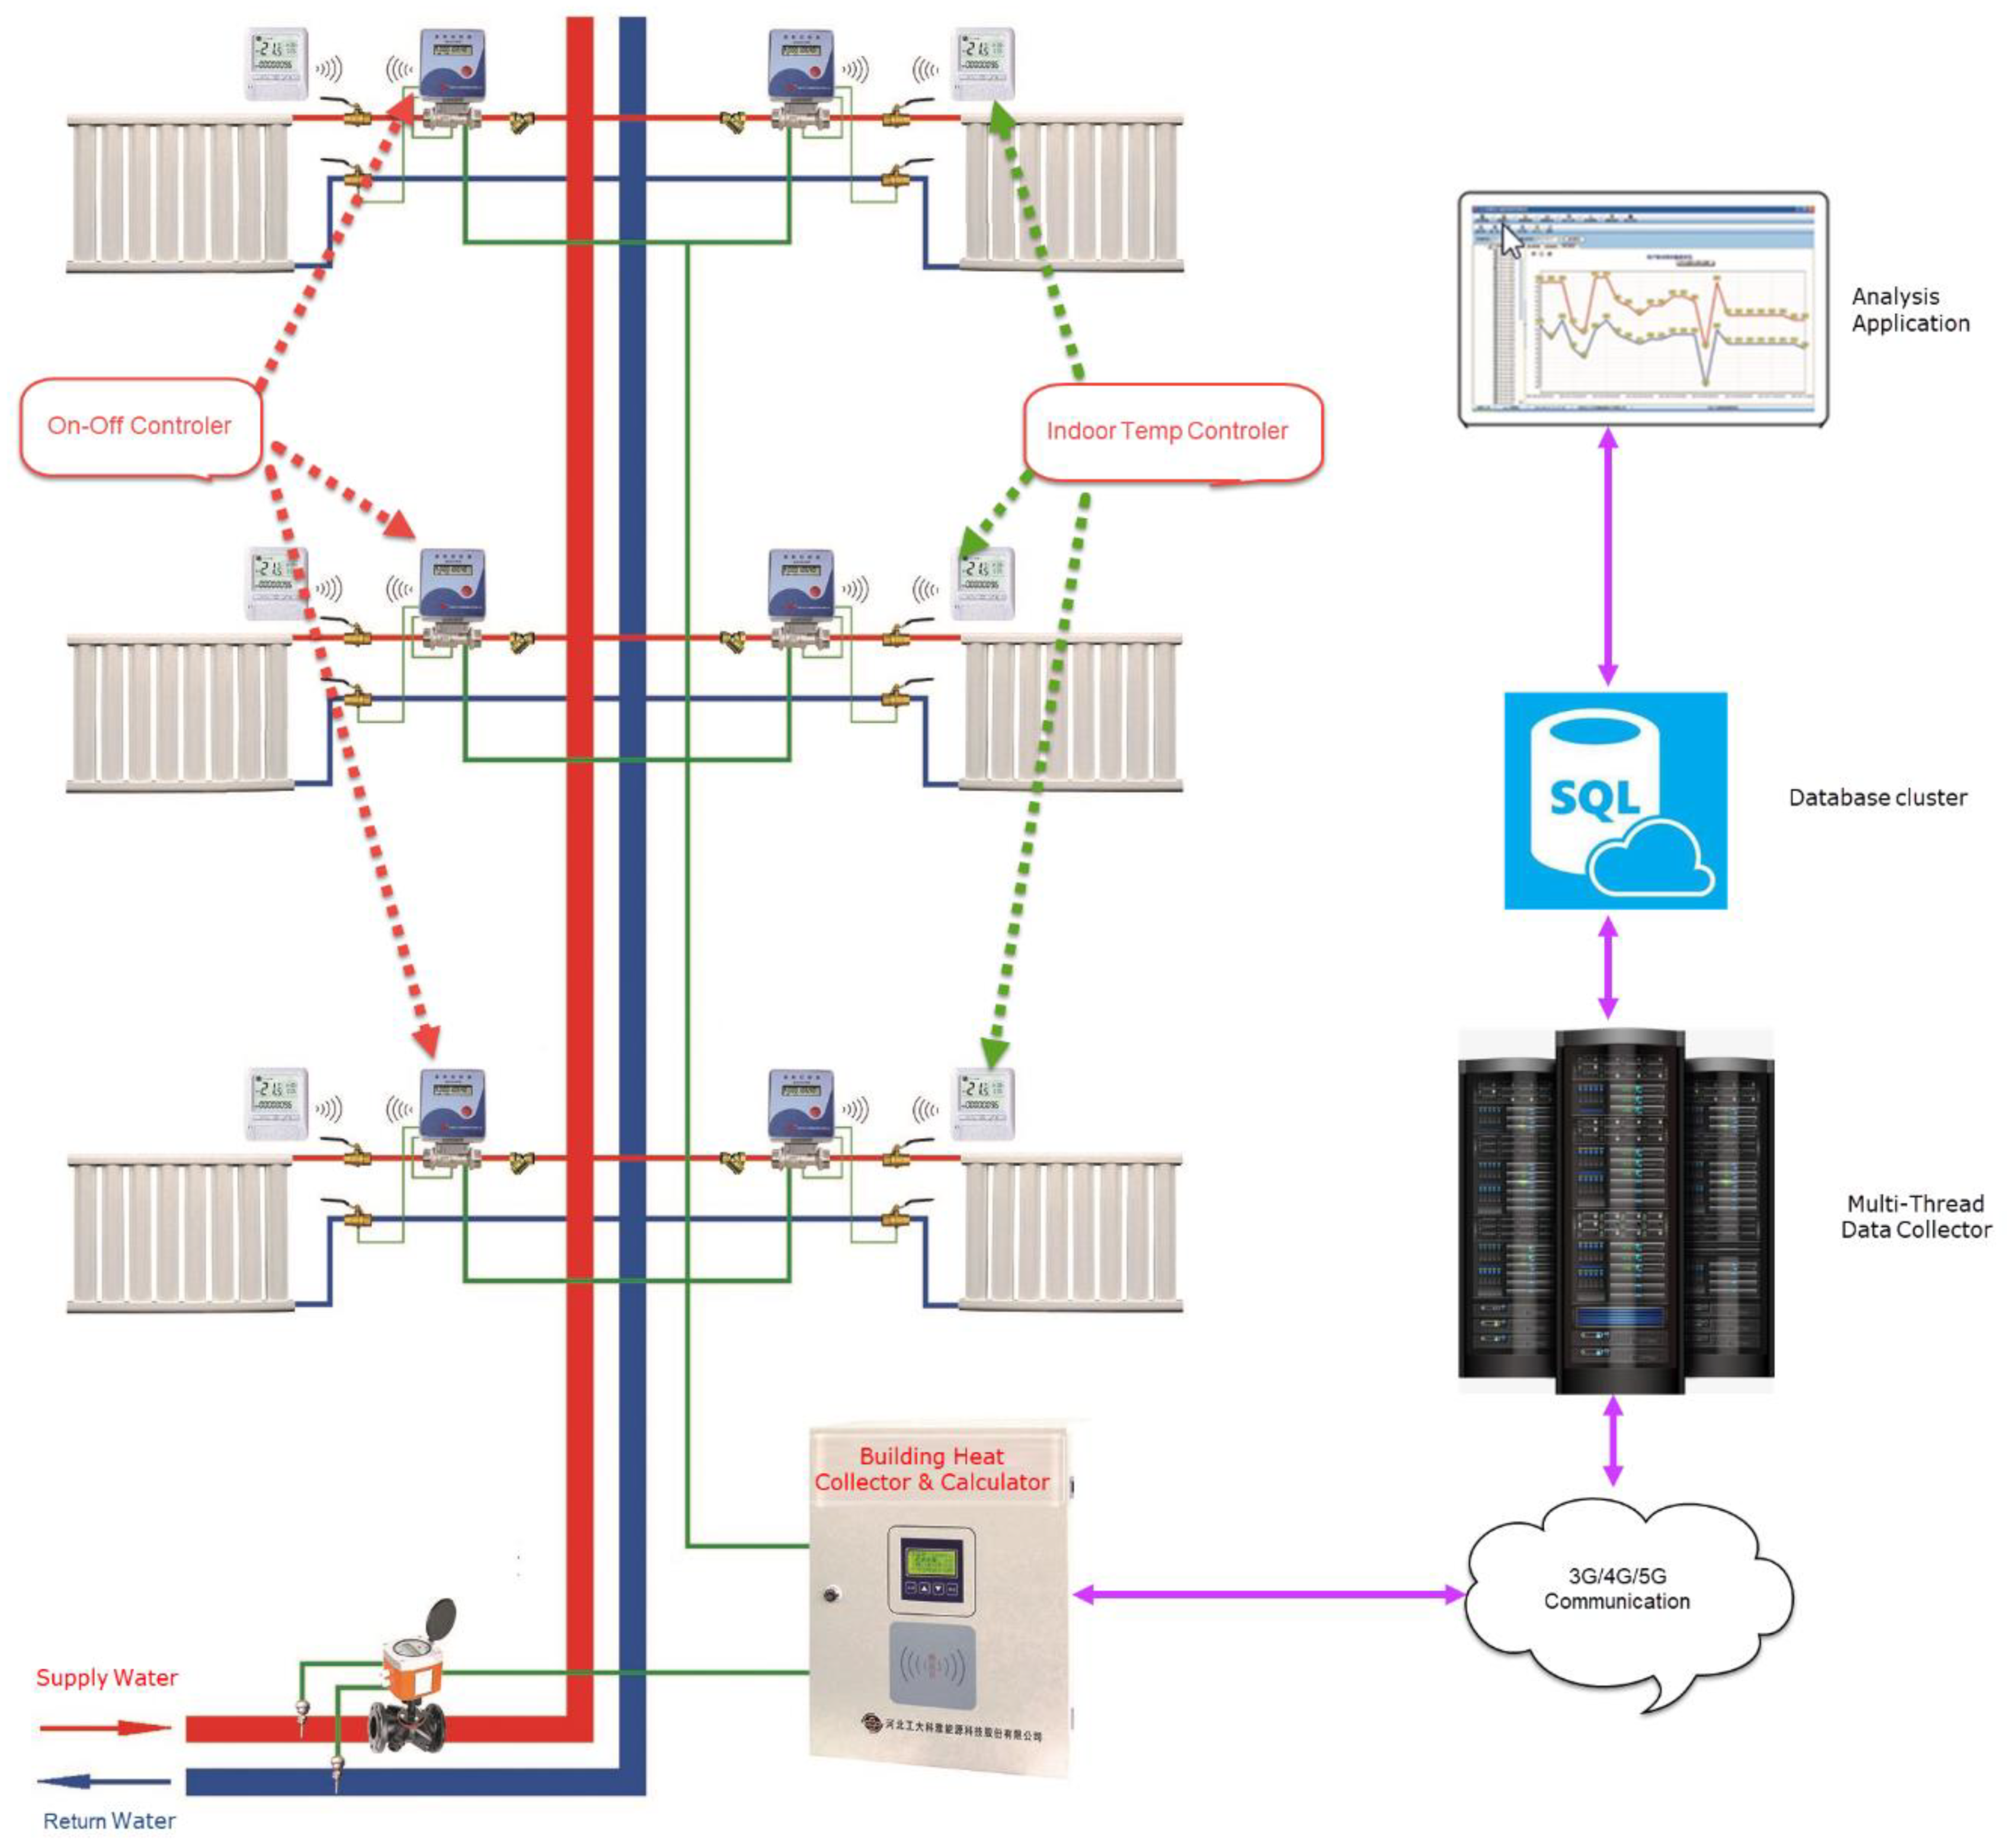
In order to promote people’s awareness of the need for energy conservation in daily heat consumption behavior, we designed a heat allocation measurement approach called on-off time-area method (OOTAM) for multi-story apartment buildings. The main idea of the OOTAM was to install heat meters in each building as the cost settlement point; the valves and indoor temperature controller were installed within each household, and the primary factors, such as accumulated on-off time, room area, and indoor temperature of all users in this building, are calculated by the building processor, which allocates the heat appropriately. The system schematic of the OOTAM system is shown in
Figure 1.
For the household-level connected heating system (as shown in
Figure 1), an on-off controller was installed on the branch of each household to adjust the circulating water of the radiator so as to achieve effective room temperature control. At the same time, a wireless indoor temperature controller was placed in each household for automatic measurement of indoor temperature and target setting. The two parameters and their different values were wirelessly sent to the controller to optimize the on/off ratio of the electric valve in a control cycle. This method can effectively alleviate actual problems, such as uneven indoor temperature distribution, vertical imbalance, and heating water quality in the heating environment. The advantage of the OOTAM is that it can reasonably allocate heat according to the thermal energy need for the comfort of each household, which helps to improve the satisfaction of thermal users and achieve the purpose of saving or conserving heating energy.
Inappropriate design of heating radiators or hydraulic imbalances in existing buildings can lead to inefficient allocation of the heat load within the buildings. Therefore, other effective, technical means must be used to correct the algorithm. Through a large number of empirical studies, our team found that appropriate secondary return water temperature correction was an effective method to improve the on-off time-area method for heat allocation measurement. Compared to other normal heat users, the difference between supply and return temperature of heat users with a larger radiator area is large. The opening time ratio of such users should be multiplied by a correction factor greater than 1, while for heat users with small flow due to hydraulic imbalance or system blockage, the opening time ratio of such users should be multiplied by a correction factor less than 1.
The heat load on the demand side of residential buildings with heat metering transformation is also a non-linear and large time-delay physical variable, which is affected by many factors, such as supply temperature, return temperature, indoor temperature, outdoor temperature, building insulation materials, and residents’ heating comfort, etc. Therefore, it is a complex and difficult task to accurately predict the demand side heat load.
The calculation method of heat allocation based on the OOTAM is shown in the Equations (1) and (2):
where
Qi represents the allocated heat in this heat allocation period for the
ith household (
kWh);
Q represents the total heat consumption in this allocation period (
kWh);
Ri represents the correction coefficient for secondary return temperature;
Si represents the building area (m
2);
τi represents the proportion of cumulative opening time of electronic valves in the
ith household;
represents the cumulative opening time of the electronic valve of the
ith household; Δ
τ represents the total allocation period;
n represents the total number of households in this building.
3. Methodology and Analysis
3.1. The Complete Ensemble Empirical Mode Decomposition with Adaptive Noise (CEEMDAN)
The empirical mode decomposition (EMD) proposed by N. E. Huang is suitable to process the signal in the time-frequency domain adaptively [
36]. In theory, the method can automatically select the basis function and decompose various types of signals according to its time scale, which is especially suitable for processing non-stationary and non-linear data. However, the EMD exhibits some defects, such as mode aliasing and nonorthogonality. Huang et al. [
37] proposed ensemble empirical mode decomposition (EEMD), which introduced Gaussian white noise to the original signal for the process of decomposition. However, the Eigen mode functions obtained by decomposition varies with the change of artificial white noise, which makes the EEMD method unstable, and it is difficult to eliminate the reconstruction error caused by Gaussian white noise. To solve the above problems, Torres et al. [
38] proposed an improved CEEMDAN further, which can achieve better separation of Eigen mode functions, accurately reconstructing the original signal.
Heat load with complex non-linear and non-stationary characteristics is not an intrinsic mode function, but the data may contain multiple fluctuation modes at any time point, and the frequency characteristics of heat load cannot be fully characterized simply by the Hilbert transform. We need to decompose the heat load by CEEMDAN to obtain its intrinsic mode function and then carry out the Hilbert transform on each intrinsic mode function to finally obtain the Hilbert spectrum of the heat load.
3.2. Support Vector Regression(SVR)
The support vector machine (SVM) is essentially a data-driven linear classifier. Its goal is to achieve a reasonable segmentation of samples using the maximum margin hyperplane. The SVR can be obtained by extending SVM from classification problems to a regression problem.
Given the training sample
, we hope to obtain a regression model
f(x) shown in Equation (3), which is approximately close to the target
y, where
W and
B are the model parameters to be determined.
When the fitting function
f(x) approximates
y with the maximum error ϵ, the SVR can be rewritten as shown in Formula (4).
where
C represents the regularization constant term and
le represents the insensitive loss function:
After introducing the relaxation variables and the Lagrangian multipliers and then zeroing the partial derivative of the loss function, we can obtain the following result:
The solution for SVR can be obtained as follows:
The sample that can make
is the support vector of SVR, which must fall outside the ε-septum. If we consider the following feature-mapping function
,
The solution for SVR can be expressed as follows:
where
is the kernel function.
3.3. The Heat Load Forecasting Model Based on CEEMDAN-SVR
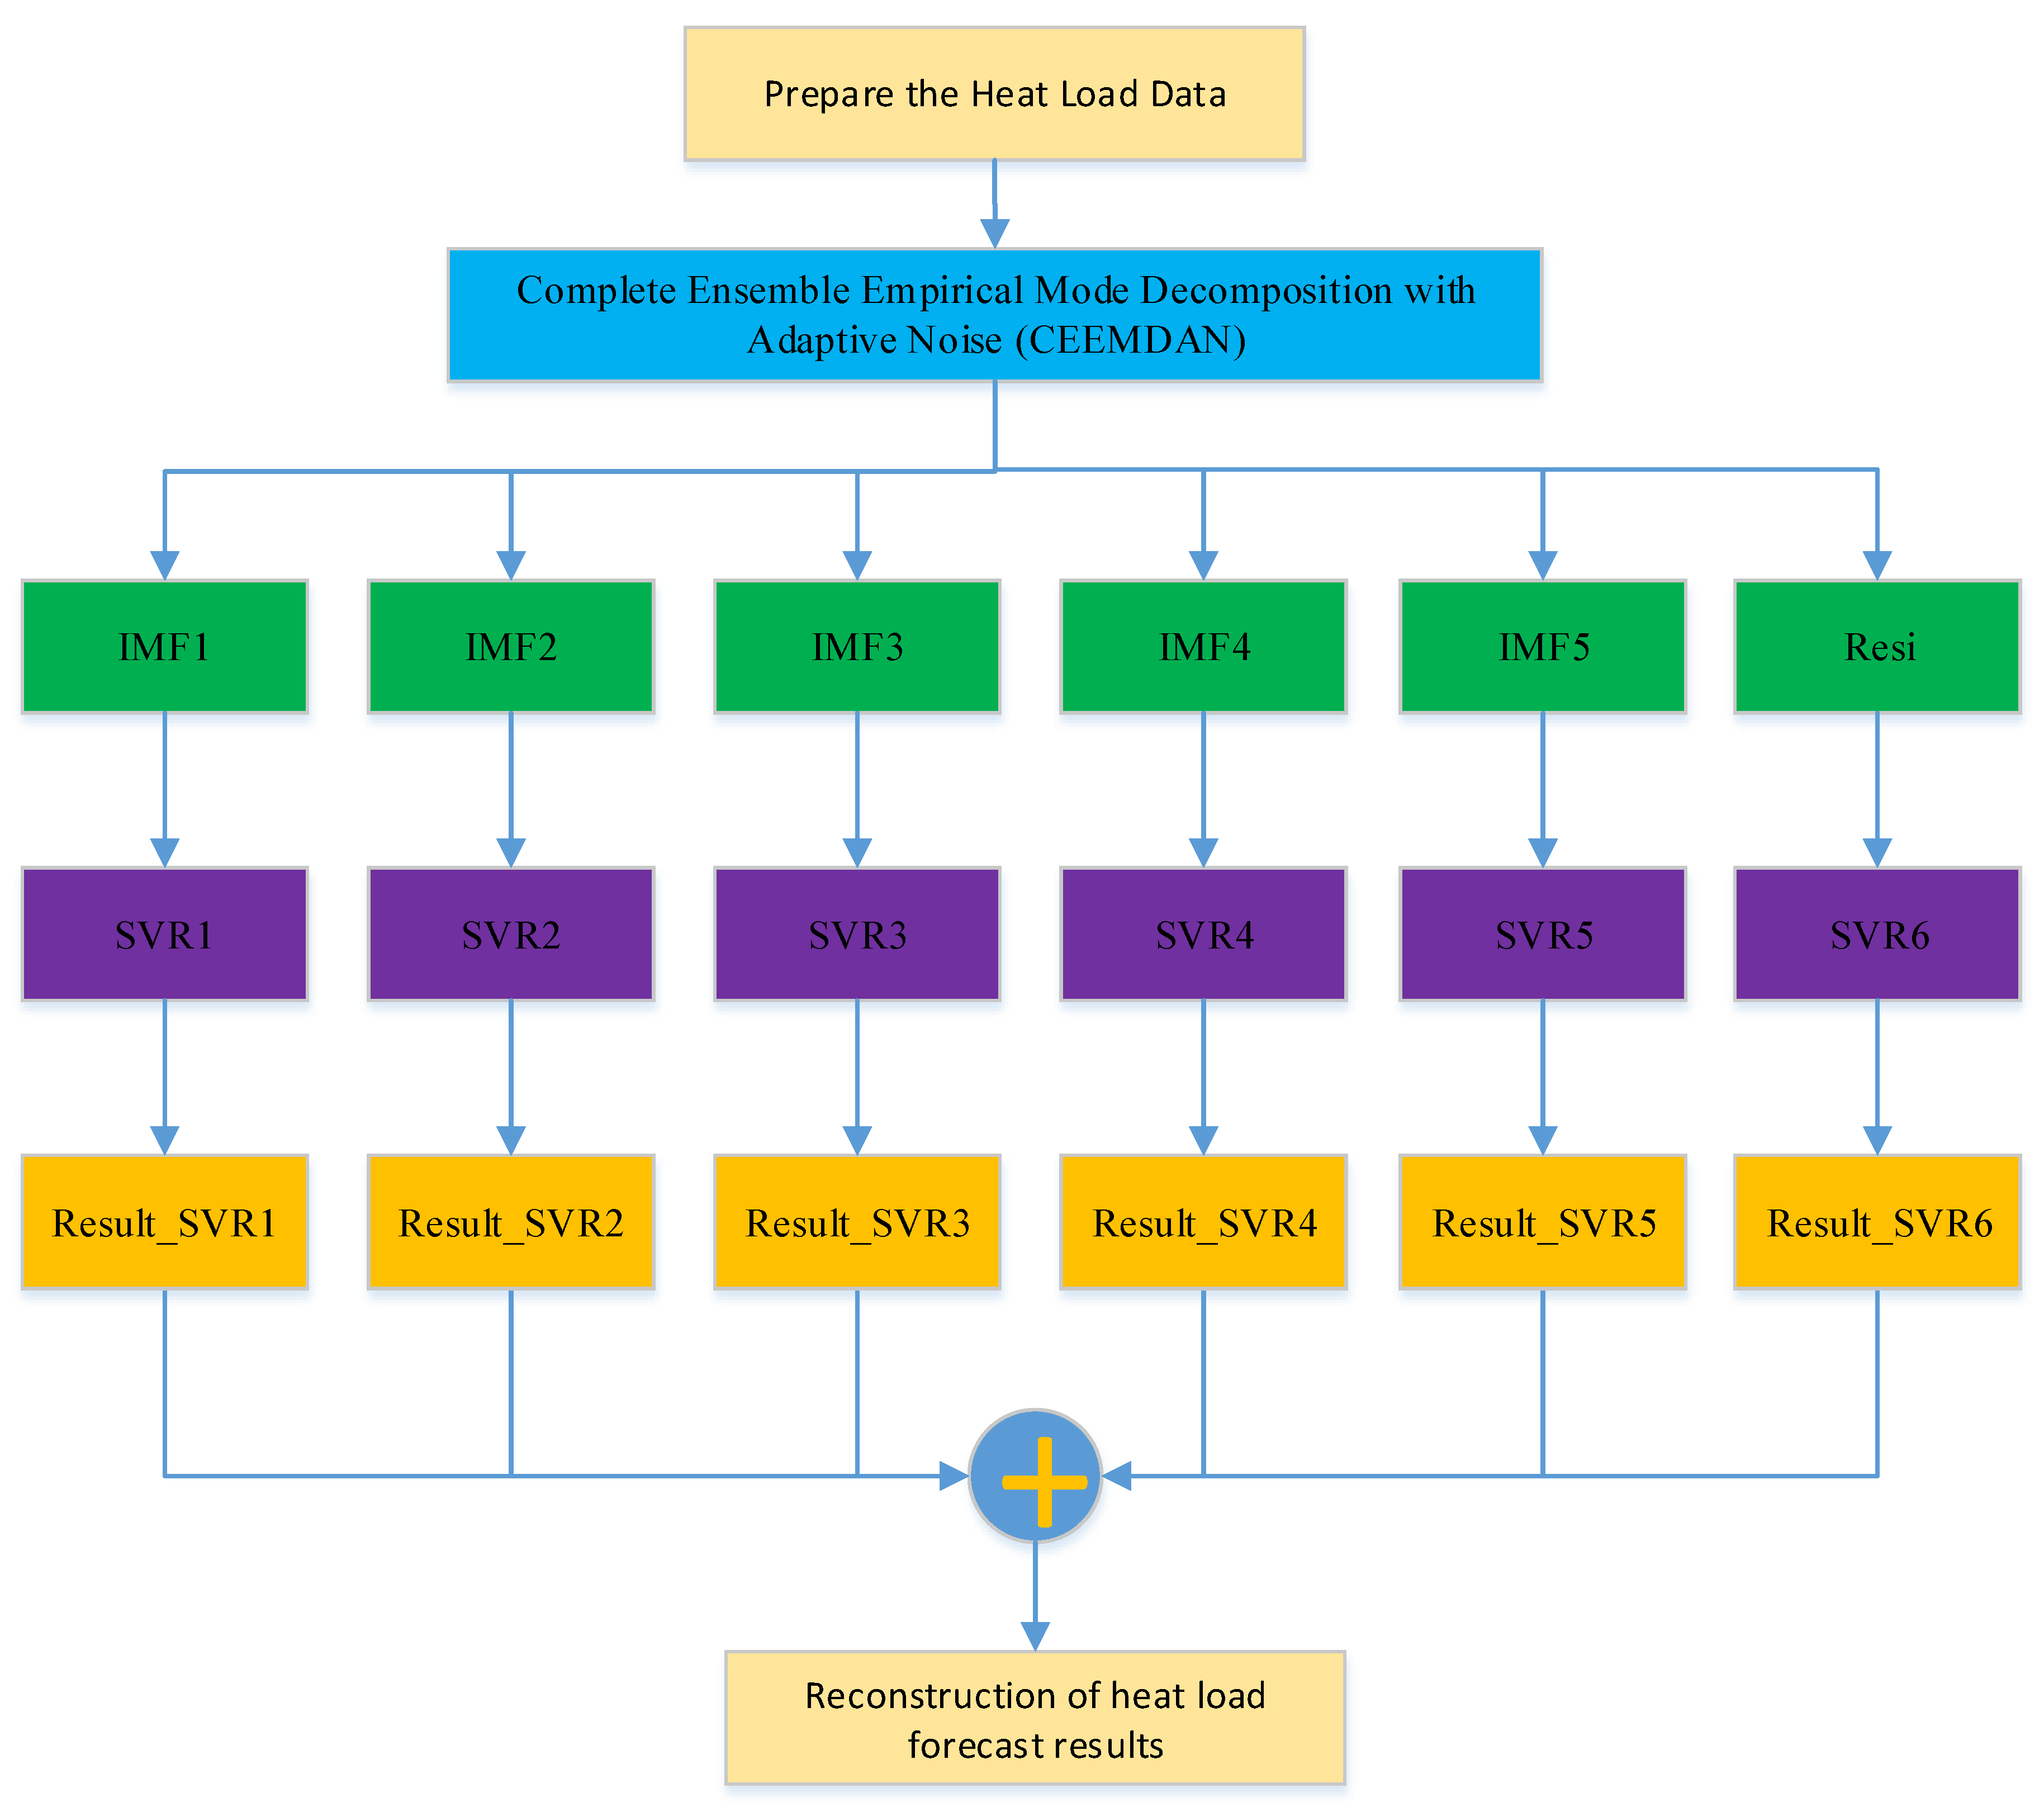
Heat load can be affected by many factors in a DHS, which is a random variable with non-linear, non-stationary, and time-delay characteristics. Hence, we proposed the heat load forecasting algorithm based on CEEMDAN-SVR to solve this problem by obtaining a high-precision prediction algorithm. It is based on the principle of “divide and rule” to predict the heat load for residential buildings. The CEEMDAN method is used to decompose a building’s heat load time series, which is difficult to fit into several subsequences with obvious periodicity and smoothness, which avoids the difficulty of using the SVR model to predict non-linear and unstable data directly. Each subsequence is trained and fitted by different SVR models, which makes full use of the advantages of the SVR machine learning algorithm, such as strong learning ability and good adaptability. Compared with the traditional method and the SVR method, the proposed ensemble forecasting method has better performance in the short-term prediction of building heat load time series.
Firstly, we decomposed the heat load into multiple intrinsic mode functions (IMFs) and residual vectors based on the CEEMDAN algorithm so that the data characteristics of each IMF could be simplified. Subsequently, different prediction components were summed to obtain the overall, more accurate heat load forecasting results. Through the analytical characterization analysis of the heat load data, we found that it could be decomposed into the sum of five IMFs and residuals as shown in Equation (10).
where
imfi (i = 1,…5) represents the
ith intrinsic mode function;
resi represents the residual error of the empirical mode decomposition;
Q represents the heat load of the residual buildings;
CEEMDAN represents the function of the Complete Ensemble Empirical Mode Decomposition with Adaptive Noise.
The CEEMDAN decomposition results were input into the respective SVR models, and the results are as follows:
where
represents the prediction result of each IMF based on each SVR respectively;
represents the prediction result of residual error based on SVR;
SVRi (i = 1,…6) represents the prediction model based on each SVR respectively.
Thus, the total prediction result
of the heat load is as follows:
Different kernel functions are suitable for processing data with different characteristics. The SVM with a linear kernel function for the IMF has a low-frequency component dominant and the SVM with a radial basis function (RBF) kernel function for IMFs has a high-frequency component.
The grid search method and random search method were used to perform the parameter optimization of the SVM model, such as penalty coefficients C and gamma. A higher value of coefficient C is easy to fall into overfitting; on the contrary, a smaller value of coefficient C corresponds to underfitting. An appropriate value for the coefficient C makes the algorithm have good generalization ability. However, the gamma coefficient determines the number of support vectors, which affects the convergence speed. The system schematic diagram is shown in
Figure 2.
3.4. Evaluation Criteria
To compare the advantages and disadvantages of the algorithm more accurately, classical evaluation indices are used in this paper, such as root mean squared error(RMSE), mean absolute error(MAE), mean squared error(MSE), and mean absolute percentage error(MAPE), in Formula (13).
4. Experiments and Discussion
4.1. Data Description
In order to test whether our algorithm has a better prediction ability for real engineering scenarios, we selected the historical heat load monitoring data of three buildings in Xingtai City in northern China in the heating season of 2019–2020. In 2011–2012, these buildings were retrofitted with the OOTAM. According to the construction specifications, ultrasonic heat meters and temperature sensors were installed at each building entrance, and a building calculator designed by our team for heat sharing and data acquisition was also installed at the building entrance. The calculator was connected with the data center through a wireless model, and all data were collected by polling regularly (once/4 h). This smart district heating system monitors and controls the heating energy consumption in thousands of buildings. Considering the building thermal inertia, control frequency, and communication cost, we set the allocation frequency of building heat consumption based on the OOTAM algorithm as once a day. It can improve the thermal comfort of building residents after regulation and reduce the communication complexity of the system, as well as improve the reliability and economy of the system. There are 120 days for formal central heating in the heating season in Xingtai City, from November 15 to March 15 of the next year. To analyze the generalization ability of the model, we selected three typical heating buildings for comparison. Each of the three sample data sets contains 120 sample data.
In the heat load forecasting of buildings with the OOTAM heat metering, the related influencing factors included supply temperature, return temperature, and outdoor temperature. To obtain the characteristic distribution of the heat load of residential buildings and its related factors, we selected the original data of one of the buildings for statistical analysis, and the results are shown in
Figure 3. The dynamic curves of heat load and its three related factors are shown in
Figure 3. It is evident from
Figure 3 that these three parameters, including heat load, supply temperature, and return temperature, have strong non-linear and non-stationary characteristics, and the data may contain noise due to abnormal sensors and other reasons. The heat load forecasting algorithm needs to be combined with weather forecast information. Outdoor temperature is one of the important factors affecting heat load. In order to ensure the thermal user comfort and energy saving, an appropriate control strategy should be adopted to make the heat load change dynamically with changes in outdoor temperature. The average outdoor temperature data of weather forecast in this paper are from the meteorological service website of China Meteorological Administration (
www.weather.com.cn), which also present complex non-stationary characteristics. We can see the daily weather forecast data for the next 7 days. The statistics of the heat load and related factors of the residential building are shown in
Table 1.
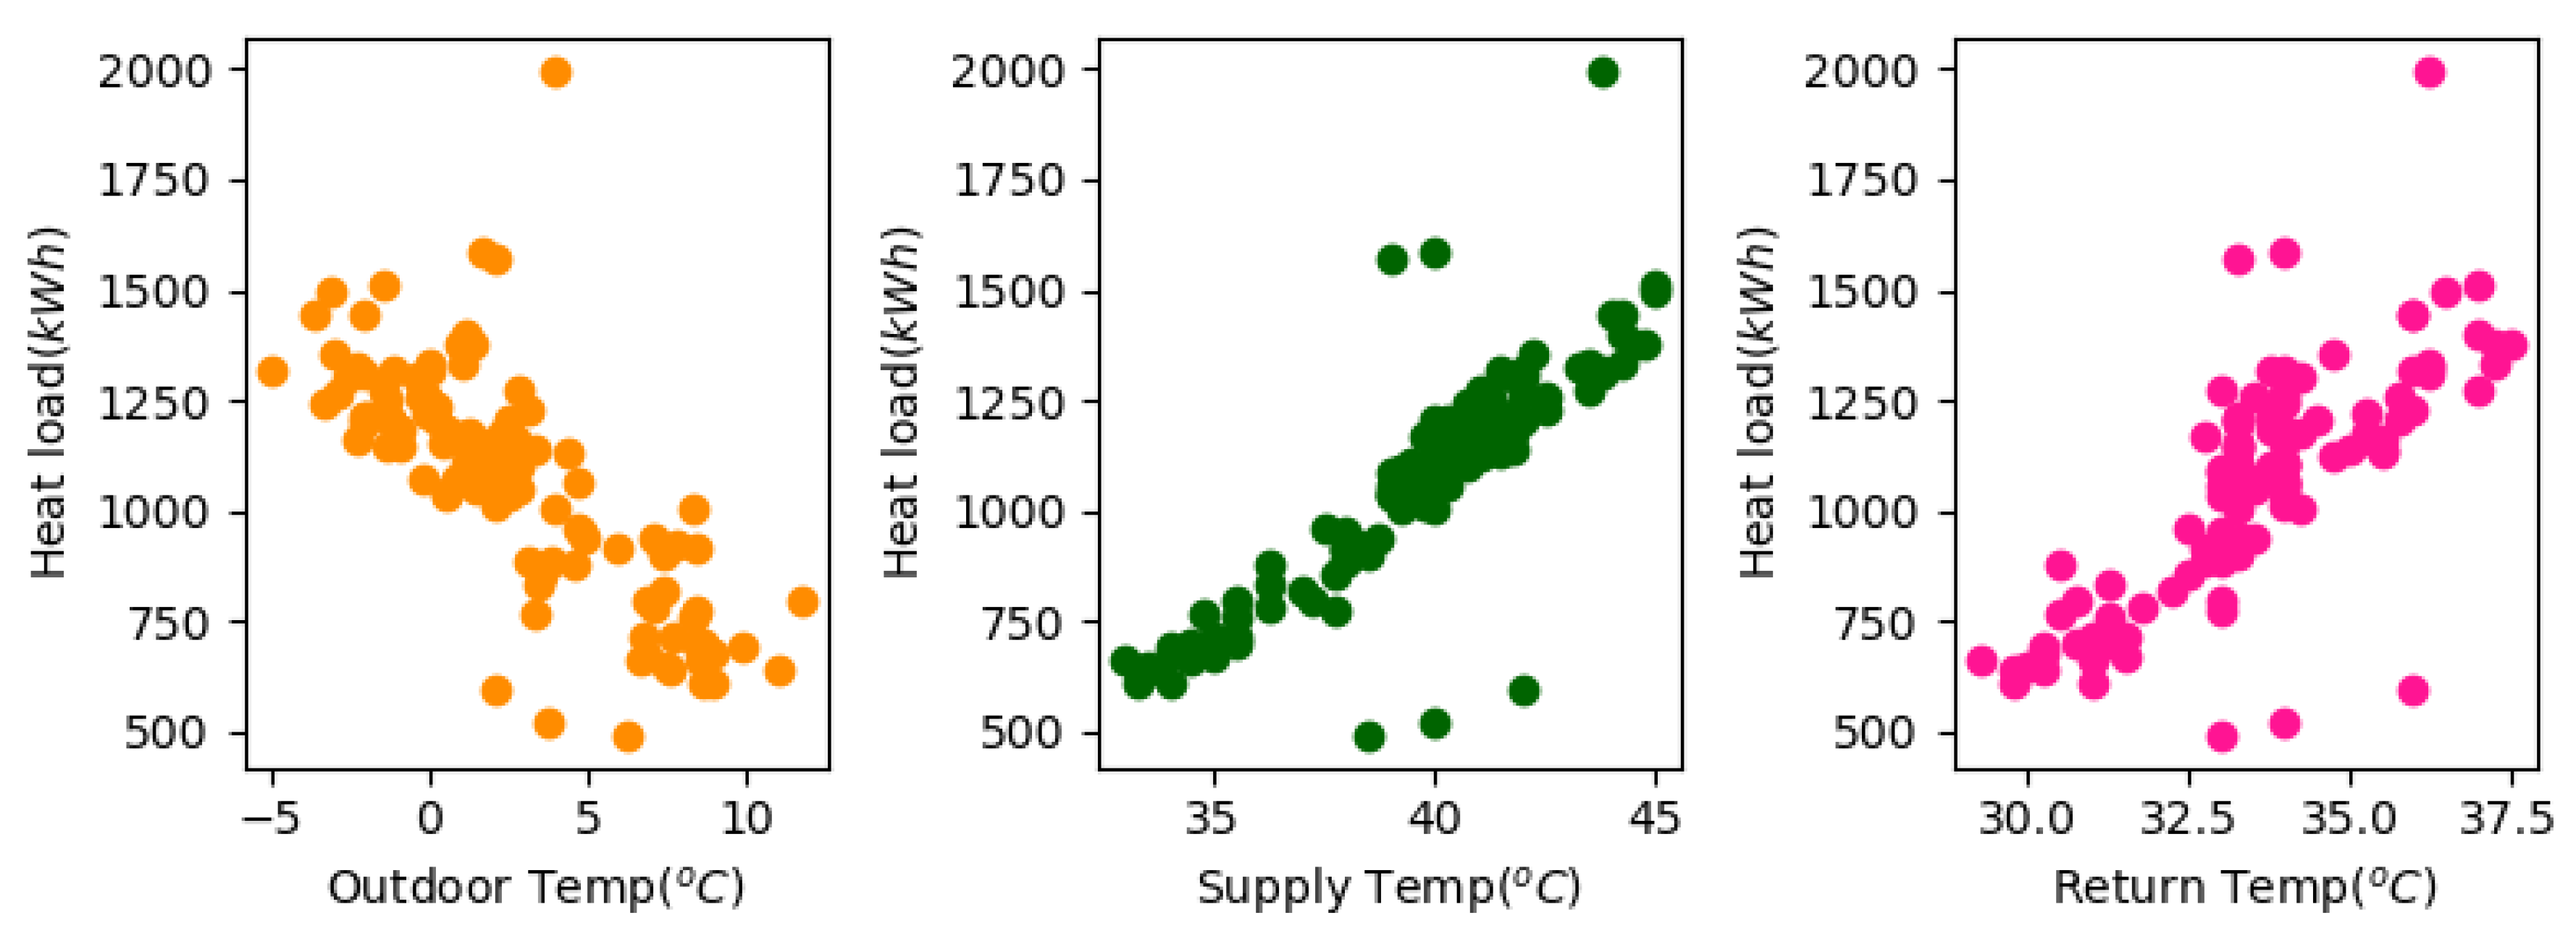
Scatter diagrams of the comparative analysis between building heat load and its three related factors are shown in
Figure 4. It is obvious that the scatter diagram distributions of heat load and these three factors are relatively loose, which means that there is a strong non-linear characteristic between them. Therefore, the CEEMDAN-SVR-based algorithm proposed in this paper has significant advantages to deal with the heat load forecasting problems with non-linear and non-stationary features.
We decomposed the historical heat load data of building #1 by CEEMDAN and obtained five different intrinsic modal functions and residuals, as shown in
Figure 5. It is evident from
Figure 5 that the five IMFs have different time-domain characteristics, which reflect the internal characteristics of heat load in different time scales. The final residual term reflects the error after the CEEMDAN decomposition process. The frequency-domain characteristics of the corresponding five IMFs are shown in
Figure 6. It is obvious from
Figure 6 that IMF1, IMF2, and IMF3 belong to high-frequency components, while IMF4 and IMF5 are low-frequency components. Different frequency characteristics in the frequency domain correspond to the non-linear degree in the time domain. The non-linearity of the high-frequency component is higher than that of the low-frequency component. Therefore, we chose SVR models with different kernel functions for different IMFs, and the hyperparameters of each model are shown in
Table 2.
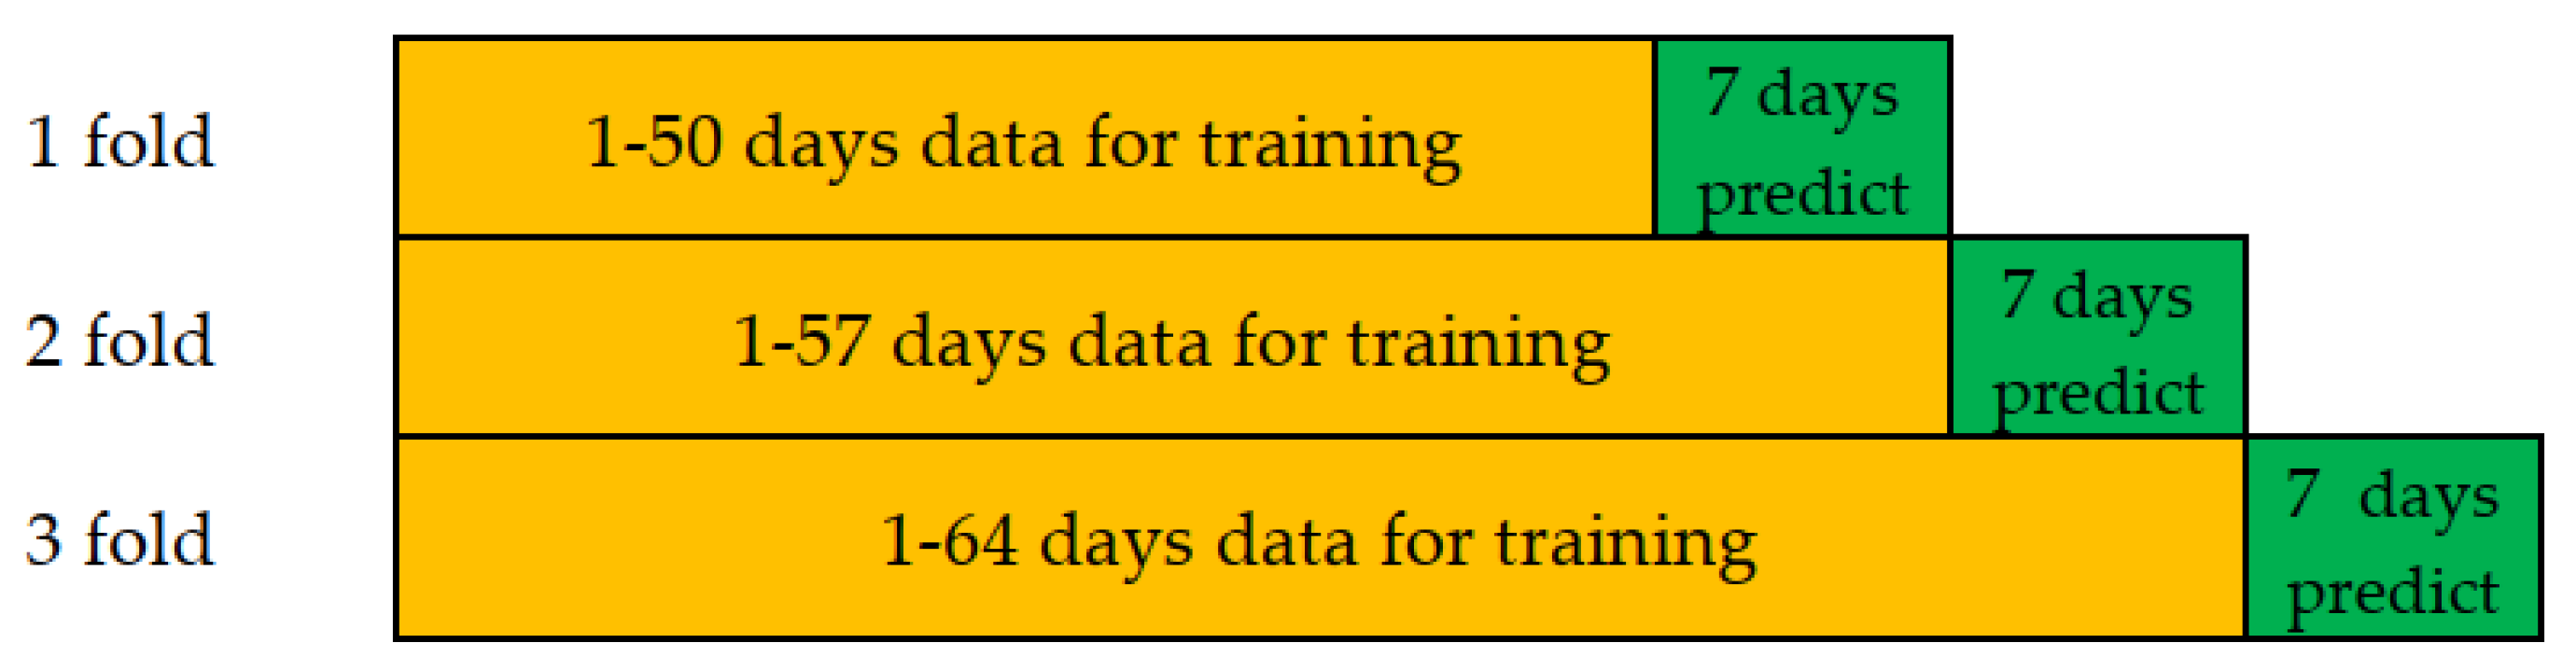
In order to test the prediction accuracy of the proposed ensemble algorithm based on CEEMDAN-SVR and to avoid overfitting problems, the n-fold verification method was used to predict the heat load in the next 7 days in this paper. Due to the strict time sequence characteristics of heat load history datasets, we use the three-fold experimental method to predict the heat load. As shown in
Figure 3, a complete heating season roughly includes three stages: the early cold period, the high cold period, and the last cold period. Because the outdoor temperature characteristics of the early and late cold periods are similar, the training samples should generally include part of the data of the early cold period and of the high cold period. The dataset division used in the training model and prediction is shown in
Figure 7. The final experimental evaluation criteria are obtained by averaging the three prediction results.
4.2. Performance Evaluation
To obtain the performance evaluation of the heat load prediction algorithm based on CEEMDAN-SVR, the heat load data of three groups of different buildings in Xingtai City, collected during the heating season of 2019–2020, were used for detailed comparative experiments. The prediction performance comparisons were conducted with several other algorithms, such as the original SVR, MLP, extreme tree regression ETR, RFR, GBR, and EMD-SVR algorithms. The main parameters of the comparison algorithms are shown in
Table 3. According to the data division method shown in
Figure 7, this paper constructs three different training models for the historical heat load data of each building, and each model predicts the heat load change of the building in the next 7 days. The predicted 7-day heat load curves of the three buildings are shown in
Figure 8,
Figure 9 and
Figure 10. These results reveal that the proposed CEEMDAN-SVR algorithm outperformed other algorithms.
The performance results of these three buildings under different prediction algorithms are shown in
Table 4,
Table 5 and
Table 6. It is evident from the heat load data, when compared with the original SVR algorithm with different kernel functions, that the algorithm can provide higher prediction accuracy than the original SVR algorithm. Therefore, the proposed CEEMDAN-SVR forecasting algorithm has good adaptability and prediction accuracy. It can accurately describe the non-linear and non-stationary characteristics of heating load, thereby making it more suitable for solving the heat load problem of buildings.
The prediction accuracy of MAPE based on the proposed CEEMDAN-SVR algorithm can reach 1.8%, which is significantly higher than other algorithms, where the RMSE, MAE, and MSE errors were relatively of lower magnitudes. It is evident from
Table 4 that the prediction accuracy of MAPE based on the proposed CEEMDAN-SVR algorithm reaches 2.3%, which is still higher than other algorithms, comparatively. This is because the dynamic change of the heat load of building #2 is larger and the prediction is more difficult.
Similarly, it is obvious from
Table 5 that the prediction accuracy index of MAPE based on the proposed CEEMDAN-SVR algorithm reaches 2.8%, and the other error indices, RMSE, MAE, and MSE, are also better than other algorithms. Furthermore, the combined CEEMDAN-SVR algorithm can better model internal characteristics in different time scales through intrinsic mode decomposition of the heat load data when compared with the original SVR algorithm with different kernel functions. The algorithm can provide higher prediction accuracy than the original SVR. Therefore, the proposed CEEMDAN-SVR forecasting algorithm has good adaptability and prediction accuracy. It can accurately describe the non-linear and non-stationary characteristics of heating load, thereby making it more suitable for solving the heat load problem of buildings.
The heat load demand in the next 7 days can be obtained by the prediction model, which provides the basis for the formulation of a short-term control strategy for the smart district heating system. The first step of the intelligent control algorithm of the actual district heating system is to train the prediction model according to the historical data of the previous period and then to generate the optimal control strategy according to the predicted heat load. The machine learning prediction model based on CEEMDAN-SVR can obtain a more accurate prediction model according to the small sample dataset, and the prediction length is 7 days each time. Therefore, the training samples in this round select the historical data of the beginning 50 days of the heating period. The length of training samples is accumulated with the increase in samples.
In our experiments, the super parameters of the prediction model from three different buildings were the same and the data set segmentation method was also completely consistent. We obtained different prediction models driven through the input data of different buildings. For different buildings under the same DHS, although the maintenance structure, insulation performance, and construction year are different, we can use a unified model structure and super parameters to obtain the accurate heat load prediction model of various buildings.
5. Conclusions
The goals of DHS intellectualization are to realize on-demand heating and balanced heating and minimize energy consumption, operation cost, and pollution emission under the premise of meeting users’ thermal comfort demands. The accurate heat load prediction algorithm of buildings on the demand side is essential for the regulation and control of heat source and heat exchange stations on the supply side. However, due to different building envelopes, thermal insulation performances, and different thermal comfort requirements of residents, the buildings’ heat load itself has significant non-linear and non-stationary characteristics, which are a big challenge for the accurate heat load prediction algorithm. In order to deal with this problem, this paper proposed a forecasting algorithm based on the CEEMDAN-SVR combination strategy. The algorithm can demonstrate the internal characteristics of heat load in different time scales by employing a modal decomposition process. Different SVR models are then used to calculate and predict the obtained intrinsic modal functions. Finally, a more accurate prediction model is obtained. In this paper, we compared the performance between the proposed CEEMDAN-SVR algorithm and state-of-the-art algorithms, such as forest tree regression (FTR), ETR, SVR (linear, poly, RBF kernel), MLP, and EMD-SVR, etc. The experimental results reveal that the proposed CEEMDAN-SVR model improved the prediction accuracy and it can more accurately model the complex characteristics of heat load, such as non-linear and non-stationary ones. In the practical application of the model, we will use the historical data of the previous heating season to do the pre-training of the model, and use the data of the new heating season to update and optimize the model to carry out short-term prediction of the future heat load data of the current heating season, so as to improve the efficiency of the model.
In the future, it is necessary to quantitatively analyze the thermal comfort demand of different households from the demand side and build a more accurate building heat load prediction model based on the spatial and temporal distribution characteristics of indoor temperature, and complete the optimization of the control model with the heat exchange station.


