Enhanced Hydrate-Based Geological CO2 Capture and Sequestration as a Mitigation Strategy to Address Climate Change


1
Center for Energy Resource Engineering (CERE), Department of Chemical Engineering, Technical University of Denmark, 2800 Kgs. Lyngby, Denmark
2
PROSYS Research Centre, Department Chemical and Biochemical Engineering, Technical University of Denmark, 2800 Kgs. Lyngby, Denmark
*
Author to whom correspondence should be addressed.
Energies 2020, 13(21), 5661; https://doi.org/10.3390/en13215661
Submission received: 15 August 2020
/
Revised: 15 October 2020
/
Accepted: 21 October 2020
/
Published: 29 October 2020
(This article belongs to the Special Issue CO2 Capture, Storage, Utilisation and Sequestration and Hydrocarbon Extraction)
Abstract
:Geological sequestration of CO2-rich gas as a CO2 capture and storage technique has a lower technical and cost barrier compared to industrial scale-up. In this study, we have proposed CO2 capture and storage via hydrate in geological formation within the hydrate stability zone as a novel technique to contribute to global warming mitigation strategies, including carbon capture, utilization, and storage (CCUS) and to prevent vast methane release into the atmosphere caused by hydrate melting. We have attempted to enhance total gas uptake and CO2 capture efficiency in hydrate in the presence of kinetic promoters while using diluted CO2 gas (CO2-N2 mixture). Experiments are performed using unfrozen sands within hydrate stability zone condition and in the presence of low dosage surfactant and amino acids. Hydrate formation parameters, including sub-cooling temperature, induction time, total gas uptake, and split fraction, are calculated during the single-step formation and dissociation process. The effect of sands with varying particle sizes (160–630 µm, 1400–5000 µm), low dosage promoter (500–3000 ppm) and CO2 concentration in feed gas (20–30 mol%) on formation kinetic parameters was investigated. Enhanced formation kinetics are observed in the presence of surfactant (1000–3000 ppm) and hydrophobic amino acids (3000 ppm) at 120 bar and 1 ℃ experimental conditions. We report induction time in the range of 7–170 min and CO2 split fraction (0.60–0.90) in hydrate for 120 bar initial injection pressure. CO2 split fraction can be enhanced by reducing sand particle size or increasing the CO2 mol% in incoming feed gas at given injection pressure. This study also reports that formation kinetics in a porous medium are influenced by hydrate morphology. Hydrate morphology influences gas and water migration within sediments and controls pore space or particle surface correlation with the formation kinetics within coarse sediments. This investigation demonstrates the potential application of bio-friendly amino acids as promoters to enhance CO2 capture and storage within hydrate. Sufficient contact time at gas-liquid interface and higher CO2 separation efficiency is recorded in the presence of amino acids. The findings of this study could be useful in exploring the promoter-driven pore habitat of CO2-rich hydrates in sediments to address climate change.
1. Introduction
CH4 gas is known to cause 20 times more global warming and is considered a potent greenhouse gas, absorbing infrared radiation about 25 times more effectively than carbon dioxide [1,2]. It is proven that a large amount of CH4 gas is stored in the form of ice-like compounds known as gas hydrates at high-pressure and low-temperature geological locations found in marine or permafrost environments, distributed evenly across the world [3,4]. These deposits remain untouched and hold a reserve estimated to be twice the known fossil fuel available [5,6,7]. These cage-like crystalline compounds are formed with the help of van der Waals forced inclusion of methane molecules into cage-like crystalline structures formed by water molecules that are hydrogen-bonded together [3,4]. Scientists have recently confirmed a large amount of continuous methane release from these deposits at many locations due to destabilization and melting caused by a continuous temperature increase in the earth’s atmosphere and sea [8]. Large amounts of methane leaks and methane-saturated water are also reported in onshore permafrost regions in the Russian arctic due to the melting of gas hydrates [9]. CO2 capture in sediments through CO2-rich gas injection into methane gas hydrate reservoir is a recently proposed technology for methane recovery and simultaneously storing CO2 in deposits [10]. Depleted methane hydrate reservoirs are also proposed as the potential CO2 storage site for injecting CO2 or CO2/N2 mixtures [11,12]. In our recent experimental study [13], no CH4 production was observed after CO2 injection into methane hydrate-bearing sediments when a hydrate promoter (HP), such as sodium dodecyl sulfate (SDS) or L-methionine, was present in water. This was caused due to quick CO2 hydrate layer formation as well as methane hydrate reformation in the presence of HPs. Methane hydrate deposits, as CO2 storage sites, have many advantages. Methane hydrate deposits are uniformly distributed both in marine and permafrost locations across the world. The properties of methane [14] and CO2 [15] hydrate-bearing sediments are extensively studied at laboratory scale. The presence of methane hydrate also assures CO2 hydrate formation at similar pressure and temperature conditions, as CO2 hydrates are thermodynamically more stable than methane hydrates. The presence of CO2 hydrate would shift hydrate composition from pure methane hydrate to mixed CH4-CO2 hydrate within pore space. This would stabilize the whole natural gas hydrate ecosystem by shifting the hydrate equilibrium curve towards CO2 hydrate, delaying hydrate melting at a given pressure and trapping the free methane. Trapping methane could further allow hydrate reformation in medium to long intervals. The conceptual layout is described in Figure 1.
In terms of carbon capture, utilization, and storage (CCUS) technologies, CO2 storage as hydrate within sediments from incoming CO2-rich feed gas is in an early phase of research and development, and most research work is limited to laboratory and simulation studies. Industrial plants, including cement and power plants, have been considered to be significant contributors to the greenhouse effect [16]. Thus, there have been considerable technical developments towards the reduction in CO2 emissions from power plants [17]. Recently, CO2 capture and storage, based on gas hydrates from flue gas (CO2-N2) and fuel gas (CO2-H2), has been seen as a promising technology to capture CO2 [18,19,20], as it is more environmentally friendly and less costly compared to other available options, such as amine-based absorbance techniques [19]. Most of the existing studies focused on CO2 separation and its capture from incoming CO2/N2 feed gas streams using bulk water or the fixed bed reactor. Compared with existing methods, hydrate-based CO2 capture is free from contamination, uses water as raw material, releases no pollutants, has high CO2 storage capacity, and includes the simple process steps of formation and dissociation [21]. In the presence of the porous medium, the gas–liquid contact area would increase, which could lead to higher hydrate conversion and large gas storage capacity. CO2 capture and storage in geological formations is an attractive proposition as technical and economic costs are lower. Geological formations located at low-temperature, high-pressure conditions, such as aquifers located below permafrost and deep/sub-seabed [22,23,24], could be a potential location for CO2 storage as hydrates, since they offer confined storage, presence of elevated pore pressure, very low CO2 leakage rates in the presence of hydrate seal [25], and long-term storage potential [26,27]. Solid CO2 hydrates have higher mechanical strength than solid ice due to the cementing effect and have negative buoyancy due to having higher density than saline water, pore water, CO2 gas, and ice.
A trapping mechanism via the CO2 hydrate layer at the base of the gas hydrate stability zone, to prevent upward migration of CO2, was suggested by Koide et al. [24]. Projects having CO2 successfully stored in deep saline aquifers highlight the importance of a suitable sealing cap mechanism to prevent CO2 from leaking for long term storage [28,29,30]. Potential locations to capture and store CO2 as gas hydrate are described in Figure 2. Stian et al. [31] have suggested that the CO2 hydrate self-sealing mechanism is valid for both shallow marine aquifers as well as formations in permafrost settings.
Most studies on the geological storage of CO2 as hydrates have focused on injecting pure CO2 into geological sediments found within hydrate formation conditions including permafrost/sub permafrost [32,33] and below oceanic seabed sediments [34]. A limitation of using pure CO2 is quick hydrate film formation at the injection point, allowing only a limited volume to be injected into sediments [35,36], thus having lower sweep area. CO2 is quick to form hydrate in the CO2–water system, driven by homogenous and heterogeneous nucleation and high CO2 solubility in water [35]. Mixing CO2 with another gas, such as N2, would be advantageous, as it would delay the CO2 hydrate film formation by reducing CO2 solubility in water. This would allow additional CO2 volume injection, thus large sweep area within sediments. It has been shown that the presence of additional N2 gas would enhance the CO2 storage potential when injected into methane hydrate reservoirs [36]. Diluted CO2 in the presence of N2 is also less corrosive during pipeline transportation and would not cause hydrate plugging during transportation; however, thermodynamic studies affirm that a CO2-rich gas, such as CO2-N2, requires higher pressure compared to pure CO2 gas for hydrate-based gas separation, capture, and storage processes to be implemented. Thermodynamic promoters, such as tetrahydrofuran (THF) [37,38] and cyclopentane [39], have been tested previously for CO2 capture and separation at lower hydrate formation pressure, which could allow lower injection pressures; however, they result in lower CO2 gas capture and storage efficiency, as promoter molecules partially reside in some gas hydrate cages. Kinetic hydrate promoters, like the surfactant sodium dodecyl sulfate (SDS), do not change the thermodynamic hydrate stability pressure of CO2-rich gas; however, they change the formation kinetics and improve the gas separation and capture when present in water. SDS has also been used along with other thermodynamic promoters, such as THF [40], to optimize the gas separation and capture at lower pressures. The roles of different promotors in CO2 separation, capture, and storage in hydrates have been discussed elsewhere [18]. Existing kinetic promoters, such as surfactants, are not environmentally friendly nor biodegradable [41], and they are known to form foams that could require additional maintenance [42]. Hence, there is a necessity for non-toxic, environmentally friendly alternatives for CO2 hydrate formation that can reach high formation rates and high gas uptake. Figure 3 summarizes the key points above.
Amino acids are potential eco-friendly alternatives to currently used promoters. Application of amino acids to gas hydrate formation is very recent, and their behavior is not well understood [43,44]. Kyte et al. [45] have categorized amino acids into two categories based on positive and negative hydropathy indexes. In this study, we have used four amino acids, L-histidine, L-arginine, L-methionine, and L-valine. Methionine and valine are hydrophobic amino acids with positive hydropathy indexes while arginine and histidine are hydrophilic amino acid with negative hydropathy indexes. The gas hydrates based on CO2 capture using amino acids are still in an early stage of development, and growth behavior in the presence of a porous medium is not yet investigated. Amino acid behavior in the presence of porous medium for CO2 capture and storage is not yet investigated.
CO2 capture as hydrate from the gas mixture using bulk water has been discussed quite frequently. CO2 capture and storage in cooled sediments are different than using bulk water due to enhanced thermal conductivity and higher gas/liquid interface in the presence of a porous medium. Available studies show that, in the presence of a porous medium, such as sandglass, silica sand, and porous glass, gas uptake increased compared to the bulk water system [46]; however, delays in nucleation and higher induction times have been recorded in the presence of the porous medium. Kumar et al. [47] have investigated the CO2 capture in the range of 15–20 mol% CO2 in a mixture with N2 using water, and they found that 55–57 mol% CO2 was captured at 0.6 °C and 7.7 MPa. CO2 was captured via hydrate formation from a different gas mixture including CO2/N2 and CO2/H2 feed gas in the presence of bulk water, porous medium, and different chemicals [18,48,49,50,51]. The presence of impurities, such as SO2, led to a higher temperature, lower formation pressure, and rapid nucleation during CO2 hydrate formation from the CO2-N2 feed gas [52]. In another study, the effect of fly ash impurities on CO2 gas hydrate formation (CGHF) was studied, and it was found that the presence of fly ash did not affect thermodynamics but enhanced hydrate formation, including CO2 recovery [53]. It is known that hydrate formation in porous medium is advantageous due to higher water-to-hydrate conversion and elimination of mechanical stirring [46]. The presence of porous medium induced a dispersed water state, which enhanced gas/water contact, and silica gel created more dispersed water compared to silica sand, having better water-to-hydrate conversion [54]; however, the presence of porous medium combined with the presence of promoter in the context of CO2 sequestration and storage in geological formation has not been extensively studied. Many studies have been conducted to investigate CO2 storage as a hydrate in the presence of thermodynamic promoters, but only limited information is available on the effect of the kinetic promoter, and the combined effect of silica sand and the presence of kinetic promoters, on CO2 storage [18,55]. Pan et al. [56] have studied the effect of hydrate promoter SDS in the presence of silica sand for methane hydrate formation and found that particle size weakened the effect of SDS. Porous medium also improves heat transfer during hydrate formation due to higher thermal conductivity of sand particles compared to bulk water. Thus, understanding the kinetics of CGHF in sediments is essential. The role of environmentally friendly HPs to enhance the hydrate formation rate within deposits is also an essential point to consider during CGHF in sediments.
In the context of CO2 storage in cooled but unfrozen sediments within the hydrate stability zone through injecting CO2-rich gas, the role of environmentally-friendly promoters, such as amino acids, to enhance capture and sequestration efficiency within porous medium, requires further investigation. In this study, a set of constant ramping and isothermal experiments were performed to investigate the influence of promoters on the kinetics of CO2 capture and storage in unfrozen coarse sand with two different particle sizes (160–630 µm, 1400–5000 µm) and in the presence of environmentally-friendly promoters. The hydrate formation capabilities of four amino acids were evaluated and compared with water and SDS, when used in low concentrations (500–3000 ppm). The effect of CO2 concentration in the incoming gas feed on formation kinetics was also investigated. The information, including the effect of particle size, change in chemical concentration, change in CO2 concentration in the feed gas (CO2-N2 mixture), and relative performance, is expected to be useful in future studies focused on chemically-enhanced CO2 capture and storage as a hydrate in geological formations within the hydrate stability zone.
2. Materials and Methods
2.1. Setup and Materials
In this study, CGHF was examined using a rocking cell setup, as shown in Figure 4. An analytical grade of CO2-N2 gas mixture with 99.99% purity (obtained from Air Liquide Company, Denmark) was used with varying CO2 concentrations. A schematic of the rocking cell in this work was shown in Figure 1, and a detailed description can be found in our previous research [57]. The rocking cell acts as a batch reactor; thus, it is a closed system. The amino acids were acquired from Sigma Aldrich, and all amino acids in this study were of 3000 ppm concentration. Distilled water was utilized in the preparation of all samples to reduce the effect of impurities in the solution. Quartz sand with the particle size of 160–630 µm (named Sand A) and 1400–5000 µm (Sand B) was used. The rocking cell differs from a typical stirred reactor due to its use of a different agitation method. Inside this rocking cell setup, multiple rocking cells may be inserted into a single cooling bath, which helps the parallelization of experiments for identical pressure and temperature conditions. These rocking cells are identical in shape and size, and they have a constant gas volume equal to 40 cm3. The rocking cell is conventionally used to investigate hydrate inhibition; however, our group has recently been able to prove a successful analysis of methane hydrate formation with SDS through experiments using a rocking cell setup [58]. During the study, it is assumed that different sands placed inside the rocking cell have identical packing, which does not change from one rocking cell to another, nor during multiple experiments.
2.2. Procedure
A rocking cell holding five identical pressure test cells (RC-5, PSL Systemtechnik, Germany) was employed for testing the influence of SDS and amino acids on CGHF. Constant ramping and isothermal temperature schemes were used in this study. Constant ramping was used to find the onset temperature (T0) and subcooling temperature for a number of chemicals in the presence of different sands (Sand A and Sand B) and gases (Gas A and Gas B). To determine the induction time (to), total gas uptake, and CO2 recovery, isothermal tests were performed at a constant temperature of 1 °C and with an initial injection pressure of 120 bar. Pressure and temperature were chosen based on the trial run after confirming that hydrate formation occurred at these conditions in the presence of kinetic promoters. The authors acknowledge that high injection pressure would require energy consumption to compress incoming CO2-N2 mixture before injection into a geological formation. For industrial adaption, moderate operating pressure and temperature conditions along with suitable reactor and process design are required to make CO2 capture and storage energy- and cost-efficient. Gas chromatography analysis was performed after the isothermal experiments to determine the amount of CO2 and N2 still in the gas phase. The isothermal test procedure and experimental parameters used were similar to our previous publication [58]. Based on the constant cell volume of 40 mL, the initial promoter solution of 10 mL, and sand weight of 30 g, initial liquid saturation was calculated to be 35%. Since experiments were conducted in batch mode, liquid saturation can also be considered as residual water saturation in pore space after gas injection into water-bearing sediments. At Swi = 35%, the hydrates formed in sediments are pore-filling hydrates [60,61]. For example, CO2 hydrates in sediments are pore-filling when Swi = 36% [62], but instead grain-cementing when Swi = 10% [63]. The experimental plan included multiple isothermal runs at 120 bar starting pressure and 1 °C, using 20 mol% CO2 in N2 (named as Gas A) and 30 mol% CO2 in N2 (name as Gas B) in the presence of hydrate promoter chemicals (amino acids and surfactant), water, and two different grains of sand (Sand A and Sand B) to study the effect of CO2 composition on CO2 capture efficiency.
2.3. Experimental Data Processing
Temperature ramping experiments are a good indicator of kinetic properties as nucleation temperatures show less deviation, and they require a smaller number of repetitions compared with isothermal experiments [64]. The technique to measure nucleation temperature To from pressure–temperature plots (P–T) during constant temperature ramping experiments is discussed in our earlier publication [58]. During the experiment, initial pressure reduction is observed due to cooling as well as methane solubility in the water. At the time, pressure and temperature follow a linear relationship and, at the onset of nucleation temperature (To), pressure shows sudden deviation from the linear trend. To is the temperature at which hydrate nucleation initiates and conveys the first macroscopic instance of hydrate formation [65]. Subcooling (ΔTsub) relates to the driving force and controls the hydrate growth curve. Maximum subcooling required in the case of hydrate promoters can be expressed as
Teq is calculated using CSMGem software (Version 1.1, Colorado School of Mines, Golden, CO, USA) for the pure bulk water system, and Top is the operational temperature of 1 °C at isothermal conditions. We have defined the operating driving force (ΔTsub,op), which is expressed as
Different ΔTsub,op for a given operating temperature would indicate the difference between additives during hydrate formation. Other factors that can influence this are pressure, additive concentration, CO2 concentration in the feed gas, and the initial volume of water within the porous medium. The P–T data was also recorded during the experiments to calculate the induction time, gas uptake, and CO2 recovery. Under isothermal temperature schemes, these parameters were used to quantify the growth phase of CGHF. Induction time and gas uptake measurements were used to describe the CGHF kinetics with respect to crystallization onset point and the rate of advancement of the hydrate solution interface [50]. During these experiments, the disparity between initial and thermodynamic equilibrium pressures acts as a driving force. At the end of the isothermal tests, the composition of the residual gas phase was characterized by gas chromatography (GC).
The total amount of CO2-N2 feed gas mixture injected into the pressure cell in mole basis, ni, was determined from the following equations:
T is the temperature during the isothermal test, P1 is the initial injection pressure after CO2-N2 feed gas injection into the high-pressure cell, and V is the gas volume available in the reactor, calculated as VT–VL–VS. Correspondingly, VT is the total cell volume, VL is the HP solution volume, and VS is the volume of unconsolidated sediment. The compressibility fraction, Z1, at given pressure and temperature for a given gas composition was determined with the Benedict–Webb–Rubin–Starling equation of state. Lastly, R is the universal gas constant, 8.314 J·mol−1·K−1. Factors such as gas consumption due to CO2 solubility into the solution as well as volume contraction due to temperature reduction are ignored due to high concentration of N2 present in the system and the weaker correlation between N2 solubility and temperature.
The calculations assumed that gas volume remains constant, and is the number of moles of feed gas in the vapor phase after CGHF, calculated from the following expression:
Here, P2 is the final pressure at the conclusion of an isothermal run, and Z2 is the compressibility factor that corresponds to this P2. Z2 is measured for each gas composition after the experiment is completed. This gas composition is determined through GC analysis. The number of moles of CO2 and N2 in the equilibrium residual gas phase is calculated via the following equations:
The change in the total number of moles of CO2-N2 feed gas, trapped during hydrate formation is given by:
The number of moles of carbon dioxide and nitrogen stored in the hydrate is then found through the difference between final and initial quantities:
Here, and correspond to the number of moles of CO2 and N2, respectively, stored in gas hydrates. Finally, CO2 split fraction (ϕ), also known as recovery fraction, firstly proposed by Linga et al. [47], or also CO2 recovery, can be calculated, where = moles in feed gas, as
3. Results and Discussion
Isothermal experiments were performed to study CGHF kinetics using unconsolidated porous medium and four amino acids. The unconsolidated sediments used were silica sand with two different particle sizes, Sands A and B (described above), to study the effect of change in particle size. The rocking cell setup was used to measure total gas uptake, induction time, and CO2 split fraction. The effects of particle size and presence of different amino acids on CGHF are studied to discuss the role of sediments and promoters in CO2 capture from a CO2-N2 gas mixture in relation to power plants and for capture in sediments with the help of HPs.
3.1. Nucleation Temperature and Subcooling Measurement
Constant temperature ramping was performed to study the nucleation temperature behavior for different chemicals, and we have chosen the most conservative case to find variations with higher CO2 concentration, Gas B and larger sand particle size, Sand B. Variation is described only for a fresh run in Table 1 and Figure 5.
At low concentration (500–3000 ppm), the additives used in this study do not affect the hydrate thermodynamics; therefore, the value Teq = 8.32 °C for Gas B in the presence of bulk water was used to calculate the maximum subcooling ΔTsub. A delay in nucleation was observed as positive sub cooling time was recorded for the porous plus promoter system. It confirms a higher induction time in the presence of porous medium compared to the bulk water system. The results suggest that at 120 bar initial pressure, the maximum subcooling required for SDS is lower than the four amino acids. For surfactant, as the concentration increased from 500 to 3000 ppm, the subcooling requirement decreased. This could be due to the difference in mass transfer-based driving force as the hydrate formation mechanism is suggested to be different in the two scenarios [66,67]. Within amino acids, valine and methionine had lower subcooling requirements compared to histidine and arginine. A higher sub cooling requirement indicates that it delays hydrate nucleation. The maximum subcooling required depends on concentration as well as chemical type. CO2 selectivity towards different hydrate structures in the presence of chemicals, such as thermodynamic promoters, also depends on the driving force indicated by sub-cooling temperature [68]. The difference in subcooling requirement can also change the hydrate structure and hydrate morphology [69]. An increase in operating driving force also leads to an increase in nucleation rate [70]. Therefore, the CO2 nucleation rate in the presence of SDS is higher compared to these amino acids. As concentration increases in the case of SDS, faster nucleation occurs. Camparison of these results with our earlier work using bulk water only at 120 bar and 1 °C suggests that the presence of porous medium delays hydrate nucleation. The delay in nucleation was higher in the case of amino acids compared to SDS during the fresh run [59].
3.2. Induction Time Measurement in Isothermal Experiments
Hydrate-based CO2 capture suffers from low formation kinetics, such as slow growth rate, high induction time and excessive energy consumption. Parameters like formation rate and induction time during CGHF can provide the essential information to select the right promoter in porous medium. Hydrate formation in silica sand systems is different from hydrate formation in bulk water systems, as the formation process is described as spatially inhomogeneous, having multiple nucleation sites at different times and different locations, thus leading to enhanced hydrate formation [71]. Mechanisms like the migration of water in pore space, the presence of tortuous pathways, and the capillary effect of water in pore space also contribute toward enhanced water–hydrate conversion, releasing more heat and thus creating a larger spike in the temperature profile [46]. Pressure profiles during the isothermal experiments for different cases are illustrated in Figure 6 and Figure 7. An initial pressure drop was seen, which corresponds to volume contraction and a hydrate growth phase. During the hydrate growth phase, gas is consumed, and the pressure profile showed a steep decline followed by equilibration of the system.
Induction time calculated during isothermal experiments is summarized in Table 2, and the trend is depicted in Figure 8. Induction time calculation gives an idea regarding how fast CO2 hydrate can be formed at the given conditions and in the presence of additives. Experimental runs where no hydrate formation was observed are denoted as N/A. Induction time was measured only for single formation fresh runs using either of the CO2-N2 gas mixtures. Induction time behavior was studied for four different variables, including chemical type, CO2 concentration in the incoming feed gas, the effect of sand particle size, and change in promoter concentration. It is noted that no hydrate formation was seen in the case of water and SDS at 500 ppm concentration. This is due to limited experimental time. During the experimental work, we have seen that when CO2-rich gas mixture is injected into a water-saturated porous medium, no hydrate is formed within the experimental time duration. On the other hand, we saw that, in the presence of hydrophobic amino acids and surfactant in water, the rapid pressure drop was seen with induction times ranging from 10 min to 120 min. A higher induction time would allow greater gas volume injection with a larger sweep area for given injected gas within sediments.
For amino acids, induction time decreased in the case of hydrophobic amino acids when CO2 mole concentration increased from 20% to 30%. For SDS, induction time increased when CO2 concentration increased for a given sand particle size. SDS behavior remained the same irrespective of changes in the sand particle size. Among amino acids, the rapid pressure drop was observed in the presence of hydrophobic amino acids, but no rapid pressure drop was observed in the case of hydrophilic amino acids and water. Increases in CO2 concentration had no positive effect on the hydrophilic amino acids. This indicates that hydrate promotion capabilities correlate with hydrophobicity with and without the porous medium [59]. The decrease in induction time in the case of hydrophobic amino acids can be explained in terms of driving force ∆P (Pinj-Peq), where Pinj is the initial operating pressure and Peq is the hydrate equilibrium pressure calculated using CSMGem for a given operational temperature (Top). As CO2 mole concentration increased from 20% to 30%, Peq decreased, and ∆P increased at constant Pinj. Hydrophilic acids, histidine and arginine, delayed CGHF and did not have rapid formation tendencies. It is most probable that this is due to the structural perturbation of liquid water arising from the charged side branch of hydrophilic amino acids, which reduce the extent of hydrogen bonding between water molecules, as proven by previous studies [72]. Comparing the induction times between SDS and hydrophobic amino acids, lower induction times were recorded when SDS concentration was above 1000 ppm. CO2 diffusion into liquid water increased as SDS concentration reduced the surface tension. As SDS concentration increased above 1000 ppm and reached 3000 ppm, induction time further reduced; however, the reduction in induction time was subtle and the trend in induction time reached a plateau. This highlights the inhibitive nature of SDS as CO2 concentration increases. It was generally observed that the induction times of hydrophobic amino acids (3000 ppm) and SDS were comparable when SDS concentration was below 1000 ppm. The performances of hydrophobic amino acids and SDS were more comparable at lower CO2 concentration (20 mol%) in the feed gas.
The pore habit of gas hydrate in sediments is important for hydrate-based geological CO2 capture and storage and their long term stability. Experimental studies suggest the formation of both pore filling [73,74] and grain coating CO2 hydrate morphologies [63]. The limitation with these studies lies in the experimental design as the experimental setup is a batch reactor without provision of a constant CO2 supply. CO2 sequestration into geological conditions is considered as a case of Continuous CO2 supply, thus the hydrate pore habit, during constant CO2 supply, is important. Oya et al. have observed sintering of CO2 hydrate crystals in liquid water during the continuous CO2 supply [75]. Experimental data for pore habits of CO2 hydrate within sediments is limited. We have also studied the effect of change in sand particle size on CO2 hydrate formation kinetics. It is known that the porous medium affects hydrate formation kinetics. Hydrate morphology could provide insights into the influencing factor between specific surface area of particles and the pore space between them. At initial water saturation Swi = 0.35, hydrate morphology is observed to change from grain coating hydrates to pore-filling hydrates [60,61]. Due to pore-filling hydrate, the role of pore space dominates over the specific surface area as large pore space provides a large gas–liquid contact area but lowers the specific surface area. We report a correlation between induction time and sand particle size for the given initial water saturation. We observed that when sand particle size increased from Sand A to Sand B, induction time reduced, which was observed both in SDS and hydrophobic amino acids for all SDS concentrations as well as different CO2 mol% in the feed gas. This can be explained in terms of available pore space. Larger particle sizes have higher pore volumes, thus more free water in pores and a higher gas/water contact area, which reduces the induction time. The research focused on CO2/N2 injection into methane hydrate reservoir suggest that CO2-rich gas flow into hydrate reservoir improves in the presence of N2, due to increase in relative permeability of the gas and lower risk of hydrate formation at the gas-water interface at the injection well [10,76].
Induction time information is also useful in selecting CO2 injection rates. A high injection rate would lead to higher sweep efficiency and large water displacement by gas, thus lowering the residual water saturation in pore space, which in turn causes temporary blockage followed by re-opening of CO2 flow channels [62]. MRI imaging shows that, in the case of high CO2 injection rates, there is residual water near the well. CO2 tends to form a channel by overcoming the viscous and capillary forces due to high injection rate [11]. Residual water saturation would, therefore, control the gas/liquid contact area in pore space, and decide the hydrate morphology within pore space (refer to Figure 9) [60,61]. Different hydrate morphologies have different relative gas permeability within sediments [77]. An increase in injection rate also reduced induction time. Knowledge of induction time is essential to estimate the contact time required for the gas/water interface before hydrate nucleation begins. Dai et al. [2] have suggested that induction time does not have a direct connection with the specific surface area but is linked to Gibbs free energy of nucleation. Gibbs free energy of nucleation decreases in the presence of foreign bodies, such as sand particles, and, hence, promotes heterogeneous nucleation. It can be said that hydrate morphology, controlled by initial water saturation, plays a dominant role in understanding the role of sediment properties on CO2 capture from the incoming feed gas. Injection of gas would move the water away from the pore space, and residual water saturation would be different from initial water saturation. Residual water saturation would control the hydrate morphology, and the hydrate morphology would decide whether the pore space orthe specific surface area controls the formation kinetics.
For SDS, induction time reduced as particle size increased due to an increase in pore volume and higher gas–liquid contact area. For a given pore volume, an increase in CO2 concentration in feed gas increased the induction time due to delayed nucleation at higher concentrations; however, for hydrophobic amino acids, an increase in CO2 concentration led to a decrease in induction time.
Hydrate formation in the porous medium also influenced by flow direction, and CO2 gas movement in the upward direction led to higher hydrate saturation due to the gravity effect that enhances the liquid–water contact area. [78]. The presence of additives, such as hydrophobic amino acids or surfactant, can enhance water activity at the gas/liquid interface. Enhanced water activity promotes nucleation at the gas/liquid interface, and improves the formation kinetics. In a recent study, horizontal injection of pure CO2 into silica bed using a constant flow rate followed by constant pressure injection has been shown to increase CO2 storage in depleted gas reservoirs [79]. To avoid plugging at the injection point, gas injection below the hydrate stability zone is also suggested (>1000 m) in permafrost to generate multiple trapping mechanisms including a mudrock cap and an impermeable hydrate cemented sedimentary layer [33].
3.3. Gas Uptake Analysis
Heat and mass transfer plays a key role in gas uptake kinetics and in influencing nucleation kinetics and gas uptake. It is known that reproducibility in gas uptake values is poor due to stochastic hydrate formation processes within pore space, and standard errors could be ±15% of final values [80]. The presence of porous and promoter systems affects both mass and heat transfer during hydrate formation and can reduce the standard error, which could be reduced due to the presence of the promoter [58]. In this section, we discuss the single-stage gas uptake behavior in the presence of amino acids and SDS. Gas uptake was determined using isothermal tests performed at 1 °C and Pinj = 120 bar. Gas samples were collected for gas chromatography analysis at the end of the fresh runs to study the gas composition in the residual vapor phase. Table 3 below describes gas uptake results for a fresh run with Sand A and Sand B using 20 mol% and 30 mol% CO2. Figure 10 graphically presents the variation in gas uptake resulting from the change in sand particle size for 20 and 30 mol% CO2 in the feed gas. The gas uptake consumption is estimated on a fixed time scale during all experiments. In the following parts, we discuss the presence of chemicals, changes in sand particle size, changes in CO2 concentration in the feed gas, and the changes in the promoter’s concentration.
As discussed previously, due to initial water saturation at Swi = 0.35, we observed pore-filling hydrate morphology [60,61] that influenced gas uptake behavior with respect to sediment particle size. In pore-filling hydrate morphology, pore space plays a key role in gas consumption, and it is controlled by particle size. Assuming that sand particles have similar packing during the experiment due to the similar design of the reactor, pore space between sand particles increased as sand particle size increased [81]. Large pore space allows higher gas/liquid contact area. As we previously observed, induction time was shorter with large sand particle sizes, which suggests the quick formation of hydrate film at the gas/liquid interface, acting as a mass transfer barrier [82]. This is due to gas diffusion via hydrate film being much slower (~10−13 m2/s) compared to gas diffusion in water (~10−10 m2/s) [83]. Therefore, faster and thicker gas hydrate film at the gas/liquid interface would cease further gas uptake in higher pore space. Mekala et al. [80] also confirmed an increase in gas uptake due to the decrease in particle size at Swi = 75%, confirming the connection between pore-filling morphology and formation kinetics. Bhattacharjee et al. [84] studied the effect of the porous medium using a fixed bed apparatus on carbon dioxide sequestration and experimentally observed that the decrease in particle size enhanced the gas uptake. They suggested that smaller particle size improved the packing and resulted in enhanced interconnectivity of the pore space and had a greater surface area for the gas–water contact. Pan et al. [56] studied the gas uptake for SDS at 300 ppm concentration and in the presence of silica sand with different particle sizes, and they observed higher gas uptake for smaller sand particles. Similar results were found in methane hydrate formation in the presence of promoters [85].
Gas uptake analysis confirms that the presence of chemicals enhanced the water-to-hydrate conversion compared to pure water. Analysis confirms that hydrophilic amino acids, histidine and arginine, were not effective as HPs and had lower gas uptake compared to hydrophobic amino acids. Based on nucleation kinetics (induction time) and growth kinetics (gas uptake), hydrophobic and hydrophilic amino acids are clearly distinctive in their effect on CGHF in silica sand. Hydrophilic amino acids with charged side branches tend to inhibit CO2 nucleation and growth kinetics because of the perturbation of liquid water structure. It can be concluded that the hydrate formation capabilities of amino acids are independent of the surface properties of the hydrate and are connected with perturbation capabilities induced by hydrophilic amino acids with charged side chains [72,86]. In the case of high SDS concentration and hydrophobic amino acids, higher gas uptake was consistently observed in comparison with water and hydrophilic amino acids. For SDS, the change in gas uptake was insignificant due to the increase in concentration from 1000 ppm to 3000 ppm. This could be an effect of concentration at the gas–liquid interface. At high concentration, SDS accelerated hydrate particle agglomeration between the gas–liquid phase and reduced the opportunity for more gas–liquid interaction or creation of hydrate nuclei. The initial increase in gas uptake due to the increase in mass transfer coefficient was caused by reduced surface tension [87]. It was observed that the deviation between hydrophobic amino acids and 2000–3000 ppm SDS for gas uptake analysis was minimal. It is also evident from the analysis and recorded results that the concentration of the promoter concentration also influences the gas uptake behavior. The increase in gas uptake was also significant when CO2 mole concentration increased from 20% to 30% for both Sand A and Sand B. This confirmed that the CO2 concentration in the feed gas has greater significance compared to the influence of the porous medium. Increased CO2 concentration developed higher driving force as CO2 solubility improved.
Figure 11 below illustrates the total pressure drop observed during the isothermal experiments. Total pressure drop is calculated as the difference between the injection pressure and the final stable pressure achieved. The initial injection pressure (Pi) during the experiment was 120 bar. According to Table 4, the driving force (Pi-Peq) is equal to 63 bar and 78 bar, respectively, for 20 mol% and 30 mol% CO2 in CO2-N2 mixture. Comparing Figure 10 and Figure 11, we can say that total gas uptake behavior and total pressure drop behavior correlate well for changes in CO2 concentration in the feed gas. The increase in driving force led to an increase in total gas uptake when CO2 concentration increased. The presence of SDS (1000–3000 ppm) and methionine had enhanced the total gas uptake during CO2 capture and storage in porous media compared to water. Changes in SDS concentration between 1000 and 3000 ppm had a weaker effect on total gas uptake. This could be a quick hydrate film formation that creates a mass transfer barrier for additional gas molecule diffusion. Total gas uptake value is a better variable matrix compared to total pressure drop to study the effect of particle size change. Driving force can be further improved by injecting at higher pressure; this would lead to higher gas uptake but may lead to lower CO2 split fraction, as more N2 may also start to occupy hydrate cages when injection pressure increases.
It is important to highlight the difference in gas consumption behavior between two widely used porous mediums, silica gel, and silica sand (refer to Figure 12). Hydrates could be pore filling or grain coating within silica sand, which is decided by initial water saturation. The effect of particle size on formation kinetics via pore volume or surface area is controlled by hydrate morphology. Hydrate morphology on silica gel is surface coating, hence surface area plays the more dominating role in case of silica gel. The silica gel particle size effect on formation kinetics and CO2 split fraction was studied by Adeyemo et al. [88], who used water-saturated silica gels with two different pore diameters (30 nm and 100 nm) and two different pore volumes (0.81 and 0.83 mL/g). Results show an increase in total gas uptake for the decrease in surface area from 100 to 50 m2/g due to an increase in pore diameter from 30 nm to 100 nm at constant pore volume of 0.81 mL/g. This suggests that pore volume and specific surface area both control the gas consumption behavior. In the case of coarse sand, the specific surface area of the bed is inversely proportional to the diameter of the sand particles. In the case of silica sand, whether pore volume or specific surface area plays a dominating role when particle size increases depends on hydrate morphology. Industrial-scale adaptation of CO2 recovery in hydrate from incoming CO2-rich feed gas requires a continuous multistage process [89], lower operating pressure, maximum water-to-hydrate conversion ratio, and high separation and recovery fraction for which silica gel would be an appropriate choice, as it disperses water due to higher specific surface area; however, in the presence of silica gel hydrate, phase equilibrium would shift upward compared to coarse silica sand [88], and gas availability via diffusion also reduces in smaller pores [90]. Sun et al. [91] studied the phase stability of hydrate formation in silica sand and observed that formation behavior in coarse silica sand is similar to bulk water and that the porous medium with smaller particle size has a higher Peq requirement for hydrate formation. Particle size controls the sediment pore space, such that for <10 nm pores, water activity is reduced, and capillary suction hinders the nucleation kinetics.
To achieve lower operating pressure and avoid compression costs of the incoming feed gas, an appropriate recipe—including a thermodynamic promoter along with kinetic promoter—would facilitate lower operating pressure without compromising with CO2 recovery [93], (e.g., thermodynamic promoter THF in the presence of kinetics promoter SDS and porous media). Lirio et al. [94] found a synergetic effect for CO2 hydrate formation recovery in the presence of SDS and THF. Tang et al. [40] used an SDS and THF mixture during CO2 capture from CO2-N2 gas and suggested that performance is dependent on the CO2 concentration in the incoming feed gas. The Tetra-n-butyl ammonium bromide (TBAB)- Sodium dodecyl sulfate(SDS) system has been found to be more effective compare to Tetrahydrofuran(THF)-Sodium dodecyl sulfate (SDS) system for enhanced gas uptake at moderate pressure [95].
The presence of porous material has an added advantage due to its ability to disperse water and increase the water–gas contact area, leading to higher gas uptake. This is of particular interest to consider when injecting CO2-rich gas into geological formations within the hydrate stability zone to initiate CO2 hydrate formation. A decrease in water saturation is advantageous as it improves gas molecule transportation in a porous medium and enhances the hydrate growth rate [71]. At very low water saturation below Swi = 0.35, water is absorbed on the surface of sand particles and allows the gas molecules to freely diffuse through pore space in the absence of water in pore space. Therefore, grain coating hydrate morphology allows faster hydrate formation in the vicinity and higher gas uptake.
3.4. CO2 Split Fraction Analysis
CO2 recovery in the form of hydrate from CO2-N2 feed gas was quantified in terms of CO2 split fraction, which is summarized in Table 4 and graphically depicted in Figure 13. Opposite to bulk phase, porous medium creates dispersed liquid phase and enhances the gas/water contact area. Comparing the trend in gas uptake and CO2 recovery, the increase in gas uptake was attributed to higher CO2 recovery during hydrate formation. CO2 split fraction was studied at the initial injection pressure of 120 bar. An increase in operating pressure would result in higher water–hydrate conversion due to the increase in driving force; however, at higher operating pressure, CO2 proportion would decrease compared to lower operating pressure as N2 also starts to go into hydrate at higher operating pressure. Therefore, to improve the CO2 selectivity, lower operating pressure would be advantageous, and water–hydrate conversion can be enhanced with the presence of promoter [47,88].
CO2 recovery or split fraction analysis confirms a direct correlation between gas uptake and CO2 recovery in the hydrate. For the CO2-N2-water system, mixed hydrate formed in the pores of silica gel has an s-I structure when CO2 recovery is more than 10 mol% [96], and, when CO2 mol% in feed gas increases, CO2 molecules occupy all 51,262 cages of the s-I and some of the 512 cages, which increases s-I stability [97]. CO2 split fraction in the case of pure water, and in the presence of silica sand, was lower compared to SDS and hydrophobic amino acids but greater than the hydrophilic amino acids.
Linga et al. [50], reported a split fraction of 0.42 for 16.9 mol% CO2 and 0.32 for 57% CO2 in a CO2-N2 mixture during water-based CO2 separation and capture processes. Introduction of the porous medium along with water in our study further improved CO2 split fraction in the range 0.5–0.55 for 20 mol% CO2 in incoming feed in the presence of Sand A or B. A change in CO2 concentration from 20% to 30% resulted in 0.3–0.36 split fraction in the presence of Sand A or Sand B. CO2 split fraction was further improved in the presence of hydrate promoter including surfactant SDS and hydrophobic amino acids. For 20 mol% CO2, split fraction varied between 0.65 and 0.85 in the presence of SDS (1000 ppm above, Sand A and Sand B) and between 0.59 and 0.65 in the presence of hydrophobic amino acids (3000 ppm, Sand A and Sand B). For 30 mol% CO2, split fraction varied between 0.58 and 0.93 in the presence of SDS (1000 ppm above, Sand A and Sand B) and between 0.76 and 0.93 in the presence of hydrophobic amino acids (3000 ppm, Sand A and Sand B).
This analysis indicates that as CO2 concentration increases in the feed gas, the performance of hydrophobic amino acids was similar to SDS at a concentration above 1000 ppm. At any given condition, CO2 split fraction for 3000 ppm SDS was highest or near to split fraction of hydrophobic amino acids. The comparison above confirms that the presence of promoter in water is advantageous to enhance CO2 split fraction in the hydrate. Hydrophobic amino acids have the potential to be good alternatives to surfactants in achieving nearly similar CO2 split fraction. As SDS concentration increased from 500 to 3000 ppm, CO2 split fraction increased, but the magnitude of increment was lower at higher concentrations. This could be due to the difference in CO2 hydrate formation mechanisms at low and high mass transfer driving forces. Under higher driving force, hydrate film grew in both the liquid and the gas phase in the absence of the capillary mechanism, thus creating thicker hydrate film, which acted as a mass transfer barrier for CO2 molecules to interact with the water phase [66]. The split fraction is observed to decrease from 0.42 to 0.38 when CO2 mol% in feed gas (CO2-N2 mixture) increased from 17 mol% to 83 mol% [47]. However, in the presence of kinetic promoter, split factor increased when CO2 concentration increased from 20 mol% to 30 mol%. Hassanpouryouzband et al. [98] reported the CO2 recovery factor equal to 0.8 and 0.88 when 20% CO2-rich CO2-N2 mixture was injected into the sand at 200 bar and 280 bar, respectively, at T = 273.4 K. CO2 recovery factor improved to 0.92 when temperature was reduced to T = 264.8 K. In this study, comparable CO2 recovery was achieved in the presence of promoters at lower injection pressure.
Kumar et al. [49] observed that the increase in driving force leads to a decrease in CO2 recovery in pure water cases, thus confirming our observation for pure water. The influence of HPs, such as hydrophobic amino acids, on CO2 split fraction, has different behaviours in CO2 recovery compared to the pure water case. Adeyemo et al. [88] reported 30–45% CO2 conversion for 17% CO2 in N2 in the presence of water at 80–90 bar initial pressure and 272.15 K in the presence of 100 cm3 silica gel (5–200 μm mean particle size, 100 nm pore diameter) saturated with water.
Industrial-scale adaptation of CO2 capture from CO2-N2 mixture requires a minimum of three stages to separate and capture 98–99 mol% [47]; however, CO2 sequestration into geological formations would involve a single step, hence higher CO2 recovery as hydrate is an essential requirement. In our previous study, we had demonstrated that when CO2 was injected into methane hydrate reservoir in the presence of SDS or L-methionine, CO2 recovery was found to be in the range of 88–89% without any methane recovery [13]. A potential application of L-methionine during CO2 hydrate capture and storage is also demonstrated in another study [99]. Figure 14 below provides a summary of the results.
3.5. Role of Amino Acids in Carbon Capture and Storage Applications
Recent research has shown that hydrophobic amino acids, valine and methionine, enhance CO2 hydrate growth kinetics [43]. We reported a correlation between hydrophobicity and amino acid hydrate promotion capabilities at low concentrations (500–3000 ppm) [59]. Hydrophobic amino acids show hydrate promotion capabilities, while hydrophilic amino acids display inhibition. Sa et al. [72,100] assessed many amino acids and concluded that thermodynamic inhibition is more present at high concentrations, and the inhibition effect becomes weaker with the increase in hydrophobicity [72]. Additionally, water perturbation could cause the inhibition effect [101]. The inhibition effect also depends on the history of water, concentration of the additive, and the length and nature of the side chain of the amino acid. Amino acid performance is connected with its hydrophobicity at low concentrations (500–3000 ppm) [59]. In this study, amino acids were selected based on the difference in hydrophobicity indices. This difference arises due to the difference in their structure and polarity [45]. In the literature, amino acids are suggested to behave both as inhibitors and as promoters [44,102]. In a recent study on CO2 capture from feed gas using bulk water, we discussed the distinction between amino acids at 3000 ppm concentration, and it was suggested that the hydrophobicity index could be a good indicator to classify amino acids as either promoters or inhibitors at low concentrations [59]. Valine and methionine, with positive hydropathy indices, have shown promotion effects, while histidine and arginine, with negative hydropathy indices, have shown inhibition effects during CO2 hydrate formation from feed gas [59]. Amino acid’s abilities to inhibit or promote hydrate formation are connected with their ability to perturb the liquid water structure [72], and a correlation between hydrophobicity and water perturbation ability has been proposed [103]. Results from other studies also confirm that L-methionine has good CO2 hydrate promotion capabilities when concentration varies between 0.02 and 1.00 wt% [99]; however, valine has shown both promotion and inhibition capabilities at different concentrations. Valine behaves as a kinetic hydrate inhibitor (KHI) at 0.1 wt% during CO2 hydrate formation [100], but behaves as a kinetic hydrate promoter (KHP) at 0.5 wt%. Valine was also suggested as a thermodynamic inhibitor (THI) for CH4 hydrate formation between 1 and 5 wt% [104] but with KHI below 0.2 wt% [105].
Previous studies using L-histidine suggest that L-histidine behaves as a KHI at 0.5–2.0 wt% [106] and at 0.1 mol% [72]. Some studies also observe accelerated HP capabilities of histidine at 0.03–1.00 wt% [107]. There are no studies suggesting the thermodynamic inhibition nature of histidine. Similarly, arginine behaves as a thermodynamic inhibitor when used at 10 wt% during CO2 hydrate formation [108]. No studies are available using arginine at low concentration for CO2 hydrate formation to our knowledge. During CH4 hydrate formation, arginine behaves as a KHP at 0.03–1.00 wt% [107,109], and, when concentration increases to 1–5 wt%, behavior changes to THI [110]. Hence, it can be concluded that the role of amino acids as hydrate promoters or inhibitors is dependent on the concentration used.
3.6. Challenge and Prospects in Geological Carbon Capture and Storage as Hydrates
The application of hydrates as a CO2 separation and capture technique from incoming CO2-rich gas is quite new. The success of this idea is dependent on high CO2 capture efficiency. Industry-scale adaptation and geological sequestration of CO2-rich gas possess a different set of challenges. Capture efficiency at the industrial scale is influenced by the presence of promoters, porous medium, and process design. For industrial-scale adaptation, key challenges include cooling of the CO2-N2 mixture to hydrate formation temperature, pressurization of gas, reactor and process design to handle solid CO2 hydrate formation inside the reactor, scaling up of the process to handle (semi-) continuous processes, and continuous production of gas hydrate [111]. At the current level of technology, it will lead to high energy consumption and high investment costs. Future research should be focused on the development of new promoter chemicals that could enhance storage and separation efficiency at moderate operating pressures and temperatures, new porous materials that could improve water dispersion to enhance water/gas contact area, reactor and process design optimization to improve separation efficiency, and on recycling to reduce energy consumption and costs.
Geological sequestration of CO2-rich gas as a CO2 capture and storage technique has lower technical and cost barriers compared to industrial adaptation. Key issues, including CO2 transportation to sequestration sites, the long term stability of stored CO2 hydrates in geological formations, their environmental impact, and acceptance by society, are not yet fully understood and analyzed. Water aquifers located at high pressure and low temperature within permafrost and below deep/sub-sea sand beds could be potential locations for hydrate-based capture and storage along with methane hydrate reservoirs, which are either destabilizing or seen as potential sources of methane recovery.
CO2 hydrates formed within sediments act as cementing agents for sand particles and reduce effective permeability. They could act as a potential cap to avoid CO2 and CH4 migration and their dissolution into the water. Hydrate formation is a stochastic process; however, the stochastic nature reduces in the presence of chemicals such as thermodynamic and kinetic promoters. We envisage the enhanced role of kinetic promoters to achieve faster formation kinetics when CO2 gas is diluted with another gas, such as N2. Key requirements would be having a higher injection pressure compared to pure CO2-rich gas. Having environmentally friendly chemicals, such as amino acids, could be a very attractive proposition to replace toxic chemicals, such as a surfactant, without compromising the formation kinetics. CO2 hydrate formation kinetics and storage potential in sediments within the hydrate stability zone are controlled by parameters including CO2 concentration in injected gas, injection rate, volume and injection depth, water salinity, physical properties of sediments, pore fluid chemistry, and activity within sediments in the presence of CO2 [34,112]. Key sediment physical properties include pore diameter (dp), particle size (d), initial water saturation (Swi), surface area (SA), and water activity within pore space (aw) [81]. The current study reconfirms that kinetic formation parameters are influenced by pore volume and surface area. Initial water saturation in pore space controls hydrate morphology in pore space [60,61] such that in the presence of pore-filling hydrate, pore volume influences formation kinetics, and in the presence of grain coating morphology, surface area controls the formation kinetics. The difference in hydrate morphology also controls the gas movement, such as relative gas permeability in grain coating hydrate morphology being different from relative gas permeability in pore-filling hydrate morphology [77]. Therefore further investigation is required to understand CO2 hydrate formation at pore scale to address concerns related to formation, capture and long term storage. Furthermore, the effects of different factors, including salinity, injection rate, continuous supply, clay material and chemicals, also need thorough investigation.
4. Conclusions
CO2 capture and sequestration into geological formation within the hydrate stability zone can be enhanced in the presence of hydrate promoters, including surfactants and amino acids. In this study, we have investigated the kinetics of CO2 capture and storage from incoming CO2-rich gas, in the presence of SDS (500–2000 ppm) and amino acids (3000 ppm), during single-stage CO2 separation and storage in the form of hydrates under static conditions. We report higher gas uptake and higher CO2 recovery factor in the presence of hydrophobic amino acids and surfactant when compared with water and hydrophilic amino acids. High induction time in the range of 15–158 min, in the presence of amino acids, would provide sufficient contact time between the gas/liquid interfaces. Diluted CO2 in the presence of N2 would be less corrosive, and thus it would be cheaper to transport to the project site. Total gas uptake and CO2 split fraction can be further enhanced in the coarse sand, as particle size decreases or CO2 concentration in feed gas increases when the hydrate is pore filling in nature.
In general, the results highlight the promising use of amino acids as an environmentally friendly replacement for other kinetics promoters (e.g., SDS) for CO2 capture and storage applications at both industrial and geological scales. Injection pressure requirements for CO2 gas hydrate formation (CGHF) are too high to be implemented at an industrial scale; thus, hydrophobic amino acids as kinetic promoters along with thermodynamic promoters, such as THF and Tetra-n-butyl ammonium bromide (TBAB), could enable a greener solution to CO2 capture via CGHF at modest operational requirements with increased formation kinetics.
Author Contributions
Conceptualization, methodology, formal analysis, supervision, project administration, writing—original draft preparation, review, and editing by J.S.P.; formal analysis, investigation, by Y.J.D.; review and editing by A.P.K.; review, supervision, project administration, and funding acquisition by N.v.S. All authors have read and agreed to the published version of the manuscript.
Funding
This research is funded by The Danish Council for Independent Research.
Conflicts of Interest
The authors declare no conflict of interest.
References
- Lelieveld, J.; Crutzen, P.J.; Dentener, F.J. Changing concentration, lifetime and climate forcing of atmospheric methane. Tellus Ser. B Chem. Phys. Meteorol. 1998, 50, 128–150. [Google Scholar] [CrossRef]
- Wuebbles, D.J.; Hayhoe, K. Atmospheric methane and global change. Earth-Sci. Rev. 2002, 57, 177–210. [Google Scholar] [CrossRef]
- Sloan, E., Jr.; Koh, C.A. Clathrate Hydrates of Natural Gases, 3rd ed.; CRC Press: Boca Raton, FL, USA, 2007; ISBN 9780849390784. [Google Scholar]
- Koh, C.A.; Sloan, E.D.; Sum, A.K.; Wu, D.T. Fundamentals and applications of gas hydrates. Annu. Rev. Chem. Biomol. Eng. 2011, 2, 237–257. [Google Scholar] [CrossRef] [PubMed]
- Collett, T.; Bahk, J.J.; Baker, R.; Boswell, R.; Divins, D.; Frye, M.; Goldberg, D.; Husebø, J.; Koh, C.; Malone, M.; et al. Methane hydrates in nature-current knowledge and challenges. J. Chem. Eng. Data 2015, 60, 319–329. [Google Scholar] [CrossRef]
- Boswell, R.; Collett, T.S. Current perspectives on gas hydrate resources. Energy Environ. Sci. 2011, 4, 1206–1215. [Google Scholar] [CrossRef]
- Makogon, Y.F. Natural gas hydrates - A promising source of energy. J. Nat. Gas Sci. Eng. 2010, 2, 49–59. [Google Scholar] [CrossRef]
- Ketzer, M.; Praeg, D.; Rodrigues, L.F.; Augustin, A.; Pivel, M.A.G.; Rahmati-Abkenar, M.; Miller, D.J.; Viana, A.R.; Cupertino, J.A. Gas hydrate dissociation linked to contemporary ocean warming in the southern hemisphere. Nat. Commun. 2020, 11, 3788. [Google Scholar] [CrossRef] [PubMed]
- Chuvilin, E.; Bukhanov, B.; Ekimova, V.; Davletshina, D.; Sokolova, N. Evidence of gas emissions from permafrost in the russian arctic. Geosciences 2020, 10, 383. [Google Scholar] [CrossRef]
- Pandey, J.; Solms, N. Hydrate Stability and Methane Recovery from Gas Hydrate through CH4–CO2 Replacement in Different Mass Transfer Scenarios. Energies 2019, 12, 2309. [Google Scholar] [CrossRef] [Green Version]
- Liu, Y.; Wang, P.; Yang, M.; Zhao, Y.; Zhao, J.; Song, Y. CO2 sequestration in depleted methane hydrate sandy reservoirs. J. Nat. Gas Sci. Eng. 2018, 49, 428–434. [Google Scholar] [CrossRef]
- Englezos, P. Extraction of methane hydrate energy by carbon dioxide injection-key challenges and a paradigm shift. Chin. J. Chem. Eng. 2019, 27, 2044–2048. [Google Scholar] [CrossRef]
- Pandey, J.S.; Karantonidis, C.; Karcz, A.P.; von Solms, N. Enhanced CH4-CO2 Hydrate Swapping in the Presence of Low Dosage Methanol. Energies 2020, 13, 5238. [Google Scholar] [CrossRef]
- Waite, W.F.; Santamarina, J.C.; Cortes, D.D.; Dugan, B.; Espinoza, D.N.; Germaine, J.; Jang, J.; Jung, J.W.; Kneafsey, T.J.; Shin, H.; et al. Physical properties of hydrate-bearing sediments. Rev. Geophys. 2009, 47, RG4003. [Google Scholar] [CrossRef]
- Uchida, T. Physical property measurements on CO2 clathrate hydratesReview of crystallography, hydration number, and mechanical properties. Waste Manag. 1998, 17, 343–352. [Google Scholar]
- Parrenin, F.; Masson-Delmotte, V.; Köhler, P.; Raynaud, D.; Paillard, D.; Schwander, J.; Barbante, C.; Landais, A.; Wegner, A.; Jouzel, J. Synchronous change of atmospheric CO2 and antarctic temperature during the last deglacial warming. Science 2013, 339, 1060–1063. [Google Scholar] [CrossRef] [PubMed]
- Boot-Handford, M.E.; Abanades, J.C.; Anthony, E.J.; Blunt, M.J.; Brandani, S.; Mac Dowell, N.; Fernández, J.R.; Ferrari, M.C.; Gross, R.; Hallett, J.P.; et al. Carbon capture and storage update. Energy Environ. Sci. 2014, 7, 130–189. [Google Scholar] [CrossRef]
- Dashti, H.; Zhehao Yew, L.; Lou, X. Recent advances in gas hydrate-based CO2 capture. J. Nat. Gas Sci. Eng. 2015, 23, 195–207. [Google Scholar] [CrossRef] [Green Version]
- Babu, P.; Linga, P.; Kumar, R.; Englezos, P. A review of the hydrate based gas separation (HBGS) process for carbon dioxide pre-combustion capture. Energy 2015, 85, 261–279. [Google Scholar] [CrossRef]
- Babu, P.; Kumar, R.; Linga, P. Pre-combustion capture of carbon dioxide in a fi xed bed reactor using the clathrate hydrate process. Energy 2013, 50, 364–373. [Google Scholar] [CrossRef]
- Wang, Y.; Lang, X.; Fan, S. Hydrate capture CO2 from shifted synthesis gas, flue gas and sour natural gas or biogas. J. Energy Chem. 2013, 22, 39–47. [Google Scholar] [CrossRef]
- Koide, H.; Takahashi, M.; Shindo, Y.; Tazaki, Y.; Iijima, M.; Ito, K.; Kimura, N.; Omata, K. Hydrate formation in sediments in the sub-seabed disposal of CO2. Energy 1997, 22, 279–283. [Google Scholar] [CrossRef]
- Koide, H.; Shindo, Y.; Tazaki, Y.; Iijima, M.; Ito, K.; Kimura, N.; Omata, K. Deep sub-seabed disposal of CO2: The most protective storage. Energy Convers. Manag. 1997, 38, 253–258. [Google Scholar] [CrossRef]
- Koide, H.; Takahashi, M.; Tsukamoto, H.; Shindo, Y. Self-trapping mechanisms of carbon dioxide in the aquifer disposal. Energy Convers. Manag. 1995, 36, 505–508. [Google Scholar] [CrossRef]
- Tohidi, B.; Yang, J.; Salehabadi, M.; Anderson, R.; Chapoy, A. CO2 hydrates could provide secondary safety factor in subsurface sequestration of CO2. Environ. Sci. Technol. 2010, 44, 1509–1514. [Google Scholar] [CrossRef] [PubMed]
- Kvamme, B.; Graue, A.; Buanes, T.; Kuznetsova, T.; Ersland, G. Storage of CO2 in natural gas hydrate reservoirs and the effect of hydrate as an extra sealing in cold aquifers. Int. J. Greenh. Gas Control 2007, 1, 236–246. [Google Scholar] [CrossRef]
- Zheng, J.; Chong, Z.R.; Qureshi, M.F.; Linga, P. Carbon Dioxide Sequestration via Gas Hydrates: A Potential Pathway toward Decarbonization. Energy Fuels 2020, 34, 10529–10546. [Google Scholar]
- Hermanrud, C.; Andresen, T.; Eiken, O.; Hansen, H.; Janbu, A.; Lippard, J.; Bolås, H.N.; Simmenes, T.H.; Teige, G.M.G.; Østmo, S. Storage of CO2 in saline aquifers–Lessons learned from 10 years of injection into the Utsira Formation in the Sleipner area. Energy Procedia 2009, 1, 1997–2004. [Google Scholar] [CrossRef] [Green Version]
- Eiken, O.; Ringrose, P.; Hermanrud, C.; Nazarian, B.; Torp, T.A.; Høier, L. Lessons Learned from 14 years of CCS Operations: Sleipner, In Salah and Snøhvit. Energy Procedia 2011, 4, 5541–5548. [Google Scholar] [CrossRef] [Green Version]
- Duong, C.; Bower, C.; Hume, K.; Rock, L.; Tessarolo, S. Quest carbon capture and storage offset project: Findings and learnings from 1st reporting period. Int. J. Greenh. Gas Control 2019, 89, 65–75. [Google Scholar] [CrossRef]
- Almenningen, S.; Betlem, P.; Hussain, A.; Roy, S.; Senger, K.; Ersland, G. Demonstrating the potential of CO2 hydrate self-sealing in Svalbard, Arctic Norway. Int. J. Greenh. Gas Control 2019, 89, 1–8. [Google Scholar] [CrossRef]
- Le Nindre, Y.M.; Allier, D.; Duchkov, A.; Altunina, L.K.; Shvartsev, S.; Zhelezniak, M.; Klerkx, J. Storing CO2 underneath the Siberian Permafrost: A win-win solution for long-term trapping of CO2 and heavy oil upgrading. Energy Procedia 2011, 4, 5414–5421. [Google Scholar] [CrossRef] [Green Version]
- Duchkov, A.D.; Permyakov, M.E.; Sokolova, L.S.; Ayunov, D.E. Assessment of possibility for carbon dioxide st orage in west siberian permafrost. Pet. Abstr. 2014, 55, 97. [Google Scholar]
- Qanbari, F.; Pooladi-Darvish, M.; Tabatabaie, S.H.; Gerami, S. CO2 disposal as hydrate in ocean sediments. J. Nat. Gas Sci. Eng. 2012, 8, 139–149. [Google Scholar] [CrossRef]
- Kvamme, B.; Aromada, S.A.; Saeidi, N. Heterogeneous and homogeneous hydrate nucleation in CO2/water systems. J. Cryst. Growth 2019, 522, 160–174. [Google Scholar] [CrossRef]
- Mu, L.; Von Solms, N. Methane Production and Carbon Capture by Hydrate Swapping. Energy Fuels 2017, 31, 3338–3347. [Google Scholar] [CrossRef]
- Kang, S.P.; Lee, H. Recovery of CO2 from flue gas using gas hydrate: Thermodynamic verification through phase equilibrium measurements. Environ. Sci. Technol. 2000, 34, 4397–4400. [Google Scholar] [CrossRef]
- Kang, S.P.; Lee, H.; Lee, C.S.; Sung, W.M. Hydrate phase equilibria of the guest mixtures containing CO2, N2 and tetrahydrofuran. Fluid Phase Equilib. 2001, 185, 101–109. [Google Scholar] [CrossRef]
- Ho, L.C.; Babu, P.; Kumar, R.; Linga, P. HBGS (hydrate based gas separation) process for carbon dioxide capture employing an unstirred reactor with cyclopentane. Energy 2013, 63, 252–259. [Google Scholar] [CrossRef]
- Tang, J.; Zeng, D.; Wang, C.; Chen, Y.; He, L.; Cai, N. Study on the influence of SDS and THF on hydrate-based gas separation performance. Chem. Eng. Res. Des. 2013, 91, 1777–1782. [Google Scholar] [CrossRef]
- Scott, M.J.; Jones, M.N. The biodegradation of surfactants in the environment. Biochim. Biophys. Acta Biomembr. 2000, 1508, 235–251. [Google Scholar] [CrossRef] [Green Version]
- Bhattacharjee, G.; Sangwai, J.S.; Veluswamy, H.P.; Kumar, R.; Linga, P.; Pandey, G. Alleviation of Foam Formation in a Surfactant Driven Gas Hydrate System: Insights via a Detailed Morphological Study. ACS Appl. Energy Mater. 2018, 1, 6899–6911. [Google Scholar]
- Prasad, P.S.R.; Kiran, B.S. Are the amino acids thermodynamic inhibitors or kinetic promoters for carbon dioxide hydrates? J. Nat. Gas Sci. Eng. 2018, 52, 461–466. [Google Scholar] [CrossRef]
- Lal, B.; Mukhtar, H.; Bavoh, C.B.; Osei, H.; Sabil, K.M. A Review on the Role of Amino Acids in Gas Hydrate Inhibition, CO2 Capture and Sequestration, and Natural Gas Storage. J. Nat. Gas Sci. Eng. 2019, 64, 52–71. [Google Scholar]
- Kyte, J.; Doolittle, R.F. A simple method for displaying the hydropathic character of a protein. J. Mol. Biol. 1982, 157, 105–132. [Google Scholar] [CrossRef] [Green Version]
- Linga, P.; Daraboina, N.; Ripmeester, J.A.; Englezos, P. Enhanced rate of gas hydrate formation in a fixed bed column filled with sand compared to a stirred vessel. Chem. Eng. Sci. 2012, 68, 617–623. [Google Scholar] [CrossRef]
- Linga, P.; Kumar, R.; Englezos, P. The clathrate hydrate process for post and pre-combustion capture of carbon dioxide. J. Hazard. Mater. 2007, 149, 625–629. [Google Scholar] [CrossRef]
- Lee, W.; Kim, Y.S.; Kang, S.P. Semiclathrate-based CO2 capture from fuel gas in the presence of tetra-n-butyl ammonium bromide and silica gel pore structure. Chem. Eng. J. 2018, 331, 1–7. [Google Scholar] [CrossRef]
- Kumar, R.; Linga, P.; Englezos, P. Pre and Post Combustion Capture of Carbon Dioxide via Hydrate Formation. In Proceedings of the 2006 IEEE EIC Climate Change Conference, Ottawa, ON, Canada, 10–12 May 2006; 2006; pp. 1–7. [Google Scholar]
- Linga, P.; Kumar, R.; Englezos, P. Gas hydrate formation from hydrogen/carbon dioxide and nitrogen/carbon dioxide gas mixtures. Chem. Eng. Sci. 2007, 62, 4268–4276. [Google Scholar] [CrossRef]
- Duc, N.H.; Chauvy, F.; Herri, J.M. CO2 capture by hydrate crystallization—A potential solution for gas emission of steelmaking industry. Energy Convers. Manag. 2007, 48, 1313–1322. [Google Scholar] [CrossRef]
- Daraboina, N.; Ripmeester, J.; Englezos, P. The impact of SO2 on post combustion carbon dioxide capture in bed of silica sand through hydrate formation. Int. J. Greenh. Gas Control 2013, 15, 97–103. [Google Scholar] [CrossRef]
- Kumar, A.; Sakpal, T.; Linga, P.; Kumar, R. Impact of fly ash impurity on the hydrate-based gas separation process for carbon dioxide capture from a flue gas mixture. Ind. Eng. Chem. Res. 2014, 53, 9849–9859. [Google Scholar] [CrossRef]
- Arora, A.; Kumar, A.; Bhattacharjee, G.; Balomajumder, C.; Kumar, P. Hydrate-Based Carbon Capture Process: Assessment of Various Packed Bed Systems for Boosted Kinetics of Hydrate Formation. J. Energy Resour. Technol. 2020, 143, 1–7. [Google Scholar] [CrossRef]
- Wang, X.; Zhang, F.; Lipiński, W. Research progress and challenges in hydrate-based carbon dioxide capture applications. Appl. Energy 2020, 269, 114928. [Google Scholar]
- Pan, Z.; Liu, Z.; Zhang, Z.; Shang, L.; Ma, S. Effect of silica sand size and saturation on methane hydrate formation in the presence of SDS. J. Nat. Gas Sci. Eng. 2018, 56, 266–280. [Google Scholar]
- Daraboina, N.; Von Solms, N. The combined effect of thermodynamic promoters tetrahydrofuran and cyclopentane on the kinetics of flue gas hydrate formation. J. Chem. Eng. Data 2015, 60, 247–251. [Google Scholar] [CrossRef]
- Pandey, J.S.; Daas, Y.J.; Von Solms, N. Insights into Kinetics of Methane Hydrate Formation in the Presence of Surfactants. Processes 2019, 7, 598. [Google Scholar] [CrossRef] [Green Version]
- Pandey, J.S.; Daas, Y.J.; Von Solms, N. Screening of Amino Acids and Surfactant as Hydrate Promoter for CO2 Capture from Flue Gas. Processes 2020, 8, 124. [Google Scholar] [CrossRef] [Green Version]
- Berge, L.I.; Jacobsen, K.A.; Solstad, A. Measured acoustic wave velocities of R11 (CCl3F) hydrate samples with and without sand as a function of hydrate concentration. J. Geophys. Res. Solid Earth 1999, 104, 15415–15424. [Google Scholar] [CrossRef]
- Kumar, A.; Maini, B.; Bishnoi, P.R.; Clarke, M.; Zatsepina, O.; Srinivasan, S. Experimental determination of permeability in the presence of hydrates and its effect on the dissociation characteristics of gas hydrates in porous media. J. Pet. Sci. Eng. 2010, 70, 114–122. [Google Scholar]
- Gauteplass, J.; Almenningen, S.; Ersland, G.; Barth, T. Hydrate seal formation during laboratory CO2 injection in a cold aquifer. Int. J. Greenh. Gas Control 2018, 78, 21–26. [Google Scholar] [CrossRef]
- Ta, X.H.; Yun, T.S.; Muhunthan, B.; Kwon, T.-H. Observations of pore-scale growth patterns of carbon dioxide hydrate using X-ray computed microtomography. Geochem. Geophys. Geosyst. 2015, 16, 267–300. [Google Scholar]
- Lone, A.; Kelland, M.A. Exploring kinetic hydrate inhibitor test methods and conditions using a multicell steel rocker rig. Energy Fuels 2013, 27, 2536–2547. [Google Scholar] [CrossRef]
- Kelland, M.A.; Abrahamsen, E.; Ajiro, H.; Akashi, M. Kinetic Hydrate Inhibition with N-Alkyl-N-vinylformamide Polymers: Comparison of Polymers to n-Propyl and Isopropyl Groups. Energy Fuels 2015, 29, 4941–4946. [Google Scholar] [CrossRef]
- Molokitina, N.S.; Nesterov, A.N.; Podenko, L.S.; Reshetnikov, A.M. Carbon dioxide hydrate formation with SDS: Further insights into mechanism of gas hydrate growth in the presence of surfactant. Fuel 2019, 235, 1400–1411. [Google Scholar] [CrossRef]
- Gayet, P.; Dicharry, C.; Marion, G.; Graciaa, A.; Lachaise, J.; Nesterov, A. Experimental determination of methane hydrate dissociation curve up to 55 MPa by using a small amount of surfactant as hydrate promoter. Chem. Eng. Sci. 2005, 60, 5751–5758. [Google Scholar] [CrossRef]
- Hashimoto, H.; Yamaguchi, T.; Ozeki, H.; Muromachi, S. Structure-driven CO2 selectivity and gas capacity of ionic clathrate hydrates. Sci. Rep. 2017, 7, 1–10. [Google Scholar] [CrossRef]
- Rodriguez, C.T.; Le, Q.D.; Focsa, C.; Pirim, C.; Chazallon, B. Influence of crystallization parameters on guest selectivity and structures in a CO2-based separation process using TBAB semi-clathrate hydrates. Chem. Eng. J. 2020, 382, 122867. [Google Scholar] [CrossRef]
- Maeda, N. Nucleation Curve of Carbon Dioxide Hydrate from a Linear Cooling Ramp Method. J. Phys. Chem. A 2019, 123, 7911–7919. [Google Scholar] [CrossRef]
- Bagherzadeh, S.A.; Moudrakovski, I.L.; Ripmeester, J.A.; Englezos, P. Magnetic resonance imaging of gas hydrate formation in a bed of silica sand particles. Energy Fuels 2011, 25, 3083–3092. [Google Scholar] [CrossRef]
- Sa, J.H.; Kwak, G.H.; Han, K.; Ahn, D.; Lee, K.H. Gas hydrate inhibition by perturbation of liquid water structure. Sci. Rep. 2015, 5, 1–9. [Google Scholar] [CrossRef] [Green Version]
- Sadeq, D.; Iglauer, S.; Lebedev, M.; Rahman, T.; Zhang, Y.; Barifcani, A. Experimental pore-scale analysis of carbon dioxide hydrate in sandstone via X-Ray micro-computed tomography. Int. J. Greenh. Gas Control 2018, 79, 73–82. [Google Scholar] [CrossRef]
- Almenningen, S.; Gauteplass, J.; Fotland, P.; Aastveit, G.L.; Barth, T.; Ersland, G. Visualization of hydrate formation during CO2 storage in water-saturated sandstone. Int. J. Greenh. Gas Control 2018, 79, 272–278. [Google Scholar] [CrossRef]
- Oya, S.; Aifaa, M.; Ohmura, R. Formation, growth and sintering of CO2 hydrate crystals in liquid water with continuous CO2 supply: Implication for subsurface CO2 sequestration. Int. J. Greenh. Gas Control 2017, 63, 386–391. [Google Scholar] [CrossRef]
- Kvamme, B. Feasibility of simultaneous CO2 storage and CH4 production from natural gas hydrate using mixtures of CO2 and N2. WSEAS Trans. Heat Mass Transf. 2015, 10, 21–30. [Google Scholar] [CrossRef]
- Singh, H.; Myshakin, E.M.; Seol, Y. A nonempirical relative permeability model for hydrate-bearing sediments. SPE J. 2019, 24, 547–562. [Google Scholar] [CrossRef]
- Yang, M.; Song, Y.; Jiang, L.; Zhu, N.; Liu, Y.; Zhao, Y.; Dou, B.; Li, Q. CO2 hydrate formation and dissociation in cooled porous media: A potential technology for CO2 capture and storage. Environ. Sci. Technol. 2013, 47, 9739–9746. [Google Scholar] [CrossRef]
- Massah, M.; Sun, D.; Sharifi, H.; Englezos, P. Demonstration of gas-hydrate assisted carbon dioxide storage through horizontal injection in lab-scale reservoir. J. Chem. Thermodyn. 2018, 117, 106–112. [Google Scholar] [CrossRef]
- Mekala, P.; Busch, M.; Mech, D.; Patel, R.S.; Sangwai, J.S. Effect of silica sand size on the formation kinetics of CO2hydrate in porous media in the presence of pure water and seawater relevant for CO2sequestration. J. Pet. Sci. Eng. 2014, 122, 1–9. [Google Scholar] [CrossRef]
- Malagar, B.R.C.; Lijith, K.P.P.; Singh, D.N.N. Formation & dissociation of methane gas hydrates in sediments: A critical review. J. Nat. Gas Sci. Eng. 2019, 65, 168–184. [Google Scholar]
- Liu, Z.; Sun, B.; Wang, Z.; Chen, L. New Mass-Transfer Model for Predicting Hydrate Film Thickness at the Gas-Liquid Interface under Different Thermodynamics-Hydrodynamics-Saturation Conditions. J. Phys. Chem. C 2019, 123, 20838–20852. [Google Scholar] [CrossRef]
- Jung, J.W.; Espinoza, D.N.; Santamarina, J.C. Properties and phenomena relevant to CH4-CO2 replacement in hydrate-bearing sediments. J. Geophys. Res. Solid Earth 2010, 115, 1–16. [Google Scholar] [CrossRef]
- Bhattacharjee, G.; Kumar, A.; Sakpal, T.; Kumar, R. Carbon dioxide sequestration: Influence of porous media on hydrate formation kinetics. ACS Sustain. Chem. Eng. 2015, 3, 1205–1214. [Google Scholar] [CrossRef]
- Pandey, J.S.; Daas, Y.J.; Von Solms, N. Methane Hydrate Formation, Storage and Dissociation Behavior inUnconsolidated Sediments in the Presence of Environment-FriendlyPromoters. In Proceedings of the SPE Europec featured at 82nd EAGE Conference and Exhibition, Amsterdam, The Netherlands, 8–11 December 2020. [Google Scholar]
- Ohno, H.; Susilo, R.; Gordienko, R.; Ripmeester, J.; Walker, V.K. Interaction of antifreeze proteins with hydrocarbon hydrates. Chem. A Eur. J. 2010, 16, 10409–10417. [Google Scholar] [CrossRef] [PubMed]
- Pivezhani, F.; Roosta, H.; Dashti, A.; Mazloumi, S.H. Investigation of CO2 hydrate formation conditions for determining the optimum CO2 storage rate and energy: Modeling and experimental study. Energy 2016, 113, 215–226. [Google Scholar] [CrossRef]
- Adeyemo, A.; Kumar, R.; Linga, P.; Ripmeester, J.; Englezos, P. Capture of carbon dioxide from flue or fuel gas mixtures by clathrate crystallization in a silica gel column. Int. J. Greenh. Gas Control 2010, 4, 478–485. [Google Scholar] [CrossRef] [Green Version]
- Linga, P.; Adeyemo, A.; Englezos, P. Medium-pressure clathrate hydrate/membrane hybrid process for postcombustion capture of carbon dioxide. Environ. Sci. Technol. 2008, 42, 315–320. [Google Scholar] [CrossRef]
- Mu, D.; Liu, Z.S.; Huang, C.; Djilali, N. Determination of the effective diffusion coefficient in porous media including Knudsen effects. Microfluid. Nanofluidics 2008, 4, 257–260. [Google Scholar] [CrossRef]
- Sun, S.C.; Liu, C.L.; Ye, Y.G.; Liu, Y.F. Phase behavior of methane hydrate in silica sand. J. Chem. Thermodyn. 2014, 69, 118–124. [Google Scholar] [CrossRef]
- Every, D. Pore structure of silica membranes. Membr. Technol. 1999, 1999, 16. [Google Scholar]
- Yang, M.; Song, Y.; Jiang, L.; Zhao, Y.; Ruan, X.; Zhang, Y.; Wang, S. Hydrate-based technology for CO2 capture from fossil fuel power plants. Appl. Energy 2014, 116, 26–40. [Google Scholar] [CrossRef]
- Lirio da Silva, C.F.; Pessoa, F.L.P.; Uller, A.M.C. torage capacity of carbon dioxide hydrates in the presence of sodium dodecyl sulfate (SDS) and tetrahydrofuran (THF). Chem. Eng. Sci. 2013, 96, 118–123. [Google Scholar]
- Mech, D.; Gupta, P.; Sangwai, J.S. Kinetics of methane hydrate formation in an aqueous solution of thermodynamic promoters (THF and TBAB) with and without kinetic promoter (SDS). J. Nat. Gas Sci. Eng. 2016, 35, 1519–1534. [Google Scholar] [CrossRef]
- Seo, Y.T.; Moudrakovski, I.L.; Ripmeester, J.A.; Lee, J.W.; Lee, H. Efficient recovery of CO2 from flue gas by clathrate hydrate formation in porous silica gels. Environ. Sci. Technol. 2005, 39, 2315–2319. [Google Scholar] [CrossRef] [Green Version]
- Park, J.; Seo, Y.T.; Lee, J.W.; Lee, H.; Lee, H. Spectroscopic analysis of carbon dioxide and nitrogen mixed gas hydrates in silica gel for CO2 separation. Catal. Today 2006, 115, 279–282. [Google Scholar] [CrossRef]
- Hassanpouryouzband, A.; Yang, J.; Tohidi, B.; Chuvilin, E.; Istomin, V.; Bukhanov, B. Geological CO2 Capture and Storage with Flue Gas Hydrate Formation in Frozen and Unfrozen Sediments: Method Development, Real Time-Scale Kinetic Characteristics, Efficiency, and Clathrate Structural Transition. ACS Sustain. Chem. Eng. 2019, 7, 5338–5345. [Google Scholar] [CrossRef]
- Cai, Y.; Chen, Y.; Li, Q.; Li, L.; Huang, H.; Wang, S.; Wang, W. CO2 Hydrate Formation Promoted by a Natural Amino Acid l-Methionine for Possible Application to CO2 Capture and Storage. Energy Technol. 2017, 5, 1195–1199. [Google Scholar] [CrossRef]
- Sa, J.H.; Kwak, G.H.; Lee, B.R.; Park, D.H.; Han, K.; Lee, K.H. Hydrophobic amino acids as a new class of kinetic inhibitors for gas hydrate formation. Sci. Rep. 2013, 3, 1–7. [Google Scholar] [CrossRef]
- Alireza Bagherzadeh, S.; Alavi, S.; Ripmeester, J.A.; Englezos, P. Why ice-binding type i antifreeze protein acts as a gas hydrate crystal inhibitor. Phys. Chem. Chem. Phys. 2015, 17, 9984–9990. [Google Scholar] [CrossRef]
- Nasir, Q.; Suleman, H.; Elsheikh, Y.A. A review on the role and impact of various additives as promoters/ inhibitors for gas hydrate formation. J. Nat. Gas Sci. Eng. 2020, 76, 103211. [Google Scholar] [CrossRef]
- Ide, M.; Maeda, Y.; Kitano, H. Effect of hydrophobicity of amino acids on the structure of water. J. Phys. Chem. B 1997, 101, 7022–7026. [Google Scholar] [CrossRef]
- Bavoh, C.B.; Nashed, O.; Khan, M.S.; Partoon, B.; Lal, B.; Sharif, A.M. The impact of amino acids on methane hydrate phase boundary and formation kinetics. J. Chem. Thermodyn. 2018, 117, 48–53. [Google Scholar] [CrossRef]
- Perfeldt, C.M.; Chua, P.C.; Daraboina, N.; Friis, D.; Kristiansen, E.; Ramløv, H.; Woodley, J.M.; Kelland, M.A.; Von Solms, N. Inhibition of gas hydrate nucleation and growth: Efficacy of an antifreeze protein from the longhorn beetle rhagium mordax. Energy Fuels 2014, 28, 3666–3672. [Google Scholar] [CrossRef]
- Roosta, H.; Dashti, A.; Mazloumi, S.H.; Varaminian, F. Inhibition properties of new amino acids for prevention of hydrate formation in carbon dioxide-water system: Experimental and modeling investigations. J. Mol. Liq. 2016, 215, 656–663. [Google Scholar] [CrossRef]
- Veluswamy, H.P.; Lee, P.Y.; Premasinghe, K.; Linga, P. Effect of Biofriendly Amino Acids on the Kinetics of Methane Hydrate Formation and Dissociation. Ind. Eng. Chem. Res. 2017, 56, 6145–6154. [Google Scholar] [CrossRef]
- Bavoh, C.B.; Partoon, B.; Lal, B.; Gonfa, G.; Foo Khor, S.; Sharif, A.M. Inhibition effect of amino acids on carbon dioxide hydrate. Chem. Eng. Sci. 2017, 171, 331–339. [Google Scholar] [CrossRef]
- Liu, Y.; Chen, B.; Chen, Y.; Zhang, S.; Guo, W.; Cai, Y.; Tan, B.; Wang, W. Methane Storage in a Hydrated Form as Promoted by Leucines for Possible Application to Natural Gas Transportation and Storage. Energy Technol. 2015, 3, 815–819. [Google Scholar] [CrossRef]
- Bavoh, C.B.; Khan, M.S.; Lal, B.; Bt Abdul Ghaniri, N.I.; Sabil, K.M. New methane hydrate phase boundary data in the presence of aqueous amino acids. Fluid Phase Equilib. 2018, 478, 129–133. [Google Scholar] [CrossRef]
- Li, A.; Wang, J.; Bao, B. High-efficiency CO2 capture and separation based on hydrate technology: A review. Greenh. Gases Sci. Technol. 2019, 9, 175–193. [Google Scholar] [CrossRef]
- Clennell, M.B.; Henry, P.; Hovland, M.; Booth, J.S.; Winters, W.J.; Thomas, M. Formation of Natural Gas Hydrates in Marine Sediments: Gas Hydrate Growth and Stability Conditioned by Host Sediment Properties. Ann. N. Y. Acad. Sci. 2006, 912, 887–896. [Google Scholar] [CrossRef]
Figure 1.
The difference in the formation kinetics of CO2 hydrate film in the presence of chemicals could control high-density CO2 storage in hydrate-bearing sediments [13].
Figure 1.
The difference in the formation kinetics of CO2 hydrate film in the presence of chemicals could control high-density CO2 storage in hydrate-bearing sediments [13].

Figure 2.
Potential geological locations for CO2 capture and storage.
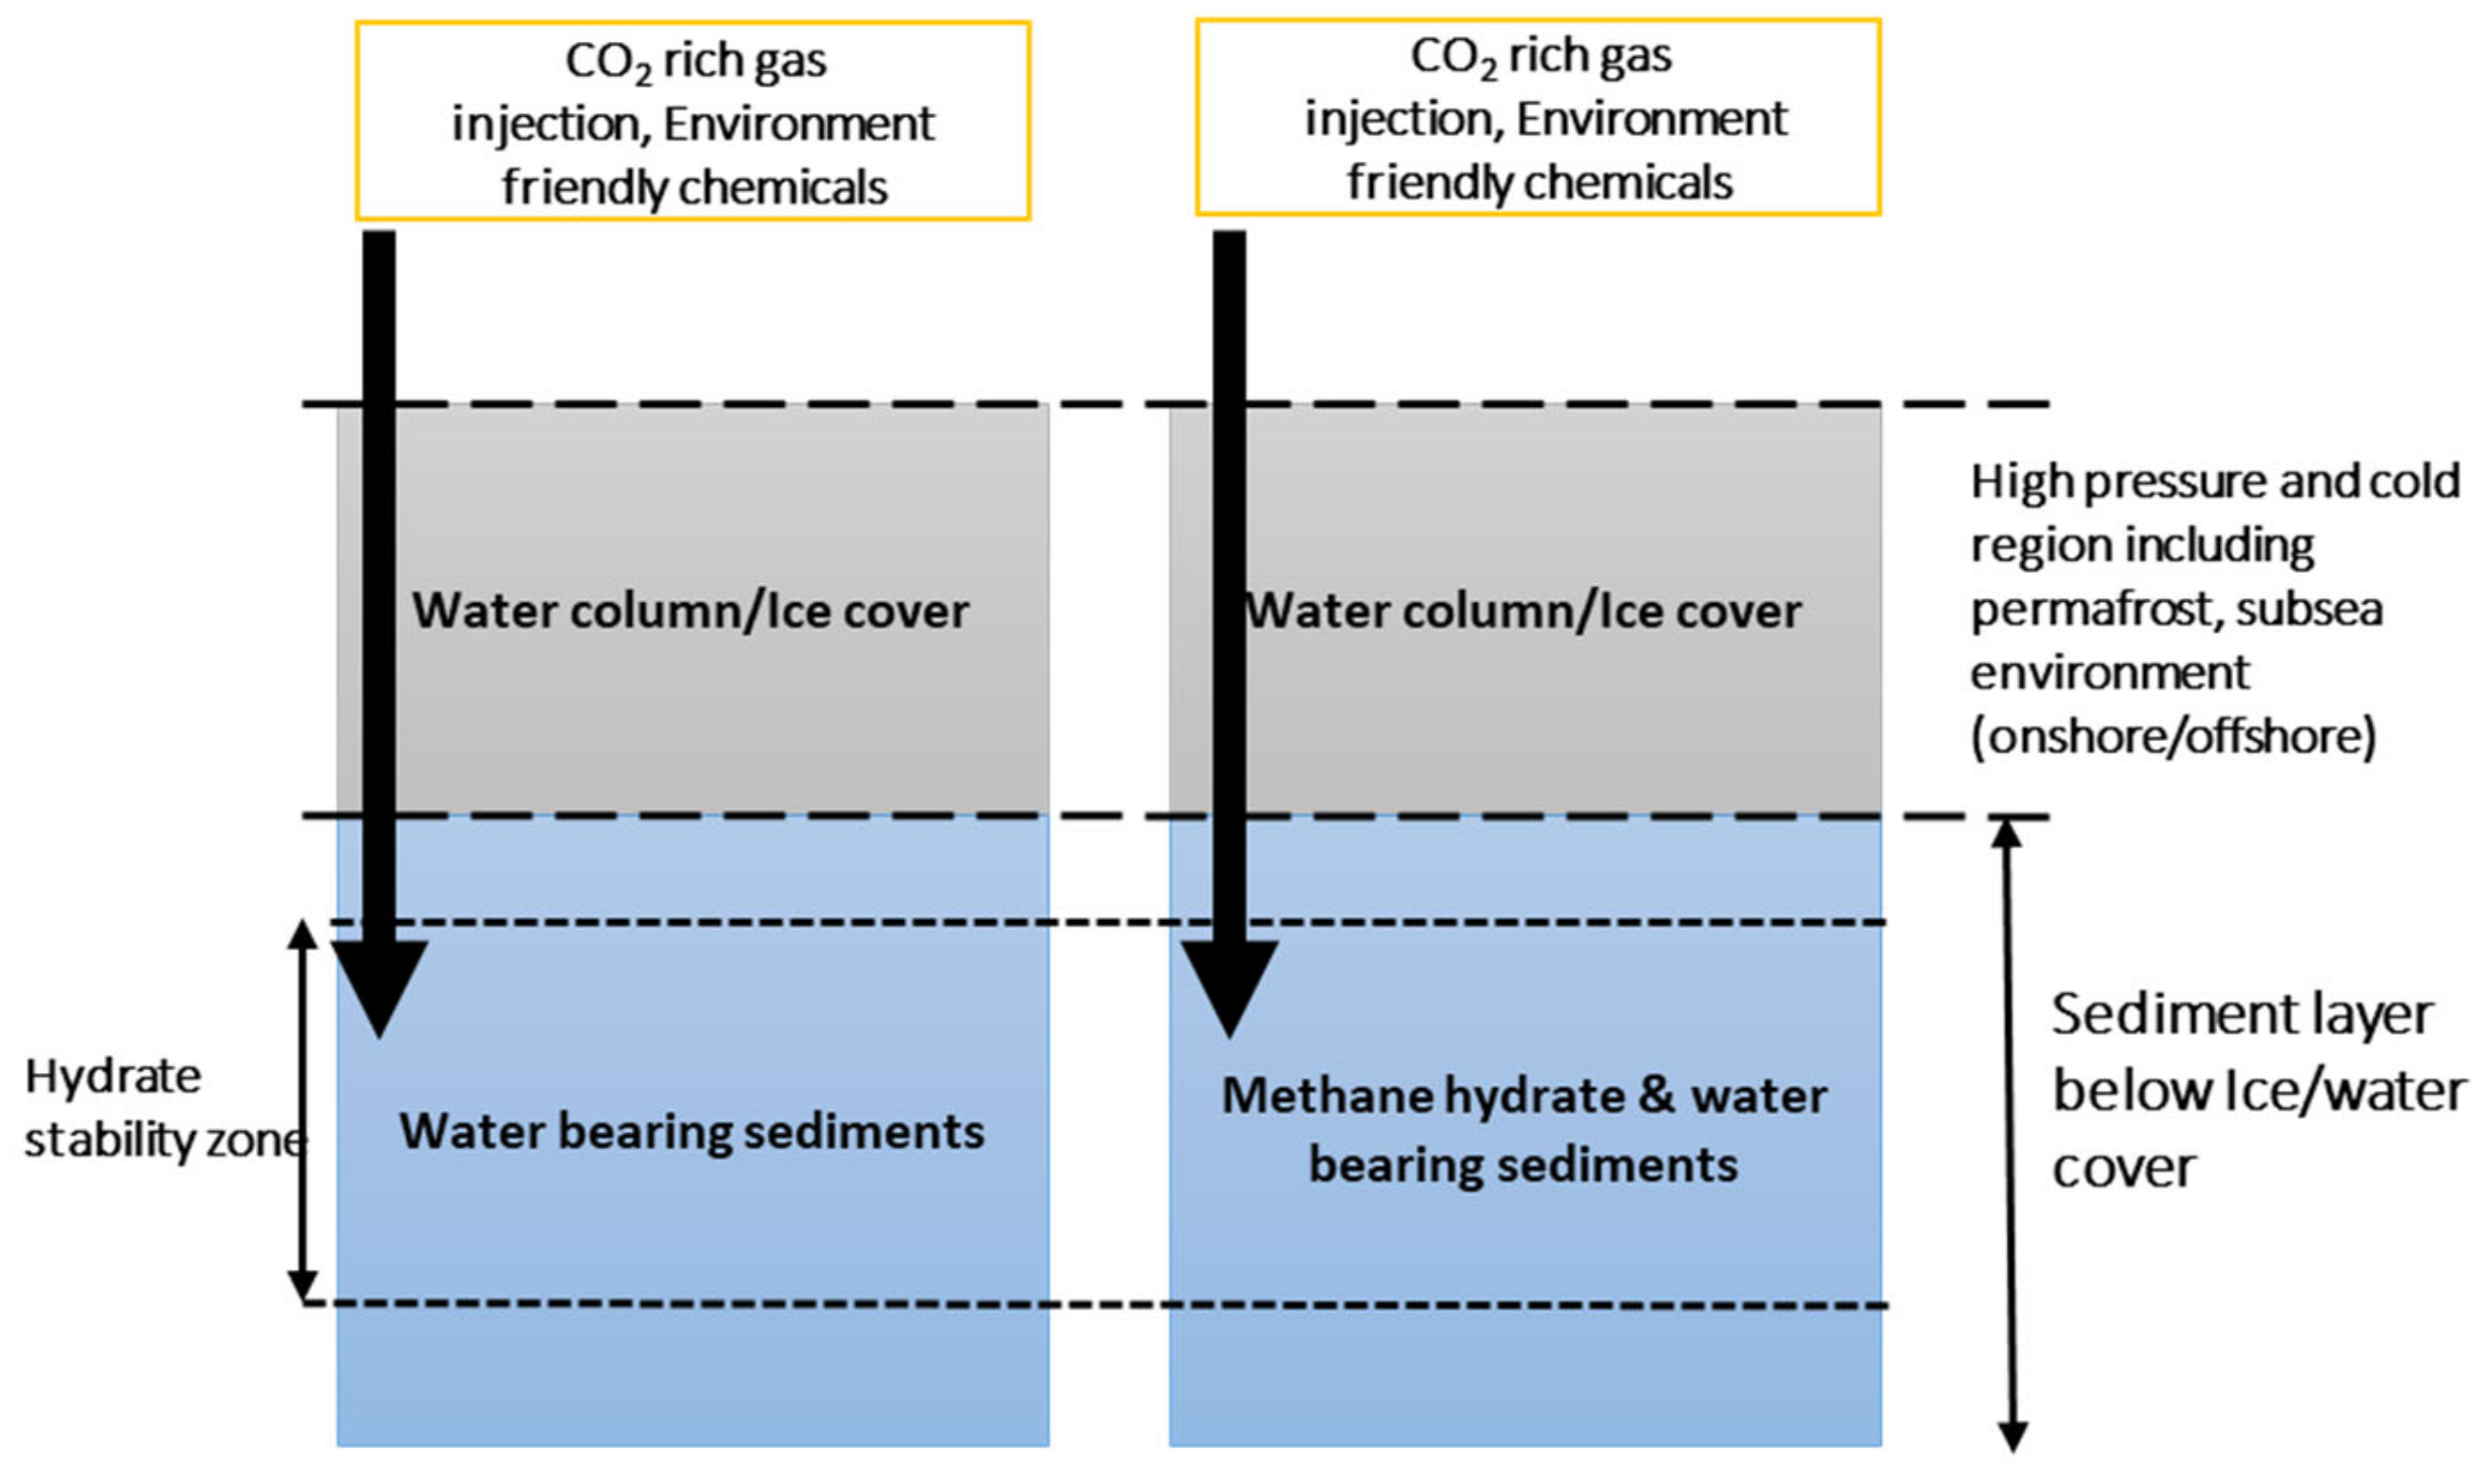
Figure 3.
Conceptual layout indicating CO2 storage in water-bearing sediments (including methane hydrate) when pure CO2 is injected and when CO2-rich gas mixture is injected.
Figure 3.
Conceptual layout indicating CO2 storage in water-bearing sediments (including methane hydrate) when pure CO2 is injected and when CO2-rich gas mixture is injected.

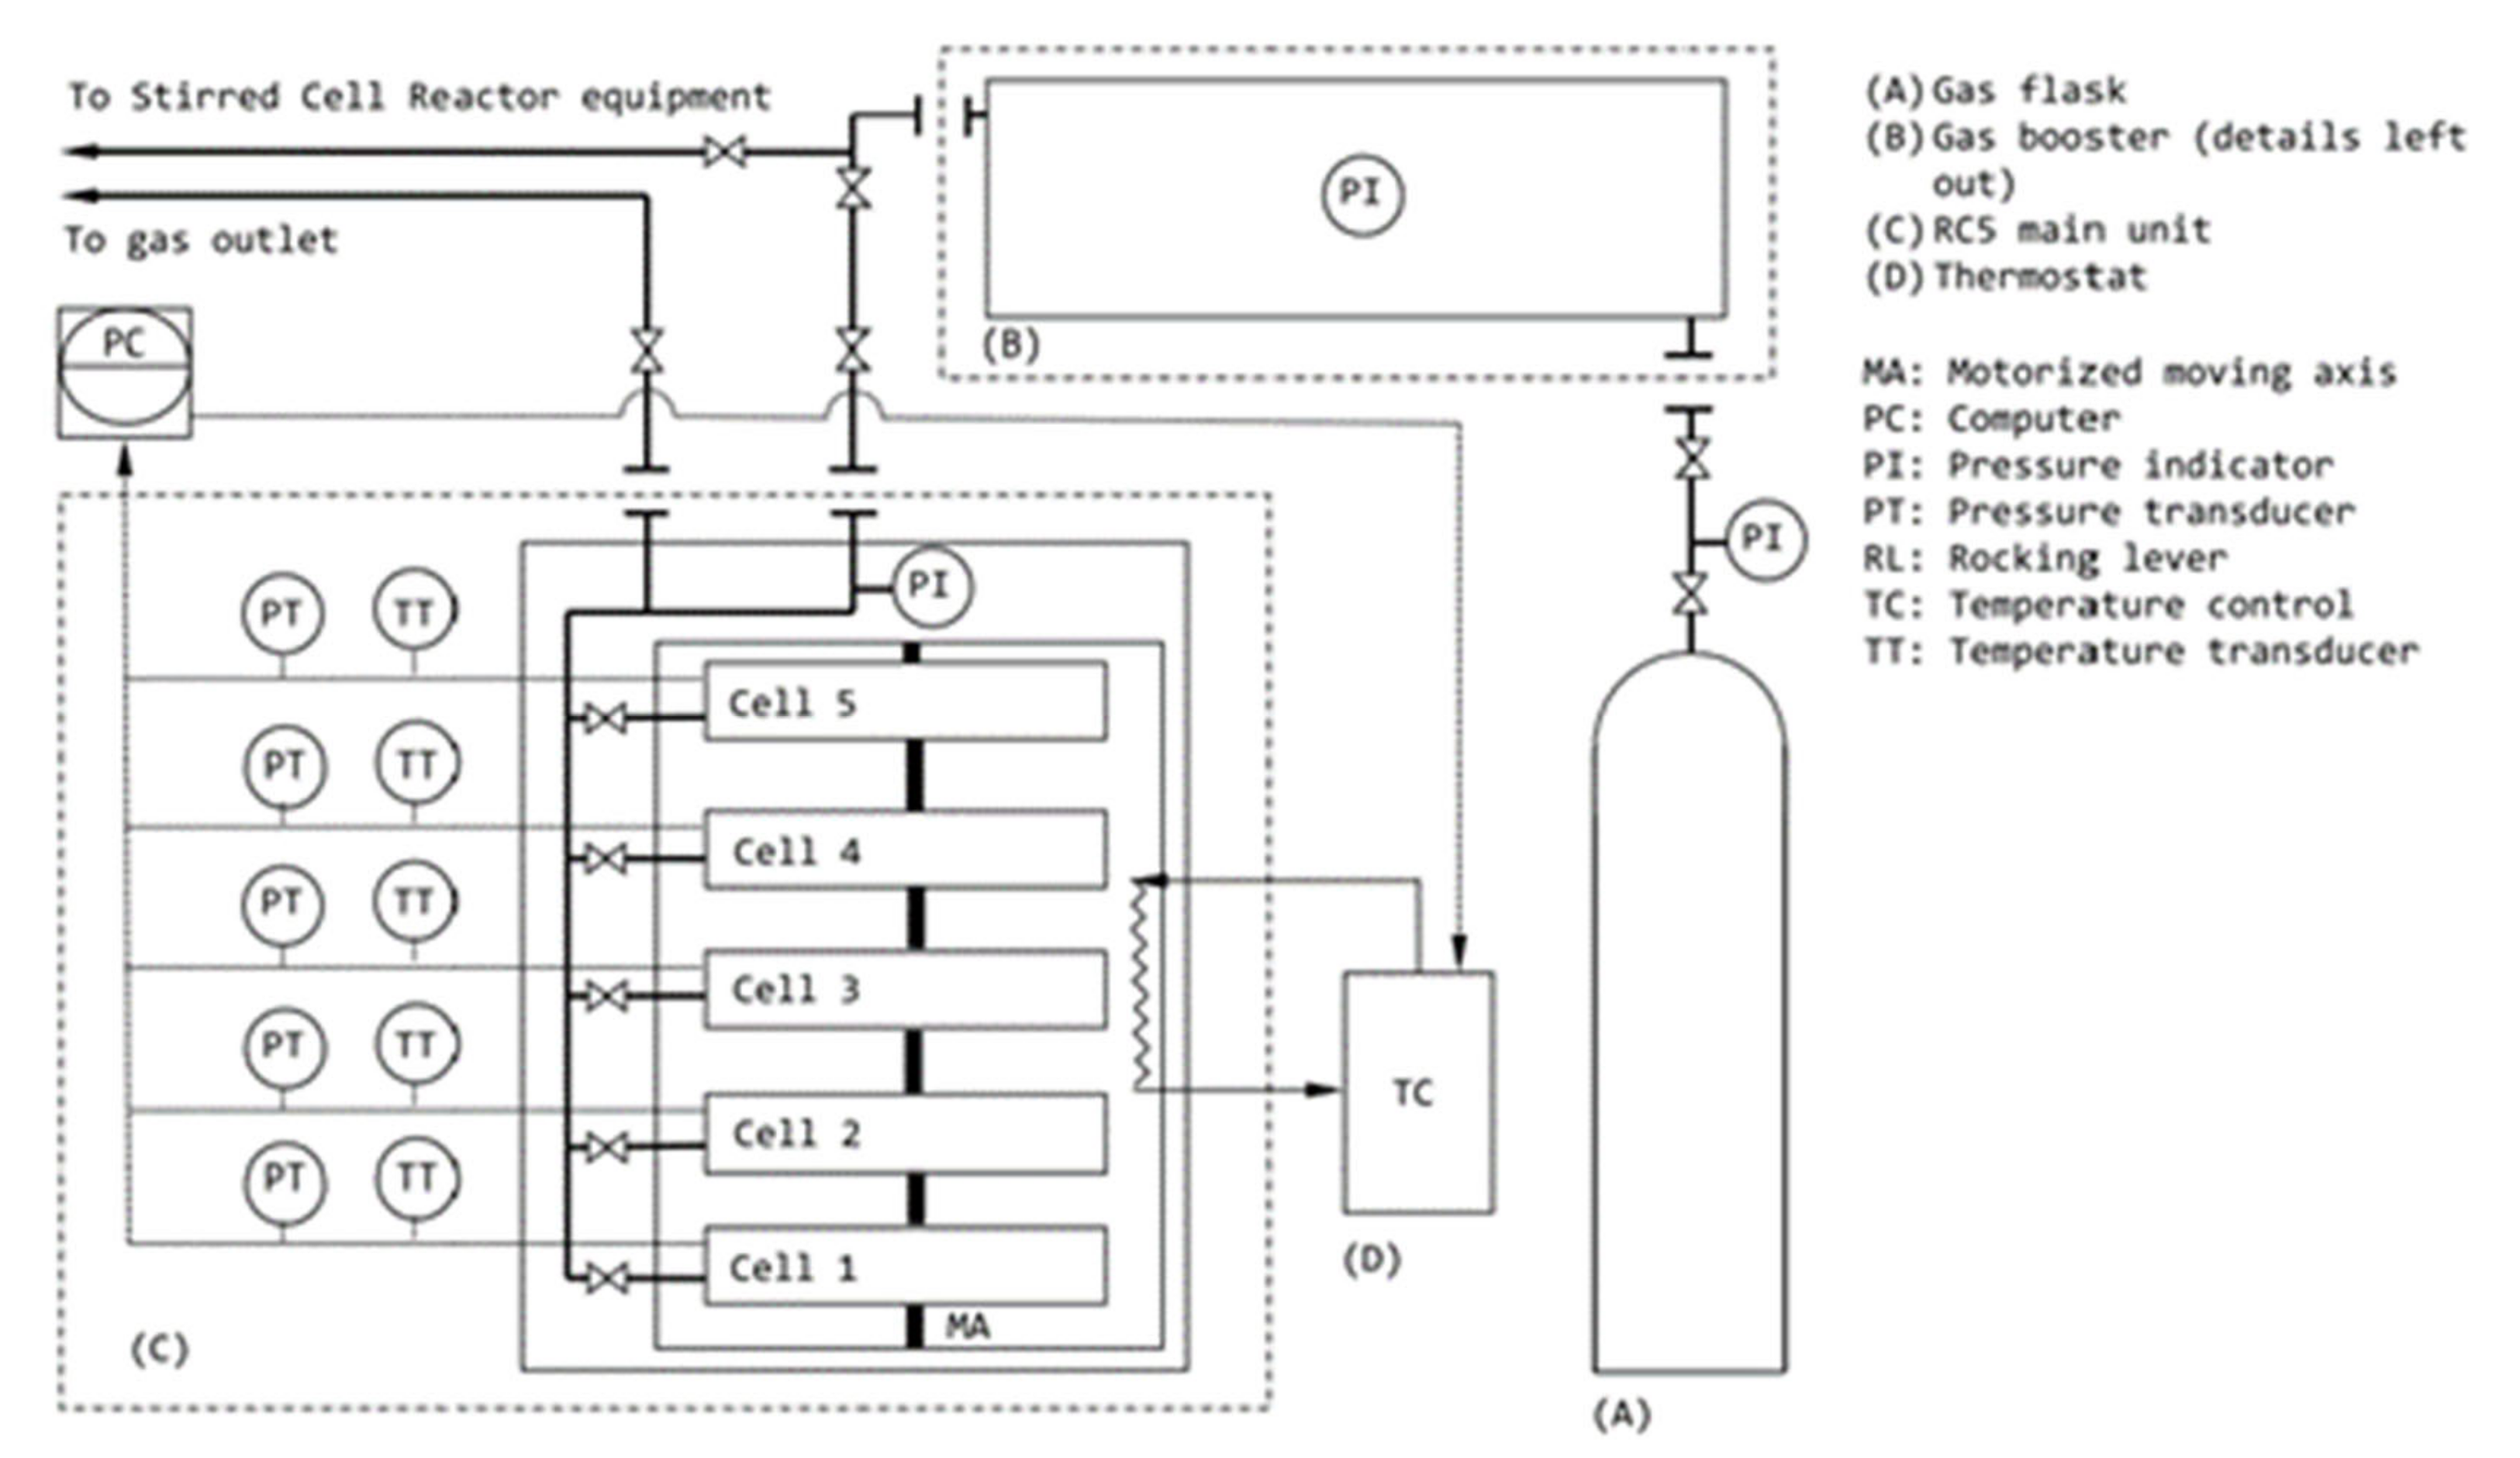
Figure 5.
Variation in nucleation temperature and subcooling for Gas B and Sand B for different chemicals.
Figure 5.
Variation in nucleation temperature and subcooling for Gas B and Sand B for different chemicals.
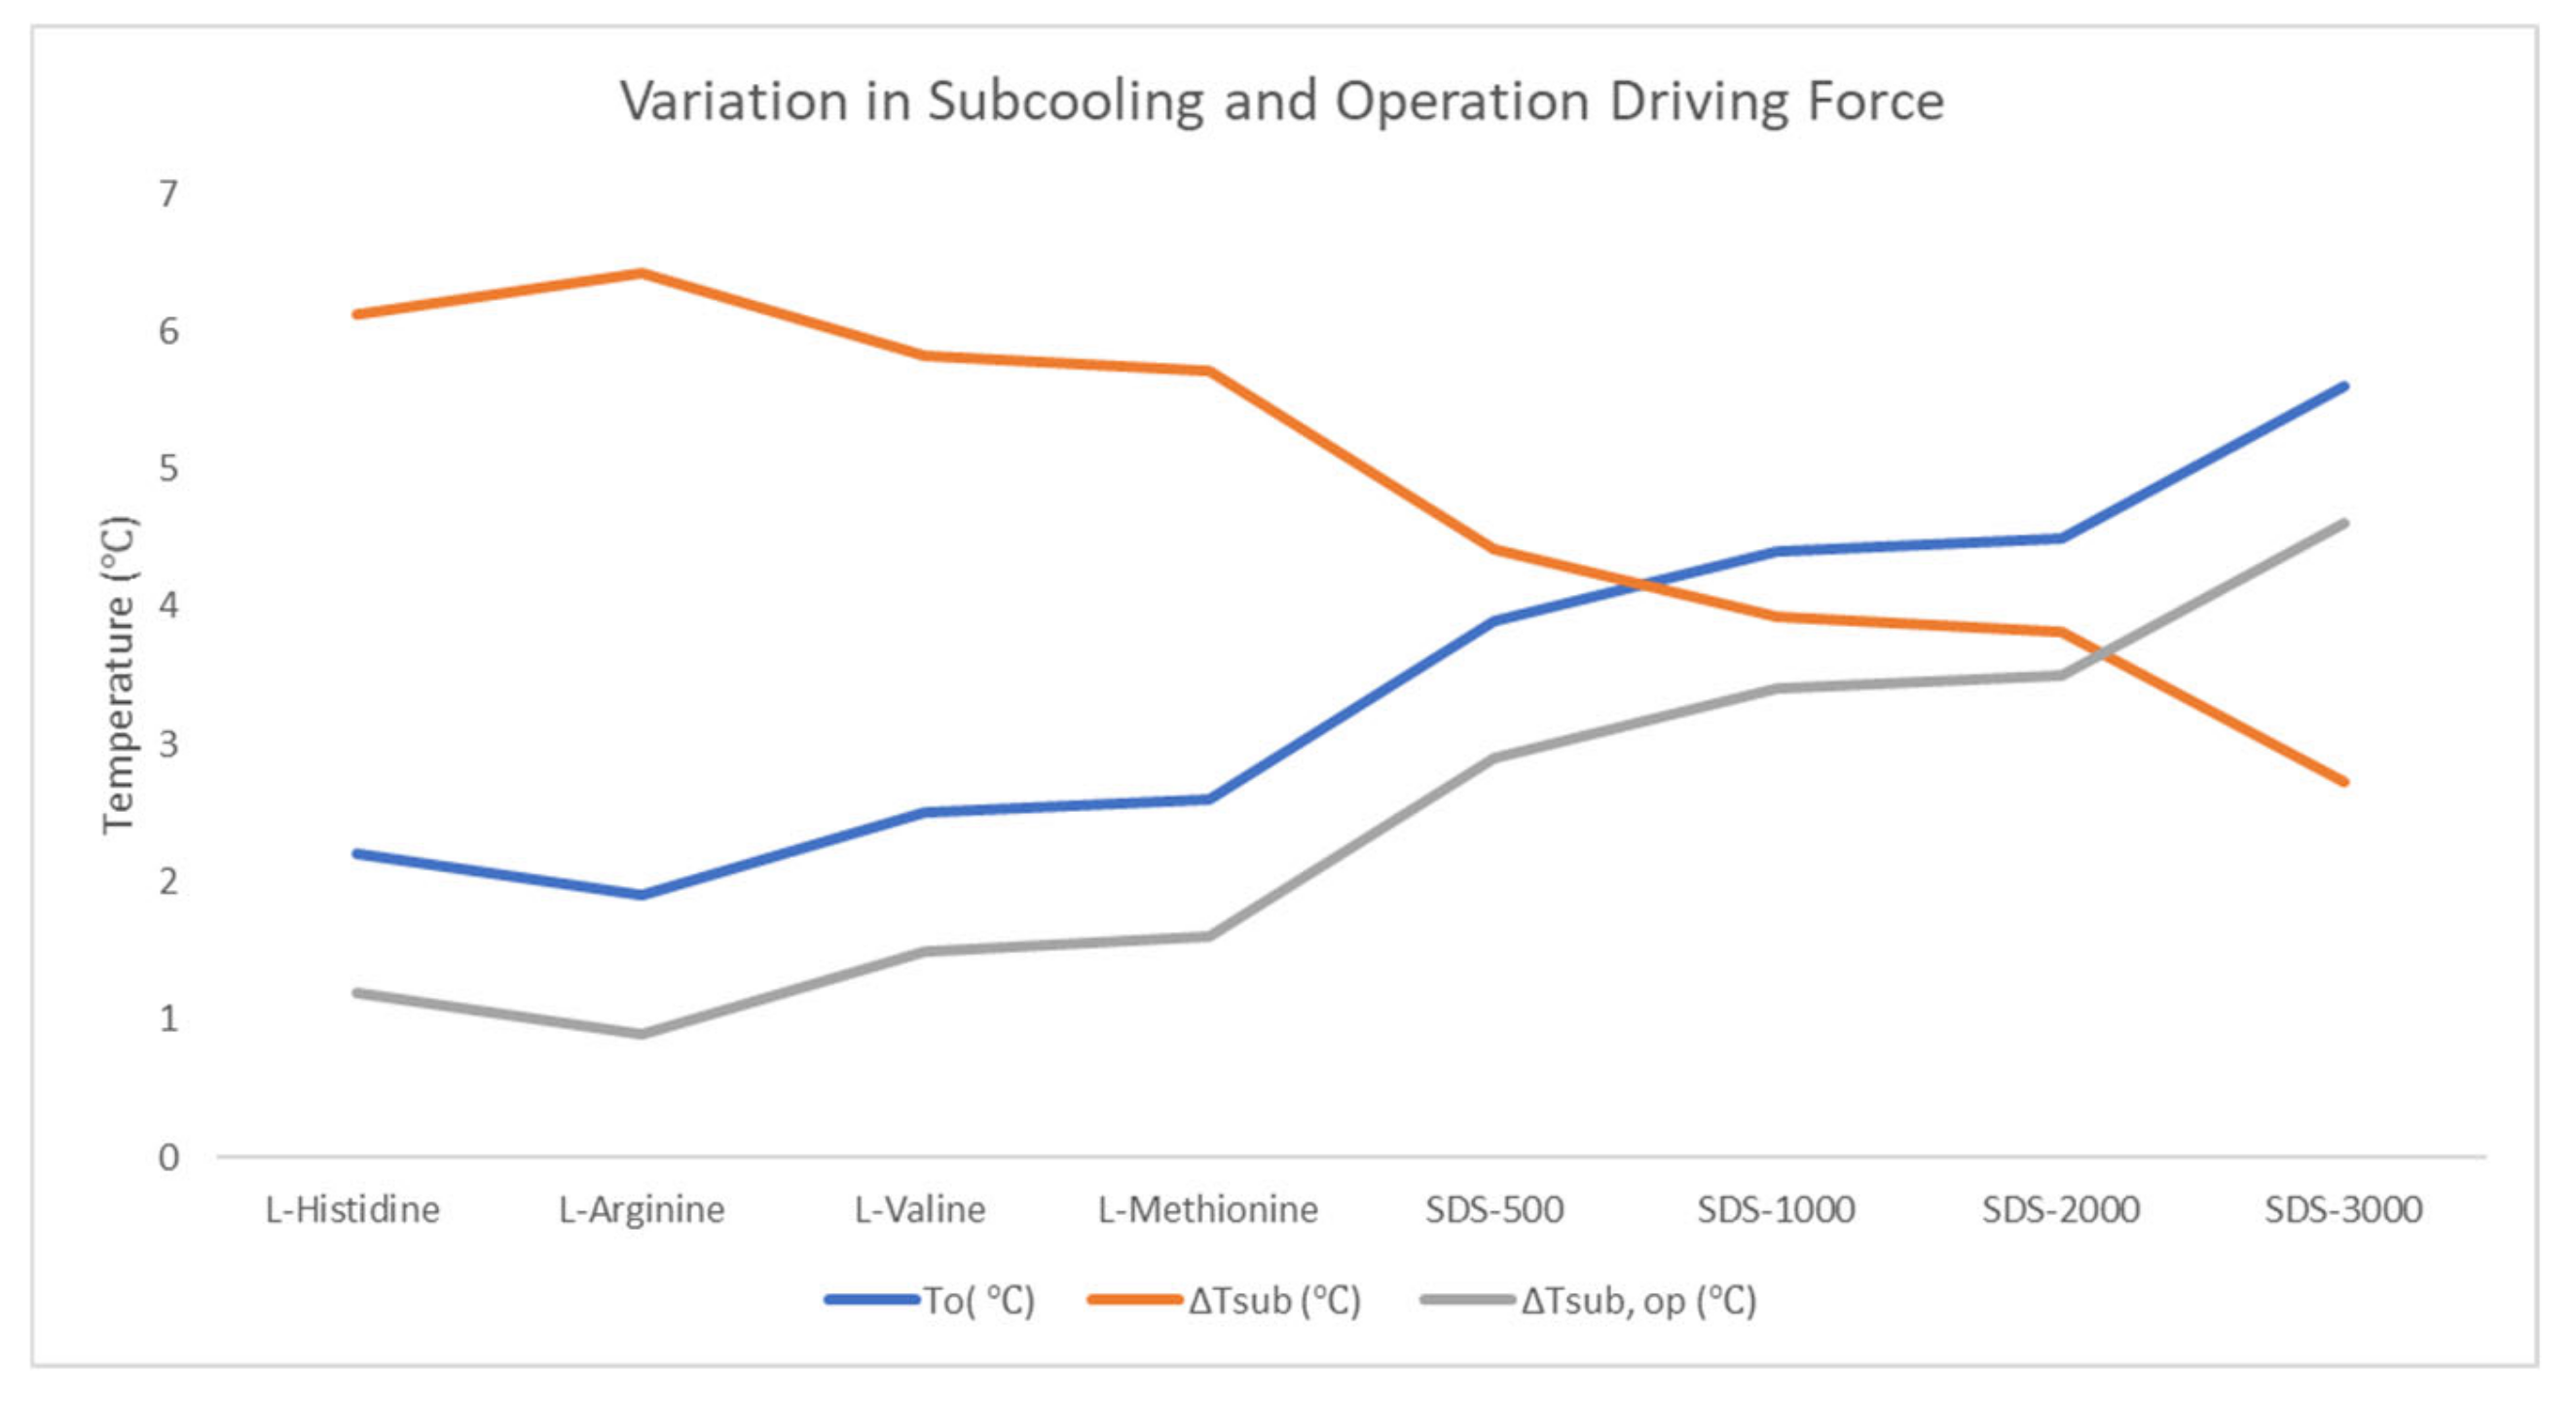
Figure 6.
Pressure profiles of CO2-rich gas hydrate formation using 20 mol% CO2 during isothermal experiments at 120 bar initial pressure and 1 °C for four amino acids (3000 ppm) and SDS (500, 1000, 2000, and 3000 ppm) during CGHF with varying sand types (A and B) and Gas A. (A) Sand A with amino acids, (B) Sand B with amino acids, (C) Sand A with SDS, and (D) Sand B with SDS.

Figure 7.
Pressure profiles of CO2-rich gas hydrate formation using 30 mol% CO2 during isothermal experiments at 120 initial bar pressure and 1 °C for four amino acids (3000 ppm) and SDS (500, 1000, 2000, and 3000 ppm) during CGHF with varying sand types (A and B) and gas B. (A) Sand A with amino acids, (B) Sand B with amino acids, (C) Sand A with SDS, and (D) Sand B with SDS.

Figure 8.
Measured induction time for varying CO2 composition and sand type in the presence of SDS and amino acids during the isothermal experiments. The numbers beside SDS refer to the ppm concentration.
Figure 8.
Measured induction time for varying CO2 composition and sand type in the presence of SDS and amino acids during the isothermal experiments. The numbers beside SDS refer to the ppm concentration.

Figure 9.
Conceptual framework suggesting different relative gas permeability due to changes in hydrate morphology from grain coating (near injection well) to pore filling (away from the injection well) caused by the difference in residual water saturation.
Figure 9.
Conceptual framework suggesting different relative gas permeability due to changes in hydrate morphology from grain coating (near injection well) to pore filling (away from the injection well) caused by the difference in residual water saturation.

Figure 10.
Total gas uptake due to changes in the sand (Sand A and Sand B) for different CO2 concentrations of feed gas (Gas A and Gas B) in the presence of different chemicals from Table 3.
Figure 10.
Total gas uptake due to changes in the sand (Sand A and Sand B) for different CO2 concentrations of feed gas (Gas A and Gas B) in the presence of different chemicals from Table 3.
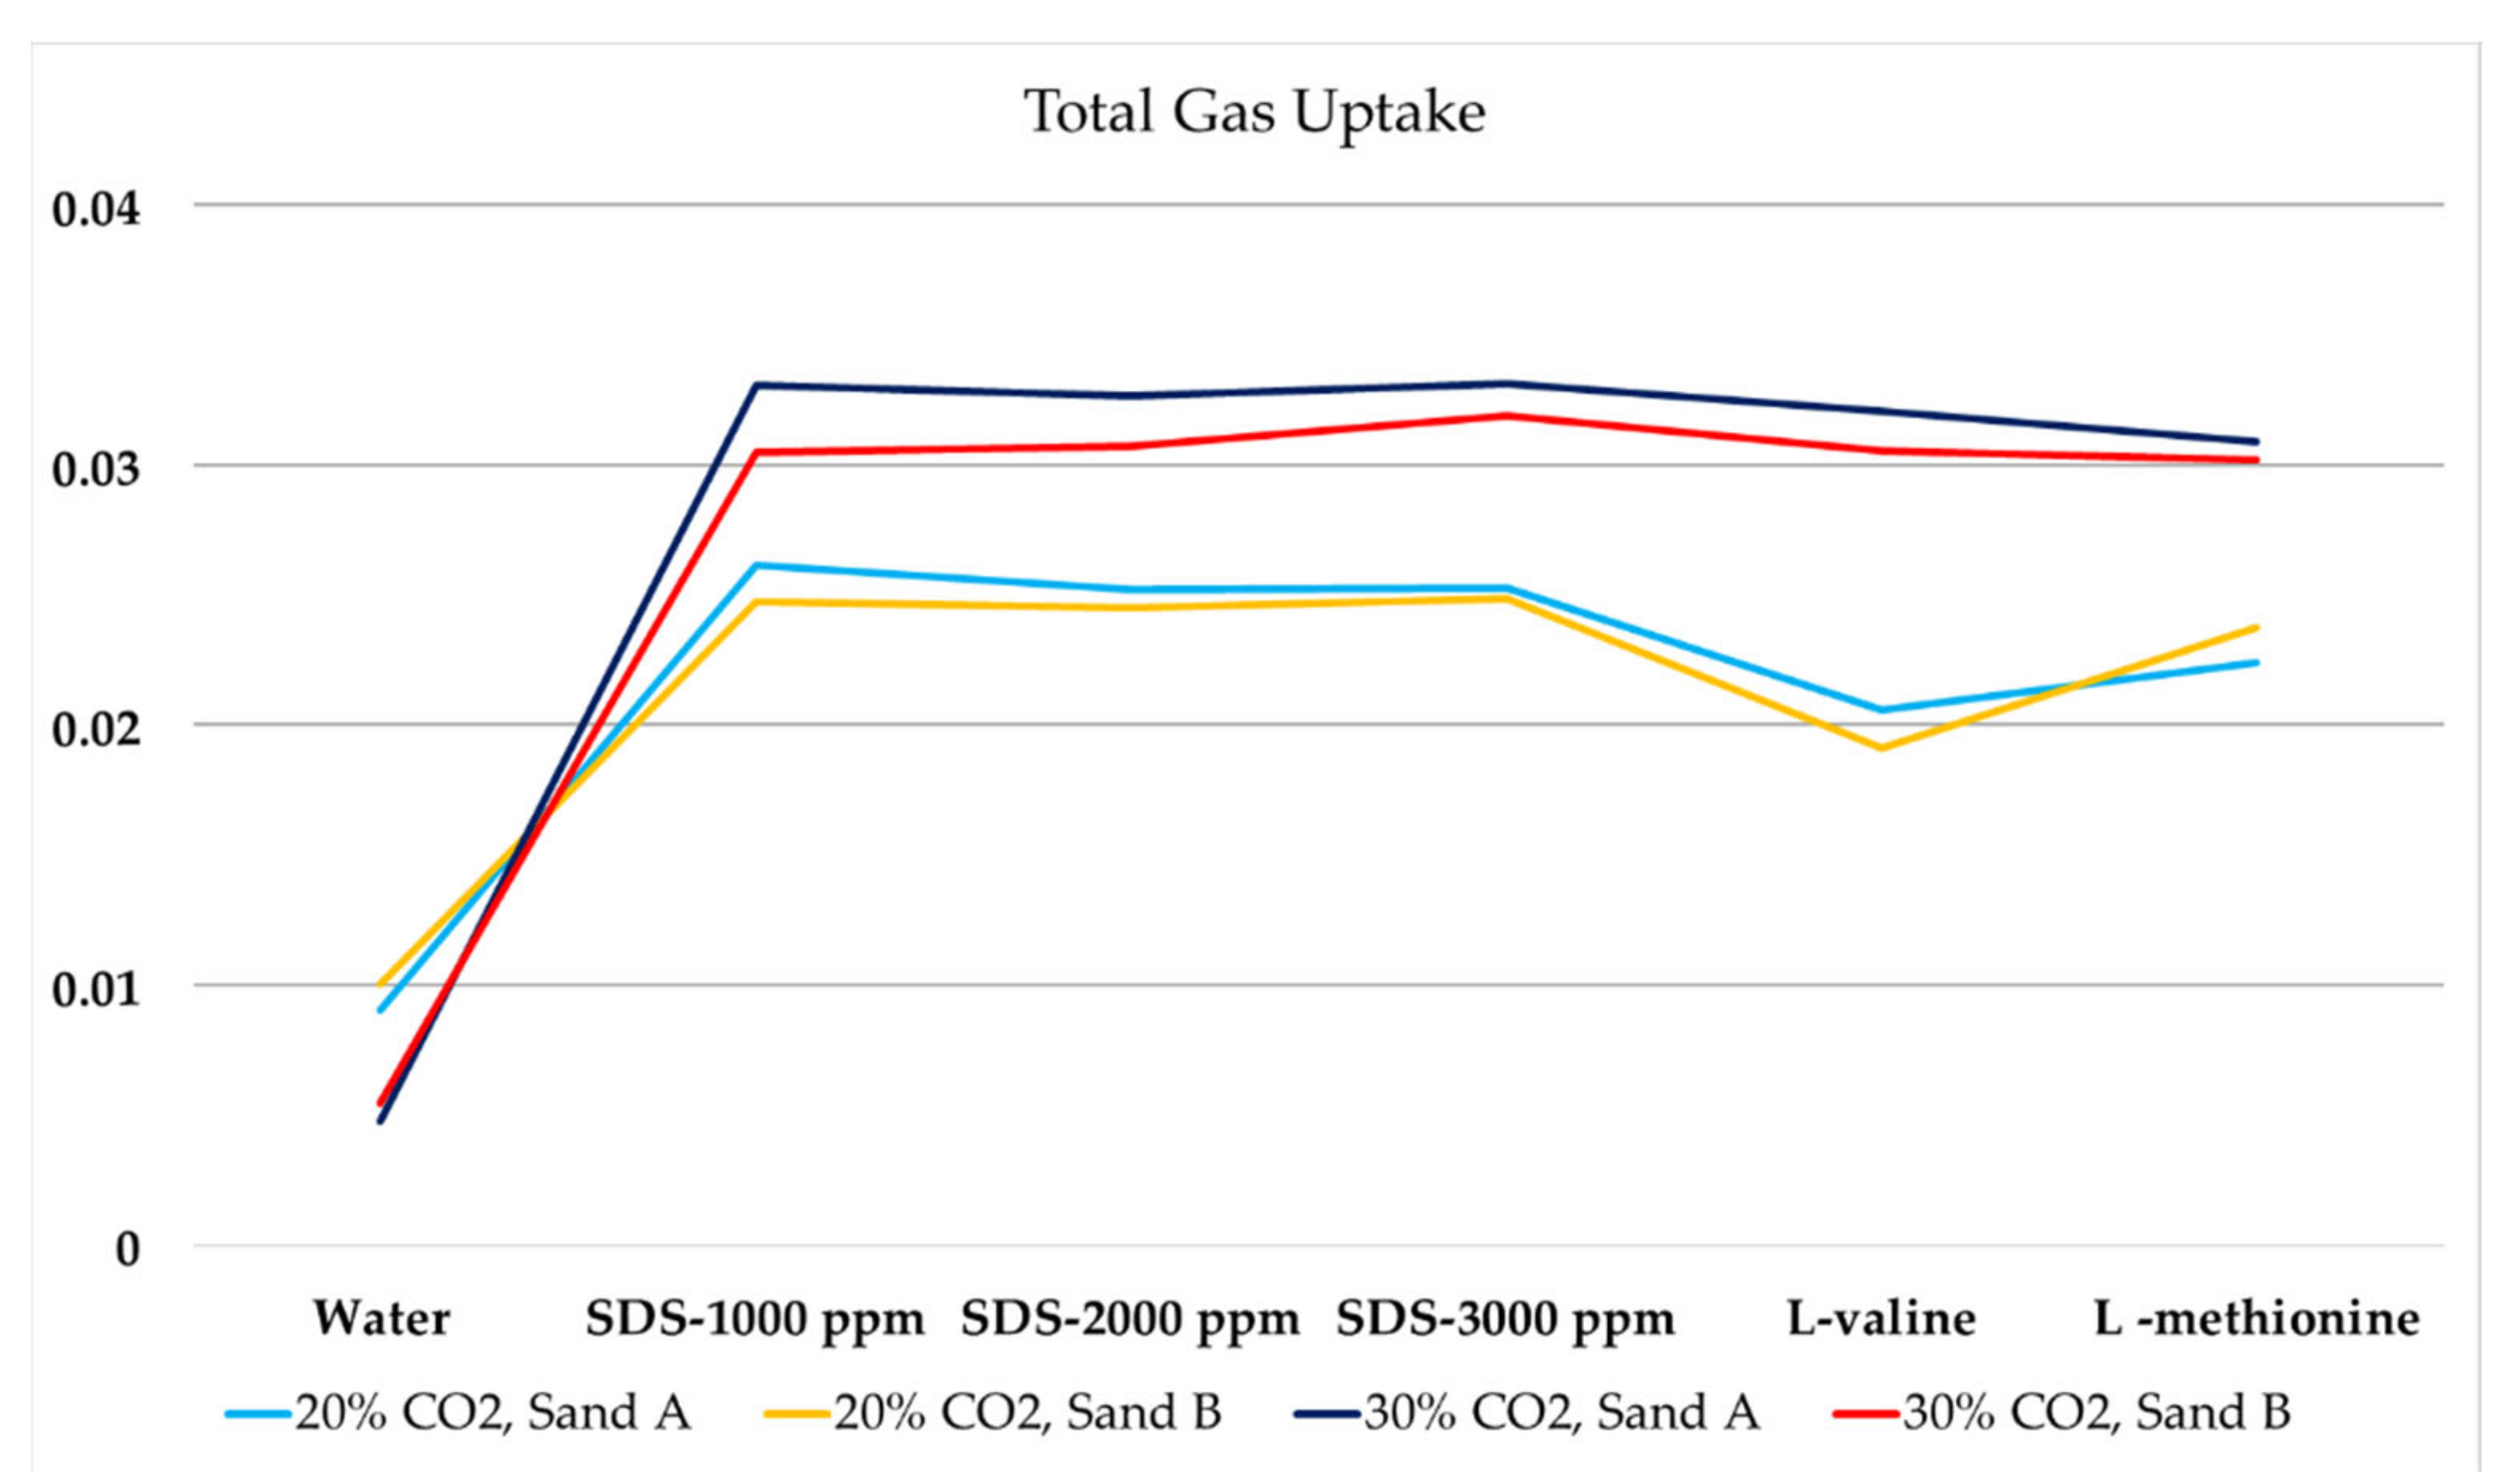
Figure 11.
Concentration of feed gas (Gas A and Gas B) in the presence of different SDS and hydrophobic amino acids from Table 3.
Figure 11.
Concentration of feed gas (Gas A and Gas B) in the presence of different SDS and hydrophobic amino acids from Table 3.

Figure 12.
The difference in silica sand and silica gel due to the difference in pore volume and specific area that controls the gas uptake [92].
Figure 12.
The difference in silica sand and silica gel due to the difference in pore volume and specific area that controls the gas uptake [92].

Figure 13.
CO2 split fraction analysis due to change in the sand (Sand A and Sand B) for different CO2 concentrations in feed gas (Gas A and Gas B) in the presence of different chemicals from Table 4.
Figure 13.
CO2 split fraction analysis due to change in the sand (Sand A and Sand B) for different CO2 concentrations in feed gas (Gas A and Gas B) in the presence of different chemicals from Table 4.

Figure 14.
CO2 recovery in two different studies. Case A, when CO2-rich gas is injected in porous medium and in the presence of promoter. Case B, when CO2 is gas injected into methane hydrate reservoir.
Figure 14.
CO2 recovery in two different studies. Case A, when CO2-rich gas is injected in porous medium and in the presence of promoter. Case B, when CO2 is gas injected into methane hydrate reservoir.


Table 1.
Variation in nucleation temperature (To) and subcooling (ΔTsub) in the presence of Sand B and Gas B in the presence of different chemicals. Amino acid concentration is 3000 ppm. SDS is denoted with a number representing the concentration in ppm.
Table 1.
Variation in nucleation temperature (To) and subcooling (ΔTsub) in the presence of Sand B and Gas B in the presence of different chemicals. Amino acid concentration is 3000 ppm. SDS is denoted with a number representing the concentration in ppm.
| To (°C) | ΔTsub (°C) | ΔTsub, op (°C) | |
|---|---|---|---|
| L-Valine | 2.5 | 5.82 | 1.5 |
| L-Methionine | 2.6 | 5.72 | 1.6 |
| L-Histidine | 2.2 | 6.12 | 1.2 |
| L-Arginine | 1.9 | 6.42 | 0.9 |
| SDS-500 | 3.9 | 4.42 | 2.9 |
| SDS-1000 | 4.4 | 3.92 | 3.4 |
| SDS-2000 | 4.5 | 3.82 | 3.5 |
| SDS-3000 | 5.6 | 2.72 | 4.6 |
Table 2.
Effect of CO2 concentration on induction time, which is measured for amino acids (3000 ppm) and SDS (variable concentration), using two different sediments with different particle sizes. Initial pressure and temperature conditions are 120 bar and 1 °C (N/A = no formation). No Sharp drop was observed in the case of water.
| Induction Time (to) (in Mins) | |||||
|---|---|---|---|---|---|
| 20 mol% CO2 and 80 mol% N2 | 30 mol% CO2 and 70 mol% N2 | ||||
| Component | Description | Sand A | Sand B | Sand A | Sand B |
| Amino Acid | Valine | 114 | 115 | 80 | 37 |
| Methionine | 156 | 58 | 157 | 15 | |
| Histidine | N/A | N/A | N/A | N/A | |
| Arginine | N/A | N/A | N/A | N/A | |
| SDS | SDS-500 | 243 | N/A | N/A | N/A |
| SDS-1000 | 125 | 14 | 170 | 49 | |
| SDS-2000 | 114 | 10 | 120 | 32 | |
| SDS-3000 | 89 | 7 | 89 | 9 | |
Table 3.
Total gas uptake and CO2 gas uptake calculations for different sands for 20 mol% CO2 in N2 (fresh run) and 30 mol% CO2 in N2 (fresh run). Initial conditions correspond to Pi = 120 bar and Top = 1 °C. GC analysis was performed after the fresh runs to quantify the moles of CO2 and N2 left in the gas phase after hydrate formed. Peq is calculated at identical pressure and temperature (P–T) conditions for the pure water case and different CO2 concentrations in feed gas using CSMGem software.
| Peq (Gas A) | 56.84 | (bars) | Pi-Peq (Gas A) | 63.16 | (bar) | ||
| Pi | 120 (bars) | Peq (Gas B) | 41.45 | (bar) | Pi-Peq (Gas B) | 78.55 | (bar) |
| 0.11 | ΔP (bar) | Δfeedgas × 10−3 | ΔCO2 × 10−3 | ΔP(bar) | Δfeedgas × 10−3 | ΔCO2 × 10−3 | |
| For Gas A | 20% CO2-Sand A | 20% CO2-Sand B | |||||
| Water | 4.1 | 9.04 | 9.01 | 4.7 | 10.2 | 10.0 | |
| SDS-500 | 20.2 | 23.8 | 14.1 | 7.2 | 10.6 | 9.03 | |
| SDS-1000 | 20.8 | 26.1 | 18.9 | 21.1 | 24.7 | 14.6 | |
| SDS-2000 | 20.6 | 25.2 | 16.8 | 20.9 | 24.5 | 14.3 | |
| SDS-3000 | 21.0 | 25.3 | 16.2 | 20.8 | 24.9 | 15.5 | |
| Valine | 16.9 | 20.6 | 13.1 | 15.1 | 19.1 | 13.3 | |
| Methionine | 18.7 | 22.4 | 13.9 | 20.0 | 23.7 | 14.3 | |
| Histidine | 4.6 | 7.55 | 7.36 | 4.3 | 7.62 | 7.52 | |
| Arginine | 4.9 | 7.74 | 7.33 | 5.2 | 8.31 | 7.89 | |
| 30% CO2-Sand A | 30% CO2-Sand B | ||||||
| Water | 5.2 | 4.77 | 4.71 | 4.8 | 5.49 | 5.31 | |
| SDS-500 | 3.7 | 13.2 | 11.1 | 6.3 | 3.75 | 3.45 | |
| SDS-1000 | 27.8 | 33.0 | 23.7 | 29.0 | 30.5 | 23.3 | |
| SDS-2000 | 28.9 | 32.6 | 29.1 | 28.9 | 30.7 | 23.9 | |
| SDS-3000 | 28.7 | 33.1 | 31.1 | 29.3 | 31.9 | 26.2 | |
| Valine | 26.9 | 32.1 | 31.5 | 28.4 | 30.5 | 24.7 | |
| Methionine | 27.0 | 30.9 | 28.9 | 27.3 | 30.2 | 26.2 | |
| Histidine | 3.8 | 12.4 | 10.2 | 5.5 | 7.6 | 7.19 | |
| Arginine | 6.7 | 8.5 | 7.9 | 6.0 | 9.9 | 8.2 | |
Table 4.
Details of CO2 split fraction calculated in the presence of amino acids and SDS for given sands (Sand A and Sand B) and given CO2 concentrations (20% and 30%) in the incoming feed gas. Selected amino acids are of 3000 ppm concentration.
Table 4.
Details of CO2 split fraction calculated in the presence of amino acids and SDS for given sands (Sand A and Sand B) and given CO2 concentrations (20% and 30%) in the incoming feed gas. Selected amino acids are of 3000 ppm concentration.
| Additive | 20% CO2, Sand A | 20% CO2, Sand B | 30% CO2, Sand A | 30% CO2, Sand B |
|---|---|---|---|---|
| None | 0.50 | 0.55 | 0.37 | 0.43 |
| SDS, 500 ppm | 0.65 | 0.41 | 0.35 | 0.26 |
| SDS, 1000 ppm | 0.85 | 0.65 | 0.58 | 0.73 |
| SDS, 2000 ppm | 0.77 | 0.65 | 0.88 | 0.75 |
| SDS, 3000 ppm | 0.73 | 0.69 | 0.93 | 0.76 |
| Valine | 0.59 | 0.59 | 0.93 | 0.76 |
| Methionine | 0.64 | 0.65 | 0.88 | 0.78 |
Publisher’s Note: MDPI stays neutral with regard to jurisdictional claims in published maps and institutional affiliations. |
© 2020 by the authors. Licensee MDPI, Basel, Switzerland. This article is an open access article distributed under the terms and conditions of the Creative Commons Attribution (CC BY) license (http://creativecommons.org/licenses/by/4.0/).
Share and Cite
MDPI and ACS Style
Pandey, J.S.; Daas, Y.J.; Karcz, A.P.; von Solms, N. Enhanced Hydrate-Based Geological CO2 Capture and Sequestration as a Mitigation Strategy to Address Climate Change. Energies 2020, 13, 5661. https://doi.org/10.3390/en13215661
AMA Style
Pandey JS, Daas YJ, Karcz AP, von Solms N. Enhanced Hydrate-Based Geological CO2 Capture and Sequestration as a Mitigation Strategy to Address Climate Change. Energies. 2020; 13(21):5661. https://doi.org/10.3390/en13215661
Chicago/Turabian StylePandey, Jyoti Shanker, Yousef Jouljamal Daas, Adam Paul Karcz, and Nicolas von Solms. 2020. "Enhanced Hydrate-Based Geological CO2 Capture and Sequestration as a Mitigation Strategy to Address Climate Change" Energies 13, no. 21: 5661. https://doi.org/10.3390/en13215661
Note that from the first issue of 2016, this journal uses article numbers instead of page numbers. See further details here.