Abstract
A series of impact compression tests were conducted to study the breakage characteristics of magnetite, as well as the impact pressure on its strain rate and dynamic compressive strength. The dynamic mechanical properties and fragmentation size distribution of magnetite under diverse impact loads and cyclic impact were investigated, with fractal theory as a basis and split Hopkinson pressure bar (SHPB). Breakage methods were also employed to analyze the fracture morphology of magnetite. According to the result, the fractal dimension can reflect the distribution of fragments in various sizes. If the strain rate increases, the fractal dimension will be larger, the fragment size will be finer, and the fragmentation degree will be more influential. A micro-analysis of SEM images demonstrates that the fracture morphology is determined by mineral properties. Under low load cyclic impact, intergranular fracture is the main fractography. Besides, the intergranular fracture will be changed to a transgranular one as the impact load increases.
1. Introduction
Minerals breakage, which is indispensable for the mining industry, helps mineral liberation and subsequent separation [1]. It also has bearings on the breaking performance of the mechanical and beneficiation process [2]. Rock breakage is by far the largest energy consumer in the mining industry, accounting for 75% of energy consumption in beneficiation operations [3]. However, only 3% to 8% of the energy can be used for breakage, resulting in huge energy waste [4,5]. What’s more, given the significant role of crushing and grinding rock fragmentation in sorting operations, the appropriate fragmentation size distribution has been an unresolved issue for beneficiation workers [6,7].
The statistics show that impact crushing is currently the primary method of crushing magnetite [8]. Therefore, an understanding of the breakage process, including its physical mechanism and optimization, helps related industries to improve productivity, reduce cost and save energy [3]. The aim of magnetite breakage performed before separation is mineral liberation. At the concentration stage, an ideal separation of valuable minerals from the gangue requires ideal size reduction. Fragmentation breakage with different load impacts significantly affects minerals breakage, including in the milling process and in the mining industry. Additional impacts, even at low speed, may cause further fragmentation [9]. For example, during ball mill grinding, mineral fragments that collide with steel balls of different sizes and diameters, with high frequency and low energy, will be broken.
Rock breakage processes can be described as the relationship between energy input and the relative progeny size of materials. For many years, drop weight testing has been used to characterize materials for crusher and mill modeling [10]. The tests mentioned were first designed to decouple the specific properties of materials from those of machines, which are normally combined in the crushing and grinding tests in standard laboratories [11]. There are widely used mathematical models that simulate the relationship between material size reduction and fracture energies during the crushing process [12]. Besides, the relation between energy and fragmentation size distribution in the mineral industry has attracted much attention. However, studies on the dynamic mechanical characteristics of magnetite under low energy repeated impacts are rare [13]. Studies have shown that if the size of the grinding medium increases, the impact force of the ball mill will be greater during the grinding process. As a result, the degree of fragmentation breakage will be high under a high strain rate [14].
Strain rate is an essential mechanical parameter for the dynamic fragmentation of rocks, which was conducted mainly under a low strain rate. This means that the impact load at a high strain rate has been less commonly studied. Split Hopkinson pressure bar (SHPB), a reliable high strain rate loading technique, measures the dynamic properties of rocks at high strain rates (10–104/s) [15]. Many have adopted this technique to quantify the dynamic compressive responses of rock materials with high loading or strain rates. However, few studies have been conducted on rock masses subjected to repetitive dynamic loading [16]. Some scholars have analyzed the influence of microstructure and mineral composition on the micromechanical properties by scanning electron microscopy [17]. M. Ghamgosar et al. [18,19] proved that the particles produced under cyclic load crushing are much larger than those produced under static load. Under cyclic load, most of the particles exhibit intergranular fractures. X. F. Li et al. [20] studied the dynamic fracture patterns and damage evolution of rock materials, and revealed that the propagation of microcracks leads to intergranular and transgranular fractures, and their different macro-failure characteristics.
Thus, this paper studies the dynamic mechanical, fragmentation size distribution and fracture morphology characteristics of magnetite under high- and low-load cyclic impact. In practical engineering, the crushing system of magnetite may be under various impact forces, which results in a high energy consumption and low efficiency. This study is important in both theory and practice because it not only guides engineering practice, reducing unnecessary energy consumption, but it also helps the understanding of magnetite dynamics.
2. Test Material and SHPB Device
2.1. Magnetite Materials
The magnetite material employed has a coarse-particle structure, and is commonly found in Wuyang, Henan, China. Optical microscopy and X-ray diffraction were also conducted for microscopic studies to clearly show the mineralogical composition, and their results are shown in Figure 1. The analysis shows that the magnetites are simple in type, with metallic minerals of mainly magnetite, while the veins of the stone minerals are mainly serpentine and chlorite. Raw magnetite with size ranges from 0.3 mm to 0.6 mm is chosen for mineralogical characterization using MLA (mineral liberation analyzer). Among these, valuable iron oxide minerals account for about 47.71%. The remaining 52.29% are gangue phases, which are mainly composed of silicate minerals. Figure 2, which shows the image of minerals fragmentation, further proves that the ore consists of magnetite, serpentine and chlorite.

Figure 1.
X-ray diffraction (XRD) spectrum of sample.
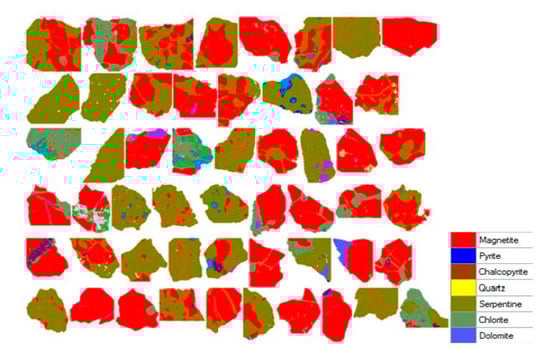
Figure 2.
MLA image of the magnetite sample.
The magnetite was processed into cylindrical samples with a diameter of 50 mm and a length/diameter ratio of 0.5 based on the mechanical testing procedures of rock dynamic proposed by ISRM [21]. All the samples were carefully polished to keep surface roughness under 0.02 mm. Besides this, the end surface perpendicular of their axes was less than 0.02 rad.
2.2. Split Hopkinson Pressure Bar System
The test was carried out on the SHPB horizontal impact test platform with a rod diameter of 50 mm at China University of Mining and Technology, and a horizontal impact compression test was carried out with different air pressures. The SHPB test device included an impact warhead, an impact rod, a dynamic strain gauge, an oscilloscope and a data acquisition system [22]. The elastic modulus of the steel bar of the system was 200 GPa, the longitudinal wave velocity was 5160 m/s, and the lengths of the incident rod and transmission rod were 4000 mm and 2000 mm, respectively. The bullet was 500 mm in length and 50 mm in diameter. A rubber sheet, 10 mm in diameter and 2 mm in thickness, was adopted as a shaper to improve the shape of the incident wave and realize constant strain rate loading as much as possible. The strain wave on the rod was collected by a semiconductor strain gauge with a sensitivity of 100, and the driving air pressure was fixed at 0.10 MPa during the test. The strain rate of the magnetite sample between the incident rod and the transmission rod was changed by controlling the gas pressure to change the launching speed of the impact warhead. The incident rod was equipped with a variable cross-section. The speed of impact of the warhead was obtained by the electronic counter, and the dynamic strain was obtained by the data acquisition device. Figure 3 showcases the structure of the test device. The energy of the gas gun came from the high-pressure nitrogen cylinder, and the impact air pressure could be adjusted according to the test requirements.

Figure 3.
The SHPB test system and loading mode.
According to the SHPB experiment, the sample was placed between the incident and transmission rod. Both ends of the sample were coated with Vaseline to reduce its friction with the ends of the rods. Furthermore, the shapers were put into the impact warhead and the end of the incident rod to ensure uniform stress wave transmission under the high strain rate loading. The pressure of the highly compressed gas was 0.2–0.6 MPa in the test.
2.3. Test Principle
The impact crushing test of magnetite in SHPB was realized through the following process: driven by high-pressure gas, the punch collides with an incident rod to form an incident pulse. The SHPB impact crushing test is done to change the strain rate of the magnetite samples between the incident rod and the transfer rod by controlling the gas pressure and the launching speed. When the incident pulse reaches both ends of the sample, the stress pulse is reflected and transmitted multiple times, resulting in the high-speed deformation of the sample. At the same time, the other pulse is transmitted to the incident rod through the sample, which generates a reflected pulse signal and a transmitted pulse signal, respectively. All signals are collected in the signal acquisition system thanks to the strain gauge on the elastic compression bar. After the test, the mechanical characteristic curve and corresponding parameters of the sample can be obtained by further calculating the stress wave signal in the incident and transmission rods [23].
According to the principle of the SHPB test system, it is measured that, at the contact point between the sample and the incident rod, the stress and velocity are and , respectively, while those between the sample and transmission rod are and , respectively. A dynamic shock signal can be obtained by arranging the strain gauge on the incident and transmitted rods, so the average stress , strain rate , and strain can be calculated as [22]:
where , and stand for incident stress pulse, reflected stress pulse, and transmitted stress pulse. A, As and ls are the cross section of the incident rod, and the cross section and the length of the magnetite, respectively. E is the elastic modulus. It is assumed that when the internal stress of the specimen reaches equilibrium during the impact, the following conditions are met:
Then formula (1) can be converted into:
where C0 and E are the transfer velocity of the stress wave in the incident rod and the elastic modulus of the incident rod, respectively.
According to the law of the conservation of energy, the energy in the impact process can be calculated as follows:
where , , , and are the incident energy, the reflection energy, the transmission energy, the absorption energy and the energy consumption per unit volume of the sample, while is the impact rod density and is the volume of the sample.
2.4. Experiment Design
The split Hopkinson bar (SHPB) device was employed to study the dynamic mechanical and breakage properties of magnetite under an impact load. The standard sieve was used to screen and classify the broken magnetite so as to gain fragmentation distribution curves, and the microstructure of the fracture surface of the samples was observed via energy dispersive spectrometer (EDS) and scanning electron microscopy (SEM).
To study the effect of cyclic impact load on the breakage characteristics of magnetite, a Hopkinson pressure bar was used to impact the magnetite samples four times, with air pressure at 0.2 MPa each time. The samples, which were unbroken, were subjected to 0.5 MPa impact air pressure to obtain the magnetite fragmentation distribution curve and fracture morphology.
3. Experimental Results and Analysis
3.1. Impact Gas Pressure and Incident Energy
Figure 4 shows the relationship between the incident energy of the magnetite test block and the impact pressure. It can be seen that the incident energy achieved by the incident rod is proportional to the impact pressure. The curve fitting shows that incident energy and impact pressure enjoy a positive linear correlation. The relation is y = 969.308x − 170.05, and the correlation coefficient R2 is = 98.38. Therefore, the impact pressure can be adjusted to control the transfer of incident energy into magnetite.
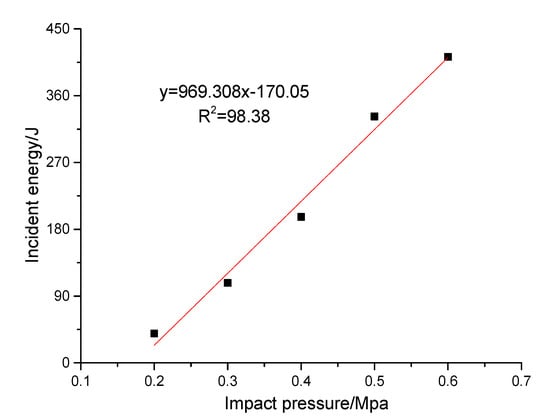
Figure 4.
Relationship between incident energy and impacting pressure of magnetite.
The velocity of the impact rod under different impact loads was measured by a velocimeter, and the test data were processed via Equation (4). The strain rate of the magnetite samples was obtained under different impact loads, and the calculation results are shown in Figure 5. The average strain rate refers to the numerical average of all strain rates during magnetite crushing. As the impact pressure increased, both the initial velocity of the impact warhead and the incident energy were higher. Therefore, the energy consumed for magnetite breakage and the average strain rate increase during impact collision.

Figure 5.
Relationship between average strain rate and impacting pressure of magnetite.
3.2. The Stress-Strain Curves of Magnetite under Different Strain Rates
Figure 6 shows the variation rule of magnetite stress and strain under different strain rates. According to the static impact test of the standard magnetite sample, the impact process includes three stages, as follows: (OA) the initial deformation stage, (AB) the elastic deformation stage, and (BC) the magnetite crushing stage. The figure also reveals that the stress–strain characteristics of magnetite under a high strain rate are different, which can be divided into three stages. The first is the elastic deformation stage, in which the contact between the warhead and magnetite sample causes the stress–strain curve to rise in a nearly straight line. The next is the crack formation stage, in which the crack appears and deepens with the increase in the internal stress of the magnetite until the crack initiation stress is reached. The last is the breaking stage, at which the stress–strain curve rises significantly until it reaches the peak stress, leading to the breakage of the magnetite sample. Since magnetite is a natural heterogeneous material, there are many open micro-cracks in the sample. The dynamic elastic modulus of magnetite increases with the increase of stress due to the gradual closure of the cracks under low stress. When the stress rises to a certain degree, the stress–strain curve shows a specific range of elastic growth.
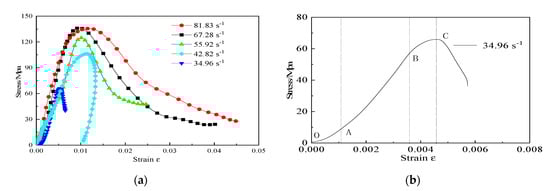
Figure 6.
The failure characteristics of magnetite ore based on dynamic load. (a) dynamic stress–strain curves of difference strain rates; (b) stress–strain curves of strain rates at 34.96 s−1.
3.3. Fragmentation Distribution Analysis
The weight of crushed magnetite was measured to analyze the block distribution of magnetite under impact load. Sieves with apertures of 19 mm, 13.2 mm, 9.5 mm, 6.7 mm, 4.75 mm, 3.35 mm, 2.5 mm, 1.70 mm, 1.18 mm, 0.90 mm, 0.60 mm, 0.45 mm, 0.30 mm, 0.15 mm and 0.075 mm were arranged vertically, according to pore size from small to large, and placed on the screening machine to sieve the crushed magnetite under different impact loads. The mass after each screening was weighed, and the screening results are shown in Figure 7.
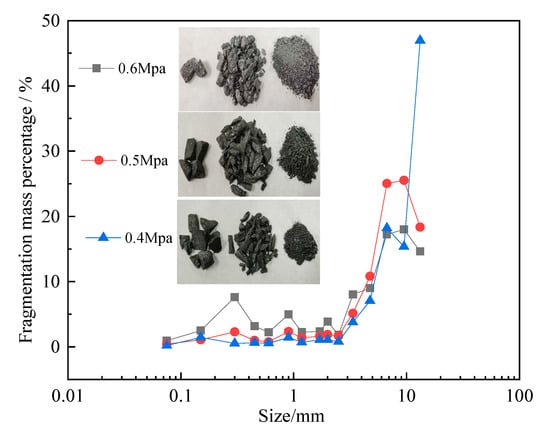
Figure 7.
Fragmentation size distribution of magnetite samples for various impact pressures.
The crushing theory holds that the crushing characteristics of magnetite are strongly linked with stress. A high strain rate affects the crack propagation inside the magnetite. The fragmentation size distribution of the magnetite sample under different impact pressures was analyzed to clarify its crushing characteristics under different strain rates. The greater the impact pressure, the higher the crushing degree of the magnetite sample. When the impact pressure was 0.3 MPa, the magnetite sample located in the impacted position was broken, producing a small amount of coarse-grade fragments. The magnetite sample broke into several small fragments and a small number of fine fragments when the impact of the gas pressure was 0.4 MPa. When the impact pressure was 0.5–0.6 MPa, the fragments were further broken, and the content of fine fragmentation increased, appearing in the shapes of small needles.
Figure 7 shows the cumulative distribution of the magnetite samples under different pressures under the screen. The crushed product of the magnetite sample was coarse when the impact pressure was 0.4 MPa, and it was further broken when the impact pressure was 0.5 MPa. The internal cracks expanded rapidly and the content of fine fragmentation increased when the impact pressure was 0.6 MPa. The cumulative distribution diagram of crushed fragmentation size shows that, during the crushing process, as the impact pressure increased, the force became higher, and the fragmentation of the crushed product became finer.
3.4. Fractal Dimension of Fragmentation Size Distribution
It is well known that fragmentation sizes of broken materials vary. However, research shows that the fragmentation size still follows certain principles. As for the microscopic perspective, small fractures originating from finer cracks aggregate and fragment the particle. The same is true for fragmentation size after crushing. According to the quality fractal model of the fragments distribution, the fractal dimension D can be obtained from the quality–frequency relationship of the screening test, and the equation is [24]:
In the formula, D is the fractal dimension, is the sieve mesh (mm), is the cumulative yield less than (%), and is the maximum particle size (mm). The larger D is, the higher the number of fragments that are formed. The fractal dimension can also be an indicator to measure the degree of fragmentation and the size of fragmentation. Later, the fragments of the magnetite sample after the impact tests were collected and counted with a standard sieve. The fractal dimensions of the fragments from the destruction experiment are calculated via formula (5).
When the energy absorbed by the magnetite test piece is low, internal microcracks will accumulate, expand, and penetrate. The microcracks, connected through the crystal interface, will break into larger, uniform cracks with a finer crushing coefficient, so the fractal dimension is small. On the other hand, more energy absorbed by the magnetite test piece leads to greater microcrack propagation and connection. The microcracks evolve into uniform fractures of finer size through crystal accumulation, propagation and connection, so the fractal dimension is large. The correlation of the regression linear function formula shows that the fractal dimensions of the fragmentation size of magnetite after crushing are regular and similar to those above-mentioned. Figure 8 indicates that the proportion of fine fragments, the fracture of the magnetite test piece, and the fractal dimensions of the fragments increase with the increases in strain rate and impact load. The fractal dimension, D, grows logarithmically with the increases in impact pressure and strain rate. That is, the higher the degree of crushing, the greater the impact load that is required.
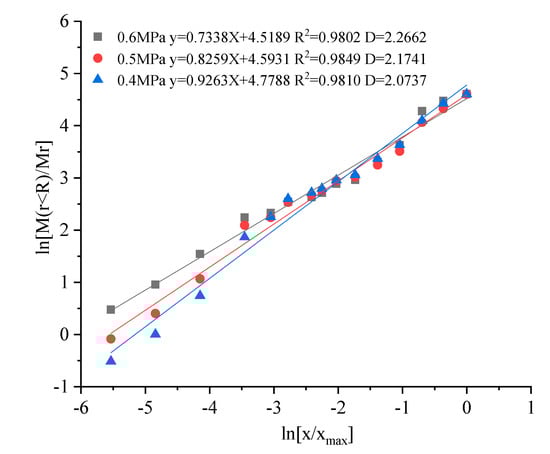
Figure 8.
Fractal dimension calculated by granularity mass.
3.5. Size Distribution and Impact Energy Consumption
The energy absorbed by the sample during the impact test of the magnetite sample using the SHPB test device can be calculated by the following formula:
where , and are the incident, reflected, and transmitted energy, respectively. The energy absorbed by the rock sample is mainly converted into energy consumption, such as crushing energy consumption and ejection kinetic energy. Among these, the former accounts for approximately 95% of the total absorbed energy [25]. Therefore, the absorption energy approximately offsets the impact energy consumption of the sample, and the research results are not greatly affected.
The relationship between the crushing block average fragmentation size of the magnetite specimen and the crushing energy dissipation density is demonstrated in Figure 9. It shows that the fractal dimension of the fragmentation size distribution for the crushed magnetite specimen under impact increases with the increase in absorbed energy. The fitting relationship is y = 0.0023x + 2.0145, and the correlation coefficient is R2 = 0.969. This is because the energy consumption of crushing is mainly reflected by the stress wave in magnetite. The greater the crushing energy density is, the greater the stress wave energy for crushing absorption becomes. When the energy is large enough, it will cause prompt original cracks in the magnetite, and bring about new cracks and expansions until a fracture takes place, resulting in a new fracture surfaces and finer-scale fragments. Therefore, the finer the fragmentation degree of the rock specimen is, the larger the unit volume surface area, and the greater the energy that needs to be absorbed, will become.
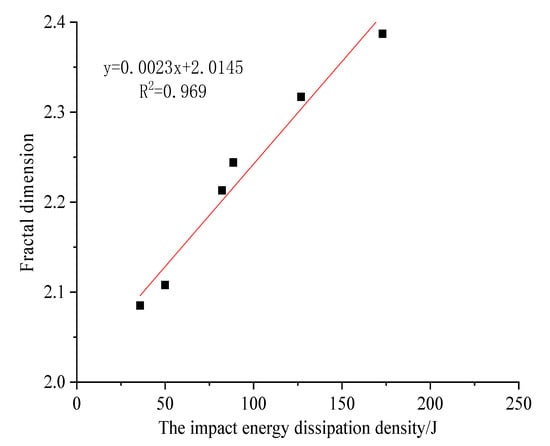
Figure 9.
Relation between average fragmentation size and broken energy of magnetite specimen.
3.6. Breakage Characteristics of Magnetite Impact under Cyclic Impact Load
The failure of a single impact magnetite sample falls into two camps. The first is that when the impact speed is low, the loading amplitude, though small, exceeds the load capacity of the test piece, resulting in crushing damage on the test piece. In this case, the fragments are relatively large. The other case is that when the impact speed is high, the loading amplitude is large, which far exceeds the limit load capacity, resulting in crushing damage on the test piece. The fragments then are relatively small, and some of them turn into extremely fine powder. During the operation of the ball mill, the ball will repeatedly impact the magnetite. The Hopkinson pressure bar is employed for cyclic impact crushing experiments with magnetite. Thanks to the incident wave, the reflected wave, and transmitted wave signals, the dynamic stress-strain curve of the specimen under various impact loads can be obtained. Figure 10 shows the stress-strain curves of the magnetite sample under many impacts of 0.2 MPa, and one impact of 0.5 MPa.
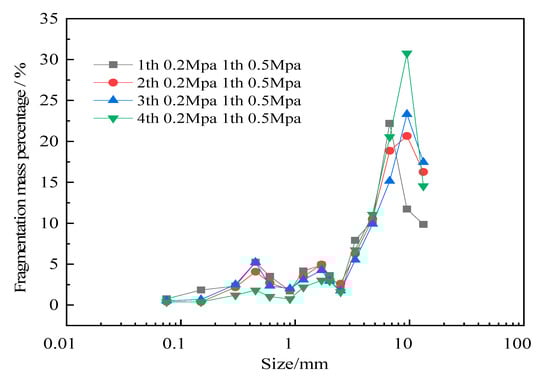
Figure 10.
Fragmentation size distribution of magnetite samples for various impact pressures.
Figure 11 shows that with the increase in impact, the stress-strain curve and dynamic peak stress of the sample decrease, which is due to the magnetite’s heterogeneity and the cumulative damage caused by the impact loading. When the shock stress wave passes through the magnetite sample and its amplitude and duration exceed a certain threshold, the concentration of tip stress causes some of the randomly distributed micro-cracks inside the rock sample to expand at a low speed until a fracture appears. This results in a decrease in the ability and efficiency of load transfer between magnetite fabrics. Macroscopically, the heterogeneity of the dynamic performance of the rock samples will be more evident as the number of impacts increases. According to Figure 10, the stress–strain curve of magnetite rises linearly at the initial stage, and the slope is the same, which proves that the elastic modulus of the specimen was roughly the same during the cumulative damage process. As the number of dynamic load cycles mounted, the slope of the tangent of the stress–strain curve gradually decreased, the deformation resistance of the specimen weakened, and the mechanical properties continued to be damaged. This phenomenon indicates the decrease in elastic modulus and increase in strength at the yield stage. When the impact load is small, the internal microcracks are not tightly closed, and the rock wave impedance does not reach the maximum value. In contrast, a large impact load triggers new microcracks, which affects the rock’s ability to resist external impacts. The impact load of the high loading rate accelerates the deformation of the sample. At this time, the cracks inside the magnetite quickly expand and connect to form more small fragmentations until breakage. Figure 10 reveals that when the 0.5 MPa impact was exercised under the same pressure, the increase in the number of low-energy impacts resulted in a significant change in fragmentation size distribution after impact breakage. The greater the number of low-energy impacts, the greater the proportion of particle fragmentation.

Figure 11.
Dynamic stress-strain curves of cyclic impact load.
3.7. Microscopic Features of Magnetite Failure
The fracture failure of magnetite under different loads will result in different forms of fractography, which mainly rely on the multi-component mineral composition of magnetite, the loading magnitude, and the way of the external load. External load changes the microfracture morphology features of magnetite. SEM scanning analyses of the magnetite’s failure fracture after loading help to trace the magnetite fracture’s process and collect mechanism information for the magnetite fracture. The heterogeneity of magnetite, that is, the diversity of mineral fragmentation composition and the anisotropy of the mechanical properties of the mineral crystals, leads to the diversity and complexity of its microscopic morphology and mechanical mechanism. In this paper, the fractures in rock samples under high load impact and cyclic low load impact were scanned with an electron microscope to analyze the effects of different magnitude load impacts and cyclic load impact frequencies on the impact characteristics of magnetite. Among typical photos, scanning photos of fractures with different magnifications have been selected as representative microphotographs for two working conditions, as shown in Figure 12 and Figure 13.
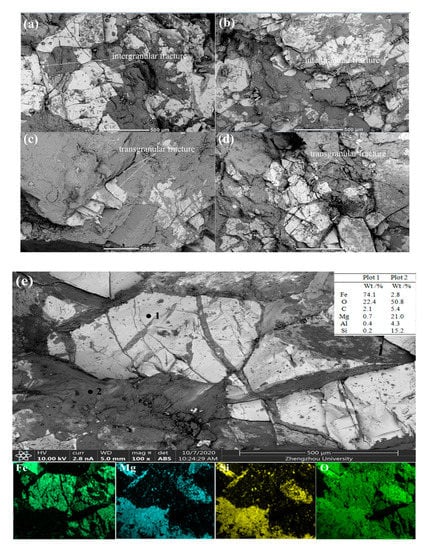
Figure 12.
Micro-properties of fracture morphology under high loadings: (a) 0.2 MPa impact pressure; (b) 0.3 MPa impact pressure; (c) 0.4 MPa impact pressure; (d) 0.5 MPa impact pressure; (e) the chemical composition of the magnetite.
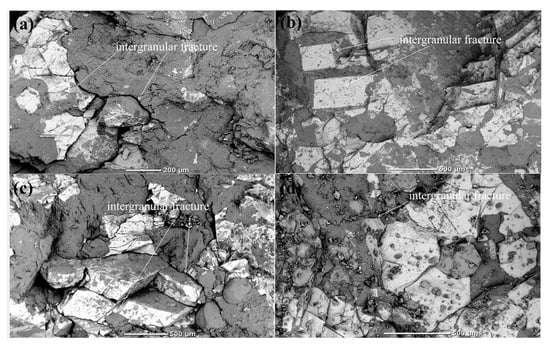
Figure 13.
Micro-properties of fracture morphology under cyclic loadings: (a) one 0.2 MPa impact, one 0.5 MPa impact; (b) two 0.2 MPa impacts, one 0.5 MPa impact; (c) three 0.2 MPa impacts, one 0.5 MPa impact; (d) four 0.2 MPa impacts, one 0.5 MPa impact.
Figure 12 shows that rock failure within the load range of 0.2 MPa to 0.6 MPa has typical brittle fracture characteristics. The main culprit is the rough surface with a transgranular fracture, and intergranular failure is rarely seen. Such a fracture morphology can be explained by the transgranular fracture’s damage to the crystal structure, and the energy required obviously exceeds that consumed by the intergranular fracture. The energy of the incident wave and the energy the magnetite absorbed under the impact loading is high. A trans-crystalline fracture occurs when the impact energy is greater than the strength of the magnetite’s own crystal, which leads to transgranular fractures. If the load increases, the transgranular fracture will be more evident, the intergranular crack size will increase, the fracture surface will be rougher, and the failure path will be more complex. More transgranular fractures result in the small fragmentation of magnetite, and magnetite debris on the fracture surface. The phenomenon is probably caused by the mass transgranular damage inside the magnetite under high impact loading, the more broken internal structure of magnetite, and the friction between the broken crystals, which leads to fatigue debris on the fracture surface.
Figure 13 shows that the particles on the failure surfaces of the samples became severely cracked as the number of low-cycle impacts increased, and typical sparkling cleavage cracking appeared in the minerals when the crystals broke along the cleavage planes. Most particles of the fracture surfaces under cyclic loading were crack-free. The particle boundaries had cracks almost along the entire length, and some cracked at small angles to the maximum stress direction. Generally, the observed damage mechanisms leading to the different mineral crack growths fall into two camps: (1) inter-granular cracks causing particle interface, and (2) inter-granular cracks that extend between particle boundaries and may transect the entire particle. The initiation and termination of intra-granular cracks occurs within a particle, while the intergranular cracks step over particle boundaries and are observed in specimens under low cyclic loading. The proportion of intergranular fractures increases with the number of low-cycle impacts. It is thought that the impact energy required for the cleaving of mineral particles is delicately balanced with the energy needed for the cracking of brittle particle boundaries. It seems that the extension of macrocracks hinges on there being sufficient damage density near the macrocrack tip. By comparing the morphology after high-energy impact crushing and the high-energy impact fracture after a low-energy cyclic impact, it is clear that the force application method and the size of the force load obviously differ in terms of the resulting mineral fracture. The value of micro-mechanical and mineralogical imaging is expounded for magnetite breakage methods featuring higher energy efficiencies.
4. Conclusions
The split Hopkinson pressure bar (SHPB) system and scanning electron microscopy (SEM) were applied in this paper to study the cyclic impact of a high load on the breakage character of Wuyang magnetite. The specific conclusions are as follows.
As the impact pressure increases, the fragment size of the magnetite sample continues to decrease, and the energy consumption density of the sample increases linearly along with the incident energy. The higher the energy density of the impact load is, the finer the fragmentation size becomes. The fragmentation size distribution of the magnetite impact products indicates that a similar impact fragmentation size distribution does not necessarily lead to the same energy utilization rate. Therefore, magnetite breakage characteristics must be explored based on energy.
If the energy is consistent, the dynamic peak stress of the magnetite sample and the elastic modulus decrease with the increase in cycle numbers. The rise in the number of cyclic impact loads leads to the gradual increase in the peak strength of the reflected wave and the continuous reduction in the peak strength of the transmitted wave, indicating that the resistance of the magnetite to external impact loads decreases gradually.
The fracture morphology of magnetite is mainly that of an intergranular fracture under low load cyclic impact. When the energy absorbed by magnetite is large enough to cause a fracture as the impact load increases, the intergranular fracture will change into a transgranular one.
Author Contributions
Data curation, G.F.; Methodology, Y.C.; Writing—original draft, L.S.; Writing—review and editing, Y.C. All authors have read and agreed to the published version of the manuscript.
Funding
This work was supported by the National nature science foundation of China (No. U1704252), National key research and development program (No. 2018YFC0604702), National key research and development program (No. 2018YFC1901601), National key research and development program (2018YFC1901601), Supported by Program for Innovative Research Team (in science and technology) in University of Henan Province (No:19IRTSTHN028).
Conflicts of Interest
The authors declare no conflict of interest.
References
- Mariano, R.A.; Evans, C.L.; Manlapig, E. Definition of random and non-random breakage in mineral liberation—A review. Miner. Eng. 2016, 94, 51–60. [Google Scholar] [CrossRef]
- Bonfils, B. Quantifying of impact breakage of cylindrical rock fragmentation on an impact load cell. Int. J. Miner. Process. 2017, 161, 1–6. [Google Scholar] [CrossRef]
- Tromans, D. Mineral comminution: Energy efficiency considerations. Miner. Eng. 2008, 21, 613–620. [Google Scholar] [CrossRef]
- Musa, F.; Morrison, R. A mmagnetite sustainable approach to assessing comminution efficiency. Miner. Eng. 2009, 22, 593–601. [Google Scholar] [CrossRef]
- Napier-Munn, T. Is progress in energy-efficient comminution doomed? Miner. Eng. 2015, 73, 1–6. [Google Scholar] [CrossRef]
- Jankovic, A.; Dundar, H.; Mehta, R. Relationships between comminution energy and product size for a magnetite magnetite. J. S. Afr. Inst. Min. Metall. 2010, 110, 141–146. [Google Scholar]
- Sudarshan, M. Size–energy relationship in comminution, incorporating scaling laws and heat. Int. J. Miner. Process. 2016, 153, 26–43. [Google Scholar]
- Faramarzi, F.; Jokovic, V.; Morrison, R.; Kanchibotla, S.S. Quantifying Variability of Magnetite Breakage by Impact—Implications for SAG Mill Performance. Miner. Eng. 2008, 127, 81–89. [Google Scholar] [CrossRef]
- Sun, H.; Zeng, Y.; Ren, S.; Ye, Y.; Chen, X. Breakage probability of marble spheres under normal, repeated impacts. Int. J. Impact Eng. 2019, 130, 68–78. [Google Scholar] [CrossRef]
- Awachie, S.E.A. Development of Crusher Models Using Laboratory Breakage Data. Ph.D. Thesis, University of Queensland (JKMRC), Brisbane, Australia, 1983. [Google Scholar]
- Tavares, L.M.; Silveira, M.A.W. Comparison of measures of rock crushability. In Fine Fragmentation Technology and Characterization; Yekeler, M., Ed.; Research Signpost: Kerala, India, 2008; pp. 1–20. [Google Scholar]
- Beinert, S.; Fragnière, G.; Schilde, C.; Kwade, A. Multiscale simulation of fine grinding and dispersing processes: Stressing probability, stressing energy and resultant breakage rate. Adv. Powder Technol. 2008, 29, 573–583. [Google Scholar] [CrossRef]
- Ouchterlony, F.; Sanchidrián, J.A.; Moser, P. Percentile fragment size predictions for blasted rock and the fragmentation–energy fan. Rock Mech. Rock Eng. 2017, 50, 751–779. [Google Scholar] [CrossRef]
- Saeidi, F.; Yahyaei, M.; Powell, M.; Tavares, L.M. Investigating the effect of applied strain rate in a single breakage event. Miner. Eng. 2017, 100, 211–222. [Google Scholar] [CrossRef]
- Xia, K.; Yao, W. Dynamic rock tests using split Hopkinson (Kolsky) bar system—A review. J. Rock Mech. Geotech. Eng. 2015, 7, 27–59. [Google Scholar] [CrossRef]
- Yan, C. Blasting cumulative damage effects of underground engineering rock mass based on sonic wave measurement. J. Cent. South Univ. Technol. 2007, 14, 230–235. [Google Scholar] [CrossRef]
- Zhang, M.; Ning, J.G.; Zhang, H.B.; Liu, X.S. Study on microscopic structure and mineral composition of shallow rock using SEM. Appl. Mech. Mater. 2013, 303–306, 2552–2558. [Google Scholar] [CrossRef]
- Ghamgosar, M.; Erarslan, N. Experimental and numerical studies on development of fracture process zone (FPZ) in rocks under cyclic and static loadings. Rock Mech. Rock Eng. 2016, 49, 893–908. [Google Scholar] [CrossRef]
- Erarslan, N.; Williamsd, J. The damage mechanism of rock fatigue and its relationship to the fracture toughness of rocks. Int. J. Rock Mech. Min. Sci. 2012, 56, 15–26. [Google Scholar] [CrossRef]
- Li, X.F.; Zhang, Q.B.; Li, H.B.; Zhao, J. Particle-Based Discrete Element Method (GB-DEM) Modelling of Multi-scale Fracturing in Rocks Under Dynamic Loading. Rock Mech. Rock Eng. 2018, 51, 3785–3817. [Google Scholar] [CrossRef]
- Zhang, Z.X.; Kou, S.Q.; Jiang, L.G.; Lindqvist, P.A. Effects of loading rate on rock fracture: Fracture characteristics and energy partitioning. Int. J. Rock Mech. Min. Sci. 2000, 37, 745–762. [Google Scholar] [CrossRef]
- Zhou, Y.X.; Xia, K.W.; Li, X.B.; Li, H.B.; Ma, G.W.; Zhao, J.; Dai, F. Suggested methods for determining the dynamic strength parameters and mode-I fracture toughness of rock materials. Int. J. Rock Mech. Min. Sci. 2012, 49, 105–112. [Google Scholar] [CrossRef]
- Li, M.; Mao, X.; Lu, A.; Tao, J.; Zhang, G.; Zhang, L.; Li, C. Effect of specimen size on energy dissipation characteristics of red sandstone under high strain rate. Int. J. Min. Sci. Technol. 2014, 24, 151–156. [Google Scholar] [CrossRef]
- Mandelbrot, B.B. The Fractal Geometry of Nature; WH Freeman: San Franciso, CA, USA, 1982. [Google Scholar]
- Li, X. Rock Dynamics Fundamentals and Applications; Science Press: Beijing, China, 2014. (In Chinese) [Google Scholar]


Publisher’s Note: MDPI stays neutral with regard to jurisdictional claims in published maps and institutional affiliations. |
© 2020 by the authors. Licensee MDPI, Basel, Switzerland. This article is an open access article distributed under the terms and conditions of the Creative Commons Attribution (CC BY) license (http://creativecommons.org/licenses/by/4.0/).