1. Introduction, Relevance and Aim of This Paper
With the 2019 Dutch-Climate-Agreement, The Netherlands chose a neighbourhood approach to the transition from natural gas to a climate neutral energy supply for buildings. Dutch municipalities should have a vision on the heat transition and an energy plan for every neighbourhood by 2021 [
1]. At the moment the Dutch government is working on the Heat Act (warmtewet). It wants to introduce a collective heat network and divide municipalities into heat lots (warmtekavels) which they want to tender to heat companies (warmtebedrijven) in the future. The size of a heat lot is being discussed, yet it could have the size of a municipality or a neighbourhood. It is up to municipalities to decide. The position of inhabitants is not yet clear, but it looks like that they will be free to participate or not in a heat connection to one of the heating companies. Furthermore, they will have the possibility to form a local heat cooperative with up to 500 homes providing heat for themselves.
Implicit homogeneity of neighbourhoods is presupposed. However, older neighbourhoods are different, especially the ones which were laid out before World War I. These are nowadays heterogenic, attractive and often protected because of the quality of the architecture; neighbourhoods with a mix of users, building ages, property owners and habitation forms. Developing a generic energy plan for neighbourhoods laid out and constructed between 1860 and 1910 is a challenge, like the Zeeheldenkwartier of Den Haag (
Figure 1,
Figure 2,
Figure 3,
Figure 4,
Figure 5,
Figure 6,
Figure 7,
Figure 8 and
Figure 9) that is used as a case study in this paper.
It is a neighbourhood with young inhabitants and small households living in small rental units in split townhouses, usually without lifts and just 1 to 3 rooms. The two main building types are the townhouses (a middle-class house between 140–240 m2) and the down-up-house, with a ground and upper floor apartment and front door directly on the street.
There is a missing link. Research on different aspects has already been done in the past, for example on climate neutral heat supply and renovation of existing buildings [
2,
3]. However, the link between the bigger scale of region and municipality on one side and the smaller scale of different types of buildings is missing. From the perspective of heat strategy, it is necessary to map the typo-morphologist characteristics of these neighbourhoods and researching the use and inhabitation form of the buildings.
The aim and the main question of this study is to research a framework or strategy for a feasible climate neutral energy supply of the housing stock of late 19th century hybrid neighbourhoods in urban regions of The Netherlands based on typo-morphologic characteristics. Sub-questions are: What are the typo-morphologic characteristics of urban spaces and building stock? What is the use and ownership of these buildings? Which climate neutral heating or energy systems are possible in hybrid neighbourhoods?
The method is based on mapping the typo-morphologic characteristics of a hybrid neighbourhood from the period 1860–1910 and additional literature and policy documents about the heat transition. The first step is the determination of differences between neighbourhoods in morphology and periodisation of these neighbourhoods, this is the morphologic part of the assessment. Second step is the determination of the different building types and qualities of the neighbourhoods, this is the typology part of the assessment. Third step is the determination of the use and ownership of the buildings, data collected from the municipality. Fourth step is a review of all kinds of policy documents and reports about heat transition in general.
The hypothesis is that cities and neighbourhoods have an ontology that refer to their own built structure in each period. With a typo-morphologic assessment the ontology of a kind of neighbourhood can be described. This assessment is supplemented with data from institutes, municipality, provinces, and the national state.
Furthermore, there are some presuppositions in this assessment. The first one is that neighbourhoods laid out in a certain period are similar in morphology and buildings type, but changed through time. The second presupposition is that differences between the morphology of neighbourhoods from a certain period can be categorised using the Floor Space Index (FSI) and Ground Space Index (GSI). The third presupposition is that of the layer approach developed by the TU Delft, which gives more insight into the character of a specific neighbourhood from a certain period. The fourth presupposition is that supply of climate neutral energy by heat networks or heat pump with all electric needs for urban spaces have an impact on the living environment (aesthetics, heat, and sound production).
In the Netherlands, the terms ‘municipality’, ‘province’, ‘regions’, and ‘neighbourhoods’ have an administrative significance enshrined in legislation. The term ‘district’ has no administrative significance. It is used in combination, like ‘district heating’, when several municipalities are using the same heat network. A region is a collaboration of municipalities in a province. There are ‘urban regions’ and ‘heat regions’. The government divided the country into energy regions. The largest is the ‘Energiestrategie Regio Rotterdam-Den Haag’. The mapping of the typo-morphologic characteristics of the neighbourhood Zeeheldenkwartier was done by a living lab and students with expert meetings initiated and subsidised by the municipality, parallel with the students following a Minor at The Hague University of Applied Sciences in autumn 2018. The maps were presented in 2019. Finally, debate and reflection with expert meetings took place in the neighbourhood in 2018 organized by the Leiden-Delft-Erasmus Centre for Global Heritage and Development, the LDE Conference Heritage and the Sustainable Development Goals at TU Delft in 2019.
Section 1 of this paper is an introduction,
Section 2 explains the framework of a typo-morphologic assessment,
Section 3 describes the heat supply in the region,
Section 4 presents the mapping of a case study,
Section 5 are debates and reflections of the expert meetings and the LDE-conference at TU Delft, and
Section 6 is the conclusion.
2. Framework of a Typo-Morphologic Assessment
2.1. Changes in Society Effecting Typo-Morphologic Structure of Neighbourhoods
The method that is applied to analyse the quality of neighbourhoods is to map relevant typo-morphologic characteristics of the Zeeheldenkwartier. This age and type of neighbourhood shares common characteristics of urban patterns and buildings, and for this reason good to compare. Neighbourhoods and their buildings are the atoms of slow evolving cities. Changes in the built environment happen in a broader perspective in relation to changing legislation, subsidy, central policy or lack of governance. This is why each generation of neighbourhoods in modern Dutch cities since 1860 have their own specific characteristics.
2.2. Determination of Density of Buildings in Different Neighbourhoods
The best way to express the morphology of a neighbourhood is to calculate the floor space index (FSI) and ground space index (GSI). Different neighbourhoods are compared with these indexes. The terms, definitions and methods of determination are defined in the NEderlandse Norm (NEN) 9300:2013 for areas and densities in urban planning [
4]. The NEN 9300 is the translation of the International Organization for Standardization (ISO) norm ICS code 91.020 Physical Planning. Town Planning.
According to these standards, there are five levels: municipality, neighbourhood, residential area, urban block, and lot or plot. Those five levels each have a gross, a net and a tare surface. The municipality, neighbourhood, and lot have administrative boundaries registered by the Dutch Land Registry Office. Neighbourhood boundaries are defined by the municipalities. Parameters in determining the area are: A = surface of the area in m2, X = the scale of the area (lot, urban block, neighbourhood, municipality), BTO = footprint of all buildings in the area in m2, TO is tare surface area in m2 (Ax = BTOx + TOx).
Parameters in relation to the buildings are: BVO = gross floor space of the buildings in m2, L = layers of the buildings. This method makes it possible to describe an urban environment by using a set of density variables (FSI, GSI, OSR and L). These quantitative aspects can be used both to describe and characterise different urban environments.
The built density of an area is expressed by FSIx = floor space index (= BVOx / Ax). The relation between built and non-built is expressed by GSIx = ground space index (= BTOx / Ax). The unbuilt area is expressed by OSRx = open space ratio (= A − BTOx / BVOx). The relation between FSI, GSI, OSR and L is expressed in a Spacemate graphic (
www.spacemate.nl) [
5]. This thus enables us to characterise different kinds of neighbourhoods.
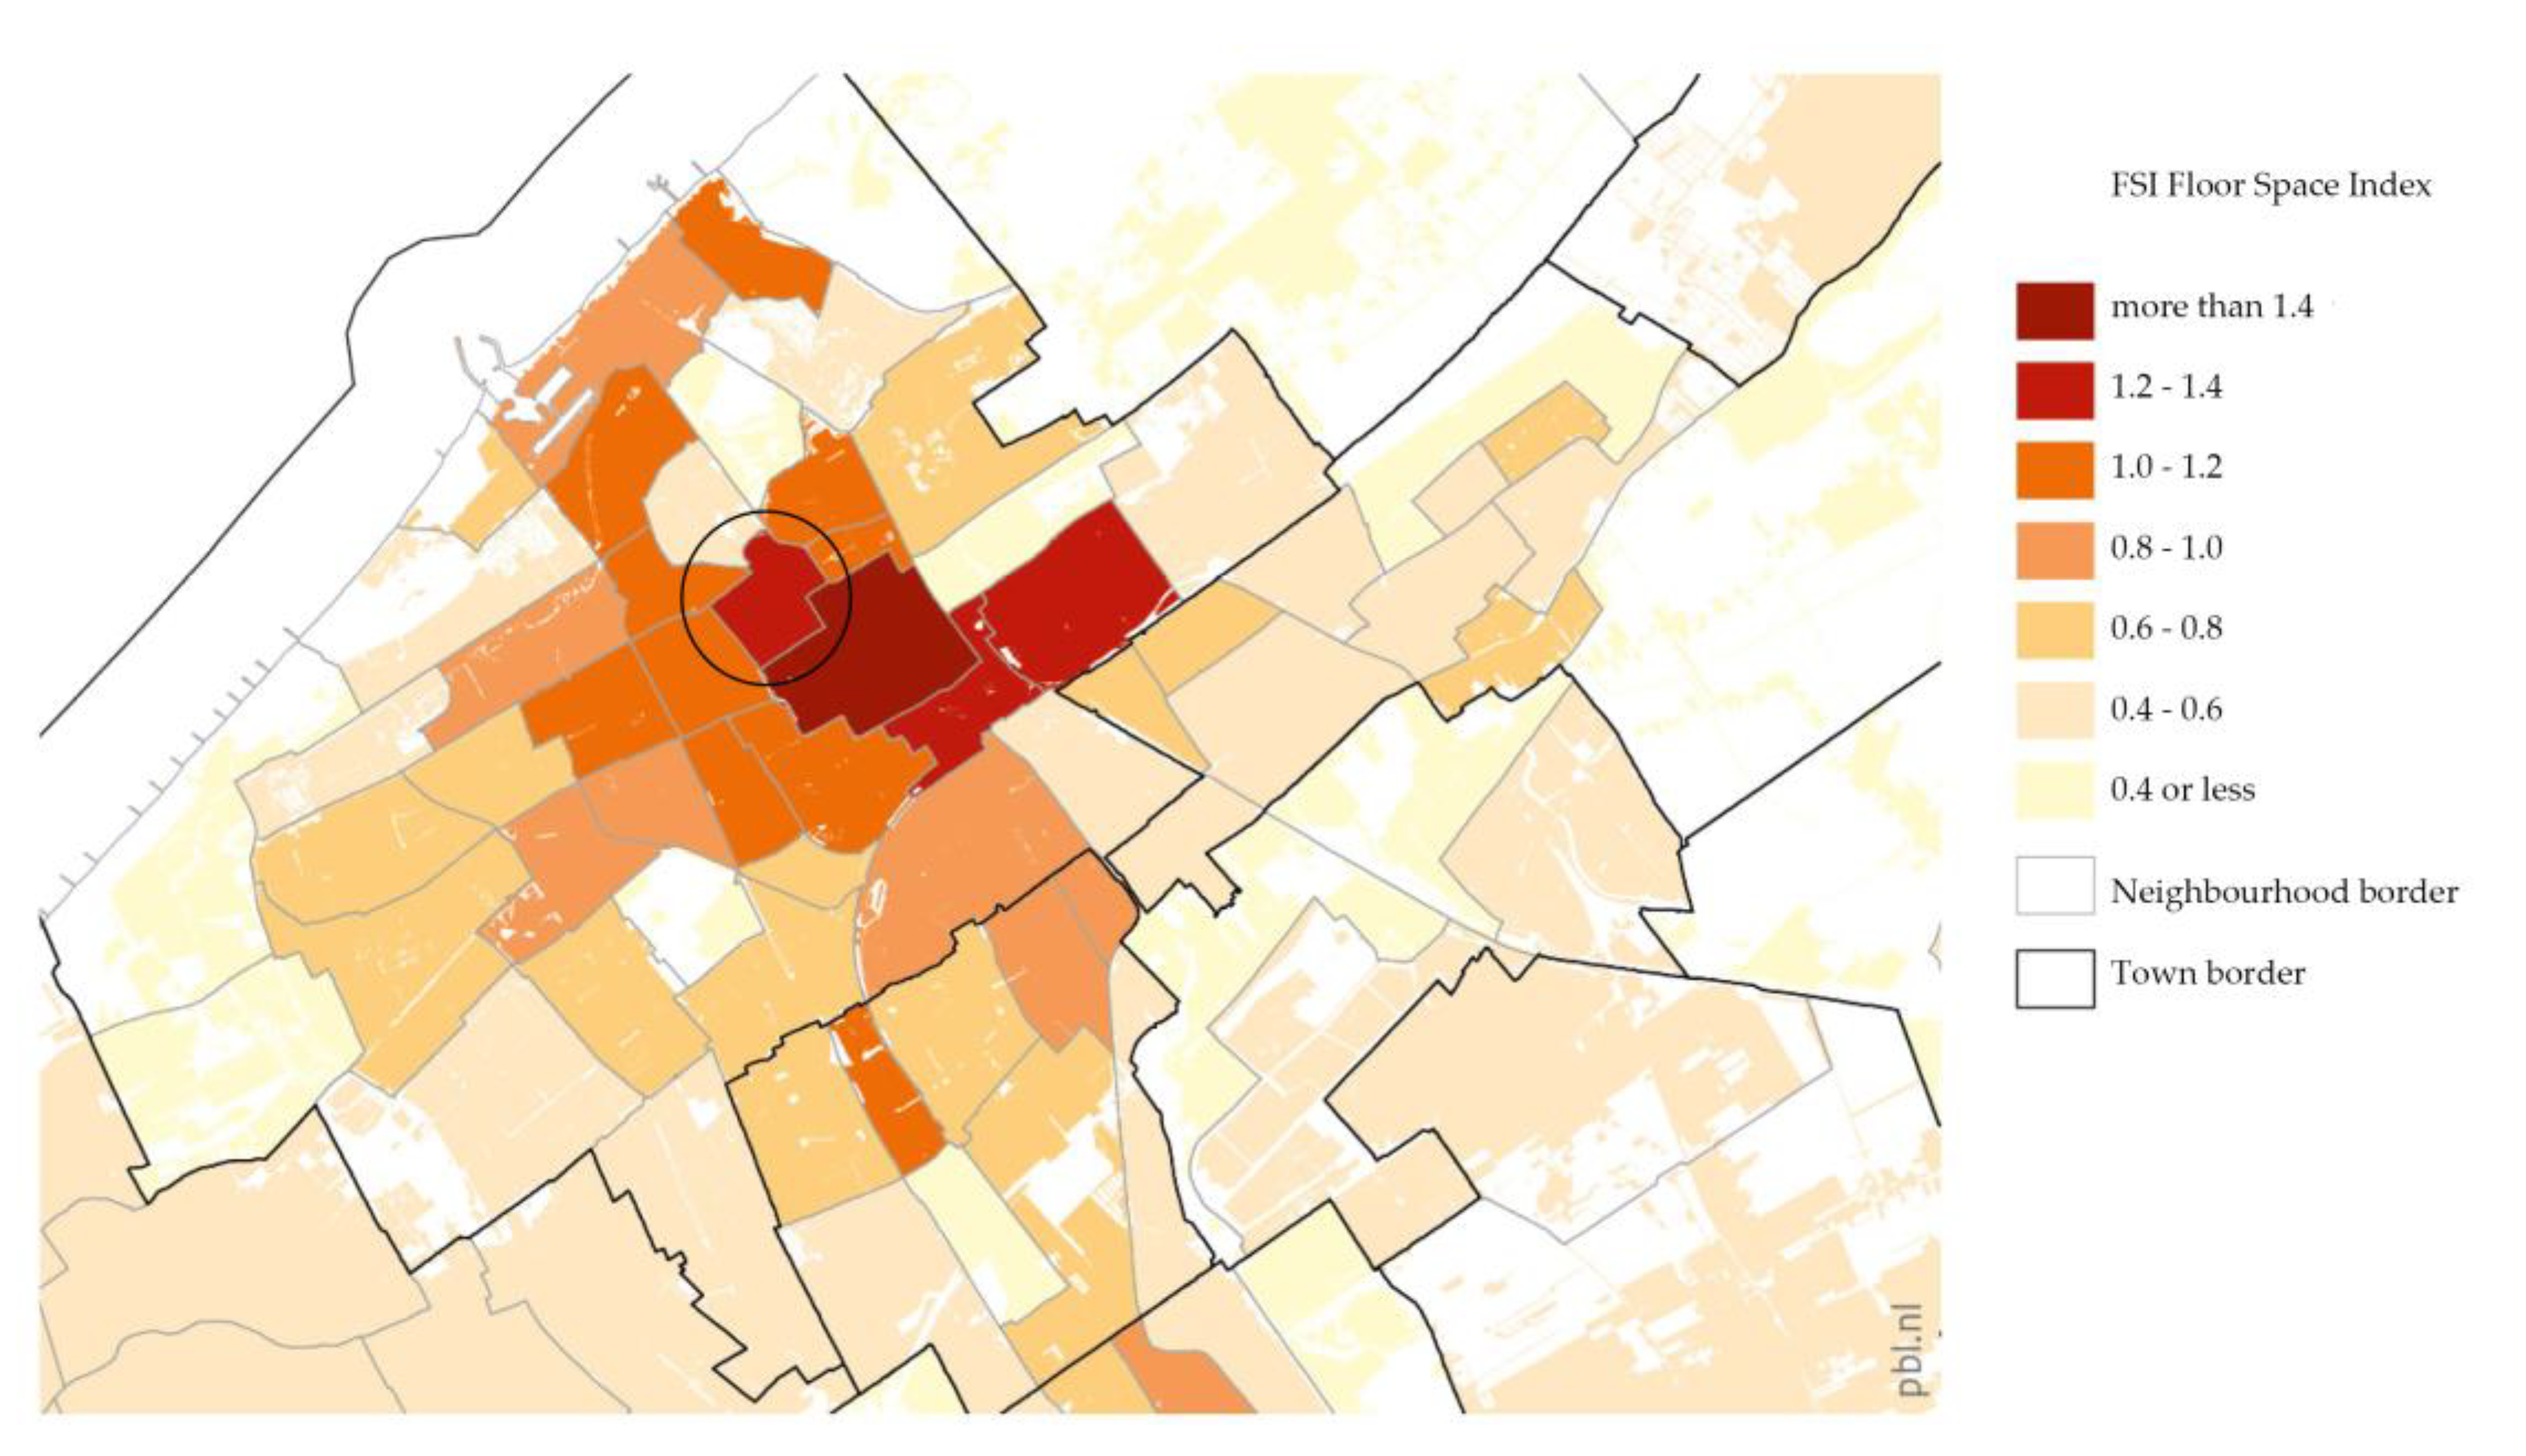
The determination of the density of neighbourhoods in Den Haag was done by the Planbureau voor de Leefomgeving PBL in research on a mix of functions [
6]. The FSI municipality scale of Den Haag = 0.5–0.6. The following data is specific for the Zeeheldenkwartier neighbourhood:
FSI neighbourhood scale Zeeheldenkwartier = 1.2–1.4
FSI residential area scale Zeeheldenkwartier = 1.2–1.6
FSI urban block scale Zeeheldenkwartier = 0.7–2.8
GSI urban block scale Zeeheldenkwartier = 0.55–0.85
OSR urban block scale Zeeheldenkwartier = <0.25
If we compare the map of
Figure 2 with the digital map of the growth of the municipality of Den Haag
http://www.haagsekaart.nl/ we can draw the conclusion that there is a relation between the density of buildings of neighbourhoods (expressed in FSI and GSI) and the period when the neighbourhood was laid out.
FSI: < 1860 The historic centre—FSI = > 1.4
1860–1910 Late nineteenth century and fin de siècle—FSI = 1.0–1.4
1918–1940 Inter war—FSI = 0.6–1.0
1945–1964 Post war—FSI = 0.4–0.8
1965 onwards Urban renewal, new towns and Vinex neighbourhoods—FSI = 0.6–<
The Zeeheldenkwartier has a FSI neighbourhood = 1.2–1.6 and a FSI urban block = 1.5–2.2. Every 100 m2 of this neighbourhood area has an average of 120 to 220 square meter building usually in three layers. However, old neighbourhoods are hybrid and have a mix of buildings, urban spaces, uses, and ownership. The old centre has more or less the same FSI but with a completely different character. There are some residential towers and areas with shops with practically no apartment units above them. The layer approach of the Delft University of Technology is used to describe the townscape characteristics and building types, use, and ownership of the building in more detail.
2.3. Ontology of Cities: The Layer Approach
At Delft University of Technology, the method of typo-morphology was introduced in the nineteen eighties. The research was based on reducing maps and drawings on aspects. Reduced maps are called layers. The method can be done by diachronic or synchronic map/drawing reductions. If someone wants to provide knowledge about the evolution of a city, neighbourhood or building, the diachronic approach is used. Maps/drawings from a particular neighbourhood or building at different time periods can be reduced on their aspects. One speaks about morphogenetic research because the evolution or ‘genese’ of the neighbourhood is the object of the research. If someone wants to compare different cities or neighbourhoods the synchronic approach is used. Maps are reduced on aspects of just one period and compared [
7]. Often the two methods are combined to provide detailed knowledge on a city or neighbourhood.
Based on different studies, the urbanist department of Delft developed the layer approach including substratum, networks, and occupation patterns. In this assessment the stratified urban planning model by e.g., Heeling, Meijer and Westrik presented in
De Kern van de Stedebouw in het perspectief van de 21ste eeuw is used, which distinguishes five aspects or layers [
8,
9,
10,
11]:
Substratum, territory or landscape
Urban ground plan/Street pattern
Public space
Use of space and buildings
Buildings: subdivision or parceled-out land (size and direction), density of buildings, transition zone between public space and private property (position facade and building line), image of urban ensemble
In the future a new layer ‘circularity’ could be introduced. However, the research in this assessment is specifically confined to the question of heat transition.
2.4. Typo-Morphologic Characteristics of A Neighbourhood and the Heat Question
Which typo-morphologic characteristics of a neighbourhood are relevant in relation to the energy question? Because of the space that is needed by the heat network, the urban ground plan and the size of the urban spaces of the neighbourhoods are relevant. Because of the use of solar panels, the shape of the roof is relevant. Because of the energy demand, the quality and age of the built structures are relevant. Some characteristics are determined by the original layout of neighbourhoods and buildings such as street pattern, size and orientation of urban spaces, size and orientation of the plot, division private property and public domain, position of building types and functions in the neighbourhood, as well as the quality and status of buildings (ownership, architecture, bearing structure, energy performance, shape of the roof). Other characteristics depend on the substratum, inhabitation, and architectural value of buildings.
2.5. Maps and Data
To reduce the data on the Zeeheldenkwartier into layers, a basic map of the Zeeheldenkwartier neighbourhood was produced using CadCollege software [
12]. The data for these maps was retrieved from Openstreetmap and the Nationaal Georegister [
13]. It comprised street patterns, direction, size of urban spaces, building plots, public domain and private property, building lines and facade s etc. The urban morphology is mapped but the typology of buildings is not fully clear. By acquiring public data from the province Zuid-Holland, the Dutch federal government, the Municipality of Den Haag and institutes such as CBS (Statistics of The Netherlands), the quality, ownership, functions, and performance of buildings can be located on the basic map [
14]. Data about the energy transition was retrieved from the Warmte Transitie Atlas Zuid-Holland [
15], Nationale Energie Atlas [
16] and the Warmte Atlas [
17]. Data about the origin and quality of the buildings was provided by the municipality and Waag Technology & Society [
18]. There is also a lot of data on energy renovations and calculations on existing buildings already available from the Rijksdienst voor Ondernemend Nederland (RVO) [
19]. Seven dwelling types and five construction periods are distinguished. This division is based on the
WoON 2006, a national survey on qualities and changes of dwellings. The Dutch government has published all known data about existing buildings (with energy calculations) and possibilities to renovate the housing stock [
20].
3. Energy Supply in Late 19th Century Neighbourhoods
3.1. Energy Strategy of the Region Rotterdam-Den Haag
Most townhouses in neighbourhoods like the Zeeheldenkwartier are heated with natural gas boilers and a central heating (hydronic heat distribution system) 90-degrees Celsius to all parts of the dwelling with radiators in each room; some still have gas heaters. Other heat distribution systems could be applied if the townhouses were split into apartments. The urban renewals have central heating systems with gas boilers. This section describes the possibilities of a climate neutral energy supply in general and more specifically in 19th century neighbourhoods in Dutch city regions. What is the Regional Energy Strategy (RES) in the largest region of The Netherlands: Energiestrategie Regio Rotterdam-Den Haag? In the Green Deal Warmte Zuid-Holland in 2011 it was decided by the government and province Zuid-Holland to lay out open district heating with industrial waste (WfE) from Rotterdam and geothermal heat as source. Also, housing associations in Den Haag made a deal with the municipality about district heating of 70-degrees Celsius. With the Aedes Woonagenda 2017–2021 housing associations promised to have climate neutral housing stocks by 2050 with an average Energy Performance Certificate (EPC) label B by 2021. According to the climate agreement of 2019, in high density areas laid out before 1995, a heat network is favoured, while all-electric for homes in new spacious districts is better [
21].
The Expertise Centrum Warmte (ECW) was organised by several Dutch institutes and organisations to support municipalities on producing a vision and implementing the heat transition [
1]. They offer a guideline, tools, and helpdesk to advise municipalities. These are their strategies on how to provide heat in the future:
- (1)
All electric with a heat pump (EPC label B)
- (2)
Heat network Middle Temperature (MT) 70-degrees Celsius) (EPC label C)
- (3)
Heat network Low Temperature (LT) 50-degrees Celsius (EPC label B)
- (4)
Renewable gas (bio, synthetic, hydrogen) with a hybrid heat pump
- (5)
Renewable gas with a boiler
The Dutch province of South Holland in the Energiestrategie Regio Rotterdam-Den Haag 2018 indicates a shortage of electricity and surplus of industrial waste and geothermal heat in the future [
22]. Data centres, electric cars, and greenhouses of the Westland will demand exponentially more energy in the future [
23,
24]. In July 2019 the province of South Holland published the
Energieperspectief 2050—Energiestrategie regio Rotterdam-Den Haag [
25]. This document defines the preferences of reduction of fossil heat of the Energiestrategie Regio Rotterdam-Den Haag. Firstly, insulation of dwellings, secondly use of industrial waste heat (WfE) from Rotterdam, thirdly use of geothermal energy (GSHP), fourthly individual heat pumps, fifthly bio gas and bio mass. The use of bio gas and bio mass for the future are currently being discussed.
The regional and open heat network of 70-degrees Celsius is considered the best solution to provide heat in Rotterdam-Den Haag, even though the question of ownership and the cost for the consumer are still problematic [
26,
27]. The Gasunie is eventually going to develop, lay out and manage a public and open district heating transport network in the region of Rotterdam-Den Haag [
28].
The Municipality of Den Haag already developed several strategies and agreements with stakeholders for a 70-degree Celsius heat network in 2017 and 2018 [
29,
30,
31,
32,
33]. A conference report by the municipality in March 2019 explained that the heat network will have three main heat sources: industrial waste energy (WfE) from Rotterdam, local geothermal energy (GSHP), and local aquathermal energy (WSHP) [
34]. The municipality also appointed a number of pilot neighbourhoods to work with stakeholders on a heat plan. Two of these are hybrid neighbourhoods. The municipality categorised these hybrid neighbourhoods as ‘innovation’ instead of ‘heat network’ or ‘all electric’. However, the municipality categorised them also as 70 degrees Celsius neighbourhoods because of the thermal quality of the old buildings. The municipality presupposes in their publications more and different solutions to provide heat in the future because of a capacity problem. There is not enough capacity to heat all the dwellings. Hybrid neighbourhoods are still an anomaly.
3.2. Experiences with Other Similar Dutch Neighbourhoods in Heat Transition
Some assessments are already made on late 19th century neighbourhoods, for example in Den Haag, Tilburg, Rotterdam, Groningen and several other municipalities. All cost is taken into account with a Total Cost of Ownership (TCO) assessment. In a more or less similar neighbourhood Statenkwartier from the period 1890–1910 in Den Haag, the consultancy DWA did a TCO assessment about the possibilities of climate neutral heat supply in relation to existing building stock. They did energy and renovation calculations on three reference houses, which were similar to the houses in the Zeeheldenkwartier [
35]. The method that was applied is based on the Vesta-MAIS-spatial-energy-model by the Planbureau voor de Leefomgeving (PBL). Two levels of renovation/energy are assumed: measures A with EPC label C and the more expensive measures B with EPC label B. The current situation is central heating of 90-degrees Celsius and no energy measures at all. They concluded that there are just five possibilities:
- (1)
Heat network MT (70-degrees Celsius) (EPC label C)
- (2)
Heat network LT (50-degrees Celsius) (EPC label B and LT-heating)
- (3)
Renewable gas (hydrogen) with a boiler
- (4)
Mix option 1 and 3
- (5)
All electric with a heat pump and air as source (EPC label B and LT-heating)
The conclusion of DWA and the neighbourhood was that option 1 is the most affordable and options 2, 3 and 5 the most expensive. But option 1 (like 2 and 4) needs collectivity and urban space to lay out a heat network.
Another assessment covers the Theresia neighbourhood in Tilburg from the period 1850 to 1930 by consultancy CE-Delft; Universal Pipeline Association UPA did the engineering. They applied another method to calculate the TCO: the CEGOIA-model (CE Delft, 2019). Their four conclusions were:
- (6)
All electric with a heat pump and air as source (EPC label B and LT-heating)
- (7)
Renewable gas with a hybrid heat pump
- (8)
Heat network MT (70-degrees Celsius) (EPC label C)
- (9)
Heat network LT (50-degrees Celsius) (EPC label B and LT-heating)
More or less the same options as ECW and DWA. The best business case is option 2 and 3. The problem with renewable gas is availability. The problem with the heat network is the absence of a collective and the cost and complexity of a secondary network in the narrow streets of a densely built neighbourhood.
In the postwar Paddepoel neighbourhood in Groningen, an experiment with a heat network is going on now. Because there is a lot urban space, heat networks are an efficient solution there. A local energy cooperation and Shell are laying it out in combination with a neighbourhood heat pump [
36]. There are three options in Paddepoel: new dwellings all electric with PT(V)-panels, multi-storey residential buildings of housing associations on the WarmteStad heat network of Groningen, and private owned houses on the local Buurtwarmte heat network. The reason for two heat networks is that it is almost impossible to organise private owners by the municipality. However, if they organise themselves then there are all kinds of possibilities. When energy plots by municipalities are tendered to energy companies in the future though, the question will be how the relation and collaboration will be with local energy initiatives then. The ownership about the heat network is going to be an issue.
In another hybrid neighbourhood Bospolder-Tussendijken Rotterdam (designed after 1910, primarily built in the postwar period with little urban space), a conflict arose between the ambition for a heat network and a climate adaptable neighbourhood [
37]. Furthermore, a discussion arose as to whether homeowners or landlords were obligated to connect to the heat network or to insulate their dwellings [
38]. The answer is still unclear.
At a conference about the energy transition on June 29, 2019 the Municipality of Den Haag mentioned some poor options for all neighbourhoods like energy from the sewer system, biogas, synthetic gas or hydrogen. These are not very likely options for the municipality. For example, 5000 connections to the sewer system would be needed to heat 100 houses in wintertime. For biogas, synthetic gas or hydrogen, there would be capacity and logistic problems if the existing natural gas pipes were to be used. Two other ineffective options in the hybrid neighbourhoods of Den Haag are either the heat pump with soil or water as energy sources. The problem is the lack of open terrain and water because of the dense proximity of the buildings, facade s on the building line, and the courtyards being private property.
3.3. The Two Most Likely Options
The two most likely options for providing climate neutral energy to a hybrid neighbourhood according to the municipality from that conference, and in line with the province and Energiestrategie Regio Rotterdam-Den Haag policies, are a mix of a collective open secondary heat network MT (assuming EPC label C) and a more expensive individual all electric with a heat pump and air as source (assuming newly built dwellings or renovations were EPC label B and LT-heating). The arguments why a collective heat network is needed are: firstly because there is a surplus of industrial waste heat and a shortage of electricity; secondly the collective energy system would be available for everybody; thirdly there is a shortage of electricity in the region Rotterdam and Den Haag. The reason for all electric is that it makes it possible for individuals or local energy cooperatives to connect to the heat network or not. In the discussion about the heat act, ownership of the heat company is currently an important issue.
The perspective for all neighbourhoods in the future is described for the province Zuid-Holland in the
Energieperspectief 2050—Energiestrategie regio Rotterdam-Den Haag. Also according to the municipality, two most likely options for providing heat to hybrid neighbourhoods are collective district heating using industrial waste energy (WfE) from Rotterdam with local geothermal (GSHP) and aquathermal (WSHP) heat as sources and individual all electric using a heat pump with air as heat source. But depending on the choice of heat supply, there are some basic principles for an energy efficient house [
2,
3]:
Limit building-related heat demand with thermal insulation.
Use local heat, transporting heat is expensive and inefficient.
Narrow the problem to the base load of the heat demand and not the peak load.
Store heat/cold for when needed. Bridge peak moments of heat demand (winter peak, evening peak) by heat retention in the soil (winter peak), boiler (evening peak) or battery (evening peak). Insulated houses need heat in the winter and warm water the whole year round.
Use PV(T) panels with battery or solar collectors or a combination (because domestic warm water requires heat all year round and a well-insulated house only in wintertime).
Organise a heat collective (energy cooperatives are necessary for collective connection to the heat network, energy storage, and paying for the electricity).
3.4. District Heating
A new connection between Rotterdam and Den Haag will be laid out and the local heat network will be connected to a regional and open network. The Municipality of Den Haag wants industrial waste heat from Rotterdam and 15 local geothermal sources with approximately 8000 houses connected to each source. That’s about 120,000 houses. There are currently 256,694 houses in the municipality [
39]. The climate agreement mentioned a scaling up of geothermal energy (from 50PJ to 200PJ) by 2030 and aquathermal energy (80 to 120PJ) by 2050. The Municipality of Den Haag already has an agreement with housing associations about connecting to the heat network, yet there are some essential conditions for using it:
- (10)
To manage an efficient heat network by a heat supplier is to have a big difference between the in- and output of heat and a low flow. With well insulated houses the difference is too small and heat supply inefficient. The old neighbourhoods have many poor insulated houses, especially rentals by private landlords.
- (11)
An insulation level of EPC label C and a hydronic delivery of the heat in the dwellings are necessary.
- (12)
Heat is produced all year round continually, even when not needed. Urban areas have heat stress in summer so it is best to store heat on location during summertime for use during wintertime. Expensive storage systems like Ecovat and public space are needed to do this but the maps illustrate lack of open public space in hybrid neighbourhoods.
- (13)
Urban space is essential and usually lacking to lay out a heat network in neighbourhoods from the period 1860–1910. Most townhouses are in narrow streets about 10 m wide, construction work for a heat network could lead to damaging old brickwork buildings. Furthermore, urban space is needed for climate adaption, greenery and trees. It will be a challenge to lay out a heat network in hybrid neighbourhoods.
3.5. All Electric with Heat Pump Using Air as Energy Source
Generally there are two heat supply systems in dwellings: hydronic and non-hydronic systems [
40]. A hydronic system requires low temperature heating and for that reason good insulation. Air is accessible everywhere and therefore a convenient source for heat. The heat is generated by an electric heat pump taken off the air and via a heat exchanger to water (hydronic/LT-heating/hot water heater/radiators) or air (non-hydronic/air-conditioning unit), which is spread throughout the house. The heat pump could be either collective or applied individually. In either case, during the winter peak one can add infrared heat panels for extra heating in the bathroom or study for example. If an old house is already insulated with double glass and a hydronic heat system, then an air-water-heat pump is an option. One collective heat pump with an energy corporation with two to eight households is another possibility. EPC label B is necessary because the hydronic system is a low temperature system LO. A disadvantage of the hydronic system is that the LO heating has no air flow or convection, so that heat is not spread around evenly. If an old house is split up into small apartments then a non-hydronic heating system with an air-air-heat pump (or air conditioners: airco) is the most efficient. This provides warm air in the winter and cold air in the summer. Then a complex and expensive hydronic system with boiler and floor heating or radiators are not needed. Insulation is not necessary. There are air-air-heat pumps with combined ventilation and classical ones without. Together with an electric heater this heating system is cheapest and favourable in small rental apartments, although all electric presents a few major problems:
- (14)
The aesthetic quality of heat pumps on facade s that usually have architectural value; on the street side heat pumps are forbidden by the municipality.
- (15)
Sounds and vibrations of heat pumps. Especially in summertime when windows are open on warm nights, heat pumps cooling the units produce noise. Heat pumps in the future will only be allowed to produce 40 dB(A) on the property boundary. Heat pumps currently produce between 45 and 60 dB(A); sound insulation for heat pumps is an expensive option.
- (16)
In summertime the air-air-heat pump (airco) cools dwellings, using two to four times more electricity than in wintertime. The electric network currently does not have the capacity to provide enough electricity.
- (17)
In summertime when an air-air-heat pump is cooling a dwelling it pumps warm air into the atmosphere. Heat stress is already a problem in municipalities such as Den Haag, especially in densely built hybrid neighbourhoods [
41,
42].
- (18)
Another disadvantage of the air-air-heat pump is its efficiency during wintertime because heat pumps use the heat from the air outside and the temperature in winter is usually quite low.
4. Mapping the Typo-Morphology: Case Study Zeeheldenkwartier
This section describes the general typo-morphologic characteristics of hybrid neighbourhoods from the late 19th century. They are found everywhere in urban regions and are nowadays densely populated areas with primarily small household units. Originally built as middle class neighbourhoods, examples are Amsterdam: De Pijp, Dapperbuurt, Oud-West (Helmersbuurt, Da Costabuurt), Staatsliedenbuurt-Noordoost and Oosterpark; Rotterdam: Delfshaven, Nieuwe Westen, Middelland, Oude Westen and Agniesebuurt; Den Haag: Archipelbuurt, Stationsbuurt, Bezuidenhout, Regentessekwartier and Valkenboskwartiern. In relation to the energy question of 1860–1910 neighbourhoods, the layers mapped are: substratum or landscape, urban ground plan, public space, use of space and buildings, and the buildings.
4.1. Substratum, Urban Ground Plan and Urban Space
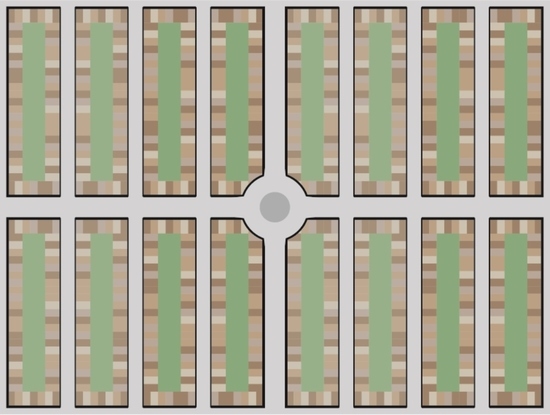
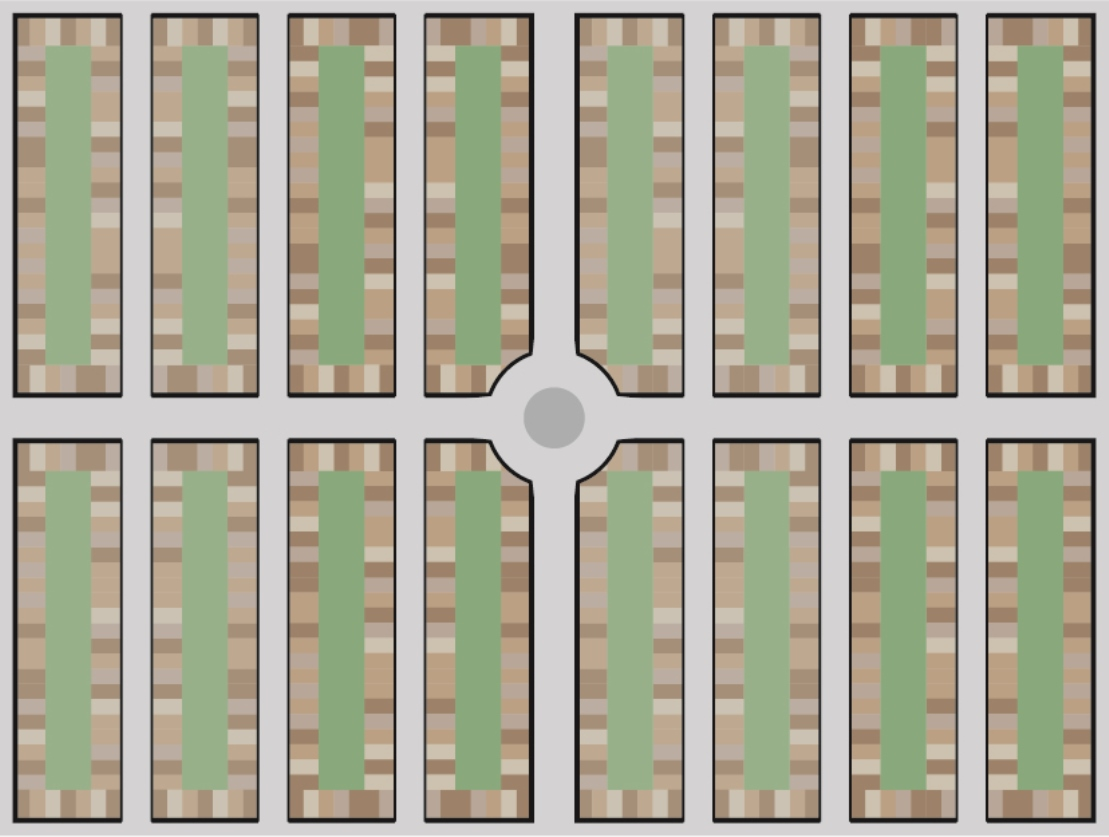
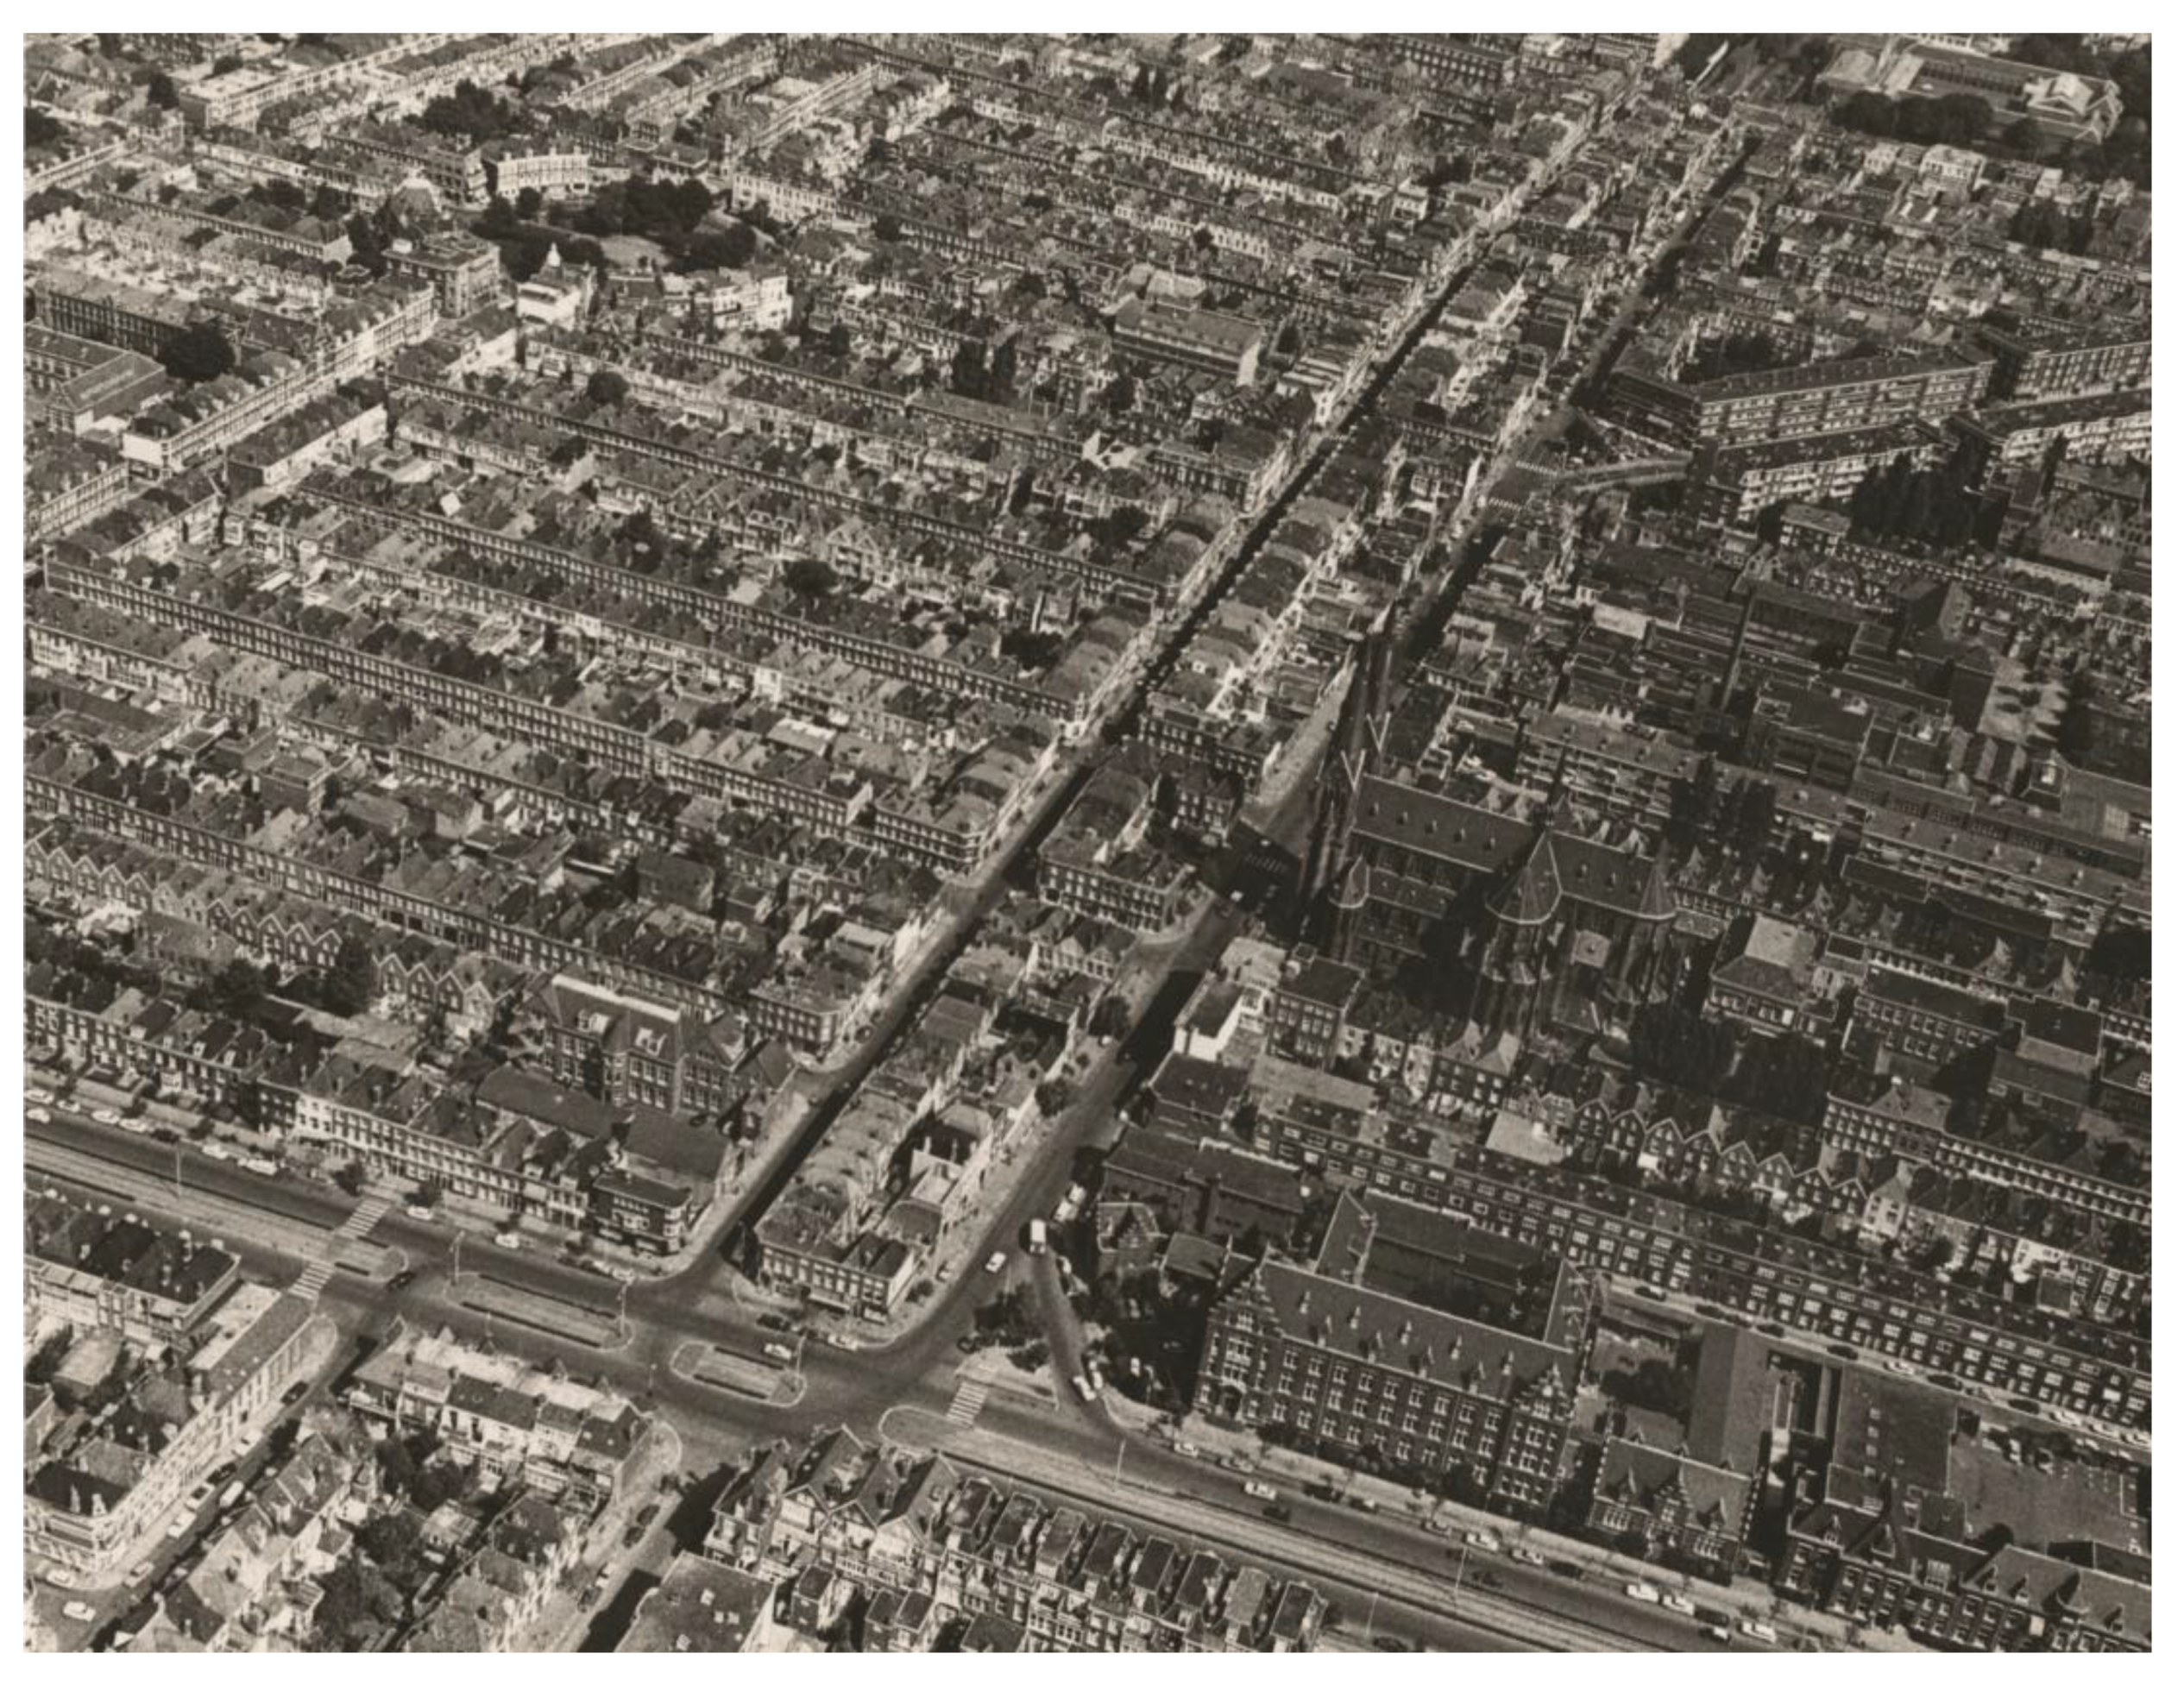
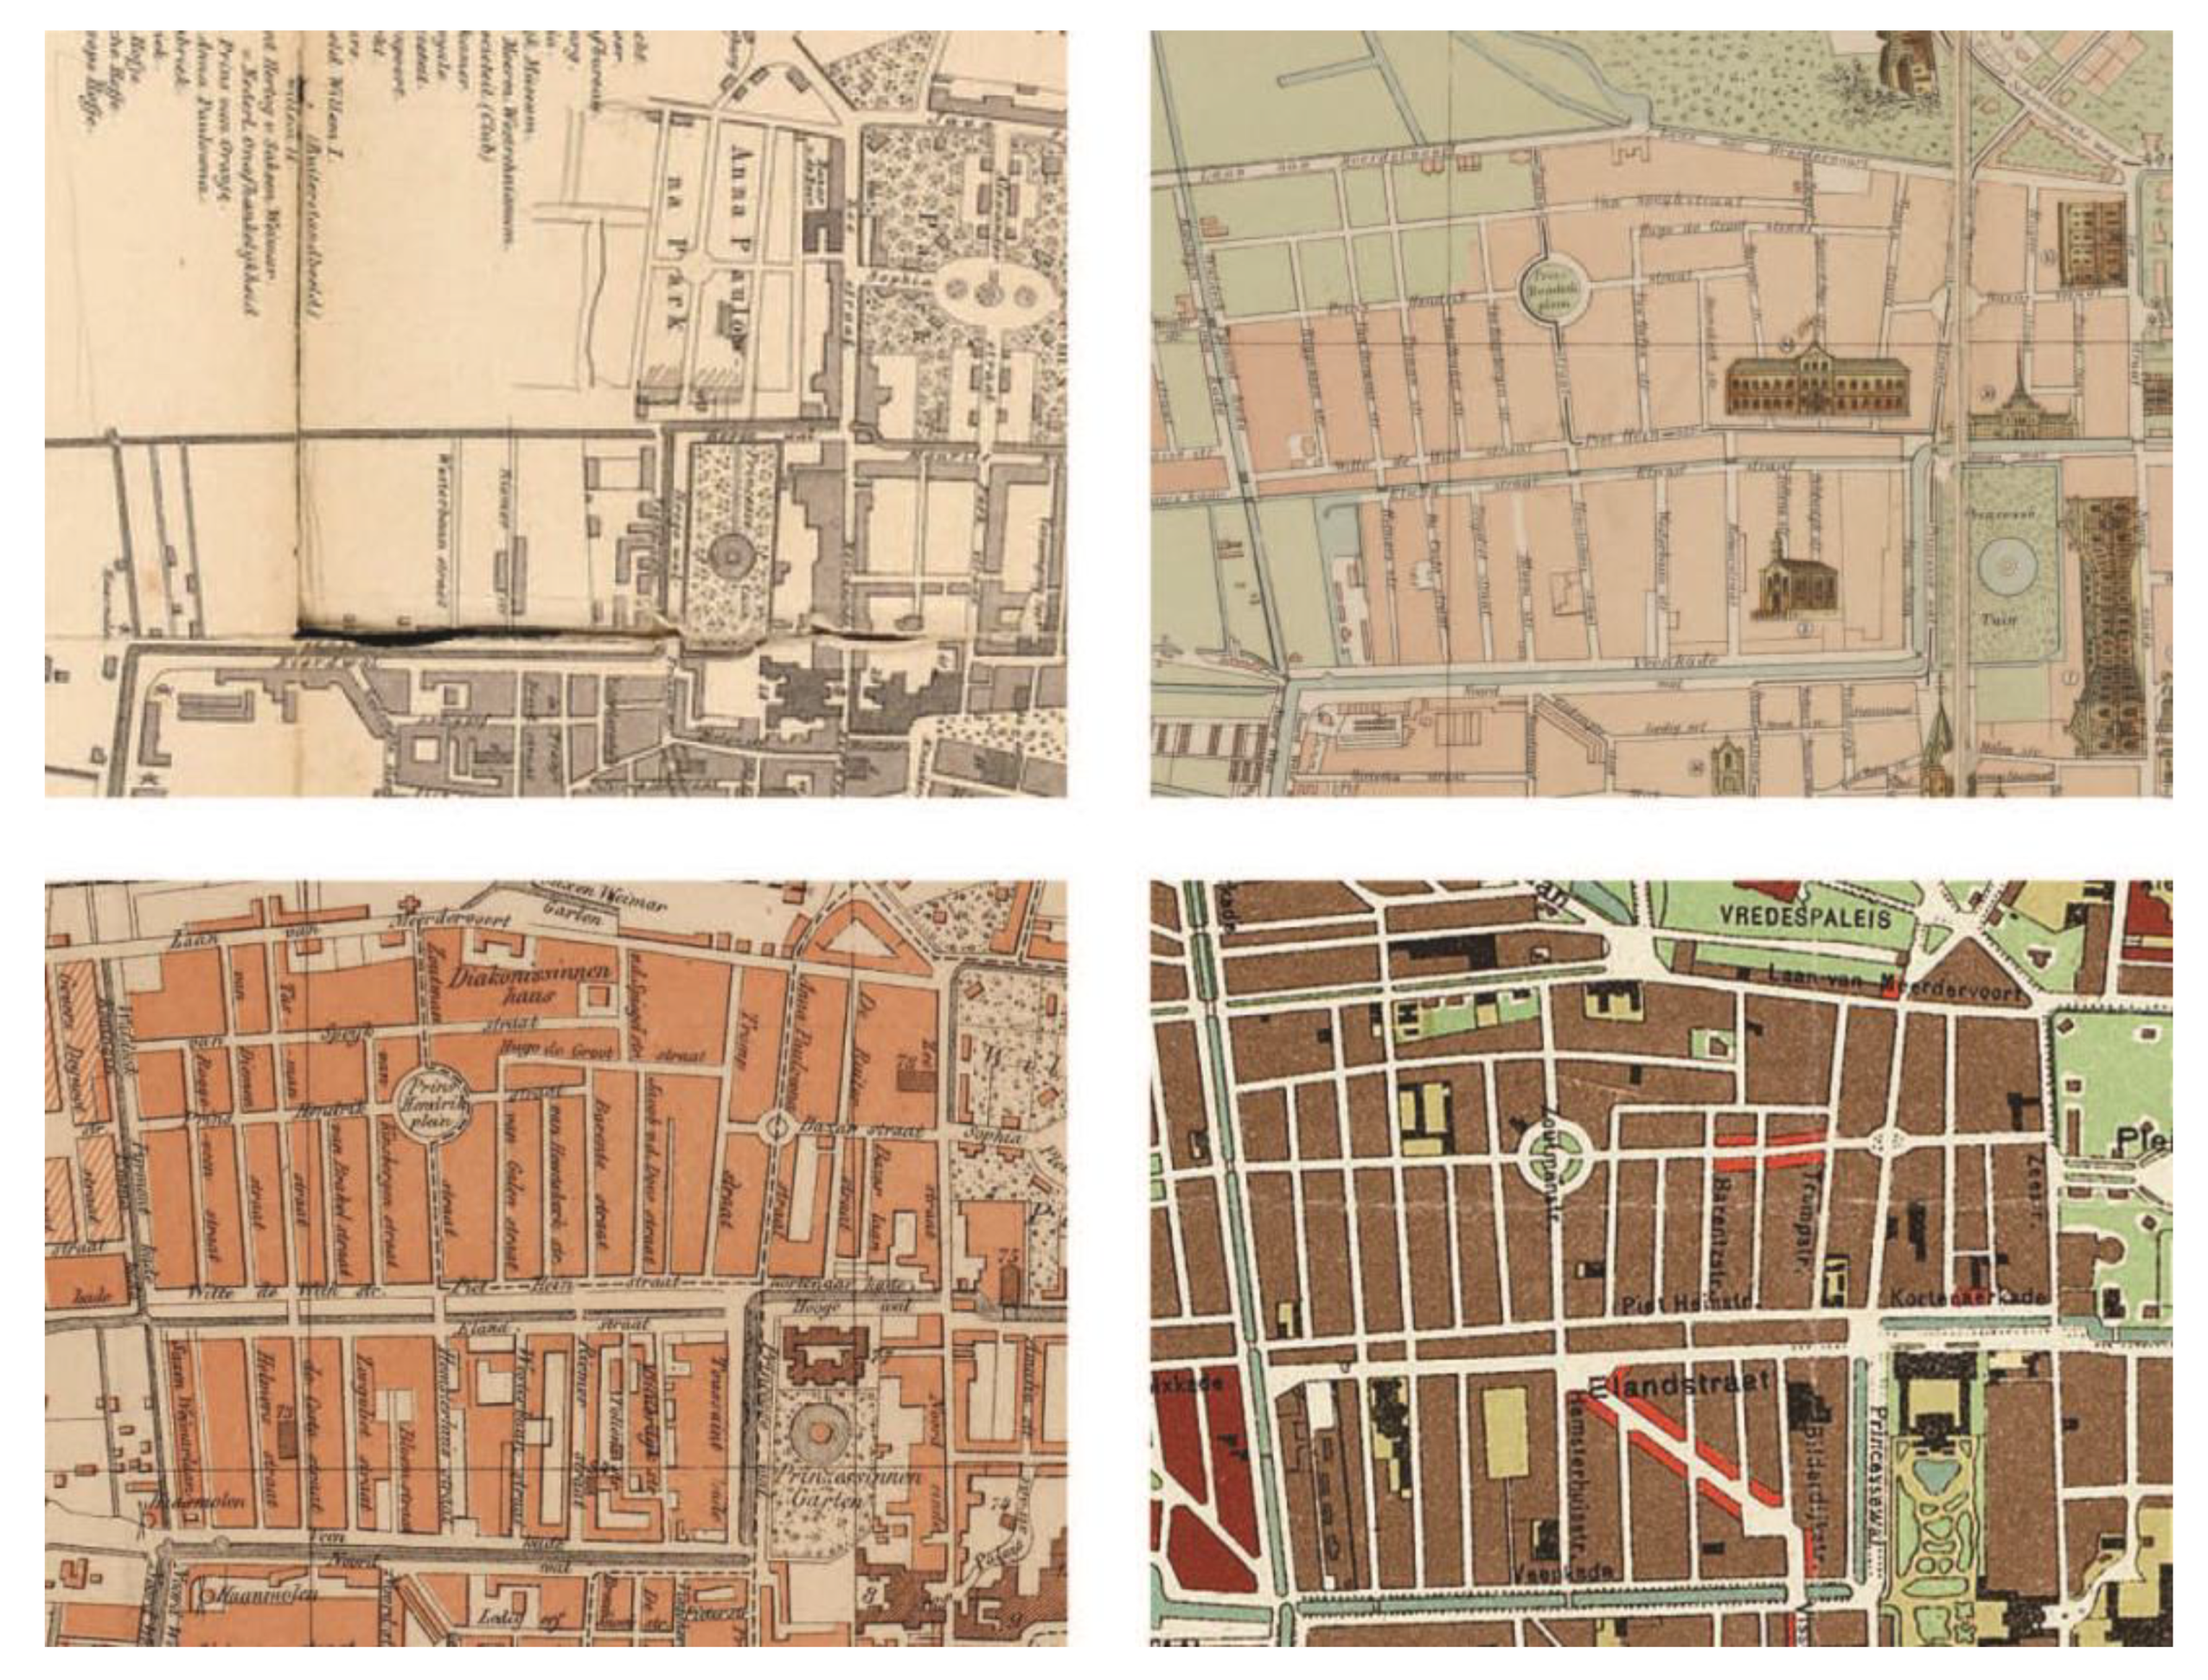
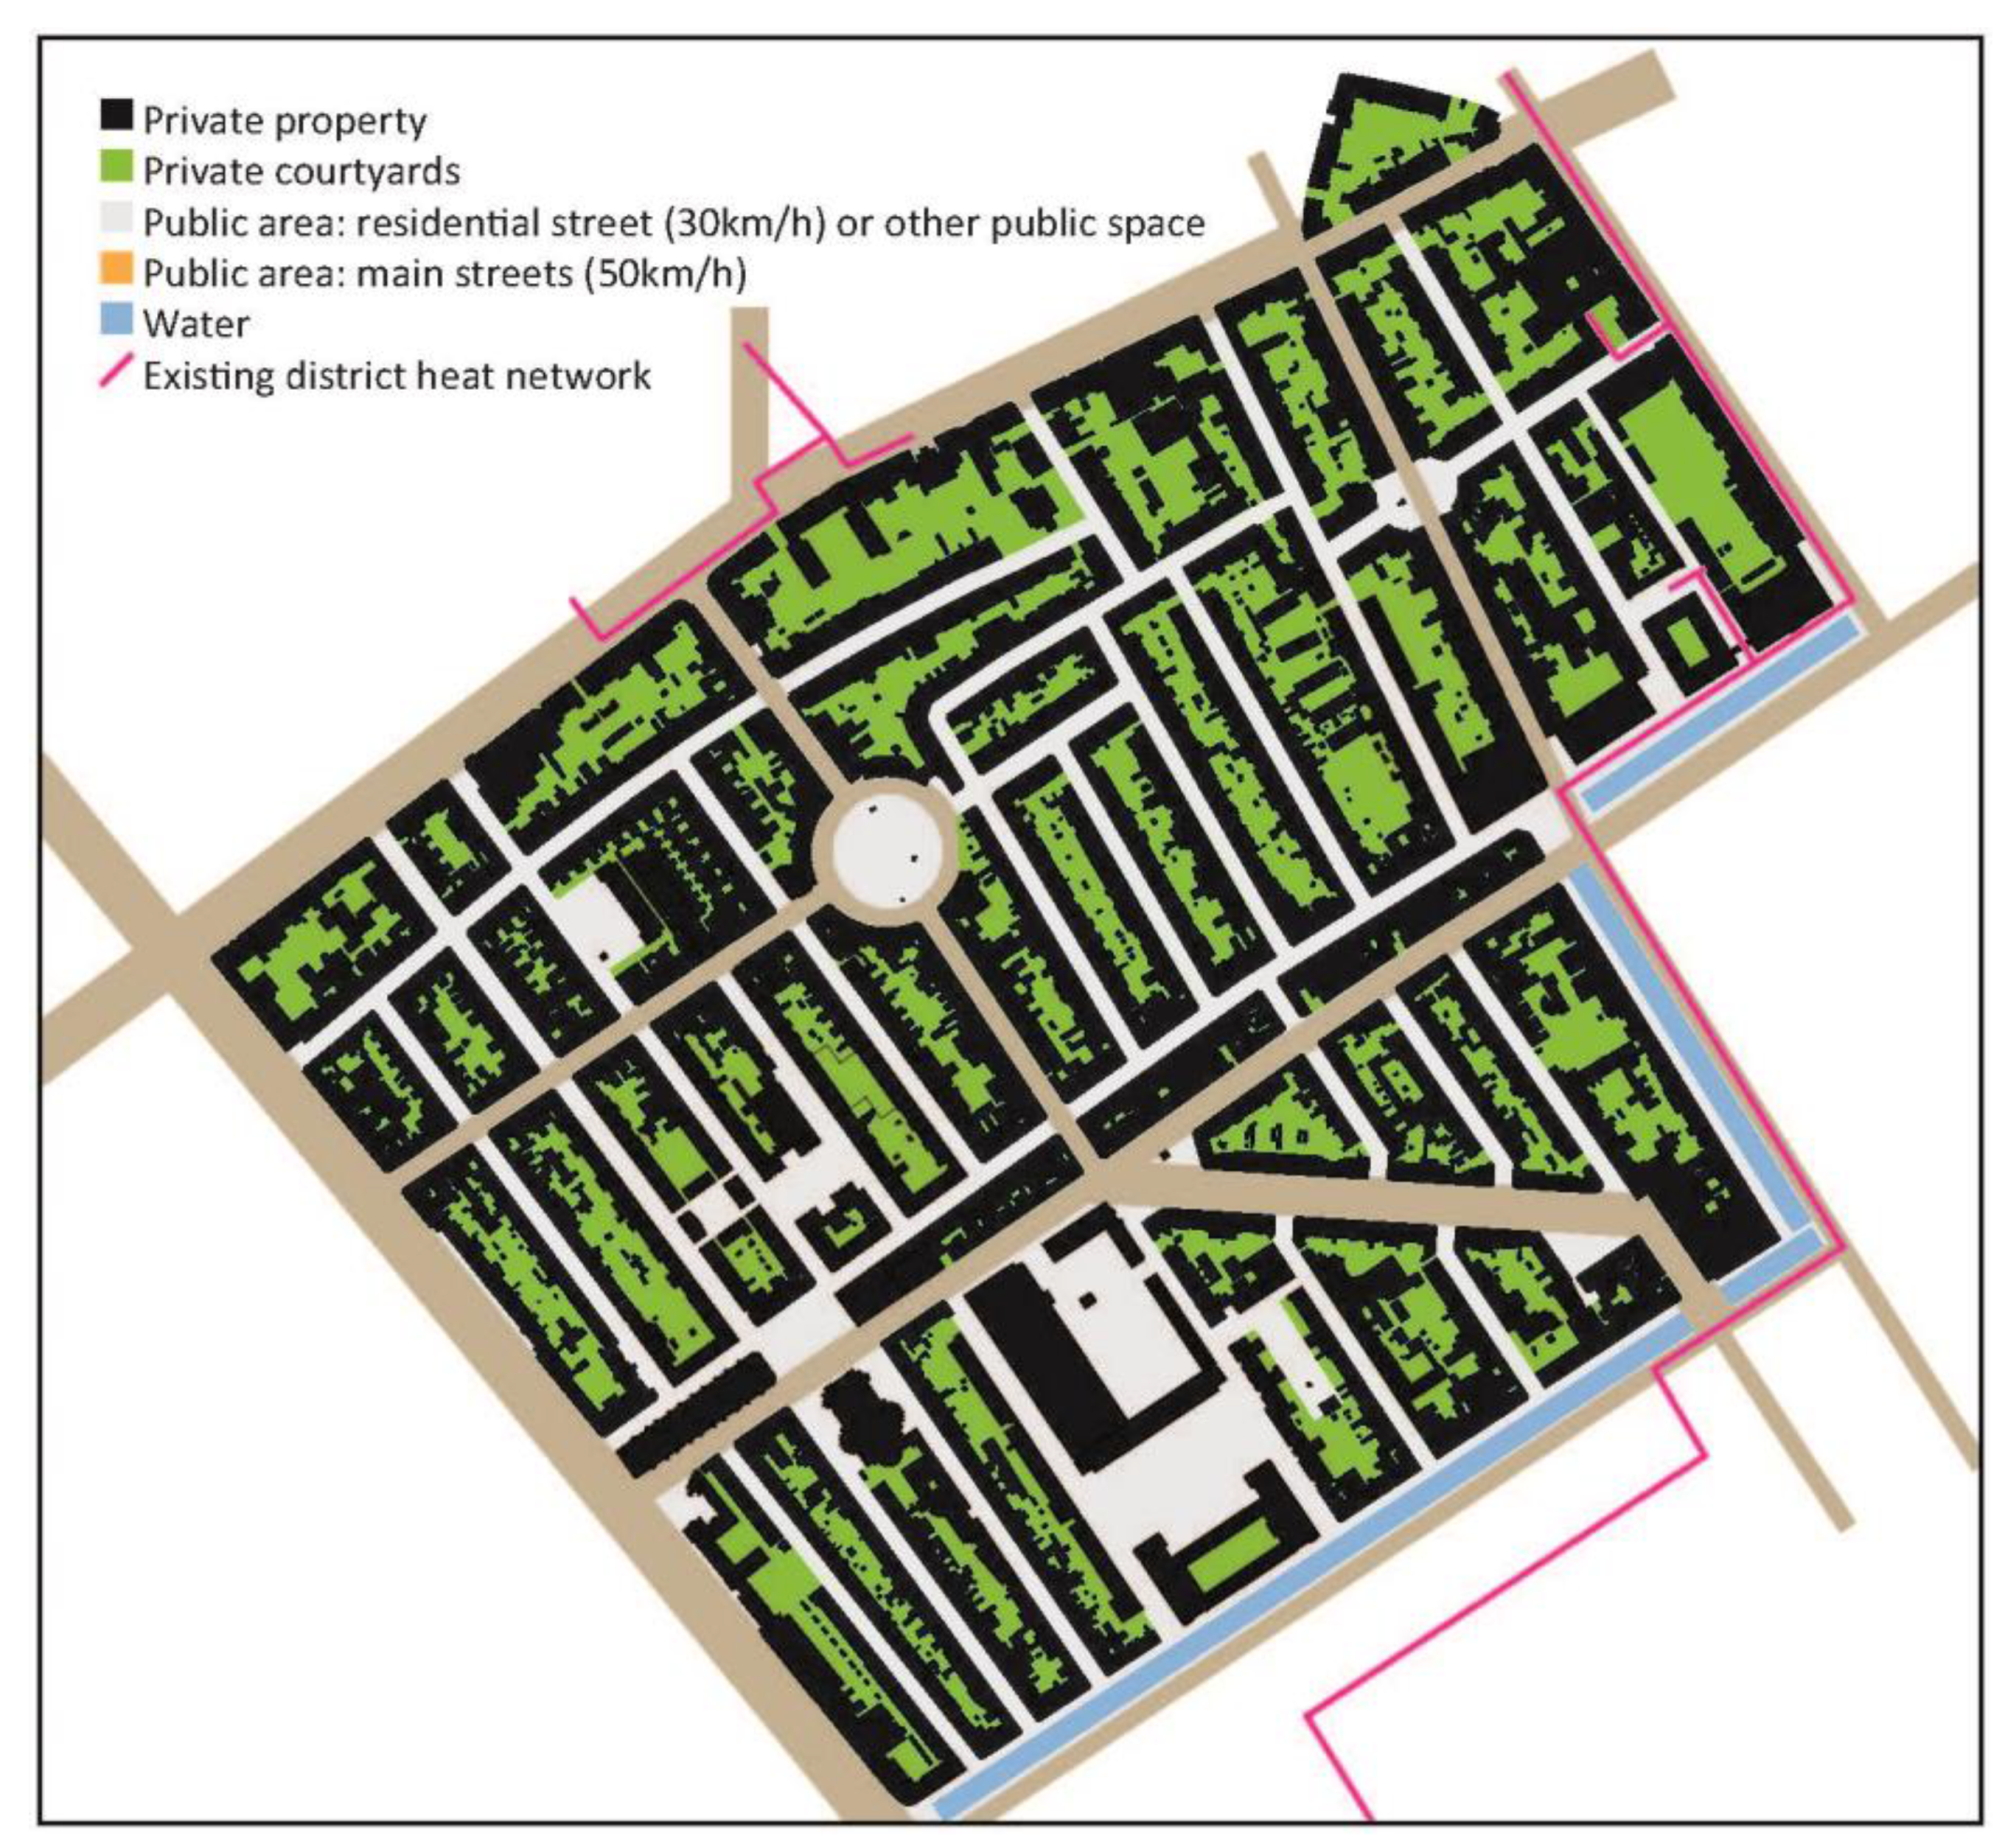
As
Figure 6, the aerial photo (
Figure 1) and historic maps (
Figure 3) show, traditionally public domain and private property are clearly divided by the building line. Facades are built on this building line. The buildings and courtyards are private property and the streets belong to the municipality. The first roads in these neighbourhoods generally followed ownership of strip fields, waterways and morphology of the landscape. The width of building plots are usually 6 to 8 m and the depth of the plot is related to the distance between the ditches. The depth of the building is normally 11 to 12 m, often with an built extension at the back. Entrepreneurs (
Bouwgrondmaatschappij) usually owned one or more fields, laid out the street in the middle of a strip field and parcelled the ground. Small contractors bought two to ten plots to construct townhouses and sold them to the middle class. Inside the perimeter urban blocks were often small units for poor people who could not afford a townhouse with a front door on the street. The orientation of the streets follows the direction of the original strip fields and pattern of canals and ditches.
There was some legislation on the size of the streets in relation to the height of the facade in the local Politieverordening but entrepreneurs had the possibility to change this by negotiating with the municipality. Usually townhouses are three storeys with a pitched roof and the street is about 10 m wide. Some streets are 14 to 20 m wide because they have a streetcar. Municipalities tightened legislation after 1887 on street plans and after the fin de siècle they began designing their own street patterns. Around 1890 roofs in Den Haag and Rotterdam changed to cheaper flat roofs. Later on, main roads were laid out along these neighbourhoods.
Occasionally and exceptionally an ideal street pattern was designed following examples of neighbourhoods in great European metropoles of the 19th century, street grids with a rond-point in their centre and a monument. The most abstract street pattern in these neighbourhoods is the deformed grid with perimeter blocks and neighbourhood enclosure streets between the main roads. A neighbourhood enclosure street is sometimes linear with a streetcar or forms a cross with a rond-point in its centre accommodating a monumental building, statue, fountain or small park. Public buildings are often found along main roads and shops are traditionally located along the crossing neighbourhood enclosure streets. Public buildings stand along main roads on the edge of the neighbourhood. Often these two types of streets are connected to older streets and roads that connect the neighbourhood to the city. In the case of the Zeeheldenkwartier, the edge of the neighbourhood along canals and main roads were already constructed before the grid was laid out. Furthermore, streets patterns became enhanced with the introduction of automobiles and urban renewal projects. In the interbellum there was a monumental reconstruction of the Vondelstraat by the architect Berlage. Historic maps (
Figure 3) shows the irregularities of this abstract scheme. The small squares in the urban pattern are introduced in the urban renewal period.
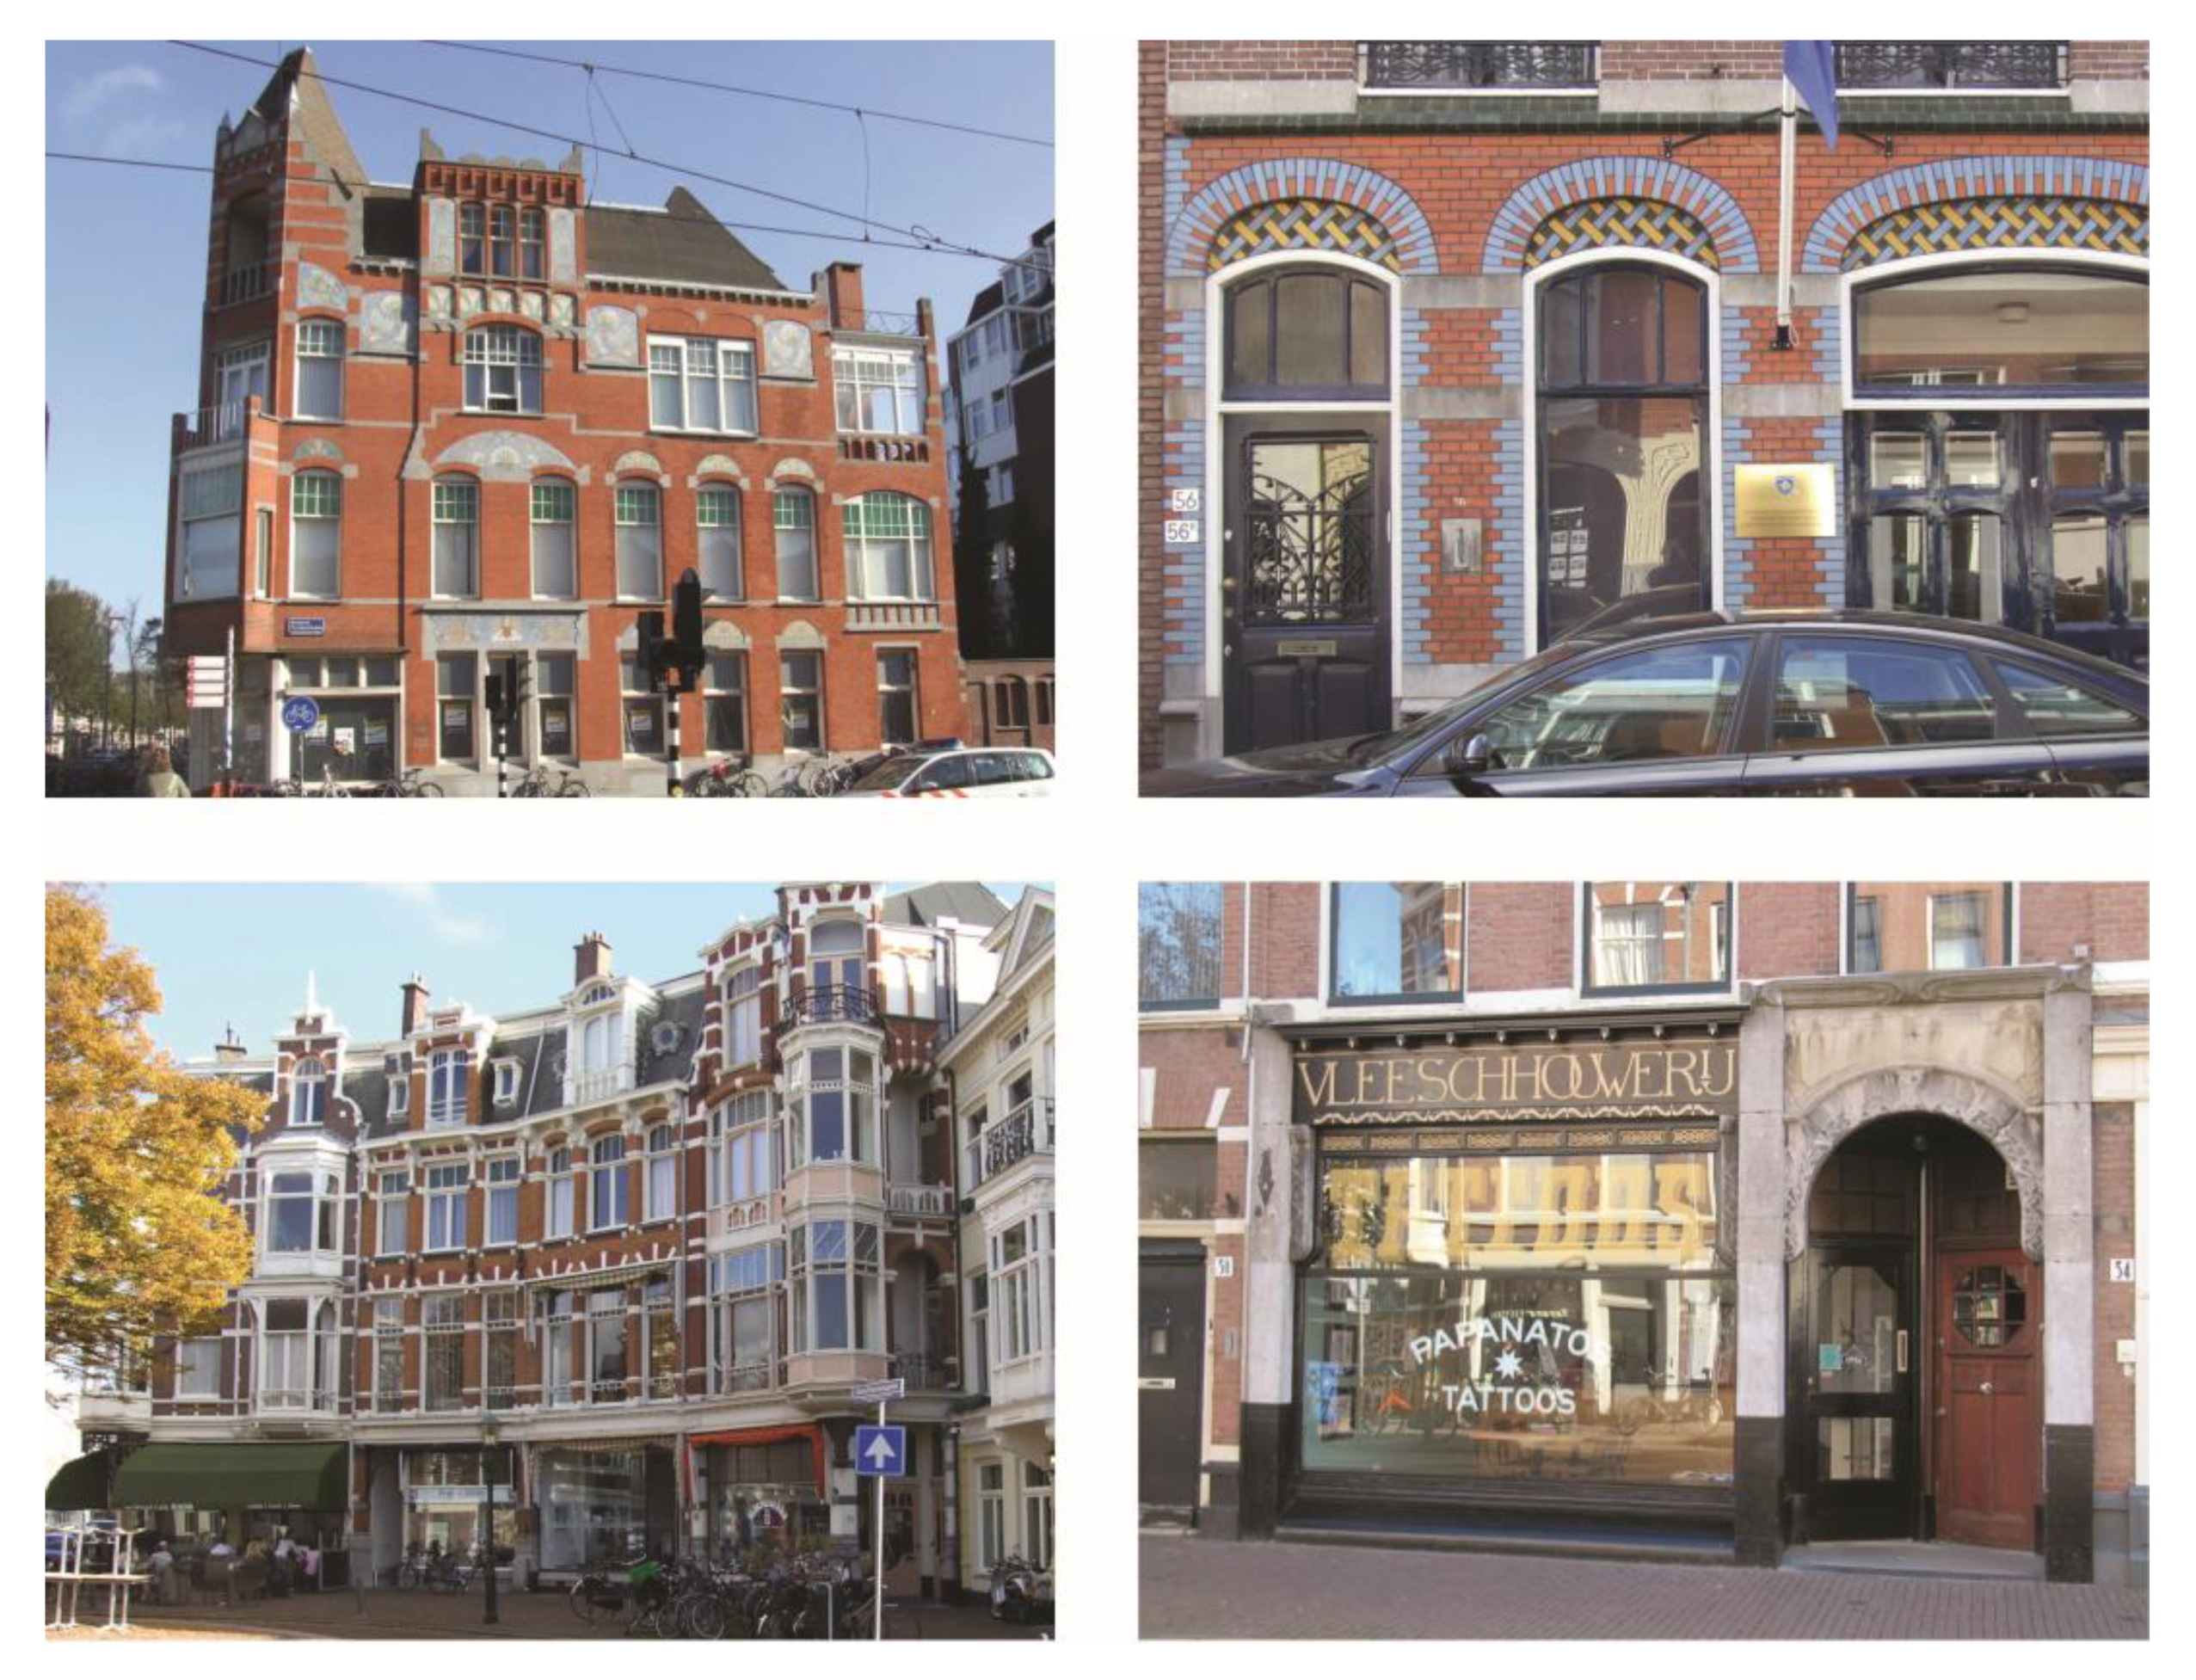
There is a strong cohesion between the brickwork townhouses with pitched roofs and narrow streets. This is an important characteristic of late 19th century neighbourhoods. It gives expression to the image of a neighbourhood [
43]. Problems with a heat network are: lack of urban space in the narrow streets for the secondary network; plants and storage capacity such as ecovats; possible but not easy to realise and expensive, and there is risk of damaging the brickwork structure of townhouses in narrow streets. Problems with all electric and heat pump are noise and vibrations in these dense neighbourhoods and the cost of the expensive renovation to EPC label B.
4.2. Building Ages and Types
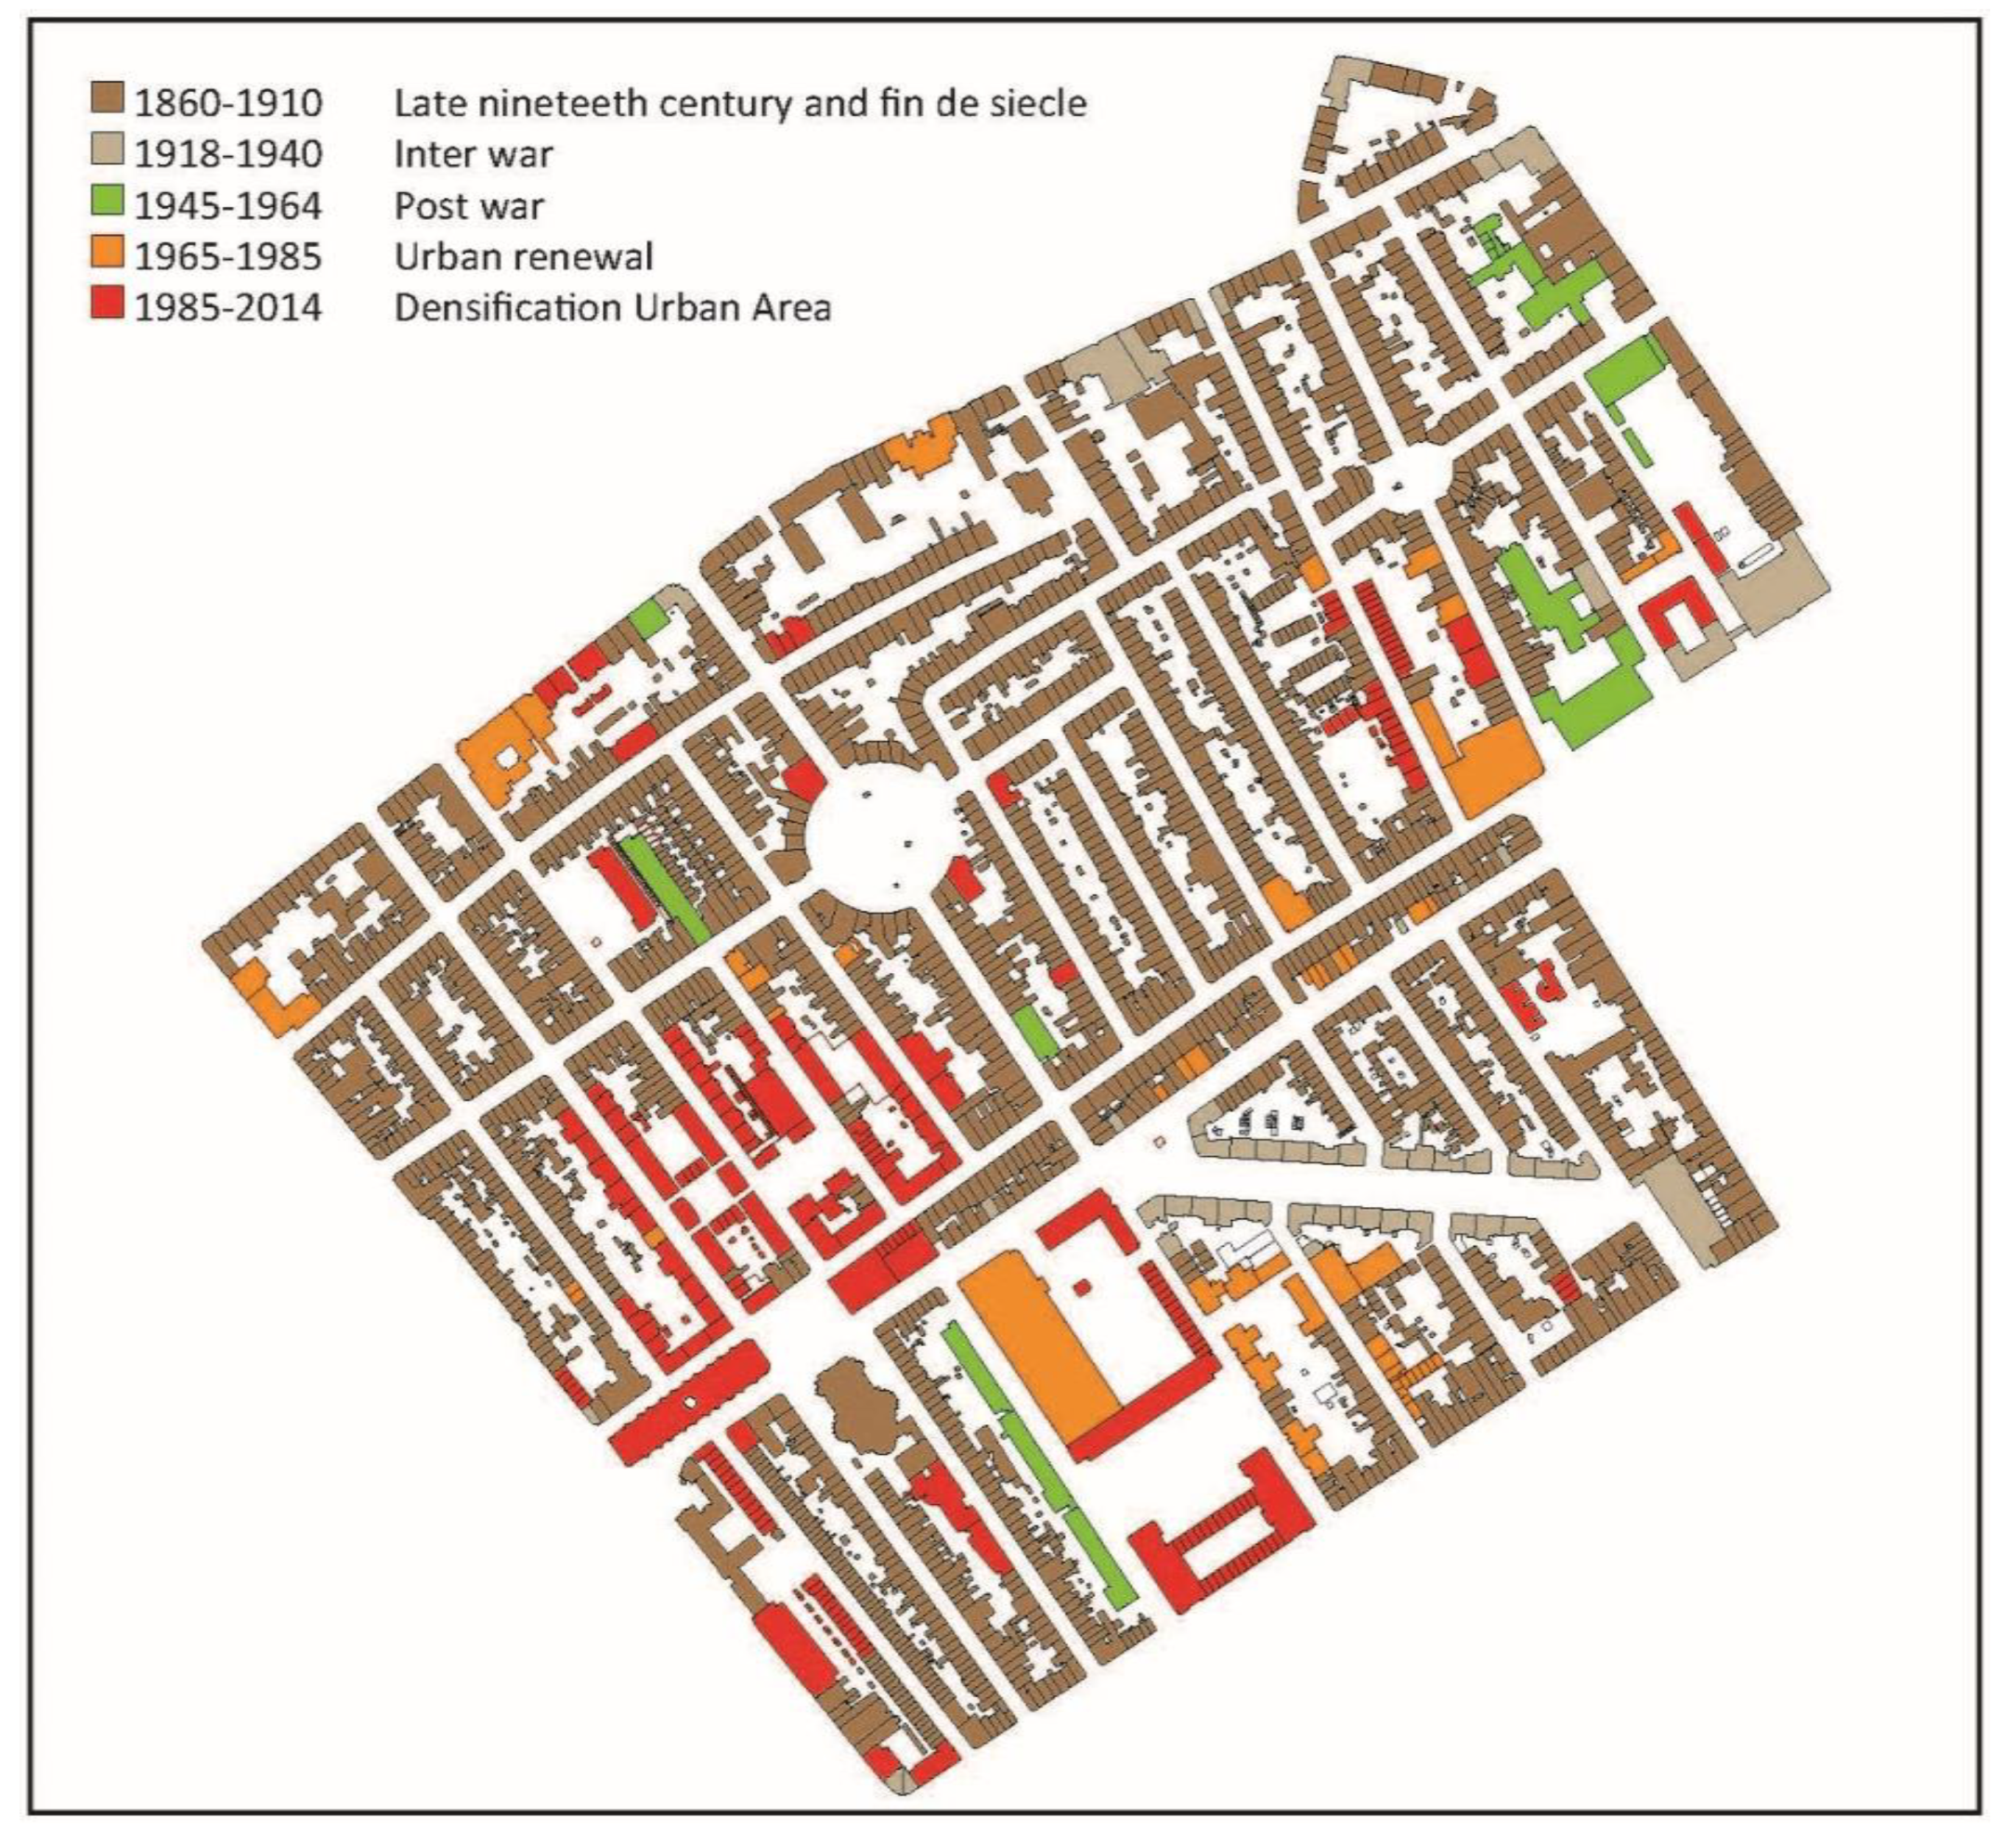
The map of
Figure 7 shows the periodisation of buildings and their typology. The most dominant residential building is the brickwork townhouse from the period 1860–1910. By determining age and type of the housing stock (in relation to energy efficiency) the Agentschap NL and Ministerie van Binnenlandse Zaken en Koninkrijksrelaties (2011) developed a classification system to reference houses based on major changes in legislation [
19]. This periodisation is used by architectural historians and municipalities for various publications and is linked to important changes in society, which lead to changes in legislation on buildings and urban planning. Important milestones on building legislation are the local
Politieverordening of the 19th century, local
Bouwverordening 1905-45,
Bouwverordening 1946–1991,
Bouwbesluit 1992–2020, and
Besluit Bouwerken Leefomgeving 2021 [
43].
Types of houses are related to the kind of neighbourhood, plot size, construction period, prevailing legislation, materials used, shape of the roof, and form of habitation. Periodisation is often linked to great changes in society such as world wars and changes to the electoral system. These events usually lead to changes in legislation and building culture. The hybrid neighbourhoods of the late 19th century usually comprise buildings from the period 1870 to 1910, when the process of suburbanisation and city forming began in The Netherlands. Subsequently there has been some urban renewal during 1965-84. Most townhouses have brickwork load bearing masonry construction and facade s, wooden floors, and a pitched roof. The urban renewals have concrete load bearing construction and flat roofs. Morphology of the neighbourhood and buildings are important to determine whether there is room for a heat network or flat roofs for PV(T) panels and/or whether the inner areas are public or private with enough space for a heat pump. Buildings from the period 1860-90 usually have pitched roofs but following 1890 they also have flat roofs. Urban renewals and new public buildings also usually have flat roofs. Older public buildings such as churches and schools commonly have impressive roofs. There are possibilities for PV(T) panels on flat roofs.
Energy performance of the buildings in original state is EPC label F or G. After the discovery of a natural gas field in Slochteren in 1959, it was decided to lay out a national gas network. Between 1960 and 1965 central heating with natural gas boilers was introduced in residential buildings and became a standard for all houses by 1967. For the first time in 1975 heat resistance (Rc) for facade s and roofs of =>1.29 m2K/W was demanded. Most old townhouses in hybrid neighbourhoods were constructed in the period of the local Politieverordening. Most townhouses and urban renewals in the Zeeheldenkwartier are heated with natural gas boilers and a hydronic heat distribution system of 90-degrees Celsius to all parts of the dwelling using radiators in each room, though some still have gas heaters.
Architectural value of buildings and urban ensemble is usually well protected by the municipality. The neighbourhood zoning plan of most hybrid neighbourhoods is based on maintaining existing buildings. Furthermore, these neighbourhoods are often designated areas by the municipality because of their architectural and urban values. This means that only a box-in-box-renovation is allowed to have a more energy efficient building and no heat pumps are allowed on the street side facade. Residents feel proud of the architectural quality of their neighbourhood. Next to the zoning plan and the periodisation is the architectural valuation of the buildings in the area. Townhouses are usually not listed by the municipality because of their architectural quality. Only neighbourhood public buildings are municipality-listed and some are nationally-listed as buildings with architectural value. Because of the quality and variation of facade architecture and ownership, a box-in-box-renovation of townhouses is recommended.
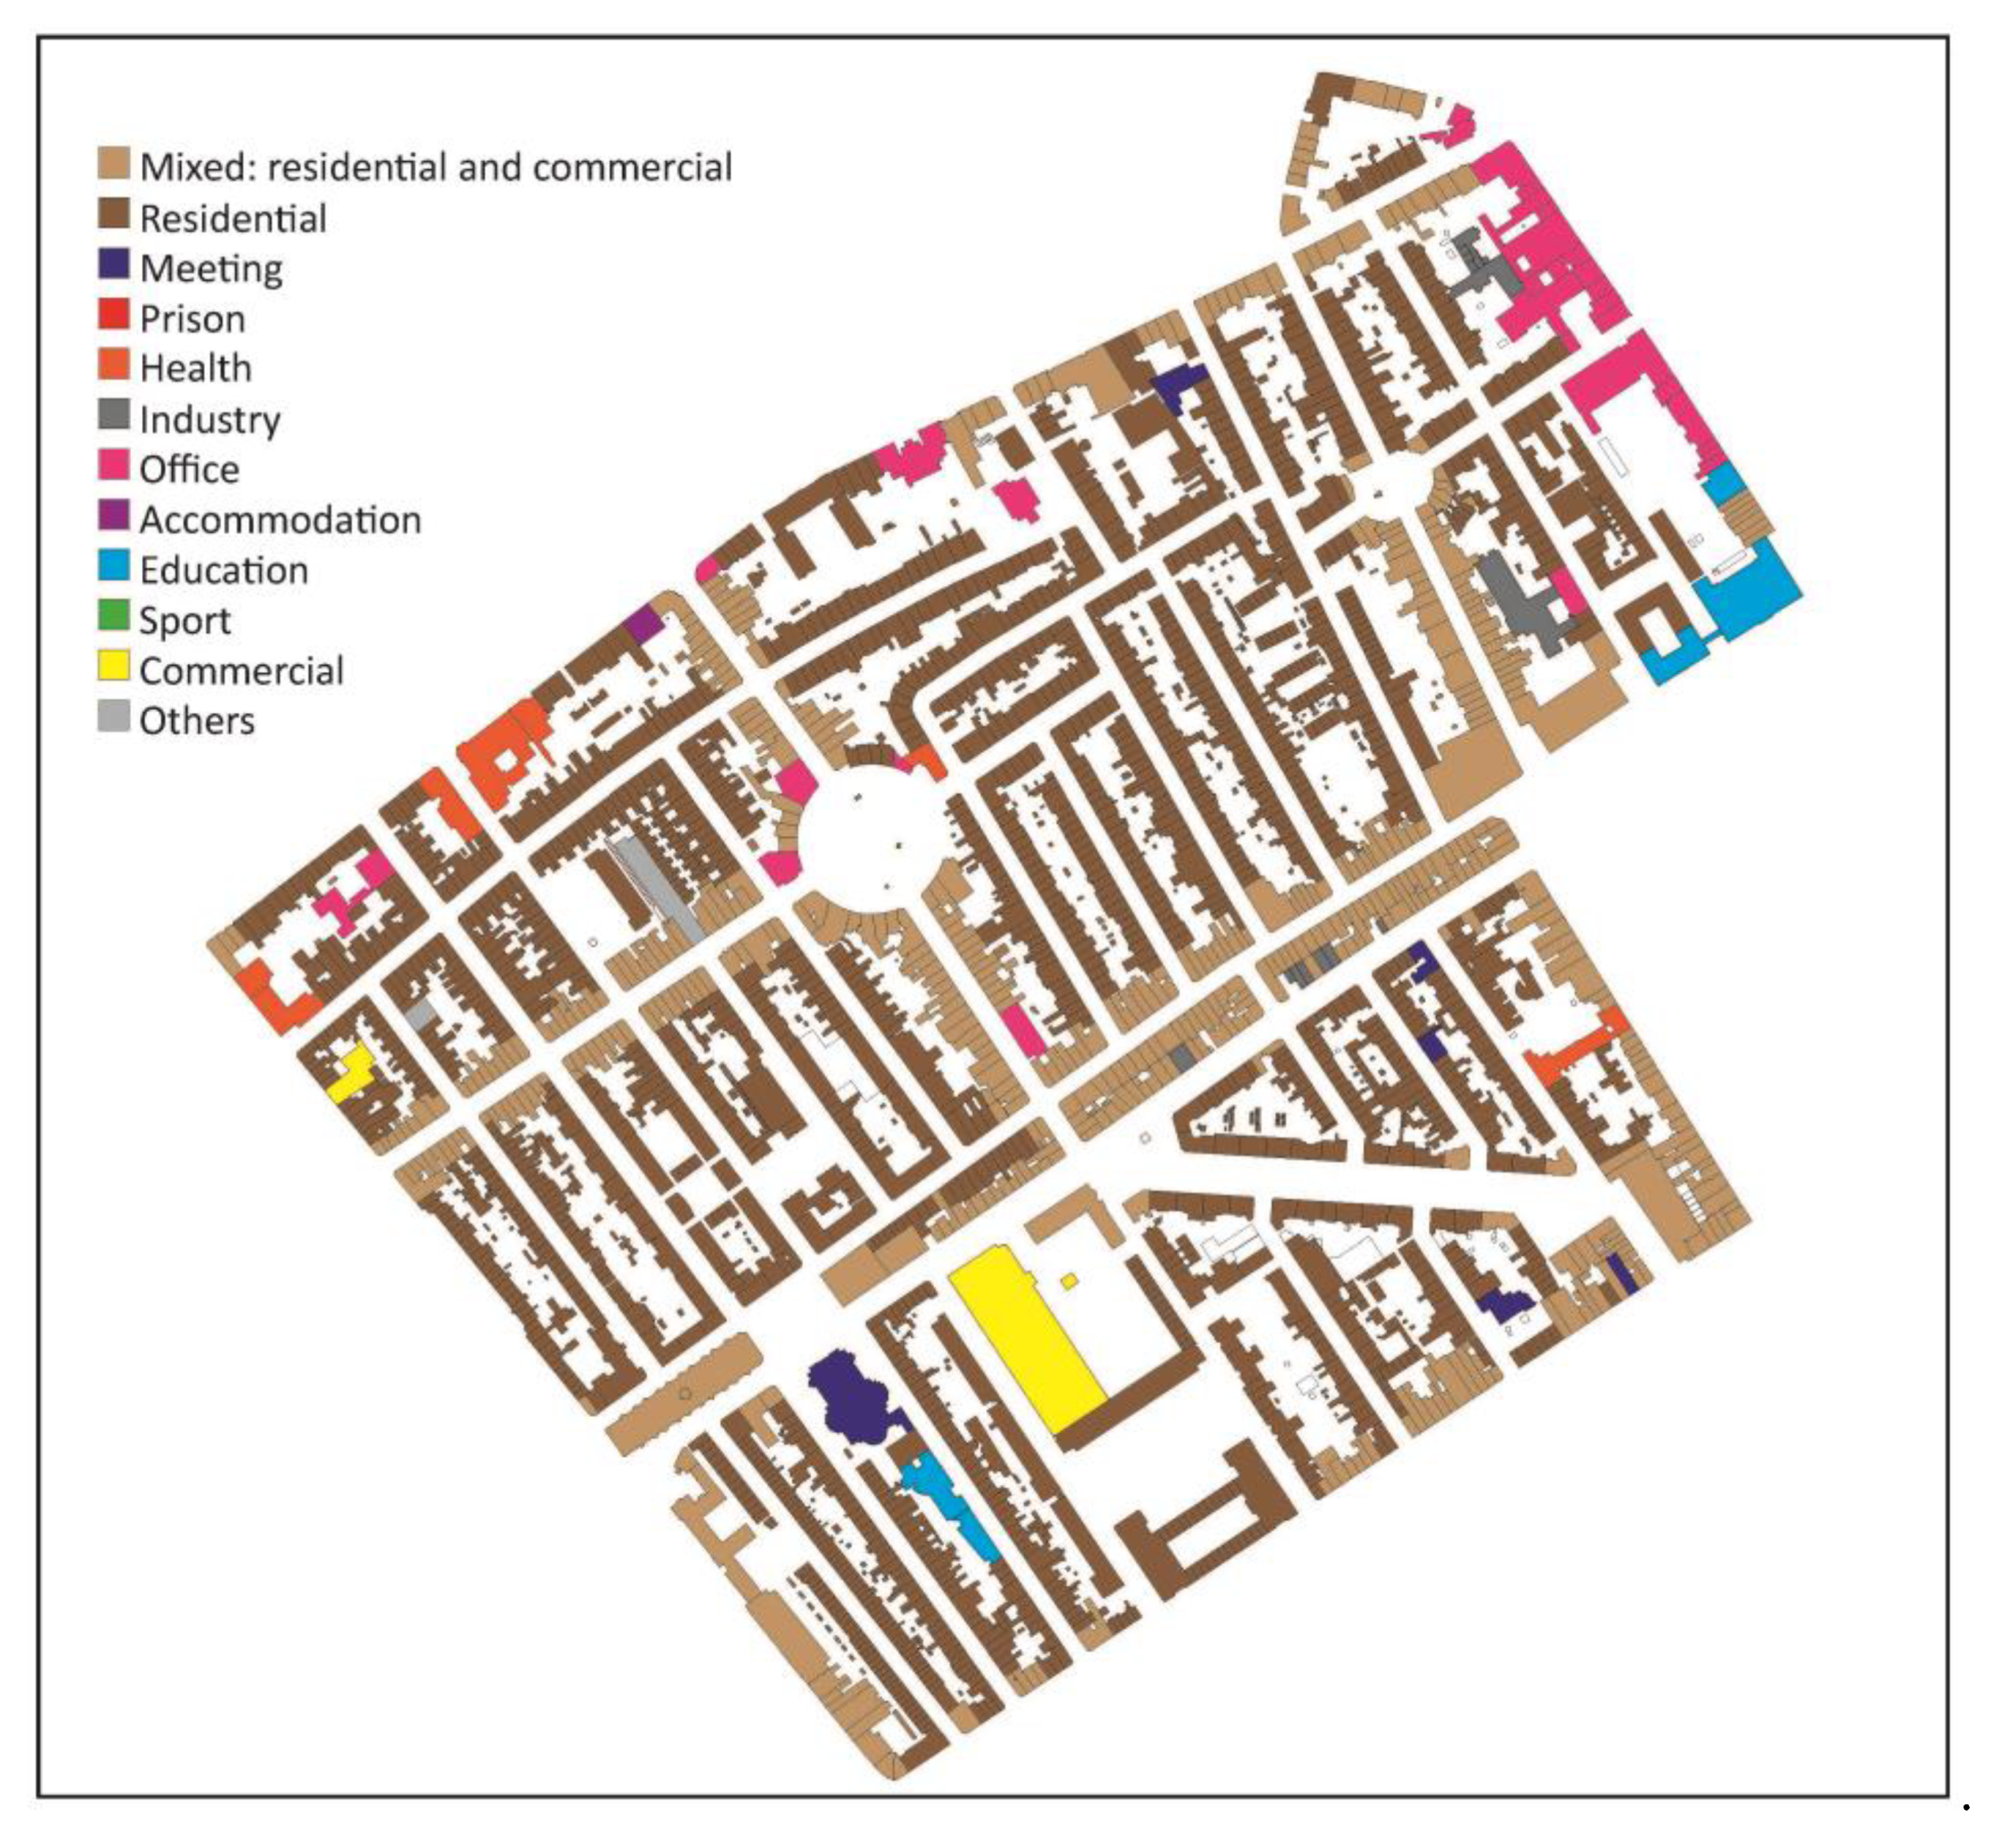
4.3. Use of buildings
Figure 8 shows is a relation between the building type, its use or function and the kind of street it is on. The function of a building is defined in the building act (Bouwbesluit) [
44] as either for living, meeting, detention, health, industry, office, guest accommodation, educational, sport, shop or another functionality. All of these functions are recorded in neighbourhood zoning plans. The first suburbanisation of old neighbourhoods are the modern hybrid neighbourhoods of today’s cities. Usually shops, small businesses, restaurants, bars, and guest accommodations are found along the neighbourhood’s enclosure streets. Along the main streets and edge of the neighbourhood are supermarkets and public amenities such as schools and healthcare facilities.
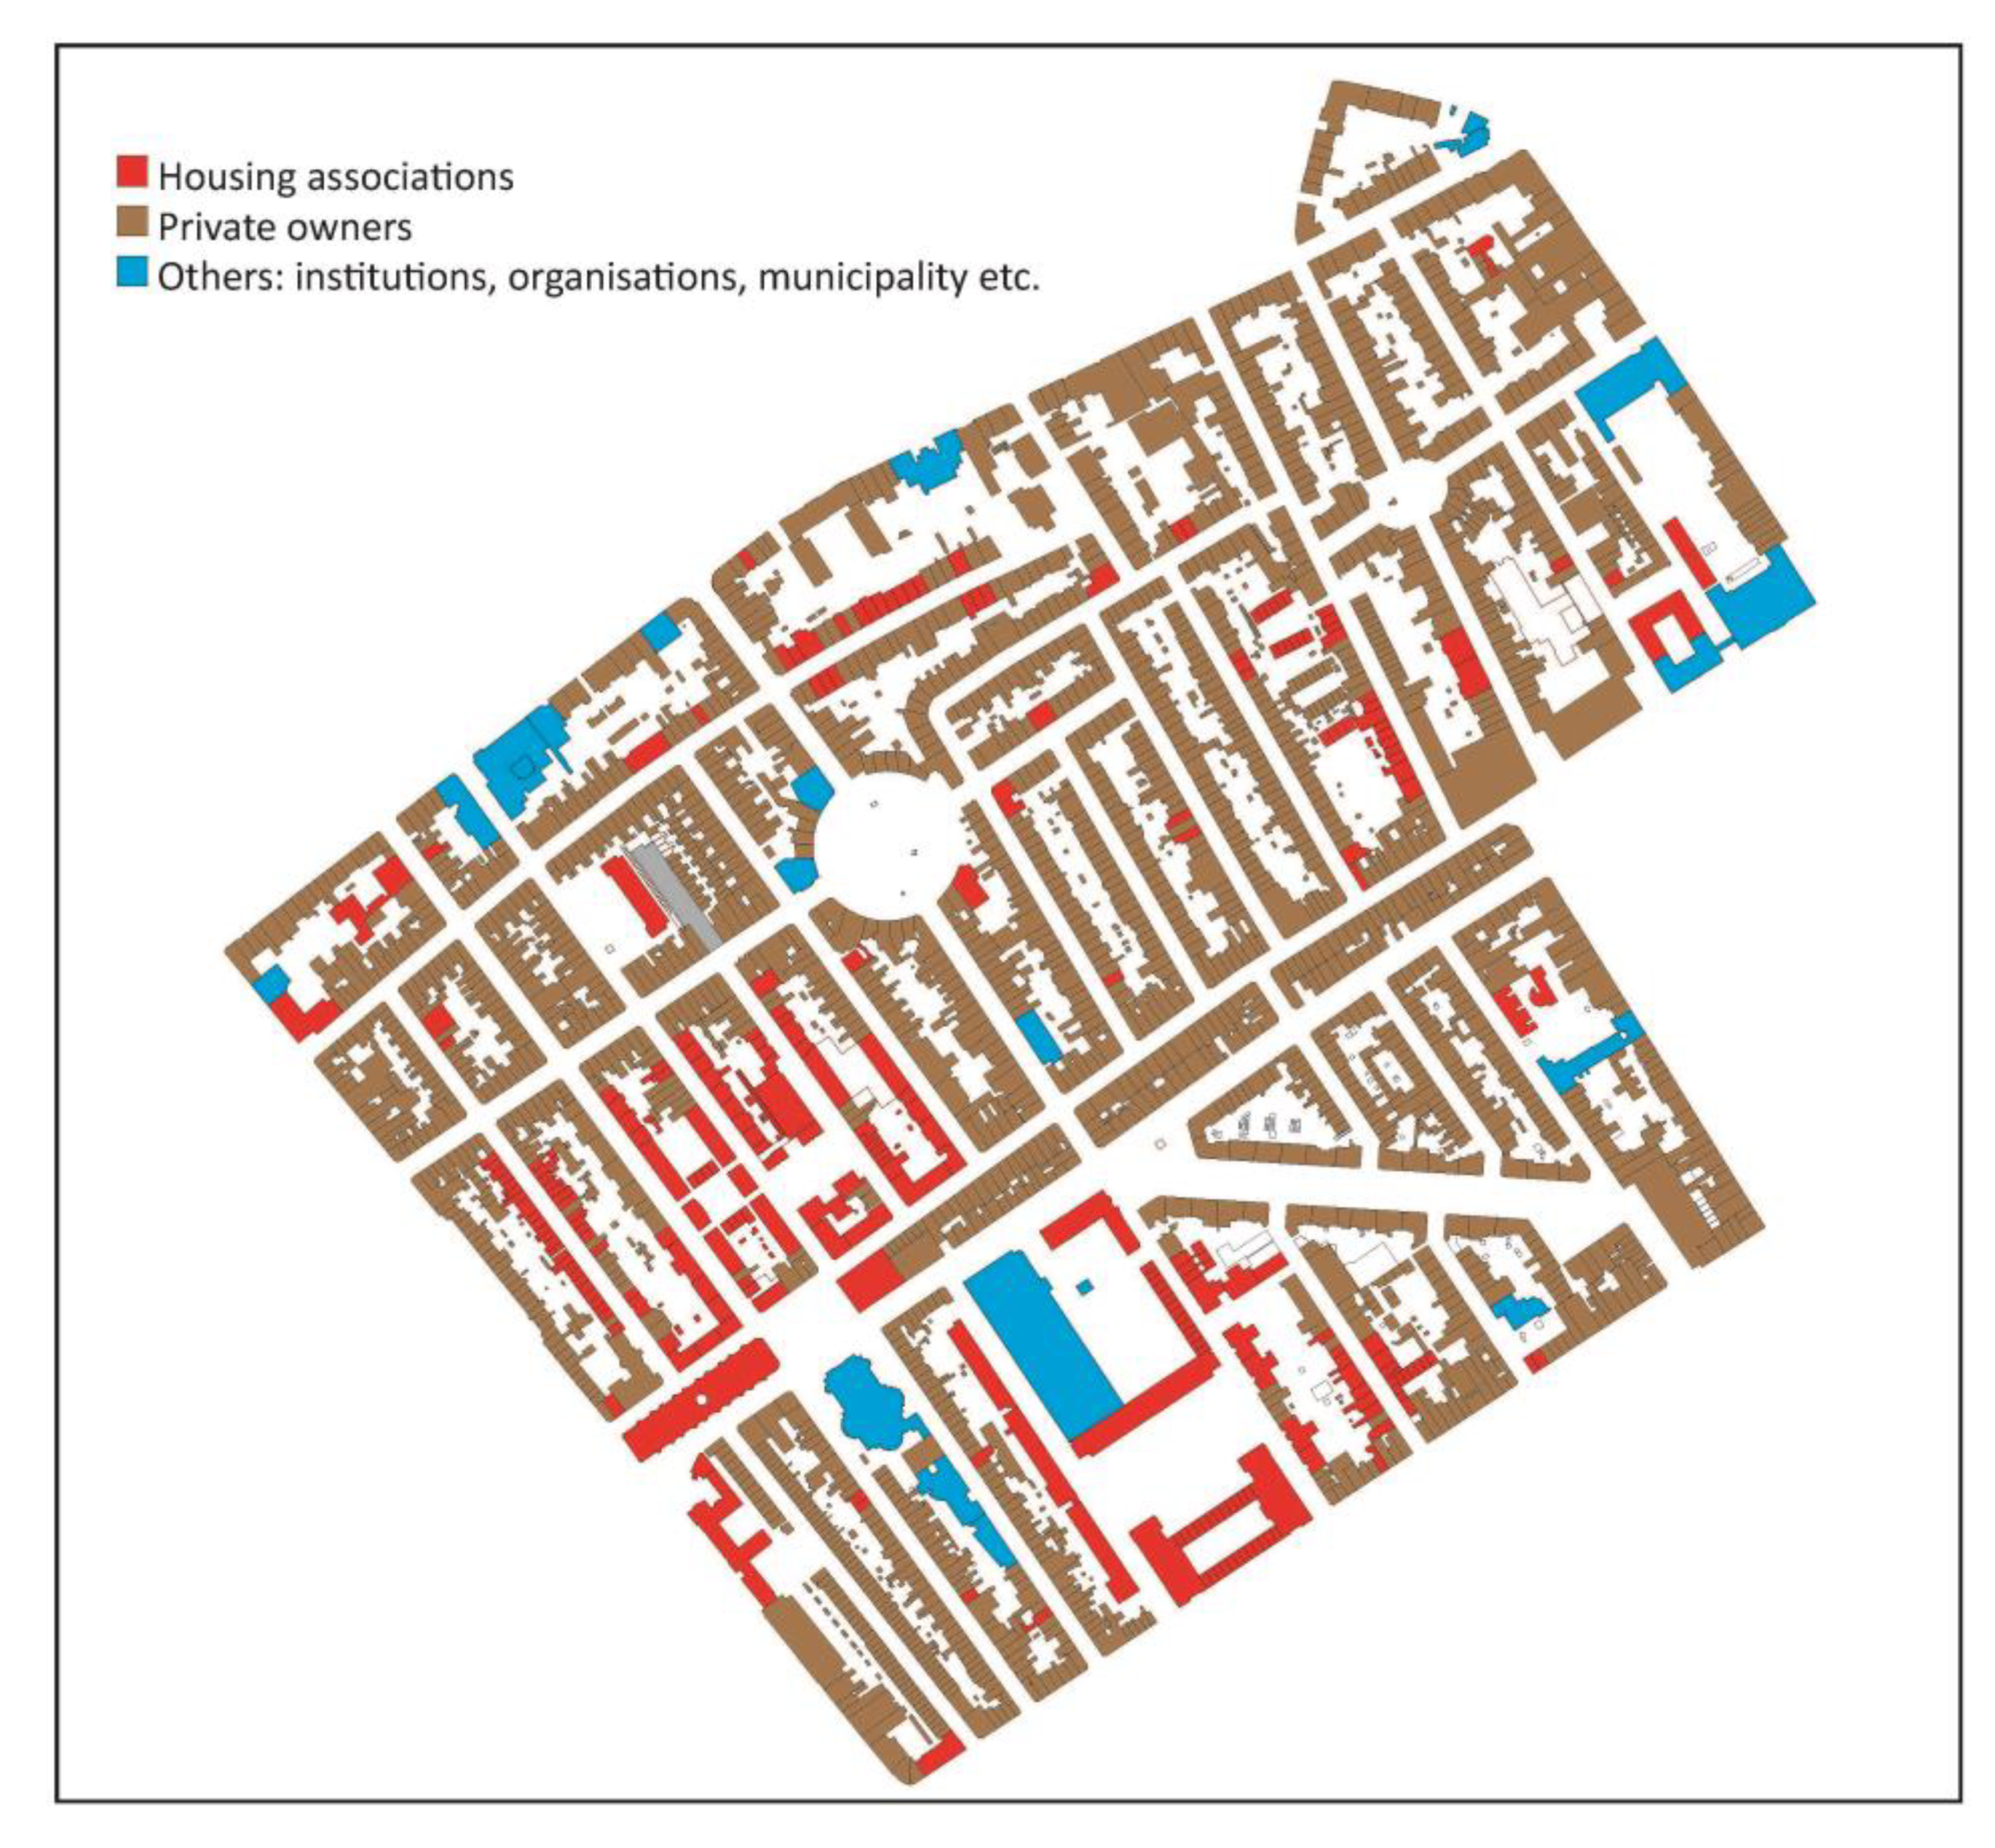
4.4. Ownership of Houses
The map of
Figure 9 shows that the old townhouses are predominantly private owned while urban renewals are usually housing association rentals. The traditional Dutch down-up-house with a ground and an upper floor apartment (beneden-boven-woning) and a front door directly on the street was designed in the 19th century and is also usually private owned,
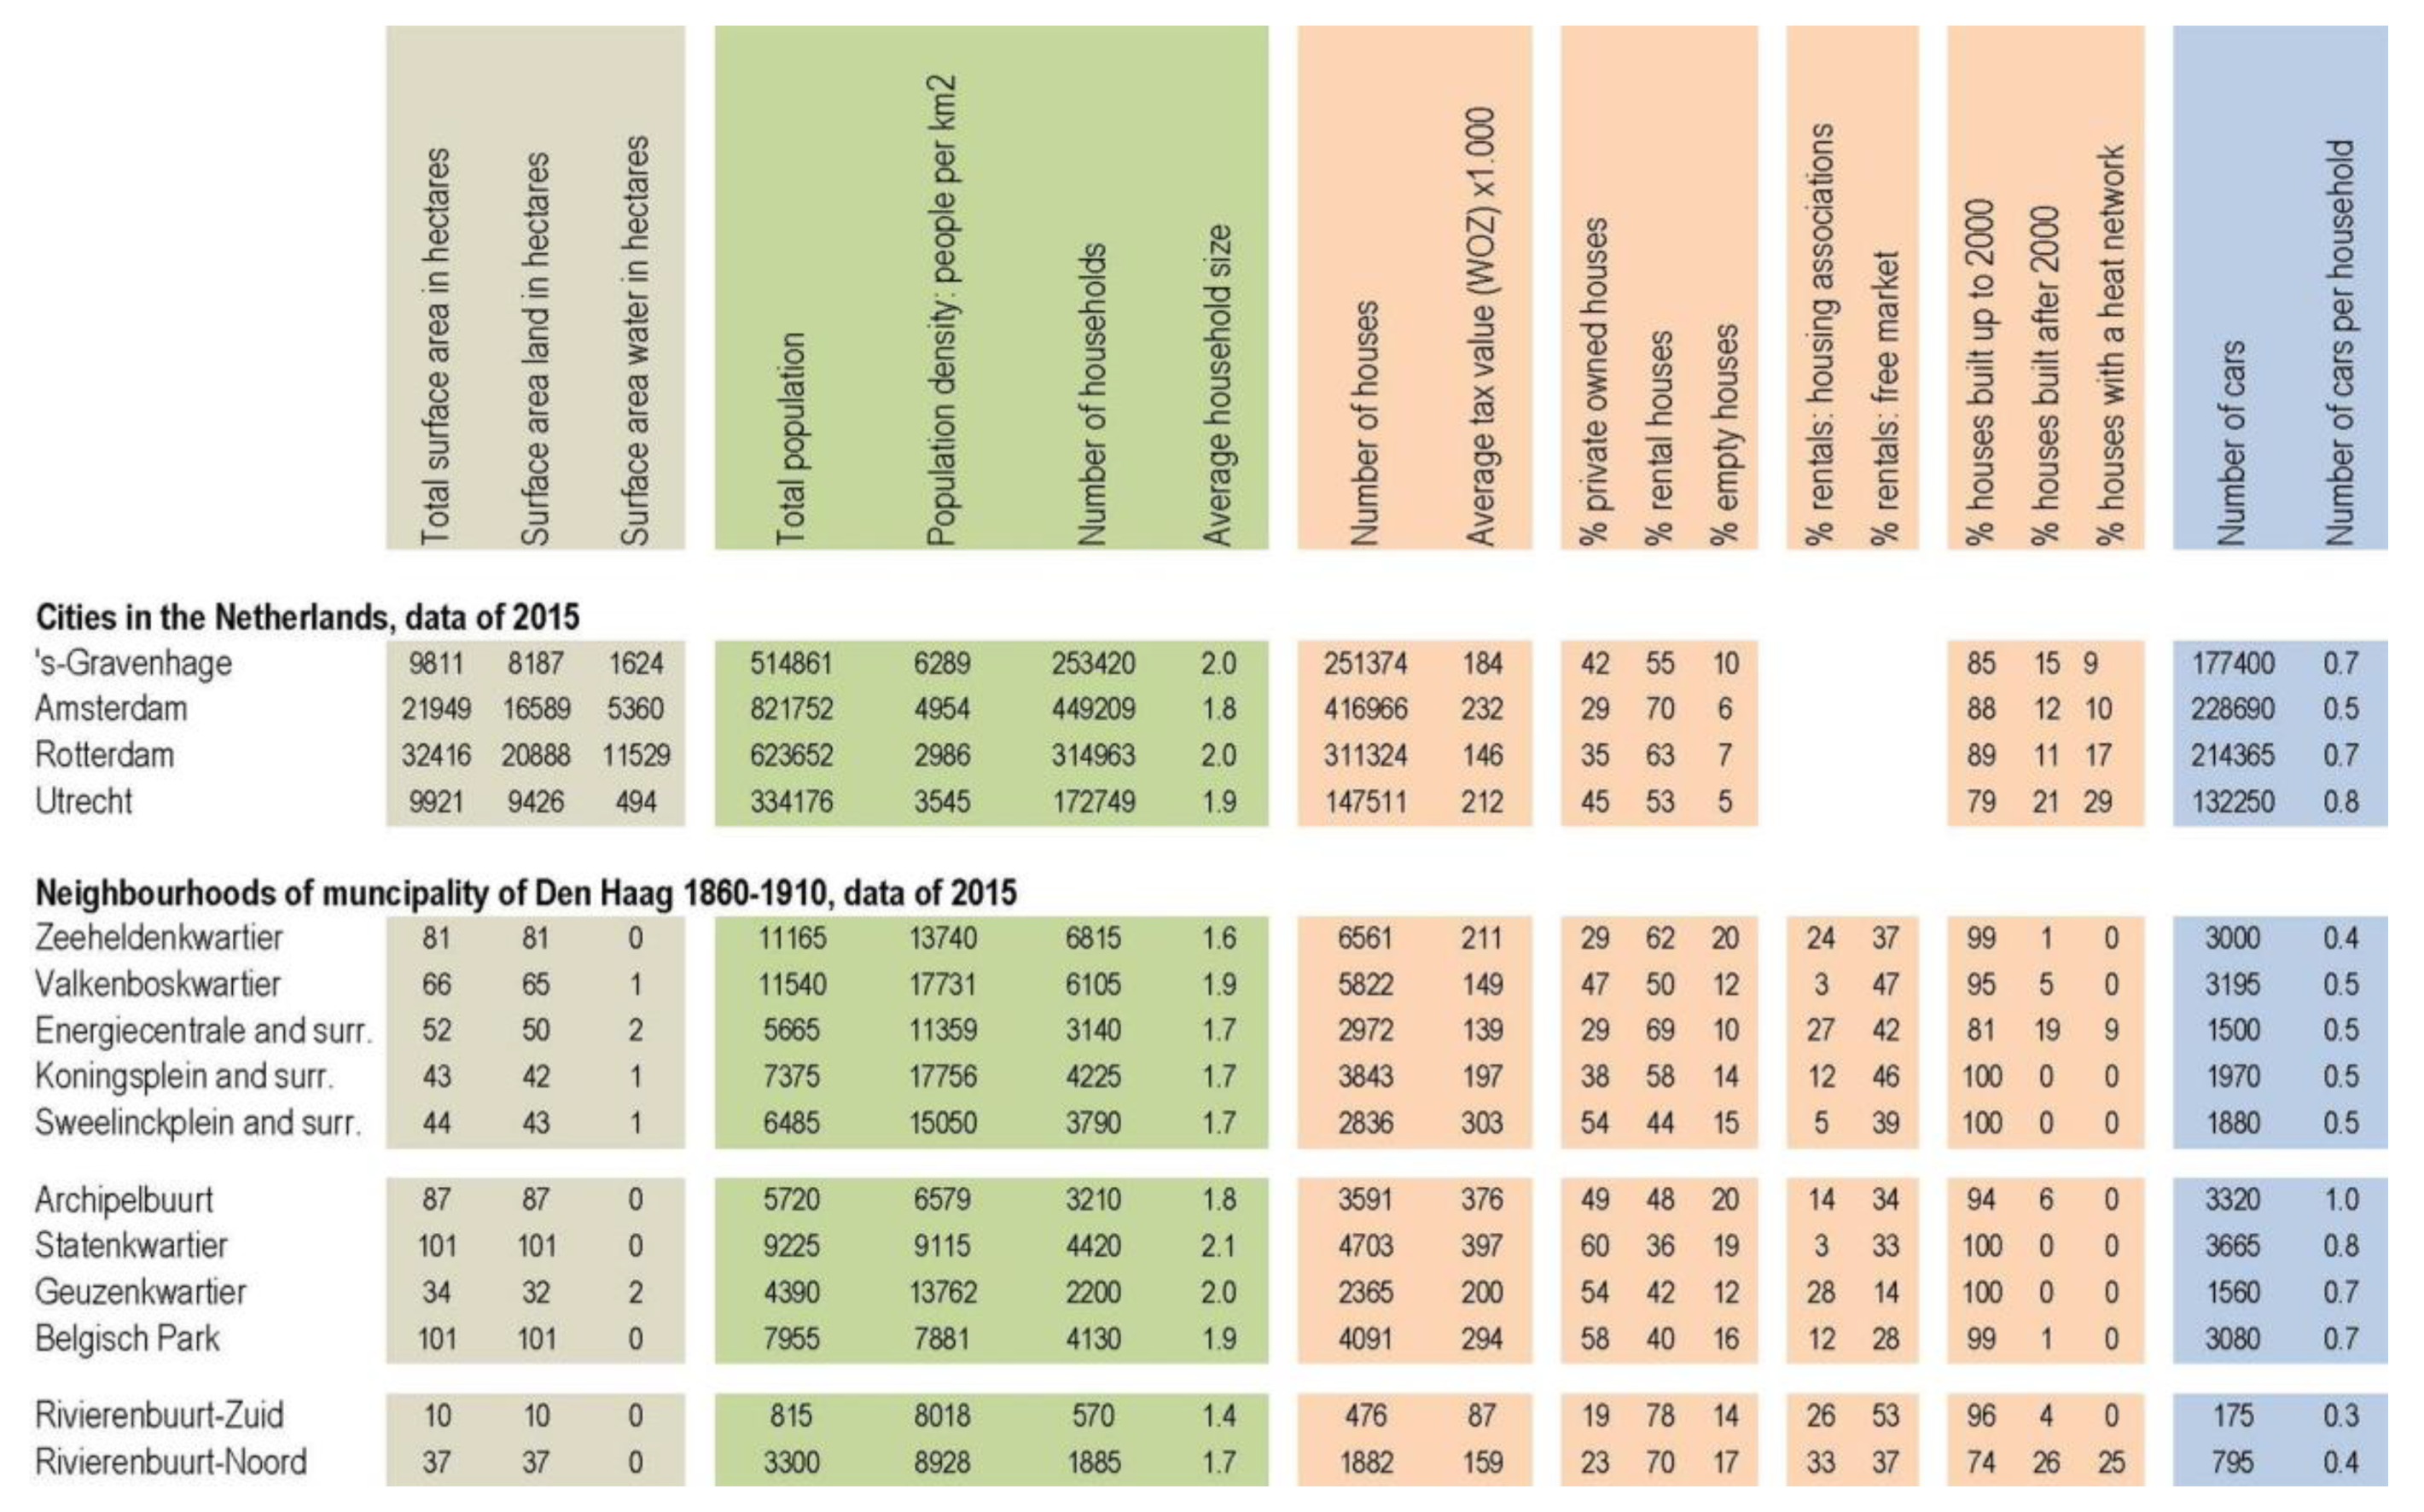
Figure 8 shows the location of these building types. As pointed out, data from 2015 is incorrect, see
Appendix A. Private owned townhouses are not inhabited by the owners themselves. Those houses became non-registered rentals. The privately owned townhouses are often bought and divided into three or four small apartments for rentals (so called ‘buy-to-let’). According to the CBS about 80% of the landlords own just one house that is split into different units [
45]. About 11.000 landlords own five or more houses and of this group 250 landlord have fifty or more houses. These houses are usually located in the urban regions of The Netherlands or tourist cities. For example, in Groningen 15% of the houses are private rentals, Den Haag 13%, Amsterdam 12%, and Vaals 1%. The average in The Netherlands is 6%. A hybrid neighbourhood such as the Zeeheldenkwartier is 62% private rental (
Appendix A). Other data from 2018 shows that 90% of houses in the Zeeheldenkwartier are apartments, just 10% townhouses (
Appendix B), and 16% of all the dwellings were uninhabited. By comparison nationally this is 36%, 64% and 5% [
39].
Appendix B shows young inhabitants and small households living in small apartment units or split townhouses of 1 to 3 rooms without a lift. By 2018 the population had grown to 11,853 inhabitants and 6767 households. There were 3918 single households, 1557 households without children, 839 households with children and 453 single-parent households with children [
46]. Other data shows the growing population and density to 14,343 people per km
2 (Netherlands 507). The address density showed 6544 per km
2 (Netherlands 1978), 69% of residents unmarried (Netherlands 48%) and 20% married (Netherlands 39%). Furthermore, 39% of the population is 25 to 45 years old (Netherlands 25%).
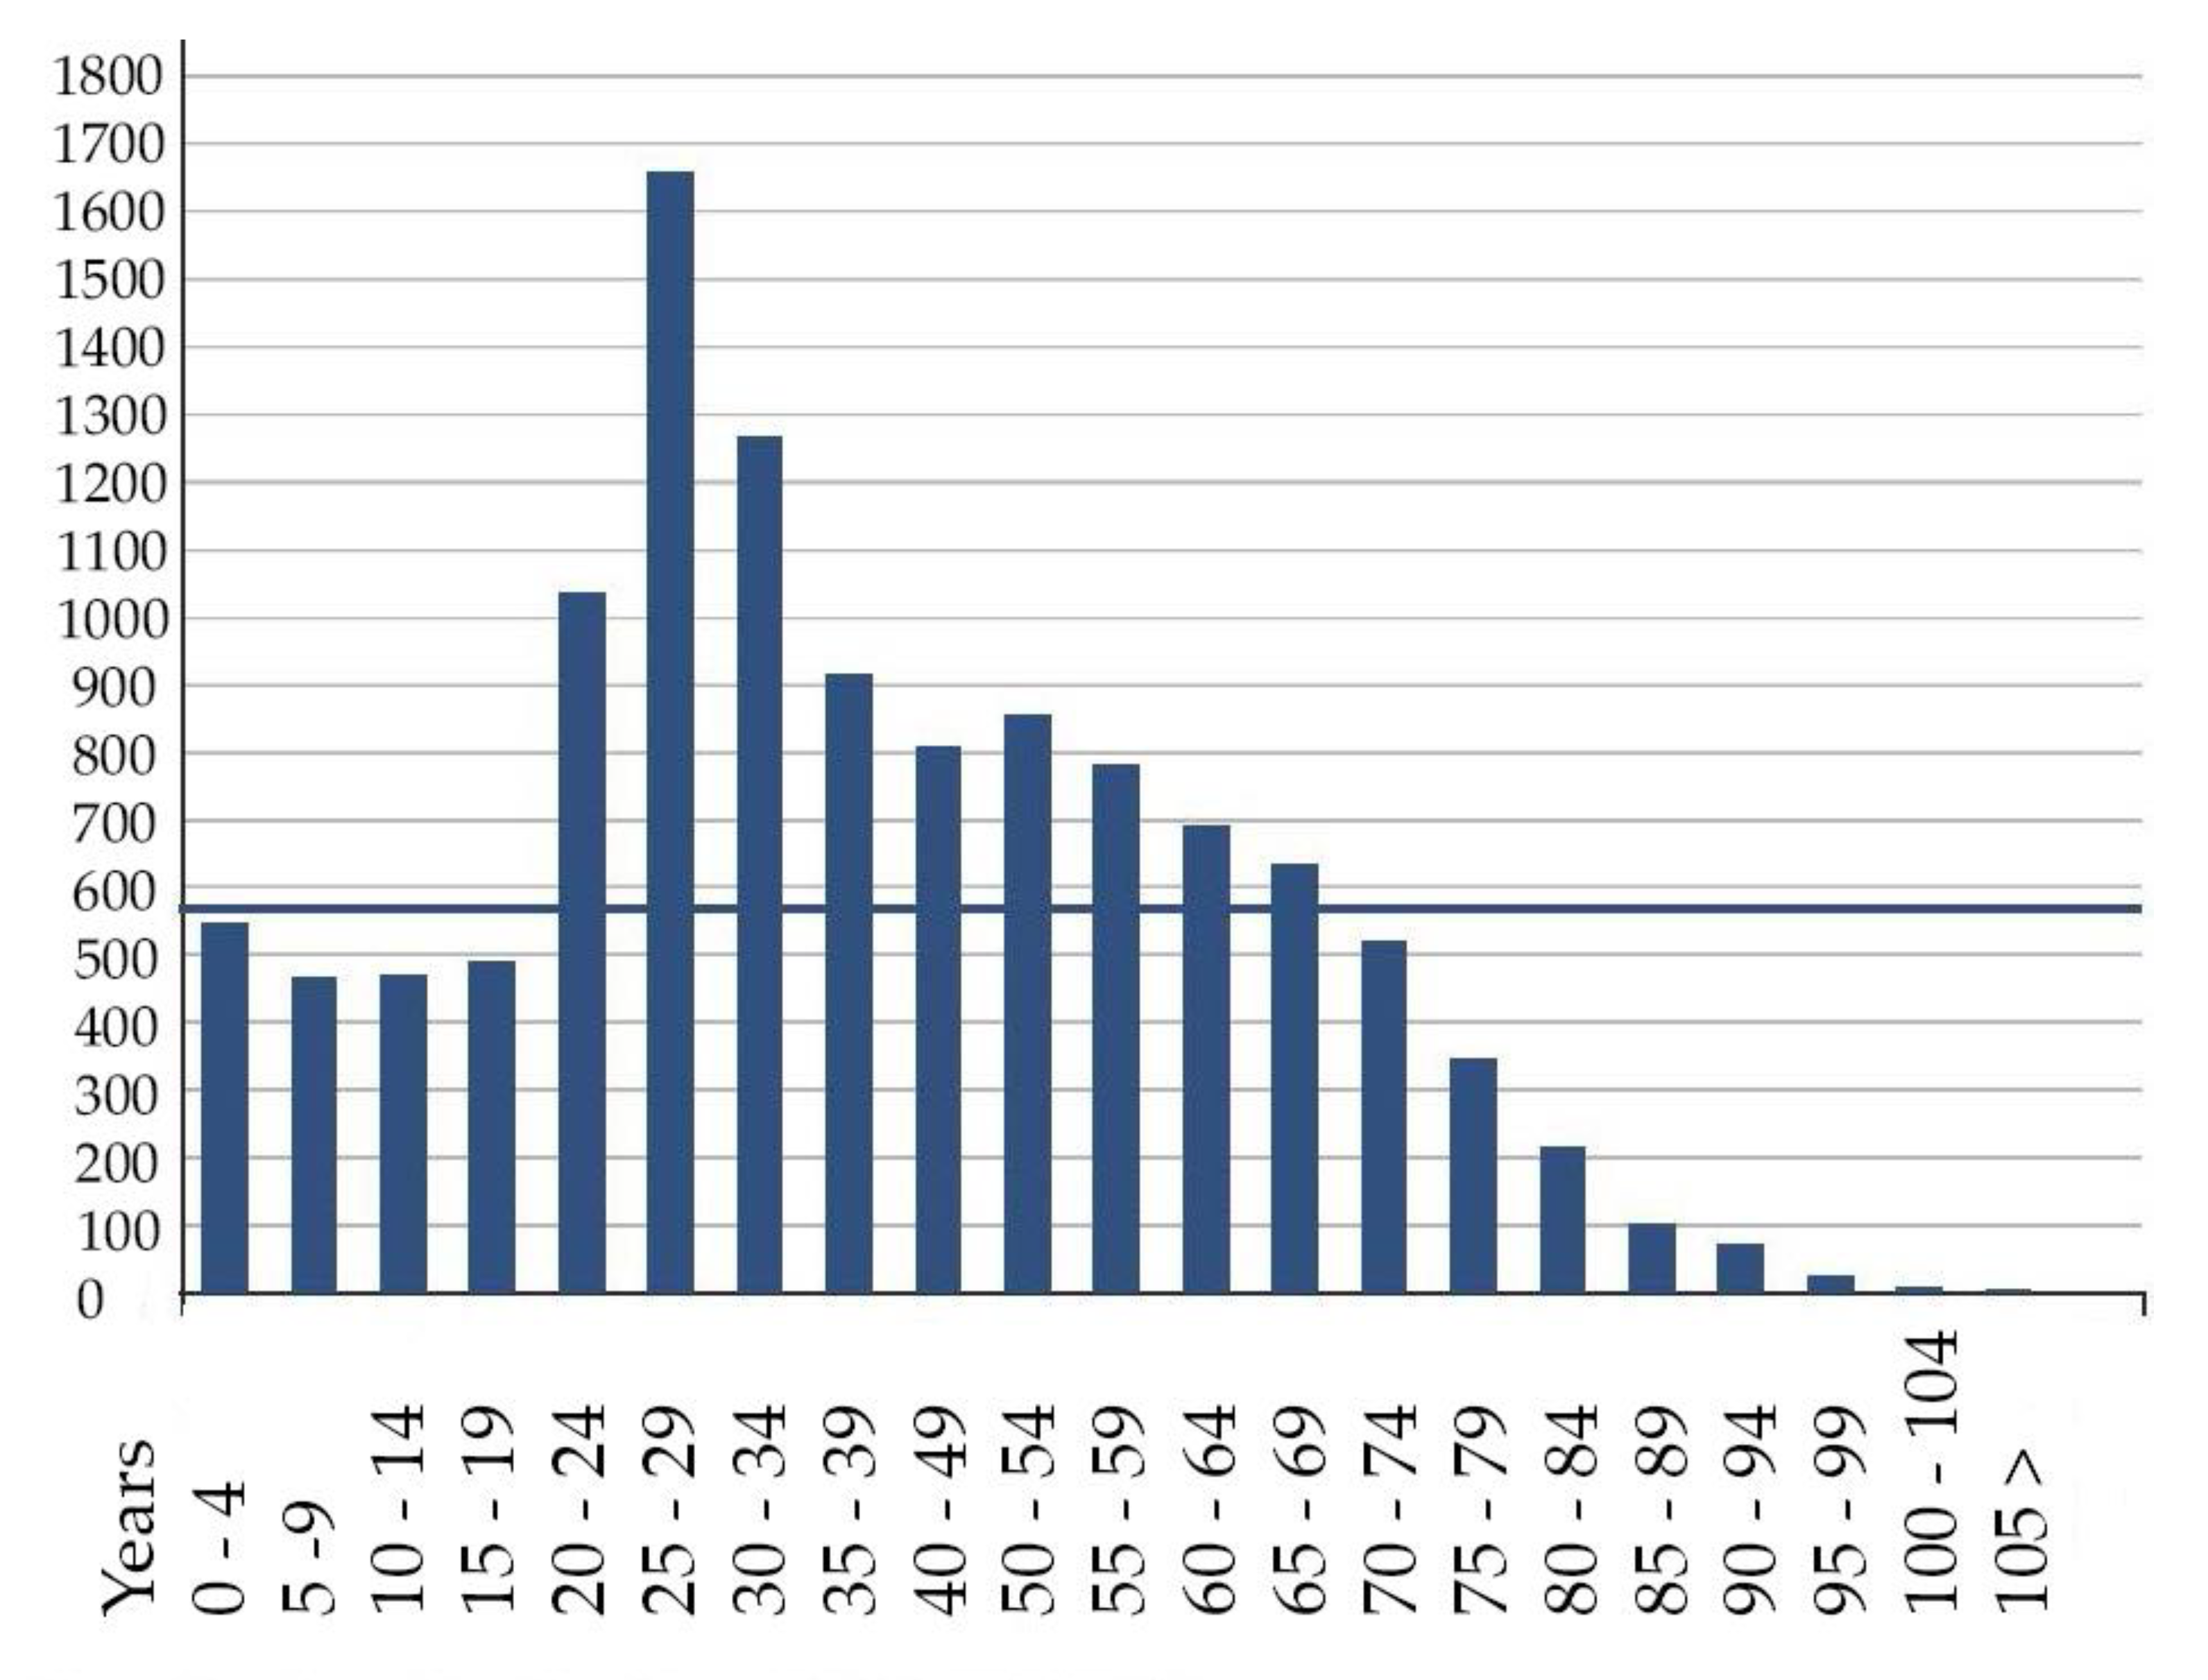
Figure 10 shows the number of various age groups residing in the Zeeheldenkwartier. The growth of small one to two person households between the ages of 20 and 29 living in small rental apartments (split townhouses) and the amount of cars in the streets is astonishing [
40].
5. Debate and Reflections
The Living Lab Zeeheldenkwartier was organised in the autumn of 2018 by Duurzame Zeehelden with five expert meetings held in the Zeeheldenkwartier, including a Minor for students organised by The Hague University of Applied Sciences [
47]. The meetings comprised a number of lectures and debates about providing climate neutral heat for this neighbourhood. Scientists from the TU Delft, civil servants from the municipality, specialists from consultancies, corporations, energy companies, housing associations, frontrunners of other neighbourhood organisations dealing with the energy transition and residents of the Zeeheldenkwartier were all present. Results of the students were discussed here too. The entire subject was continued in 2019 at the LDE Conference Heritage and the Sustainable Developments Goals at TU Delft.
The first expert meeting was about ‘vision and innovation’ (13 September 2018) with Kees Duijvestein (emeritus professor at the TU Delft) and Hubert Linssen (Green Village TU Delft). The second meeting discussed the ‘heat network and smart grid’ (20 September 2018) with Johan Noordhoek (sustainability department Municipality of Den Haag) and Gert Jan Otten (consultant and member of the neighbourhood organisation Duurzaam Benoordenhout). The third meeting covered ‘strategies of sustainable renovation of buildings’ (27 September 2018) with Miel Karthaus (architect), Mark Hazebroek (sustainability manager at housing association Haag Wonen and adviser for Aedes), and Stefan van Tol (heritage department of Municipality of Den Haag). Meeting four examined ‘service installation boilers, heat pumps and solar panels’ (11 October 2018) with Peter van Alphen (heat pump expert and director of Techneco Energiesystemen), Wim Schutten (neighbourhood organisation Groene Regentes and neighbourhood cooperation for solar energy), and Friso Waagmeester (sustainability consultant at DWA-adviseurs), who did all the calculations on hybrid neighbourhoods and buildings for this project. Meeting five focussed on ‘neighbourhood and governance’ (18 October 2018) with Liesbeth Sisling (manager at energy company Eneco) and Liesbeth van Tongeren (alderman for sustainability in Den Haag). All expert meetings were recorded and are available on YouTube [
48].
Students of The Hague University of Applied Sciences did part of the research and mapping. The author of this article organised the expert meetings as member of the Living Lab and as teacher at The Hague University of Applied Sciences. Various issues were addressed at the Minor, expert meetings and conference. The summarised conclusions are:
Narrow the problem and insulate the dwelling with a box-in-box-renovation, EPC label B (heat pump) or C (heat network).
Narrow the problem to the base load heat/cool of demand and not the peak load; provide the peak heat load by a centrally regulated electricity network.
Narrow the problem and leave usage of household energy outside the neighbourhood energy plan. Behaviour of people and size of households are of great importance on heat demand but is unrelated to the type of neighbourhood.
Due to a lack of heat capacity mix different climate-neutral heat systems; do not choose one heat supply for the entire neighbourhood. Make use of neighbourhood characteristics such as building types and positions. Combine central, local heat networks and all-electric solutions.
Due to a lack of construction capacity (of service systems), spread the energy transition over a longer period of time and apply an integrated box-in-box-renovation. Quality improvement, energy reduction, and a new heat supply for the dwelling could be combined. When a house changes ownership, it could first be renovated in uninhabited state. In addition, continual technical and material innovations make the energy transition of buildings more efficient.
Because of the impact on the living environment and quality of the buildings in different neighbourhoods, municipalities should coordinate and facilitate the energy transition for each neighbourhood; develop a clear framework and legislation on heat networks, heat pumps, and PV(T)-panels in relation to the typo-morphology of a neighbourhood.
6. Conclusions
The aim of this study was to research a framework for a feasible climate neutral energy plan for hybrid neighbourhoods of the late 19th century in the urban regions of The Netherlands. The two best options of heat supply are a heat network MT (with industrial waste energy from Rotterdam, local geothermal energy as energy source in the province Zuid-Holland) and all electric with heat pumps (with air as heat source); the most likely is to combine those options.
The typo-morphologic characteristics of neighbourhoods were grids formed by old strip fields between main roads. Most public buildings are located here. The enclosure streets (often with streetcars) are lined with shops and the narrow residential streets are lined with townhouses, their facades on the building line. Public spaces are rond-points in the centre or squares with public buildings, usually lacking green space. The perimeter urban blocks are closed off with private courtyards. Because of lack of space, the layout of a heat network is challenging and brickwork of the townhouses can easily be damaged.
There are two main building types. The townhouse (a middle class house between 140–240 m2) for one family or split up into three or four separate units. The smaller down-up-house (beneden-boven-woning) type has two apartments, one on the ground floor and one on the upper floor. The front door is directly on the street. Most households are small and residents mainly live in split townhouse rental units. Most urban renewals are apartments.
The best strategy to carry out the heat transition is for individual townhouses to receive an integral box-in-box renovation aiming at EPC label B (heat pump) or C (heat network) in uninhabited state when ownership changes. Housing associations could apply a heat network to urban renewals that would also be suitable for public buildings like schools, institutes and healthcare facilities along main roads. Air-water-heat pumps could be applied in the better insulated townhouses that already have central heating systems. Air-air-heat pumps could be applied to small apartments in the split houses. Some general recommendations to municipalities are therefore:
Develop rules for the aesthetic fitting of all elements such as PV(T)-panels, energy roofs, heat pumps (sound and heat production), heat stations and pace of heat networks, and on insulation that might damage the architecture of the neighbourhood.
Take initiative in organising energy cooperatives of users and not building owners. Unburden tenants and residents who do not know what to do.
Plan and implement legislation and a framework for: insulation to mandatory EPC label B or C per rental unit; sound and vibration of heat pumps to 40dB (A); heat production in summertime by heat networks and heat pumps because of heat stress.
Mix different climate-neutral heat systems (due to a lack of heat capacity).
Spread the energy transition over a longer period of time and apply an integrated box-in-box-renovation to accommodate the construction capacity (renovation and service systems).
Tackle the risk of damage to old brickwork buildings that are challenged due to a lack of urban space for the layout of the heat network.


