Article

A Study on the Application Possibility of the Vehicle Air Conditioning System Using Vortex Tube

1
Department of Mechanical Engineering, Chungnam National University, 99 Daehak-ro, Yuseong-gu, Daejeon 34134, Korea
2
Department of Mechanical and Materials Engineering Education, Chungnam National University, 99 Daehak-ro, Daejeon 34134, Korea
3
School of Mechanical & Automotive Engineering, Youngsan University, 288 Junam-ro, Yangsan-si 50510, Korea
*
Authors to whom correspondence should be addressed.
Energies 2020, 13(19), 5227; https://doi.org/10.3390/en13195227
Submission received: 9 August 2020 / Revised: 27 September 2020 / Accepted: 7 October 2020 / Published: 8 October 2020
(This article belongs to the Special Issue Thermal Systems)

Abstract

:
Since refrigerants applied to vehicle air conditioning systems exacerbate global warming, many studies have been conducted to supplement them. However, most studies have attempted to maximize the efficiency and minimize the environmental impact of the refrigerant, and thus, an air conditioning system without refrigerant is required. The vortex tube is a temperature separation system capable of separating air at low and high temperatures using compressed air. When applied to an air conditioning system, it is possible to construct an eco-friendly system that does not use a refrigerant. In this paper, various temperature changes and characteristics of a vortex tube were identified and applied to an air conditioning system simulation device. Additionally, an air conditioning system simulation device using indirect heat exchange and direct heat exchange methods was constructed to test the low-temperature air flow rate (yc), according to the temperature and pressure. As a result of the experiment, the temperature of the indirect heat exchange method was found to be higher than the direct heat exchange method, but the direct heat exchange method had low flow resistance. As a result, the direct heat exchange method can easily control the temperature according to the pressure and the low-temperature air flow rate (yc). Therefore, it was judged that the direct heat exchange method is more feasible for use in air conditioning systems than the indirect heat exchange method.

1. Introduction

With rapid industrialization, the share of fossil fuels has increased significantly from the beginning of the industrial revolution to the present, and as means of transportation and efficient heating and cooling systems have been developed, more environmental pollution has been produced. Furthermore, the excessive use of refrigerant has caused environmental problems such as ozone layer destruction and global warming, and the ripple effects are accelerating. Accordingly, restrictions on the use of CFC (Chloro Fluoro Carbon)-based refrigerants have been strengthened, and R134a has been developed as an alternative. This refrigerant has been applied to facilities such as automobile air conditioning systems and household refrigerators. However, while R134a has an ozone depletion index of 0, its global warming index of 1430 is insufficient to compensate for environmental problems [1,2]. As an alternative to solve the problems associated with freon (CFC) used as a refrigerant in automobiles, research has been actively conducted, where one possible measure is the vortex tube [3].
The vortex tube was discovered by Ranque in 1928 and has since become widely promoted to the academic community by Hilsch [4,5]. Thereafter, modeling studies were conducted by Fulton, Stephan, Deissler and Permuter, Kassner, Upendra, and Gao et al. for energy separation, and models proposed by Fulton and Kassner have been widely accepted [6,7,8,9,10,11]. Hilsch et al. experimented to find nozzle diameters and low-temperature exit conditions for three cases of tube radii of 4.6 mm, 9.6 mm, and 17.6 mm. Westley et al. conducted a study on vortex tube dimensional conditions to find the ratio of the tube area of the low-temperature air outlet area to the tube area of the nozzle’s total area to spray compressed air into the tube [12]. Hartnett and Eckert et al. measured the tube velocity, pressure, and temperature distribution through experiments and found that the vortex tube had a high wall temperature and a low central temperature [13]. Takanama et al. designed the shape of a vortex tube with high energy efficiency by researching the relationship between the temperature and velocity distribution of air flowing in the vortex internal production chamber and the dimensions of the tube, nozzle, and low-temperature outlet orifice [14]. Comassar and Stepan et al. presented a single-flow vortex tube to evaluate the energy separation performance and confirmed that the counter-flow vortex tube performance was higher than the single-flow vortex tube [15,16]. Frohlingsdorf et al. analyzed energy separation and flow in a Ranque–Hilsch vortex tube using CFX, shear stress, and axial symmetry models [17]. Smith Eiamsa-ard et al. performed a thermal separation simulation of a Ranque–Hilsch vortex tube in a finite volume approach using a standard turbulence model and a logarithmic stress model (ASM) [18]. Skye et al. compared the performance predicted by the CFD model with commercial vortex tube experimental data and confirmed the industrial applicability of vortex tubes [19].
Until recently, studies on the industrial use of vortex tubes are ongoing, and experimental analysis of vortex tube energy separation phenomena and comparative analysis through models are continuously being studied [20,21,22,23]. B.E. Mtopi Fotso et al., and others, showed modeling and thermal analysis of solar generators equipped with vortex tubes for hybrid vehicles, showing the application of vortex tubes to vehicles [24]. Additionally, Hitesh R. Thakare et al. performed a technical and economic evaluation of the vortex tube’s industrial applications to show that the industrial use of vortex tubes is advantageous for shortening production cycles [25].
In this study, the vortex tube was found to be eco-friendly because it does not require a refrigerant; and because it is sufficiently applicable to air conditioning systems in the future automobile field, a study was conducted to integrate a vortex tube into a vehicle air conditioning system. The experiment was performed by dividing it into two parts: an indirect heat exchange method and a direct heat exchange method. In particular, among the factors affecting the energy separation of the vortex tube, the temperature is controlled by controlling the supply pressure (Pi), the nozzle area ratio (Sn), and the number of nozzle holes (Nh) of the vortex tube generator, and the low-temperature air flow rate (yc) is controlled using a throttle valve. We obtained the experimental data for the four basic and influential characteristics in the characteristic experiment, and based on this, analyzed the optimum temperature characteristics by installing them in heat exchangers of different shapes using the indirect and direct methods.

2. Experimental Approach

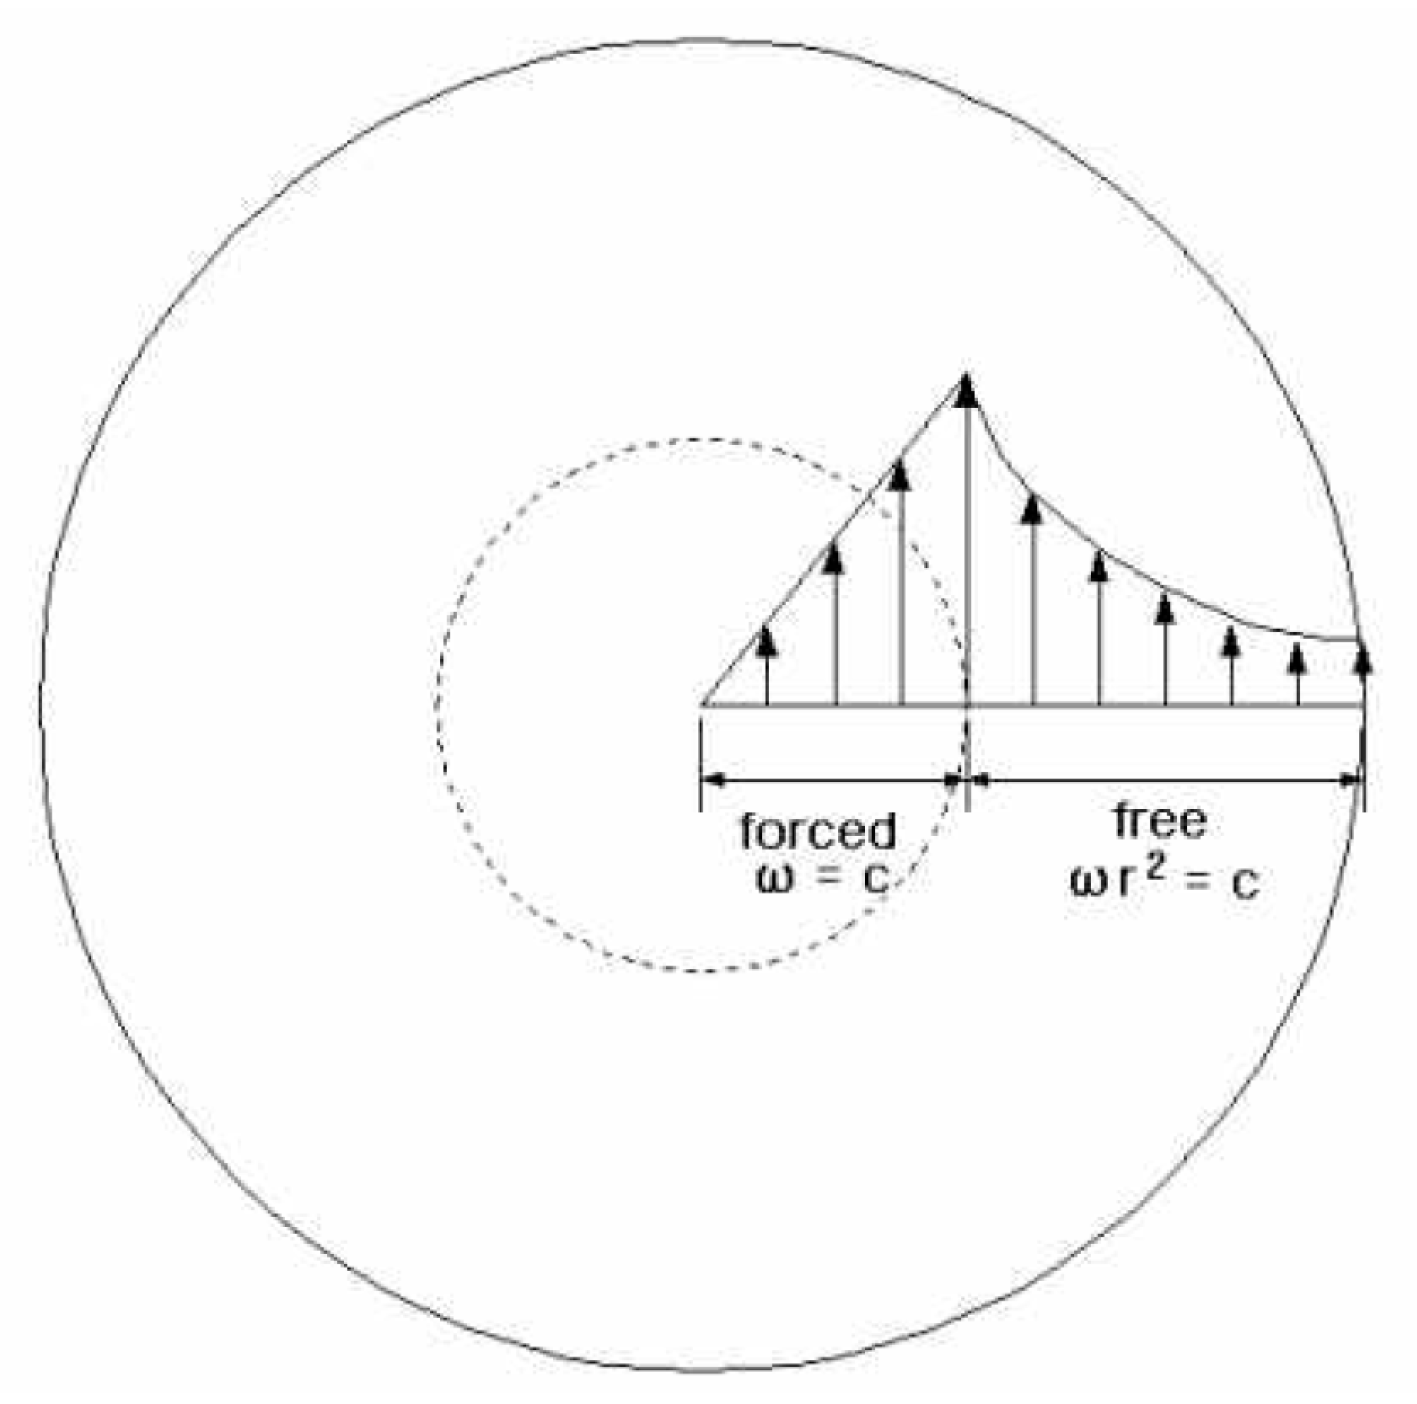
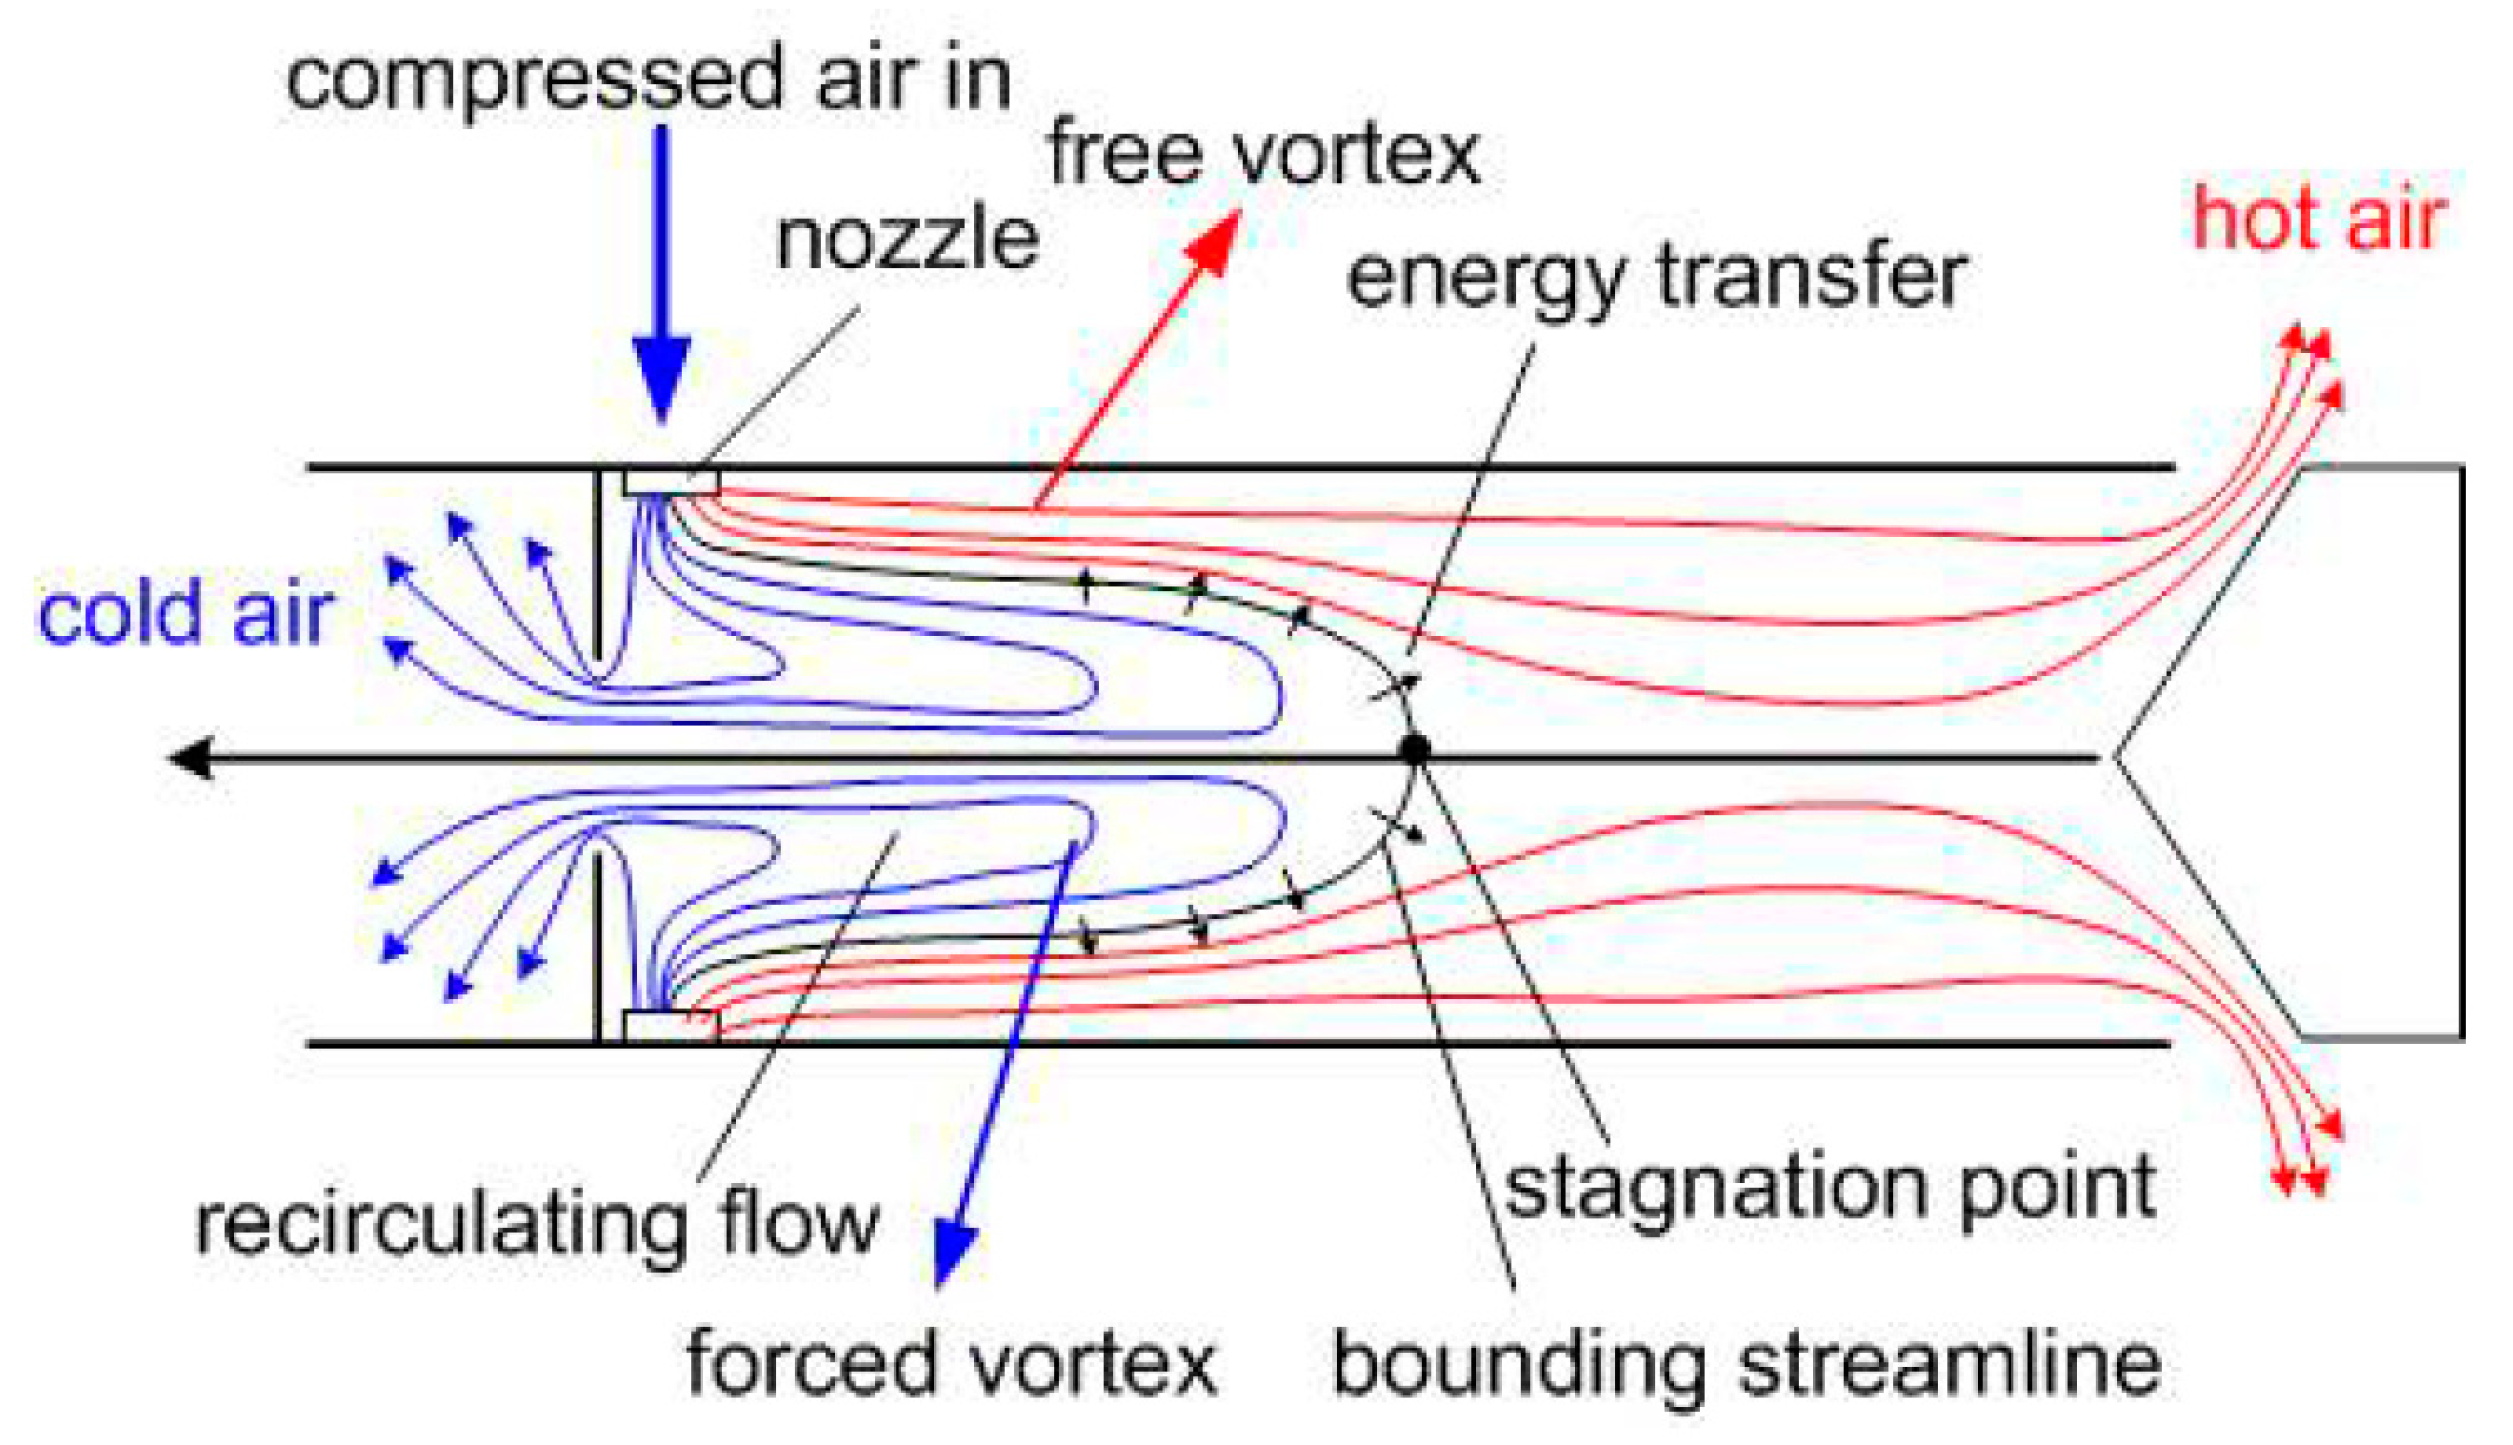
2.1. Principle of Vortex Tube

The vortex tube is an energy separation device that separates compressed air into hot and cold air samples without chemical reaction or combustion. The vortex tube has a simple structure, but the cause and phenomenon of energy separation are complicated. In general, Fulton’s theory describing the domains of free vortex and forced vortex is accepted. According to the theory, compressed fluid forms a free vortex with high velocity at the tangential nozzle of the tube.
w r 2 = c o n s t .
At this time, as the flow proceeds toward the throttle valve, the free vortex is the result of friction between the fluid layers, and a forced vortex is formed in the center of the tube.
w = c o n s t .
Due to this change in flow type, momentum transfer occurs from the center of the tube to the wall, and the center of the vortex is cooled more than the outside. However, to achieve energy balance, heat is transferred to the inner layer; however, since the momentum transfer is greater than the transfer of heat, the outside air temperature rises as does the stagnant temperature, and air is discharged through the throttle valve as a high-temperature flow. At this time, the fluid inside drops to a lower temperature by losing momentum greater than the received thermal energy, and becomes a low-temperature flow with temperature lower than the inlet temperature; this air is discharged to the outside through the low-temperature outlet orifice. Figure 1 and Figure 2 clearly show the phenomenon of this vortex tube [26]. What is shown in the vertical direction in Figure 1 is a visual representation of the force magnitude in the vortex tangent direction.

2.2. Setup of Feasibility Study

In this study, the vortex tube device was applied to a vehicle air conditioning system. Therefore, through a basic experiment with an actual manufactured vortex tube, it was confirmed whether energy separation had been properly performed; also, the number of nozzle holes (Nh) of the vortex generator was changed according to the supply pressure (Pi) to change the temperature according to the low-temperature airflow ratio (yc). Schematics of the basic experimental device and the actual experimental device are shown in Figure 3 and Figure 4.
The specifications of the vortex tube produced in the experiment are shown in Table 1. The air conditioning system to be applied to the experiment was divided into two types: an indirect heat exchange method and a direct heat exchange method.
Compressed air that has undergone energy separation through the vortex tube first controls the temperature through a low-temperature and high-temperature valve, and this air is moved into the chamber through an indirect heater core where heat exchange is performed using a direct air conditioning filter. The temperature is measured. The heater core of the indirect heat exchanger used in the experiment is shown in Figure 5; the air conditioning filter of the direct heat exchanger is shown in Figure 6.

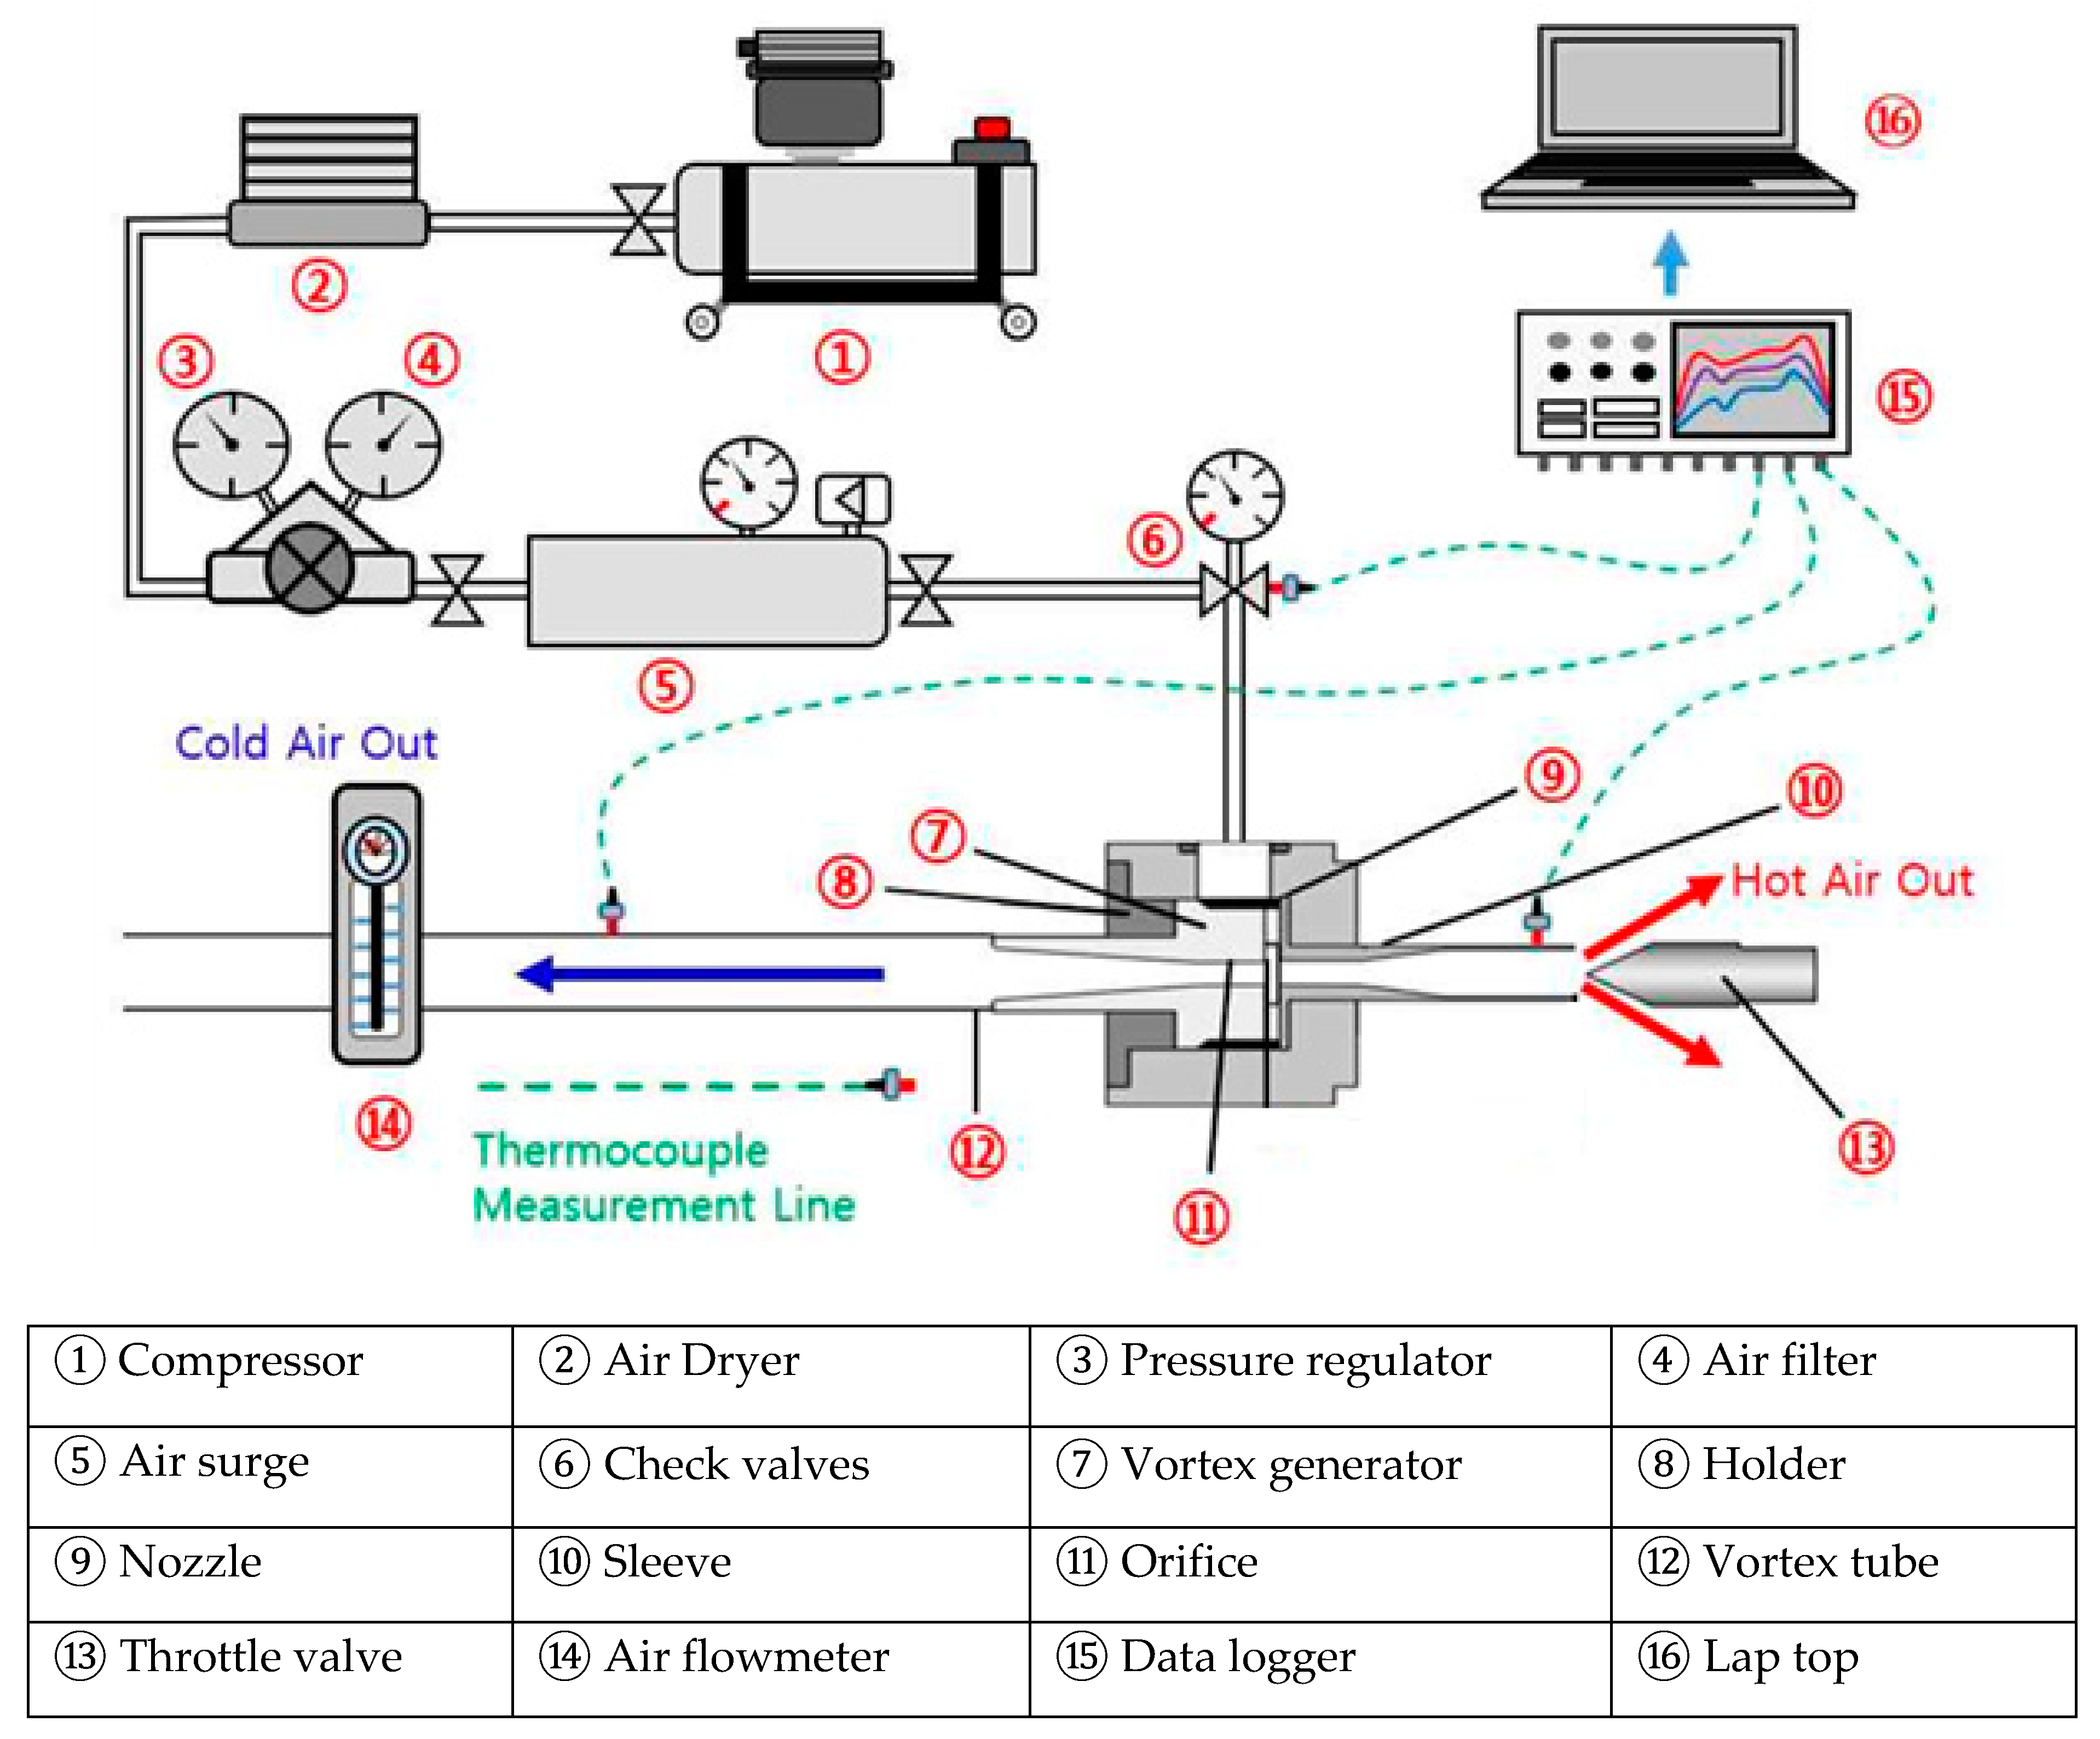
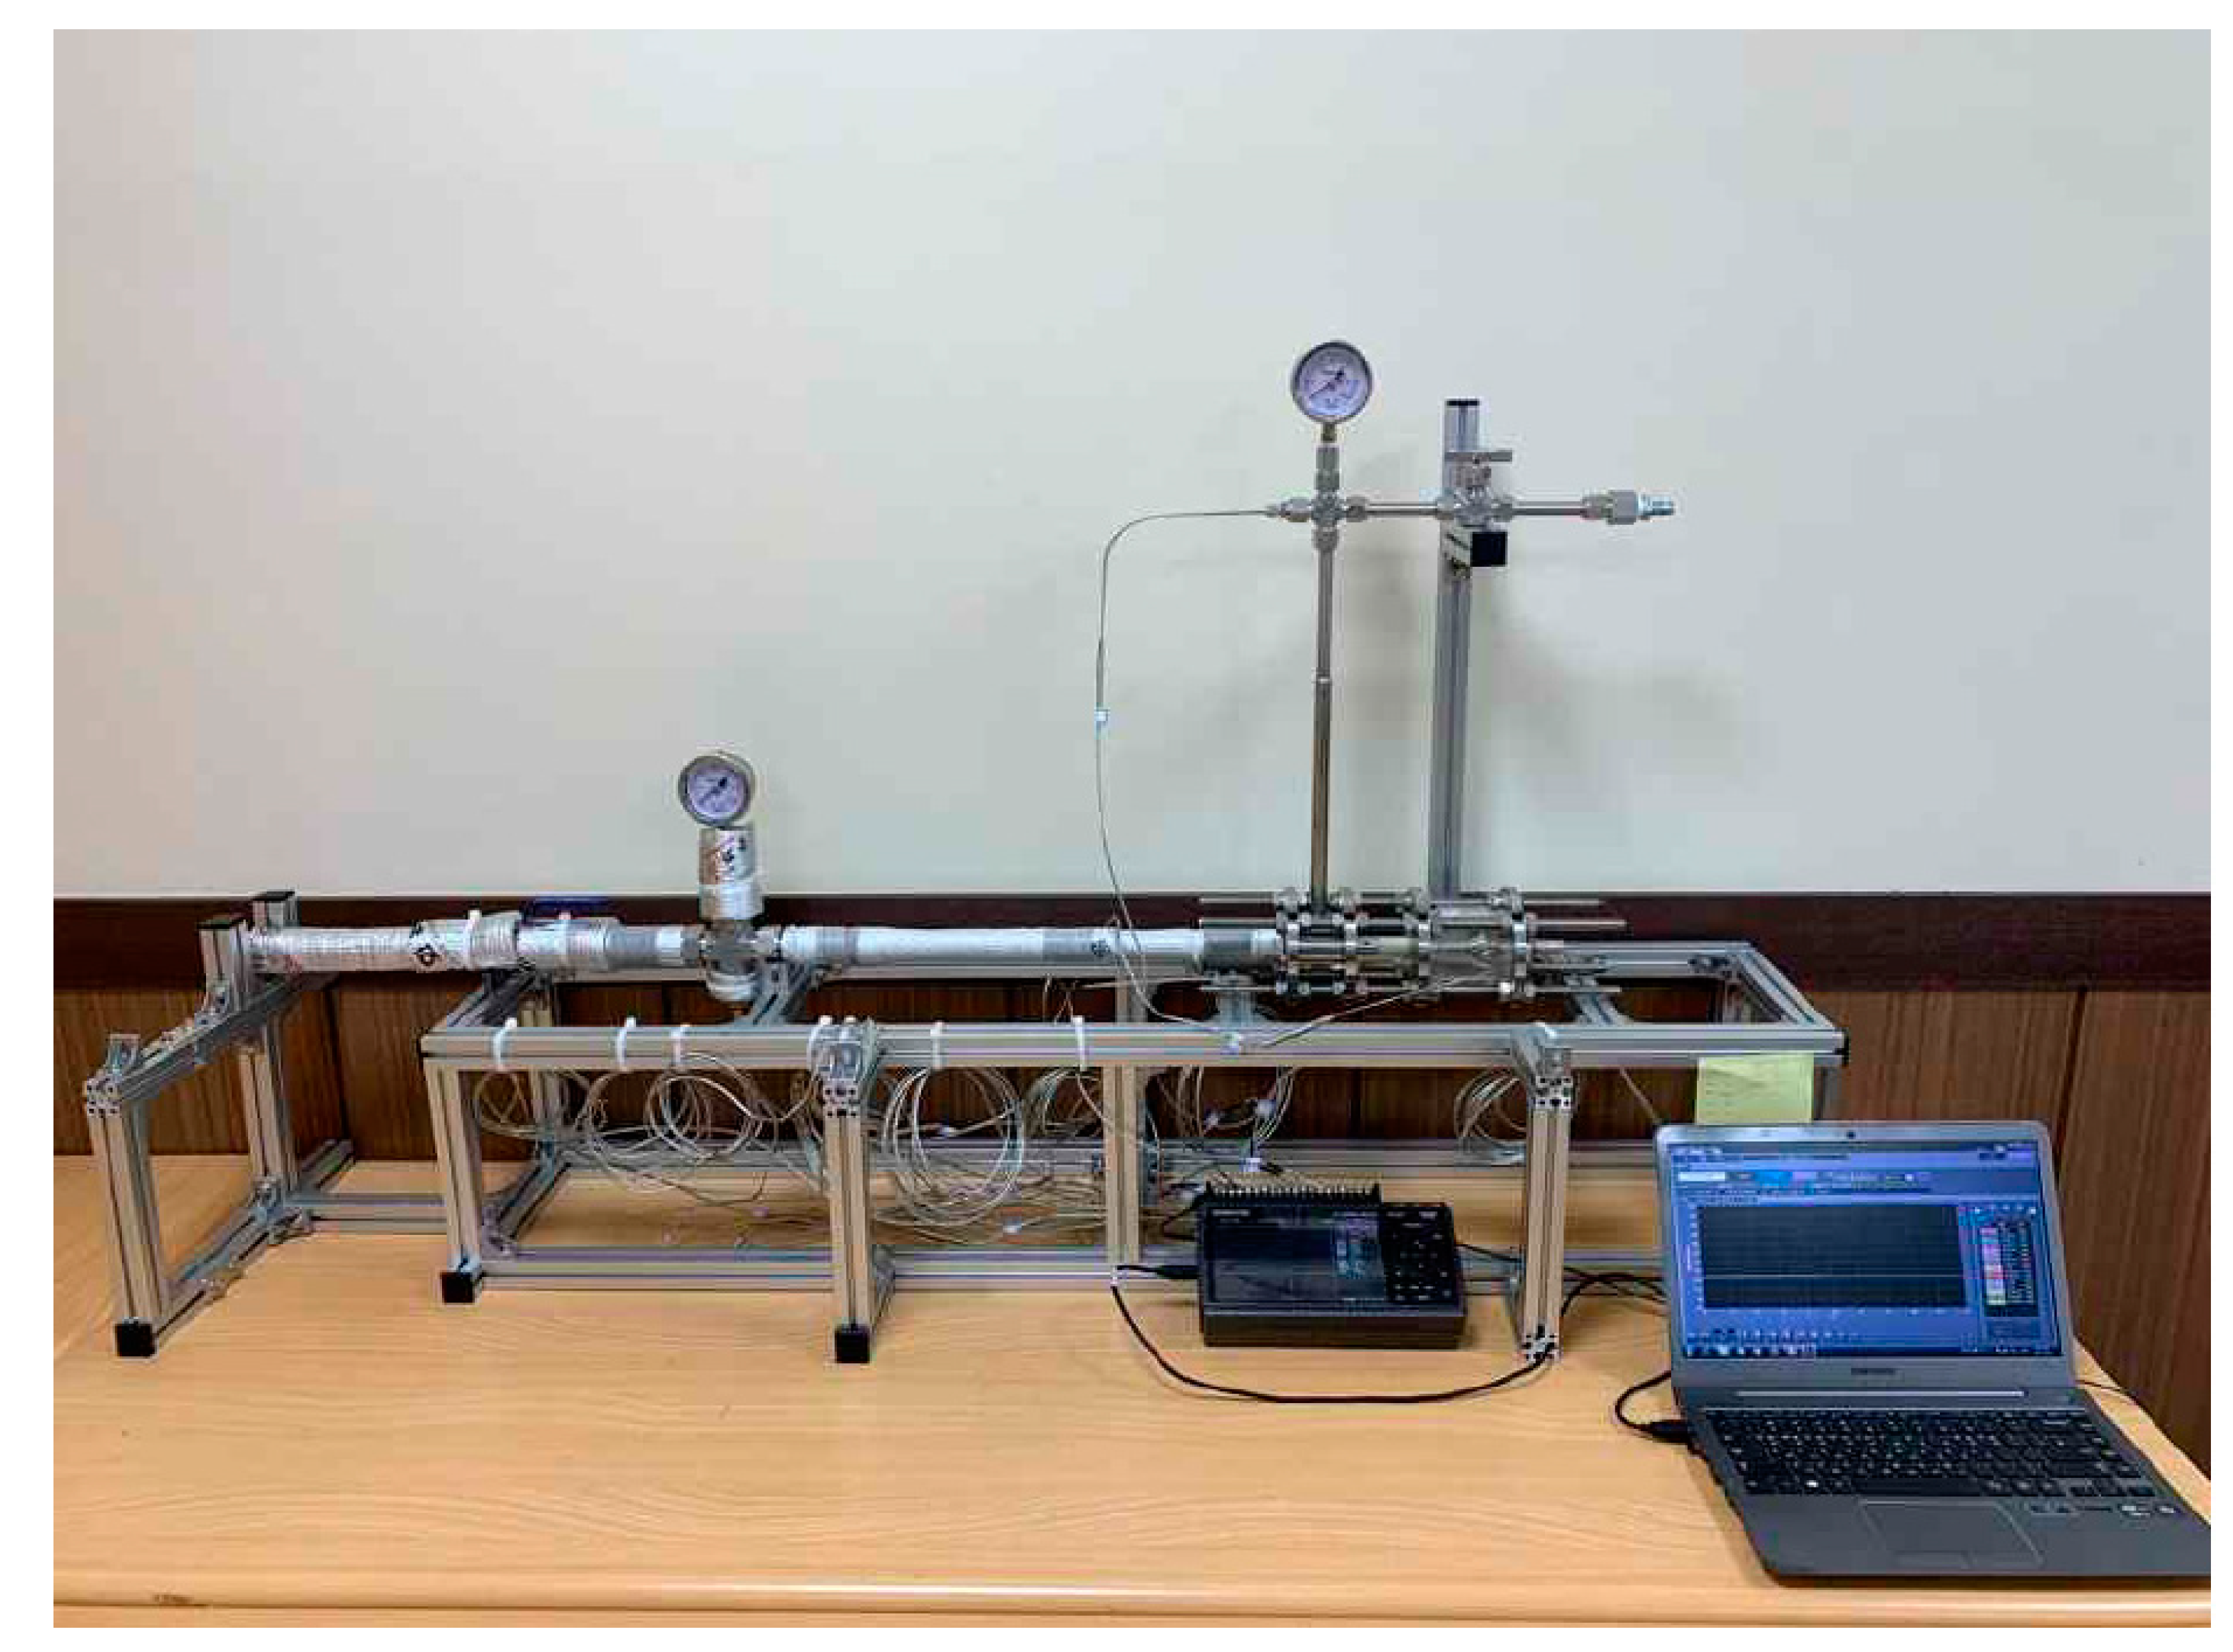
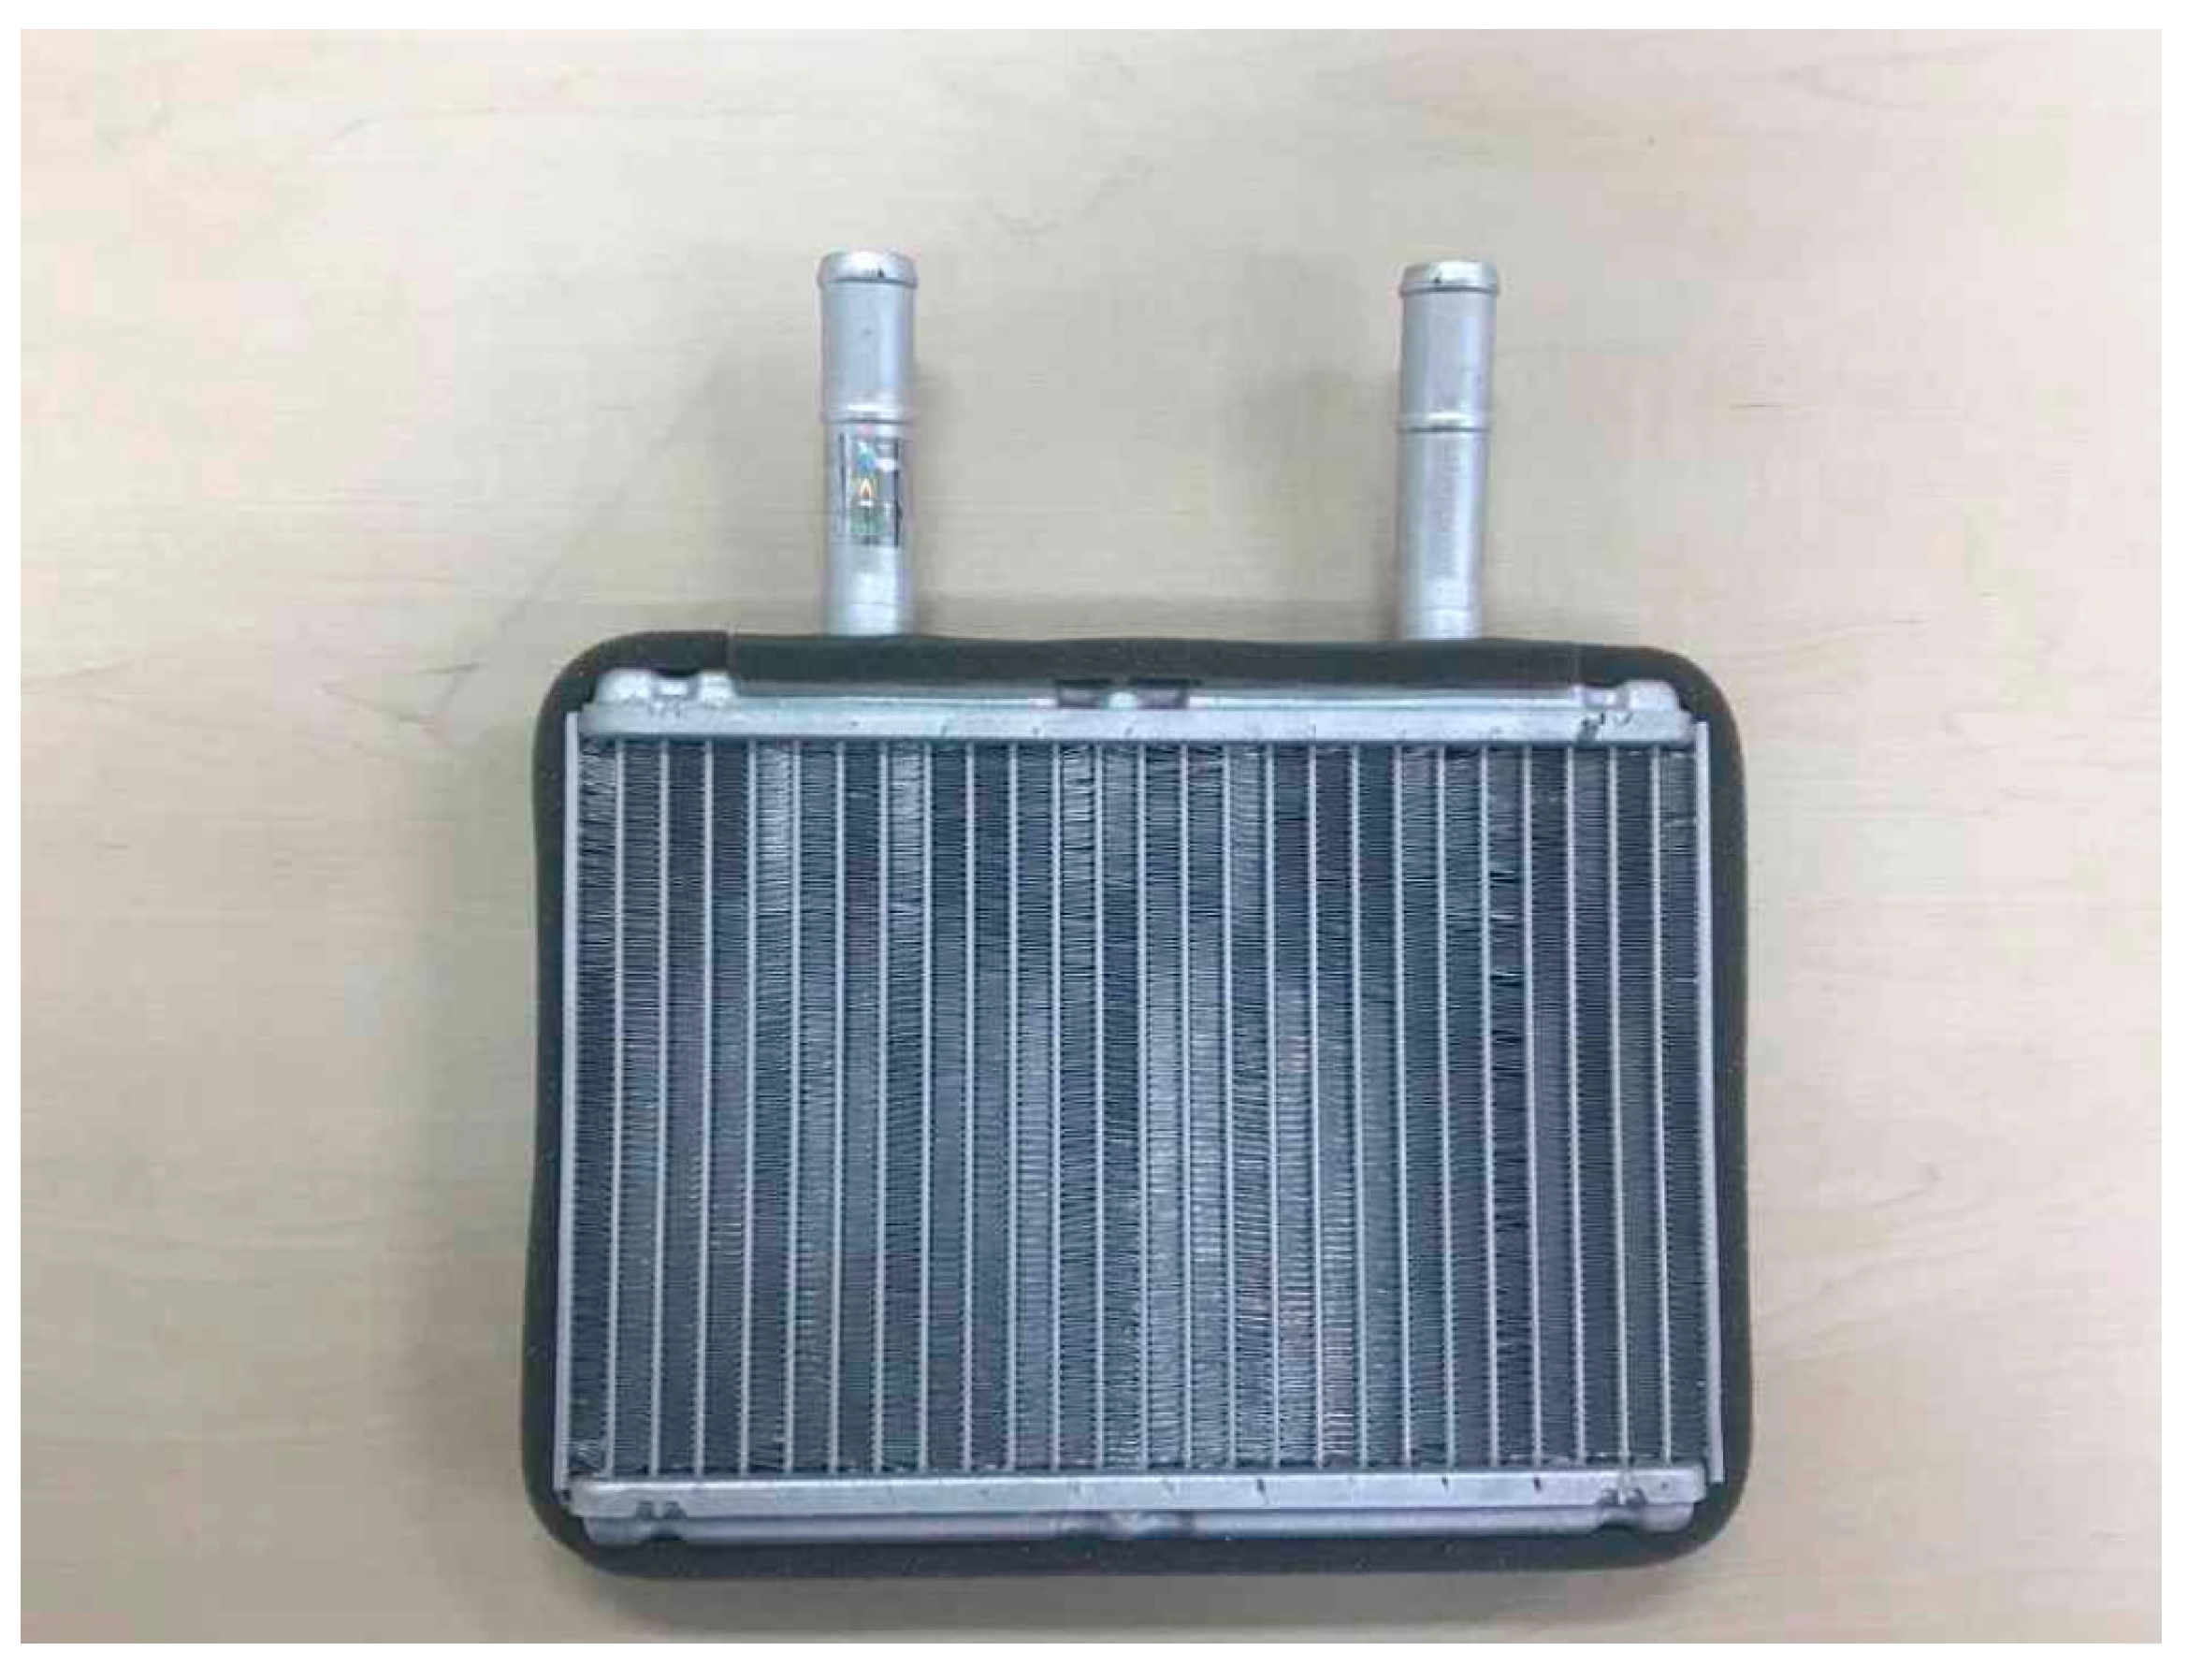
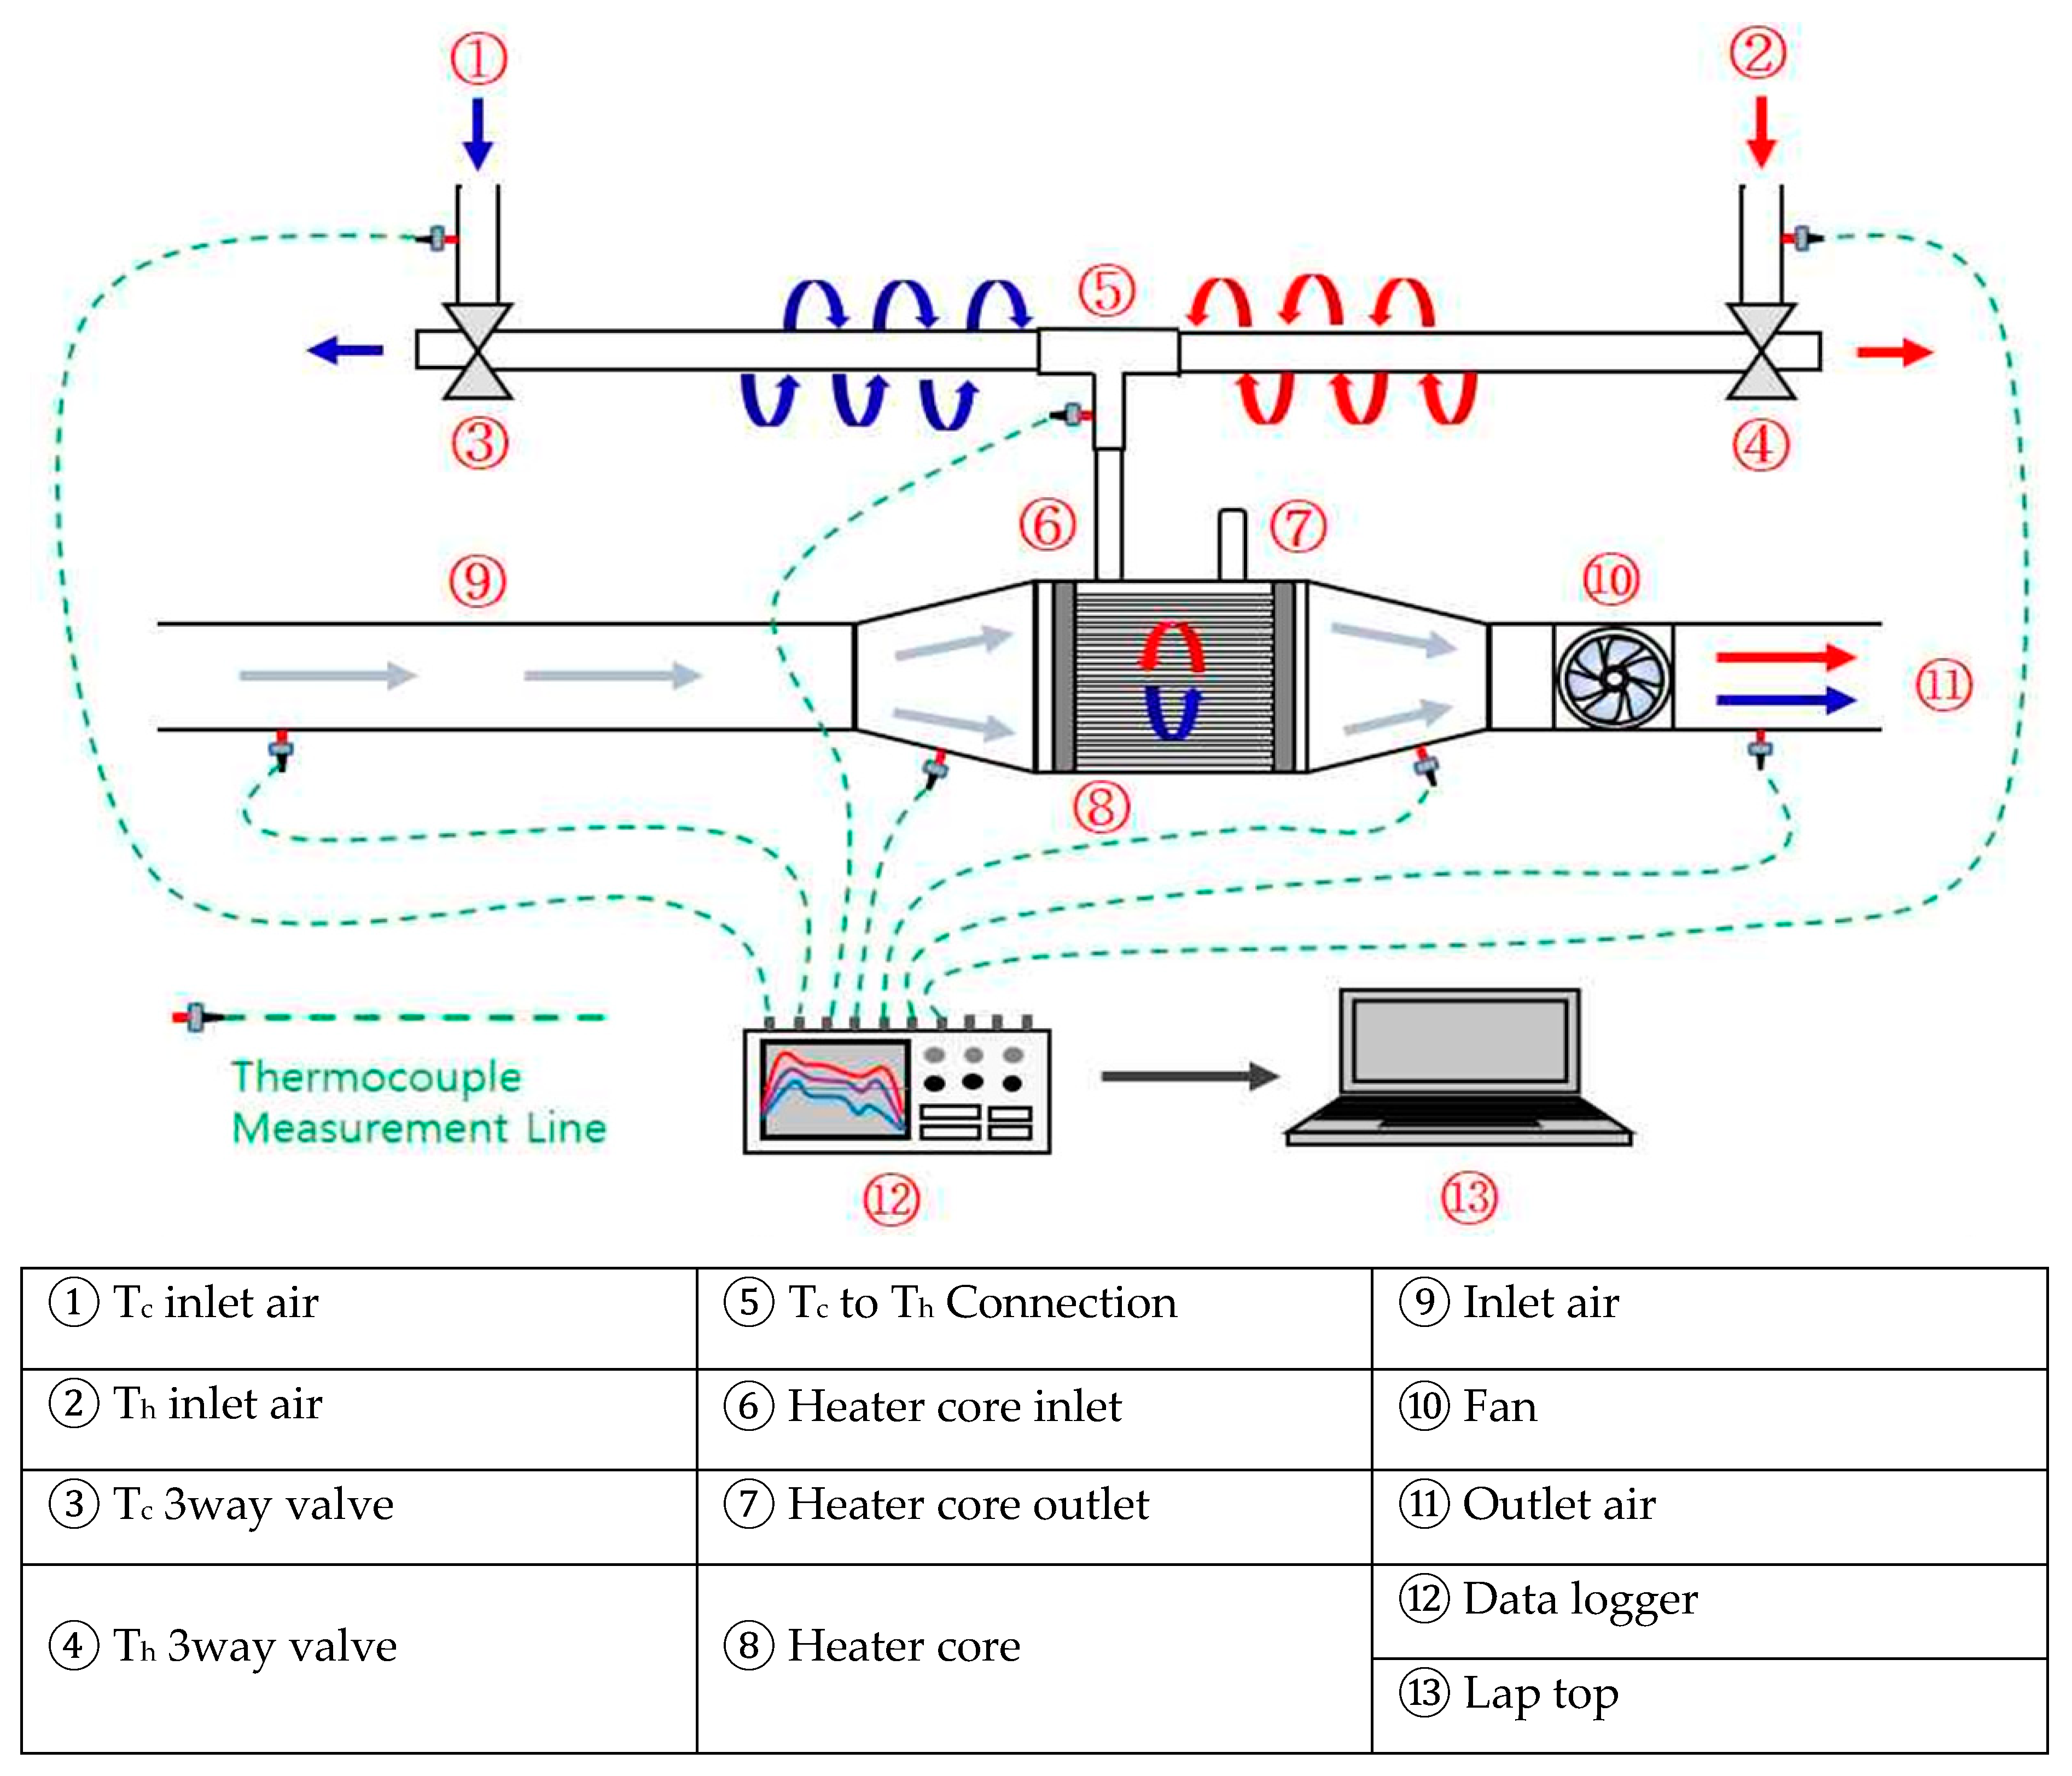
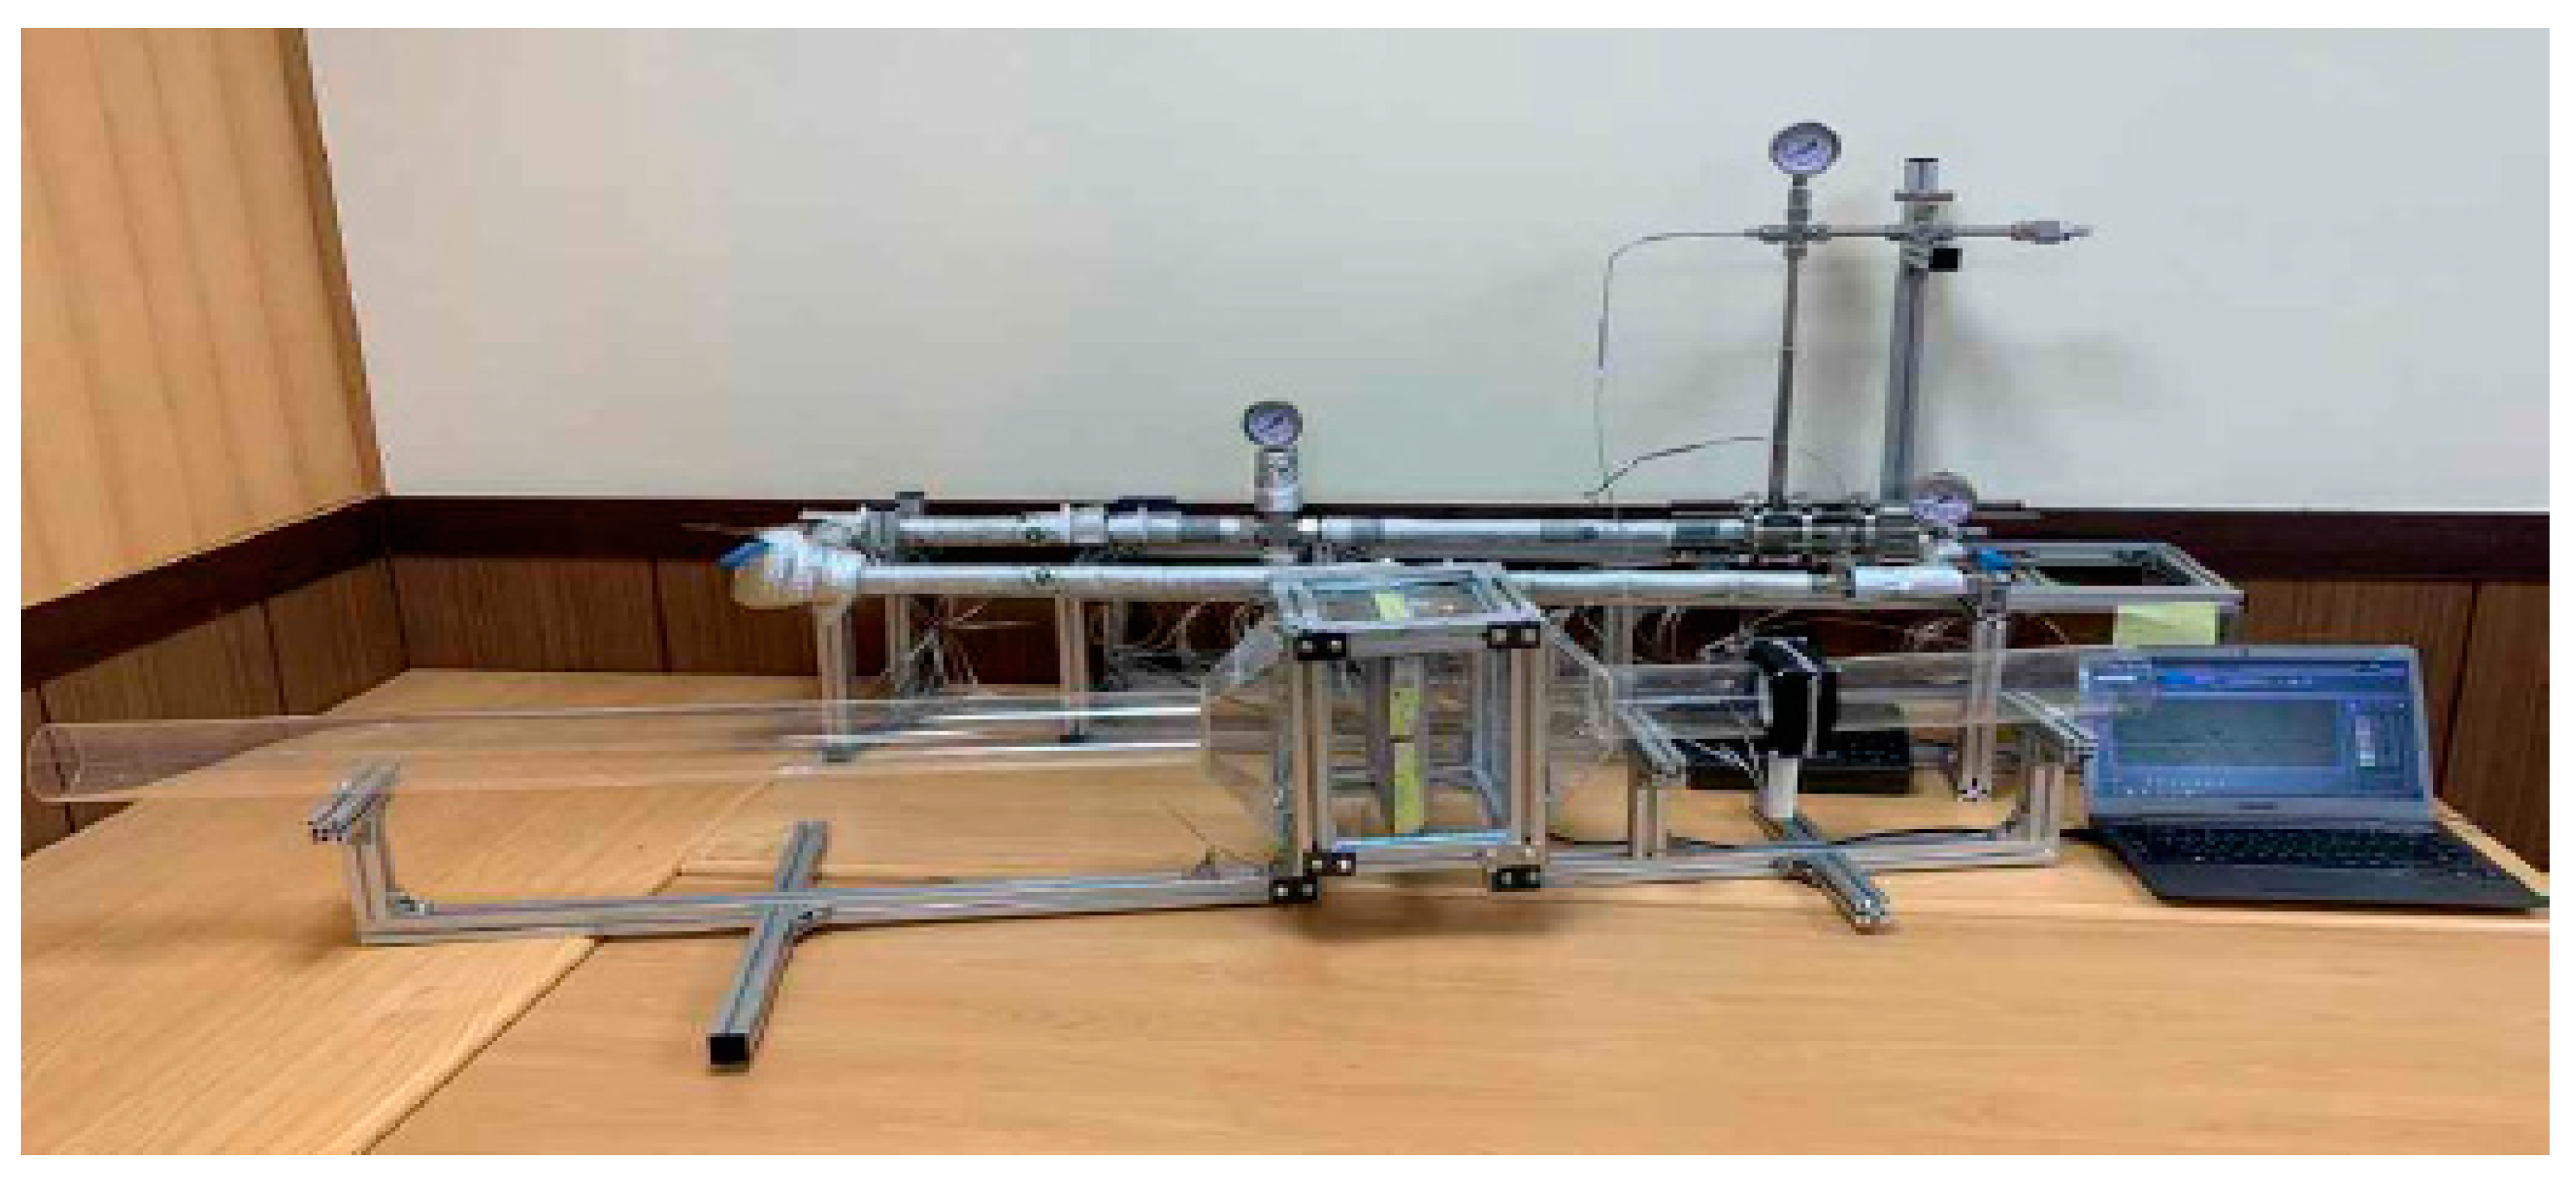
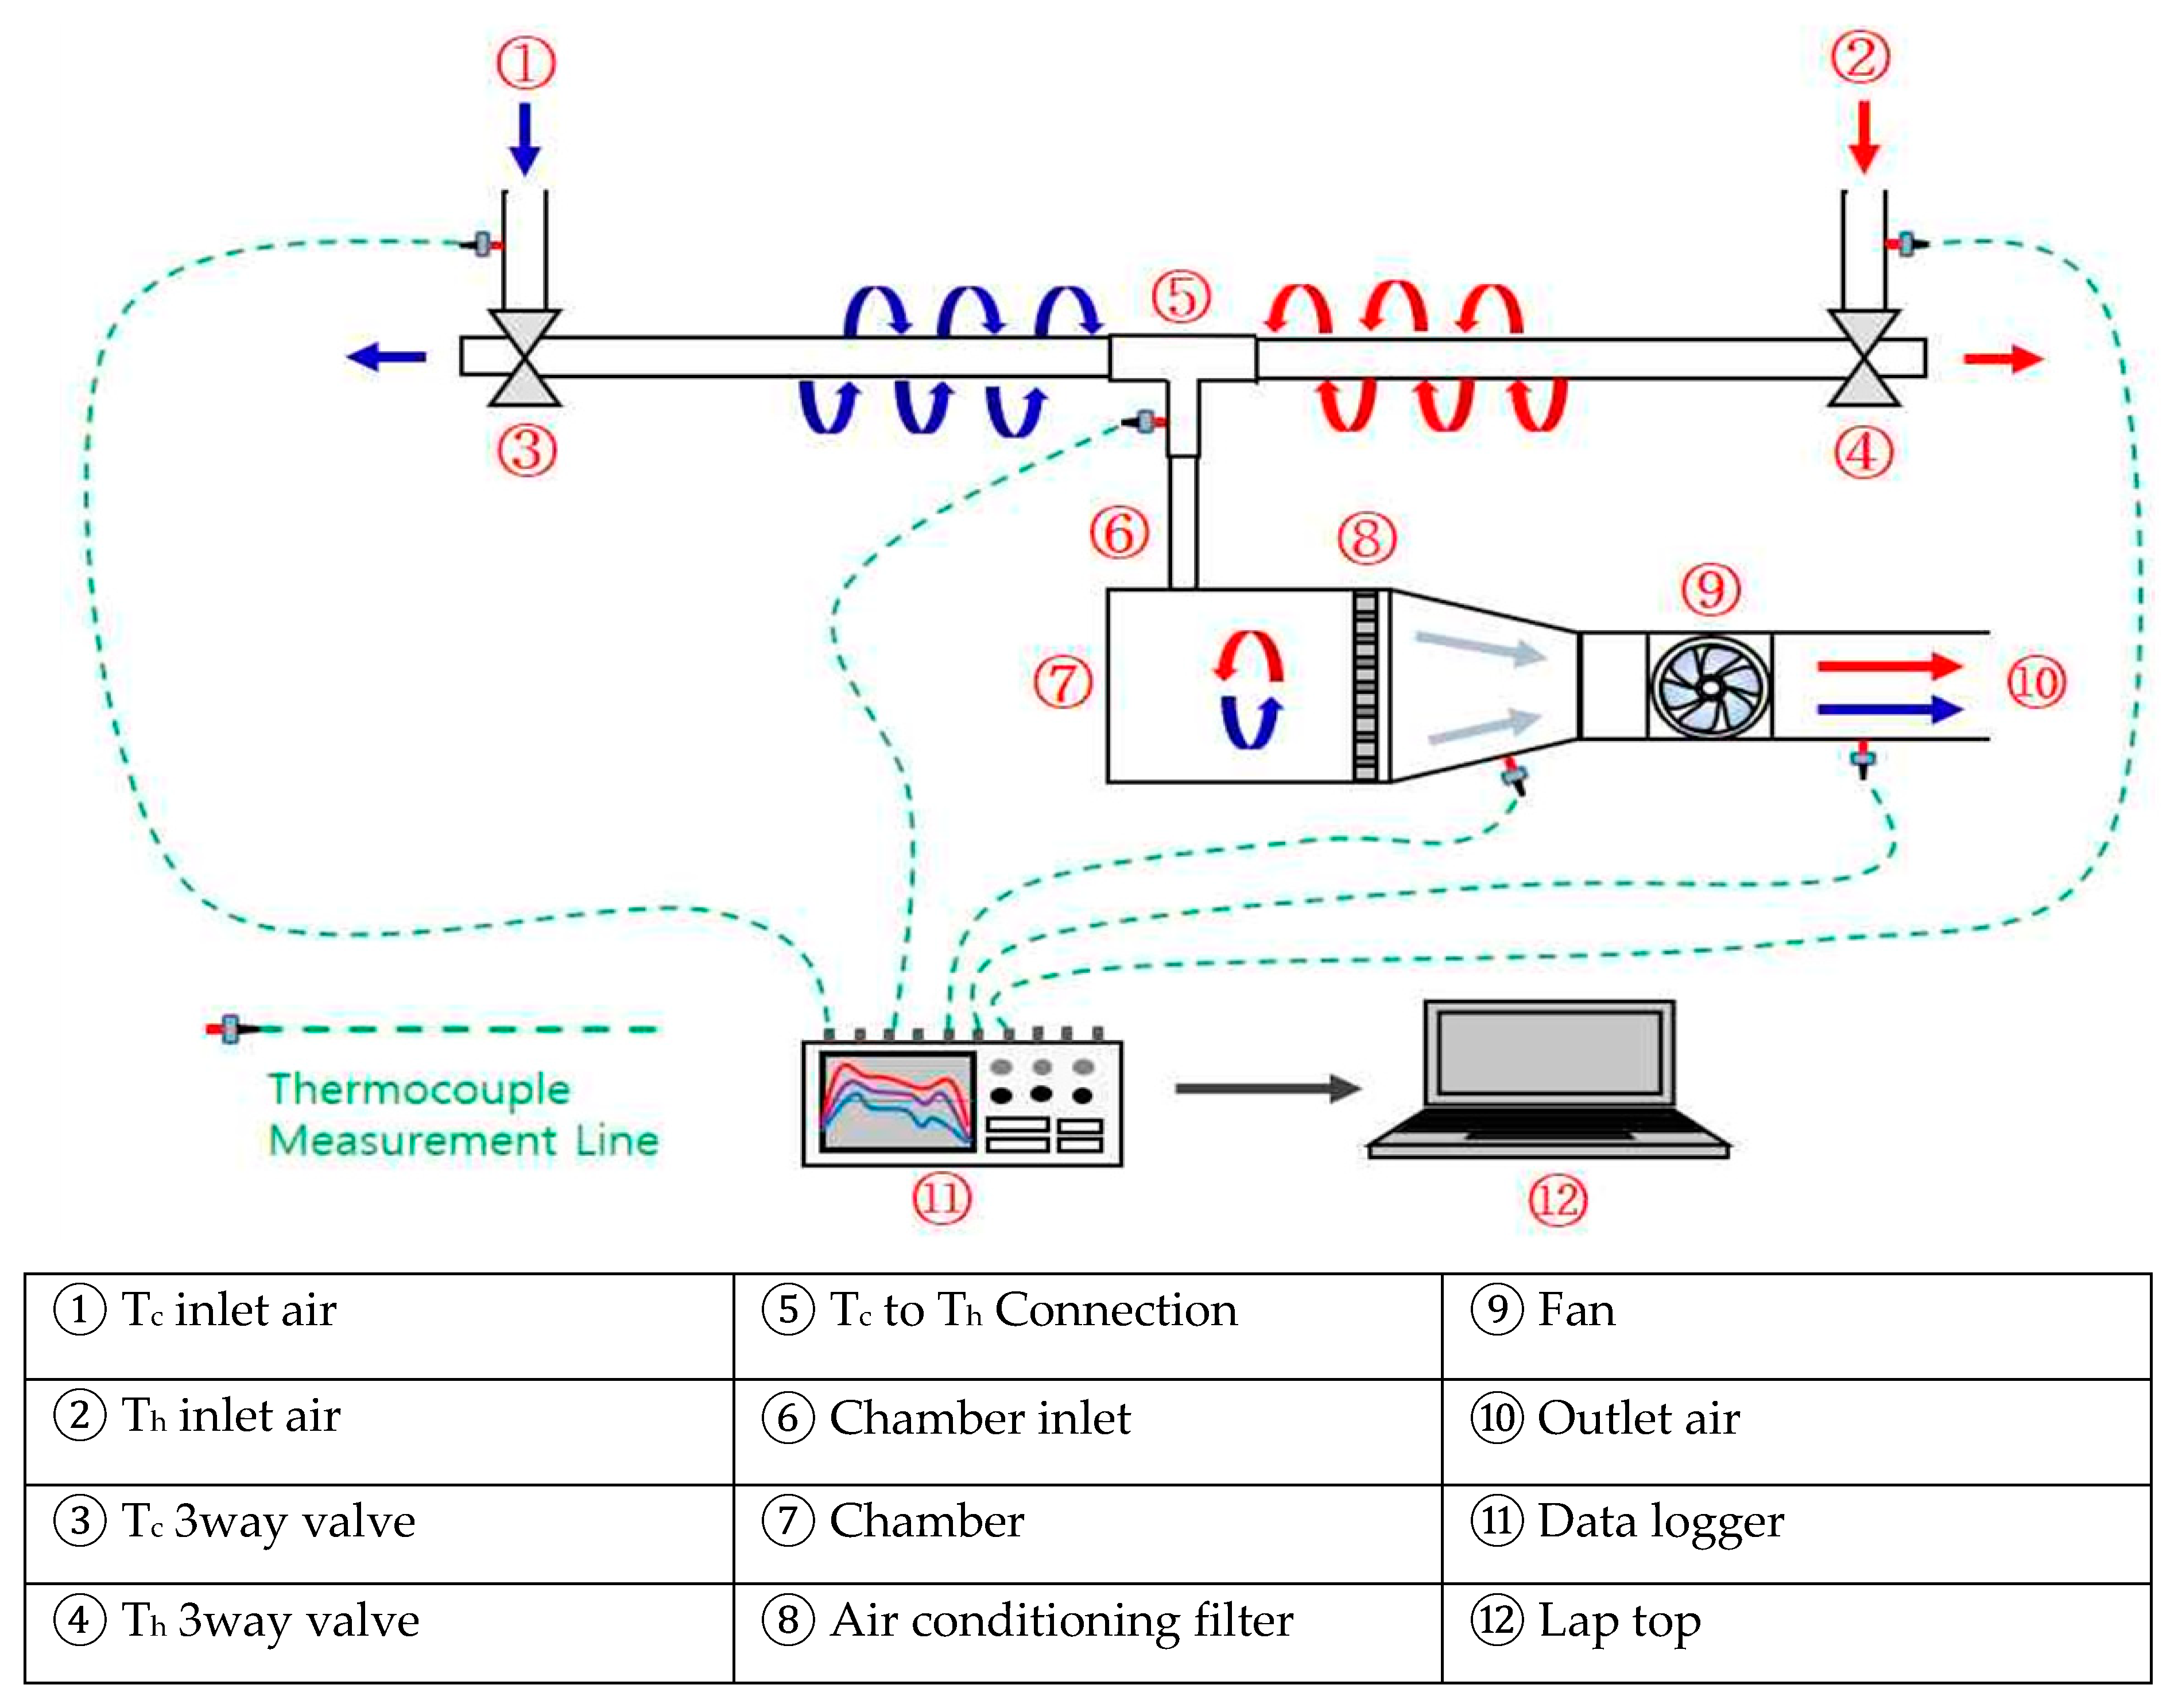
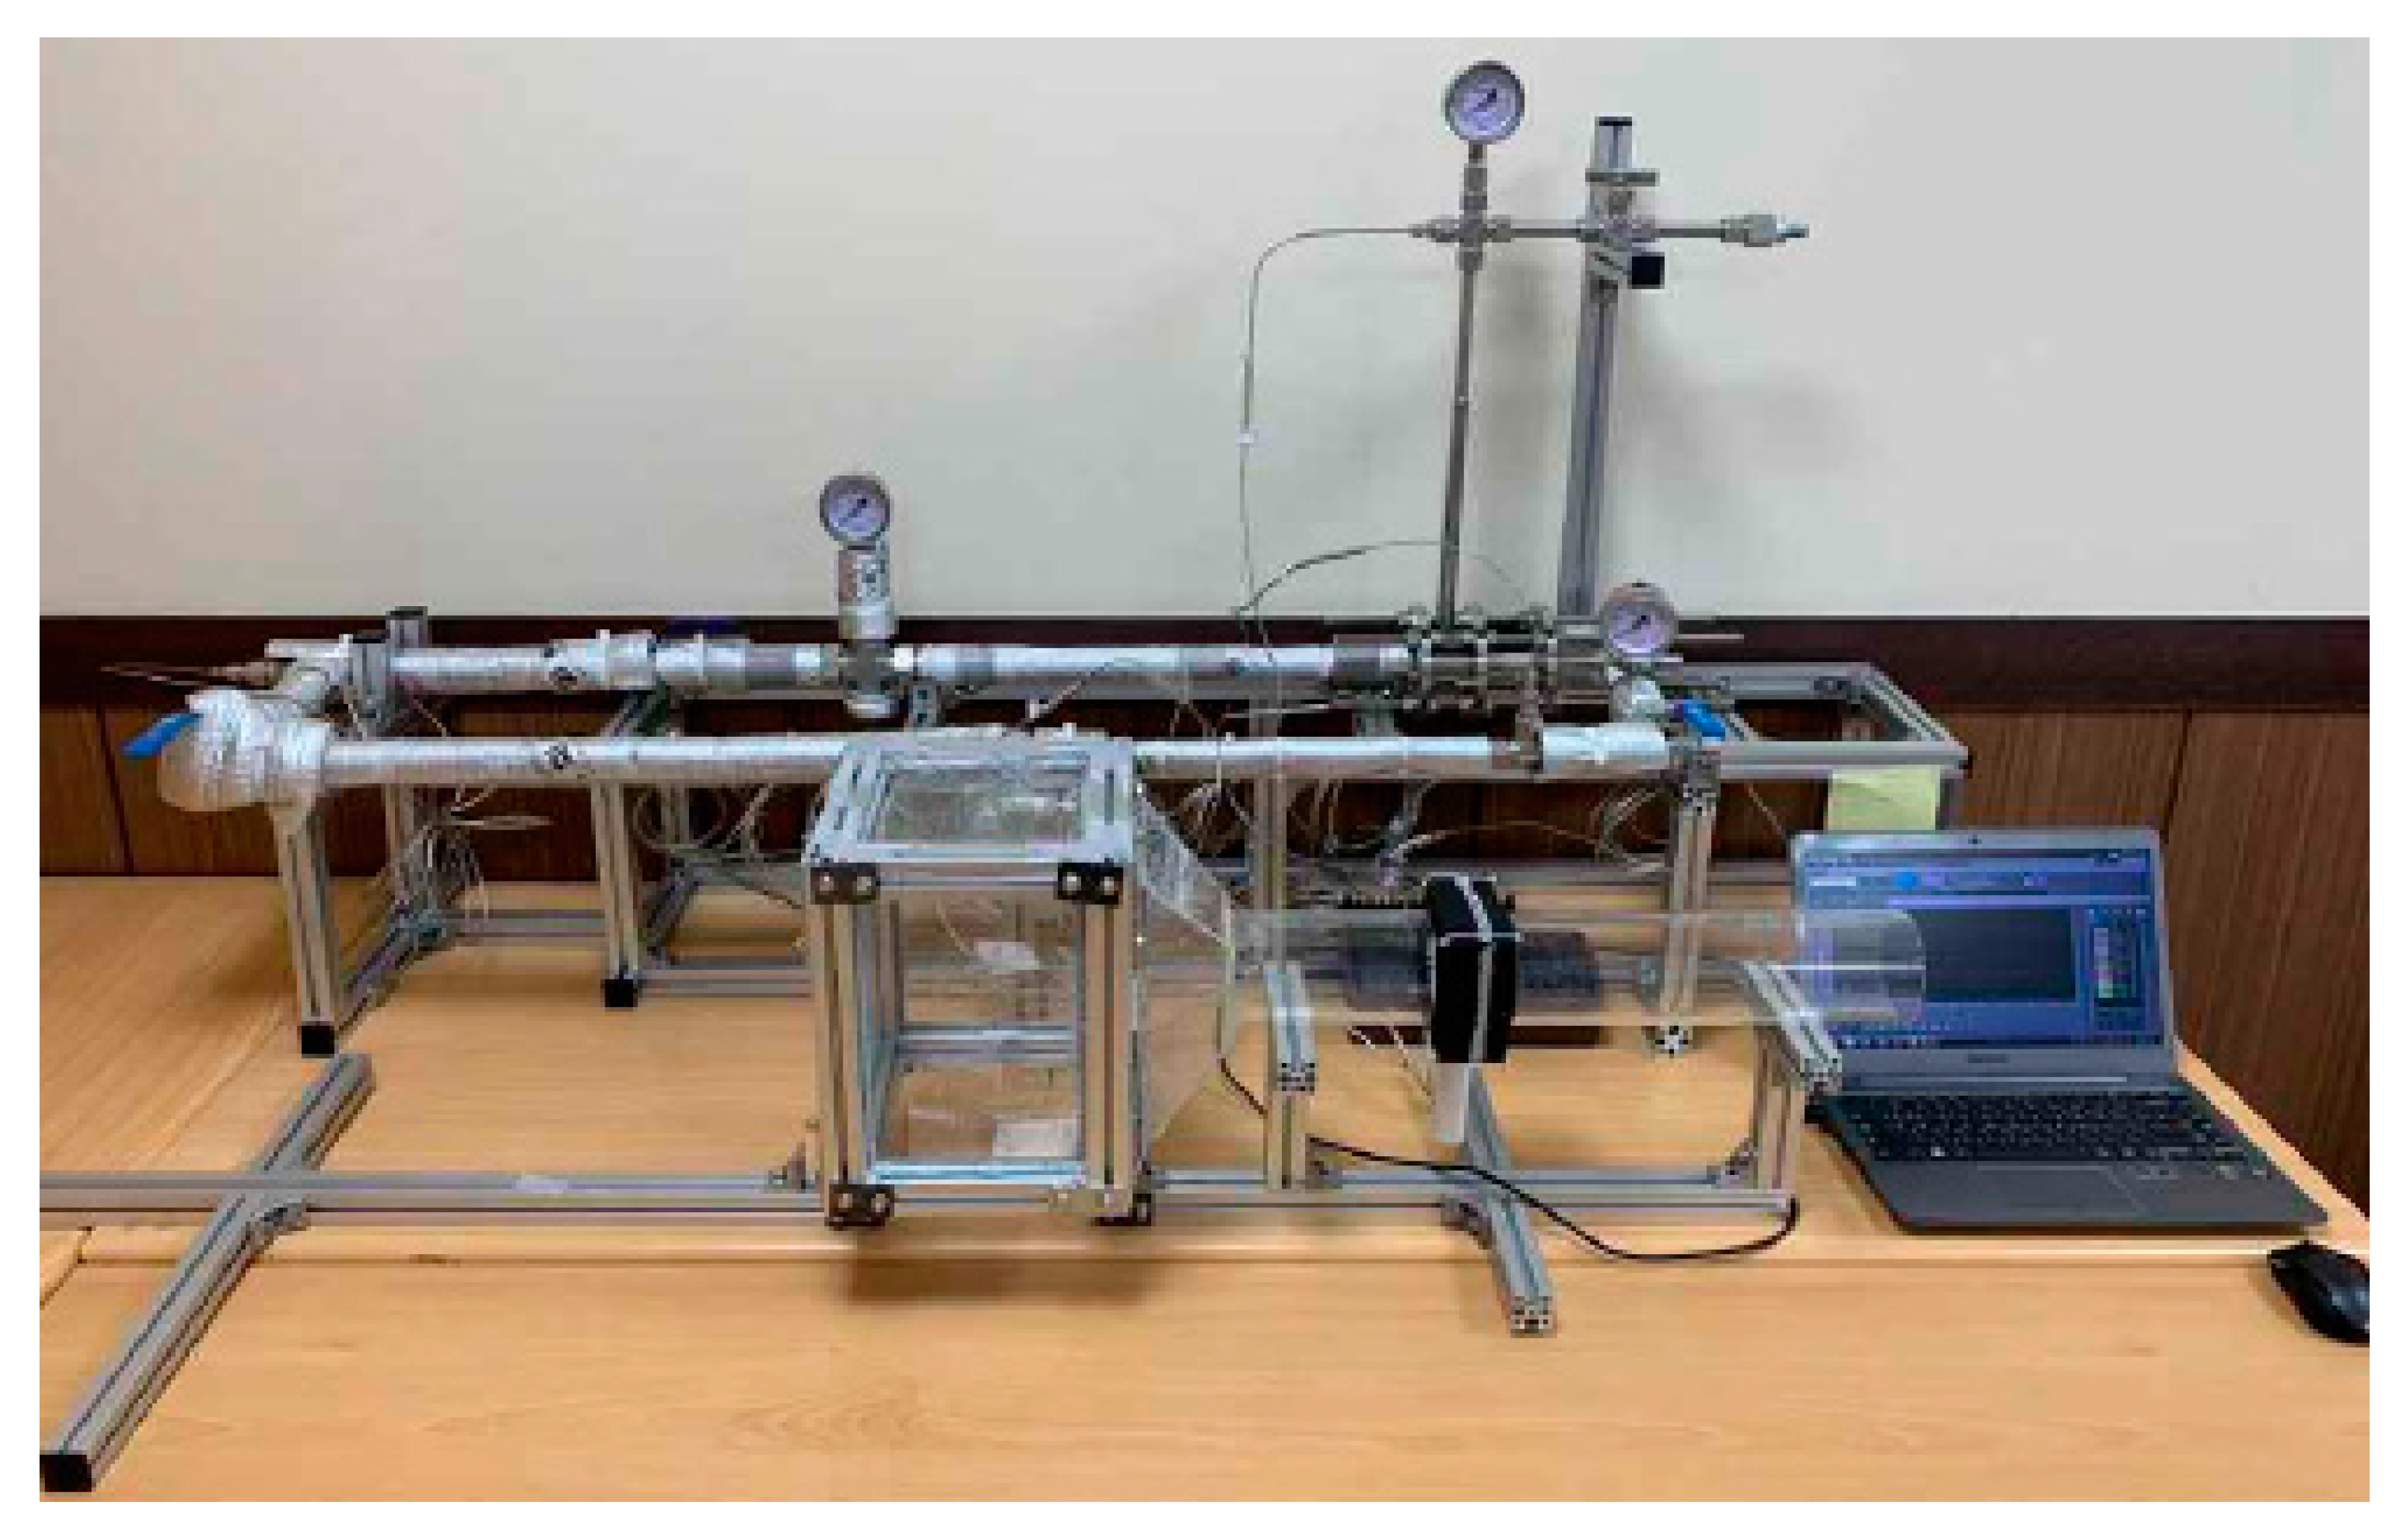
2.3. Experimental Apparatus

Figure 7 and Figure 8 show the schematic and actual experimental device for the indirect heat exchanger. Figure 9 and Figure 10 show a schematic of the direct heat exchange method and an actual experimental device. Configurations of the experimental device for the vortex tube can be largely divided into three types: a supply unit that supplies compressed air, a test unit that performs temperature separation experiments, and a control unit that controls the system. The supply section consists of an air compressor, air dryer, air surge tank, and pressure regulator, which supplies compressed air. The test section consists of a vortex tube and a throttle valve, thermocouple, pressure gauge, flow meter, etc., that can control the low-temperature air flow rate (yc). The control part is composed of a part that controls pressure and flow rate and a part that checks data from each temperature sensor. The air entering the inlets (shown in Figure 7 and Figure 9) is hot and cold air separated through the vortex tube; this air is supplied to each inlet. Table 2 shows the specifications of the device used in the experiment.
The compressed air produced by the compressor enters the surge tank. After enough air is present in the surge tank, it passes through the filter and is supplied to the vortex tube inlet. This phenomenon is a process that is conducted to catch the pulsation of the air generated by the compressor, and the following method was used to reduce the experimental error. Then, the supplied air passes through the vortex generator, and the vortex is generated inside the experimental apparatus. The generated vortex induces an energy separation phenomenon in the tube structure, and air separates into hot air and cold air and is discharged. Each type of air is then heat exchanged through the heater core. The air that has undergone heat exchange and the outside air are mixed in the chamber; according to the flow of the air, the experiment was performed by dividing it into indirect and direct methods. If there was no difference of 0.1 °C for 100 s, the temperature was determined to be in a normal state, and the corresponding temperature was measured. In addition, the reliability of the experimental results was secured through repeated experiments.

3. Results and Discussion

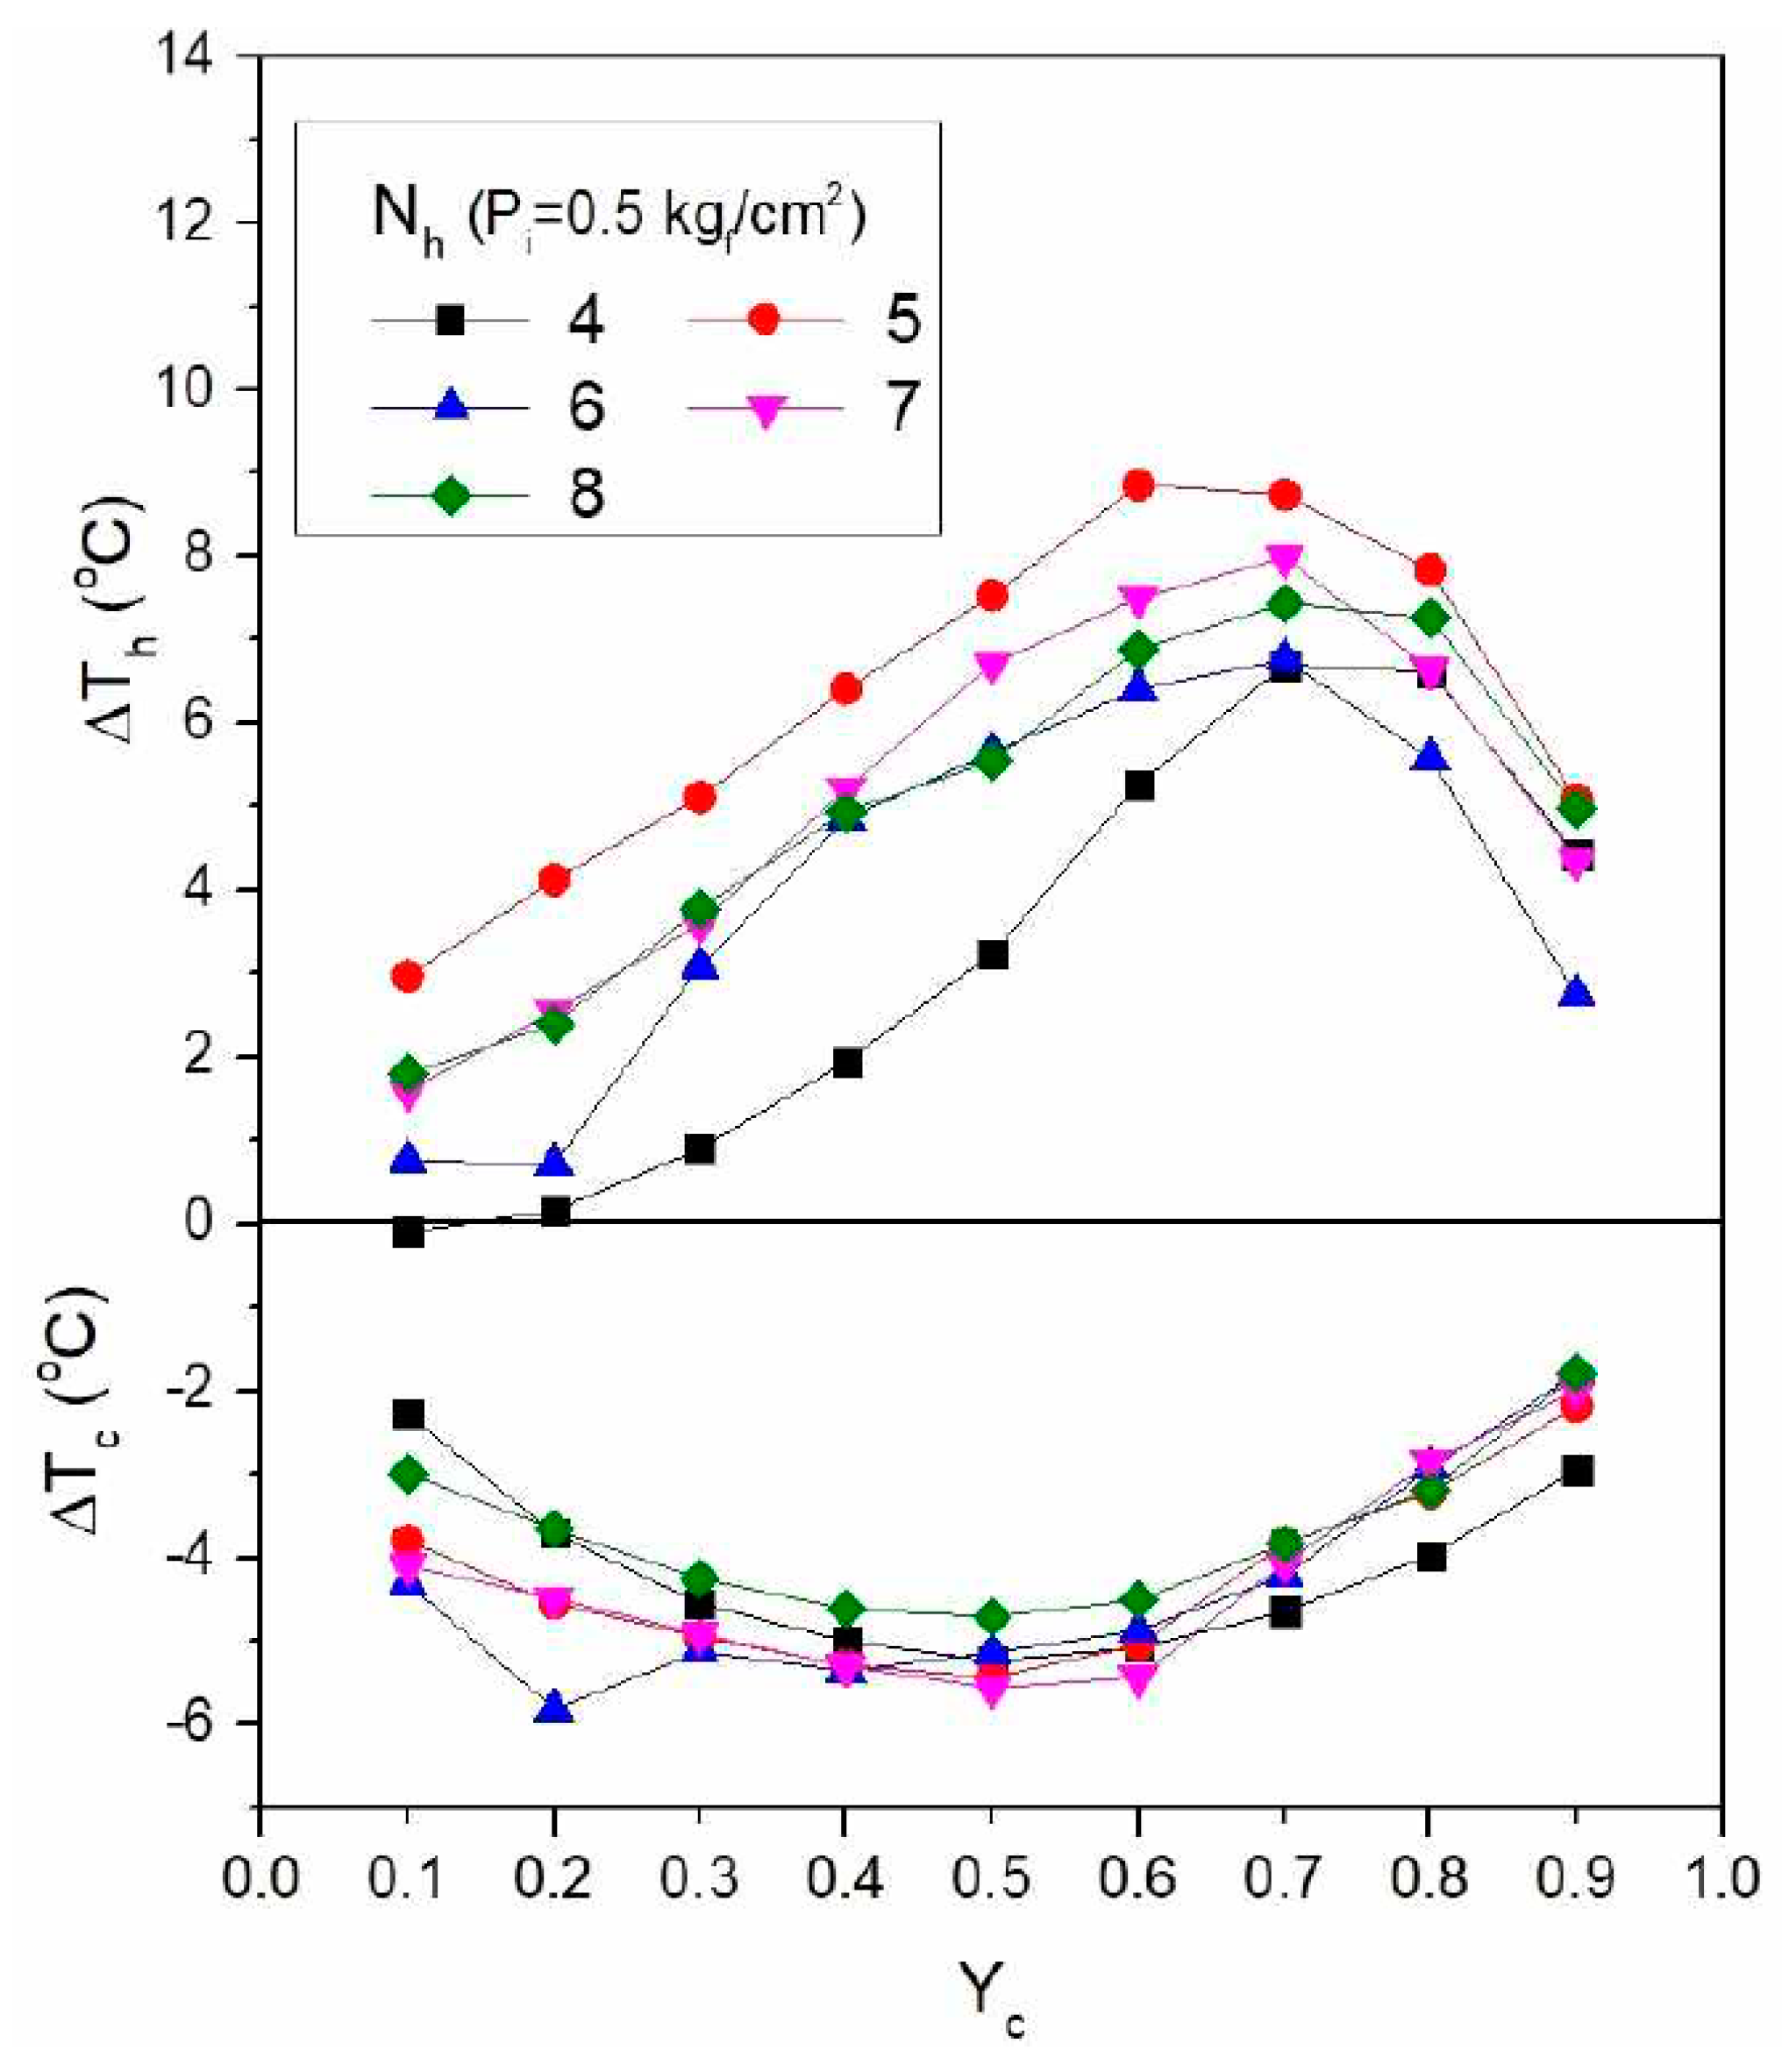
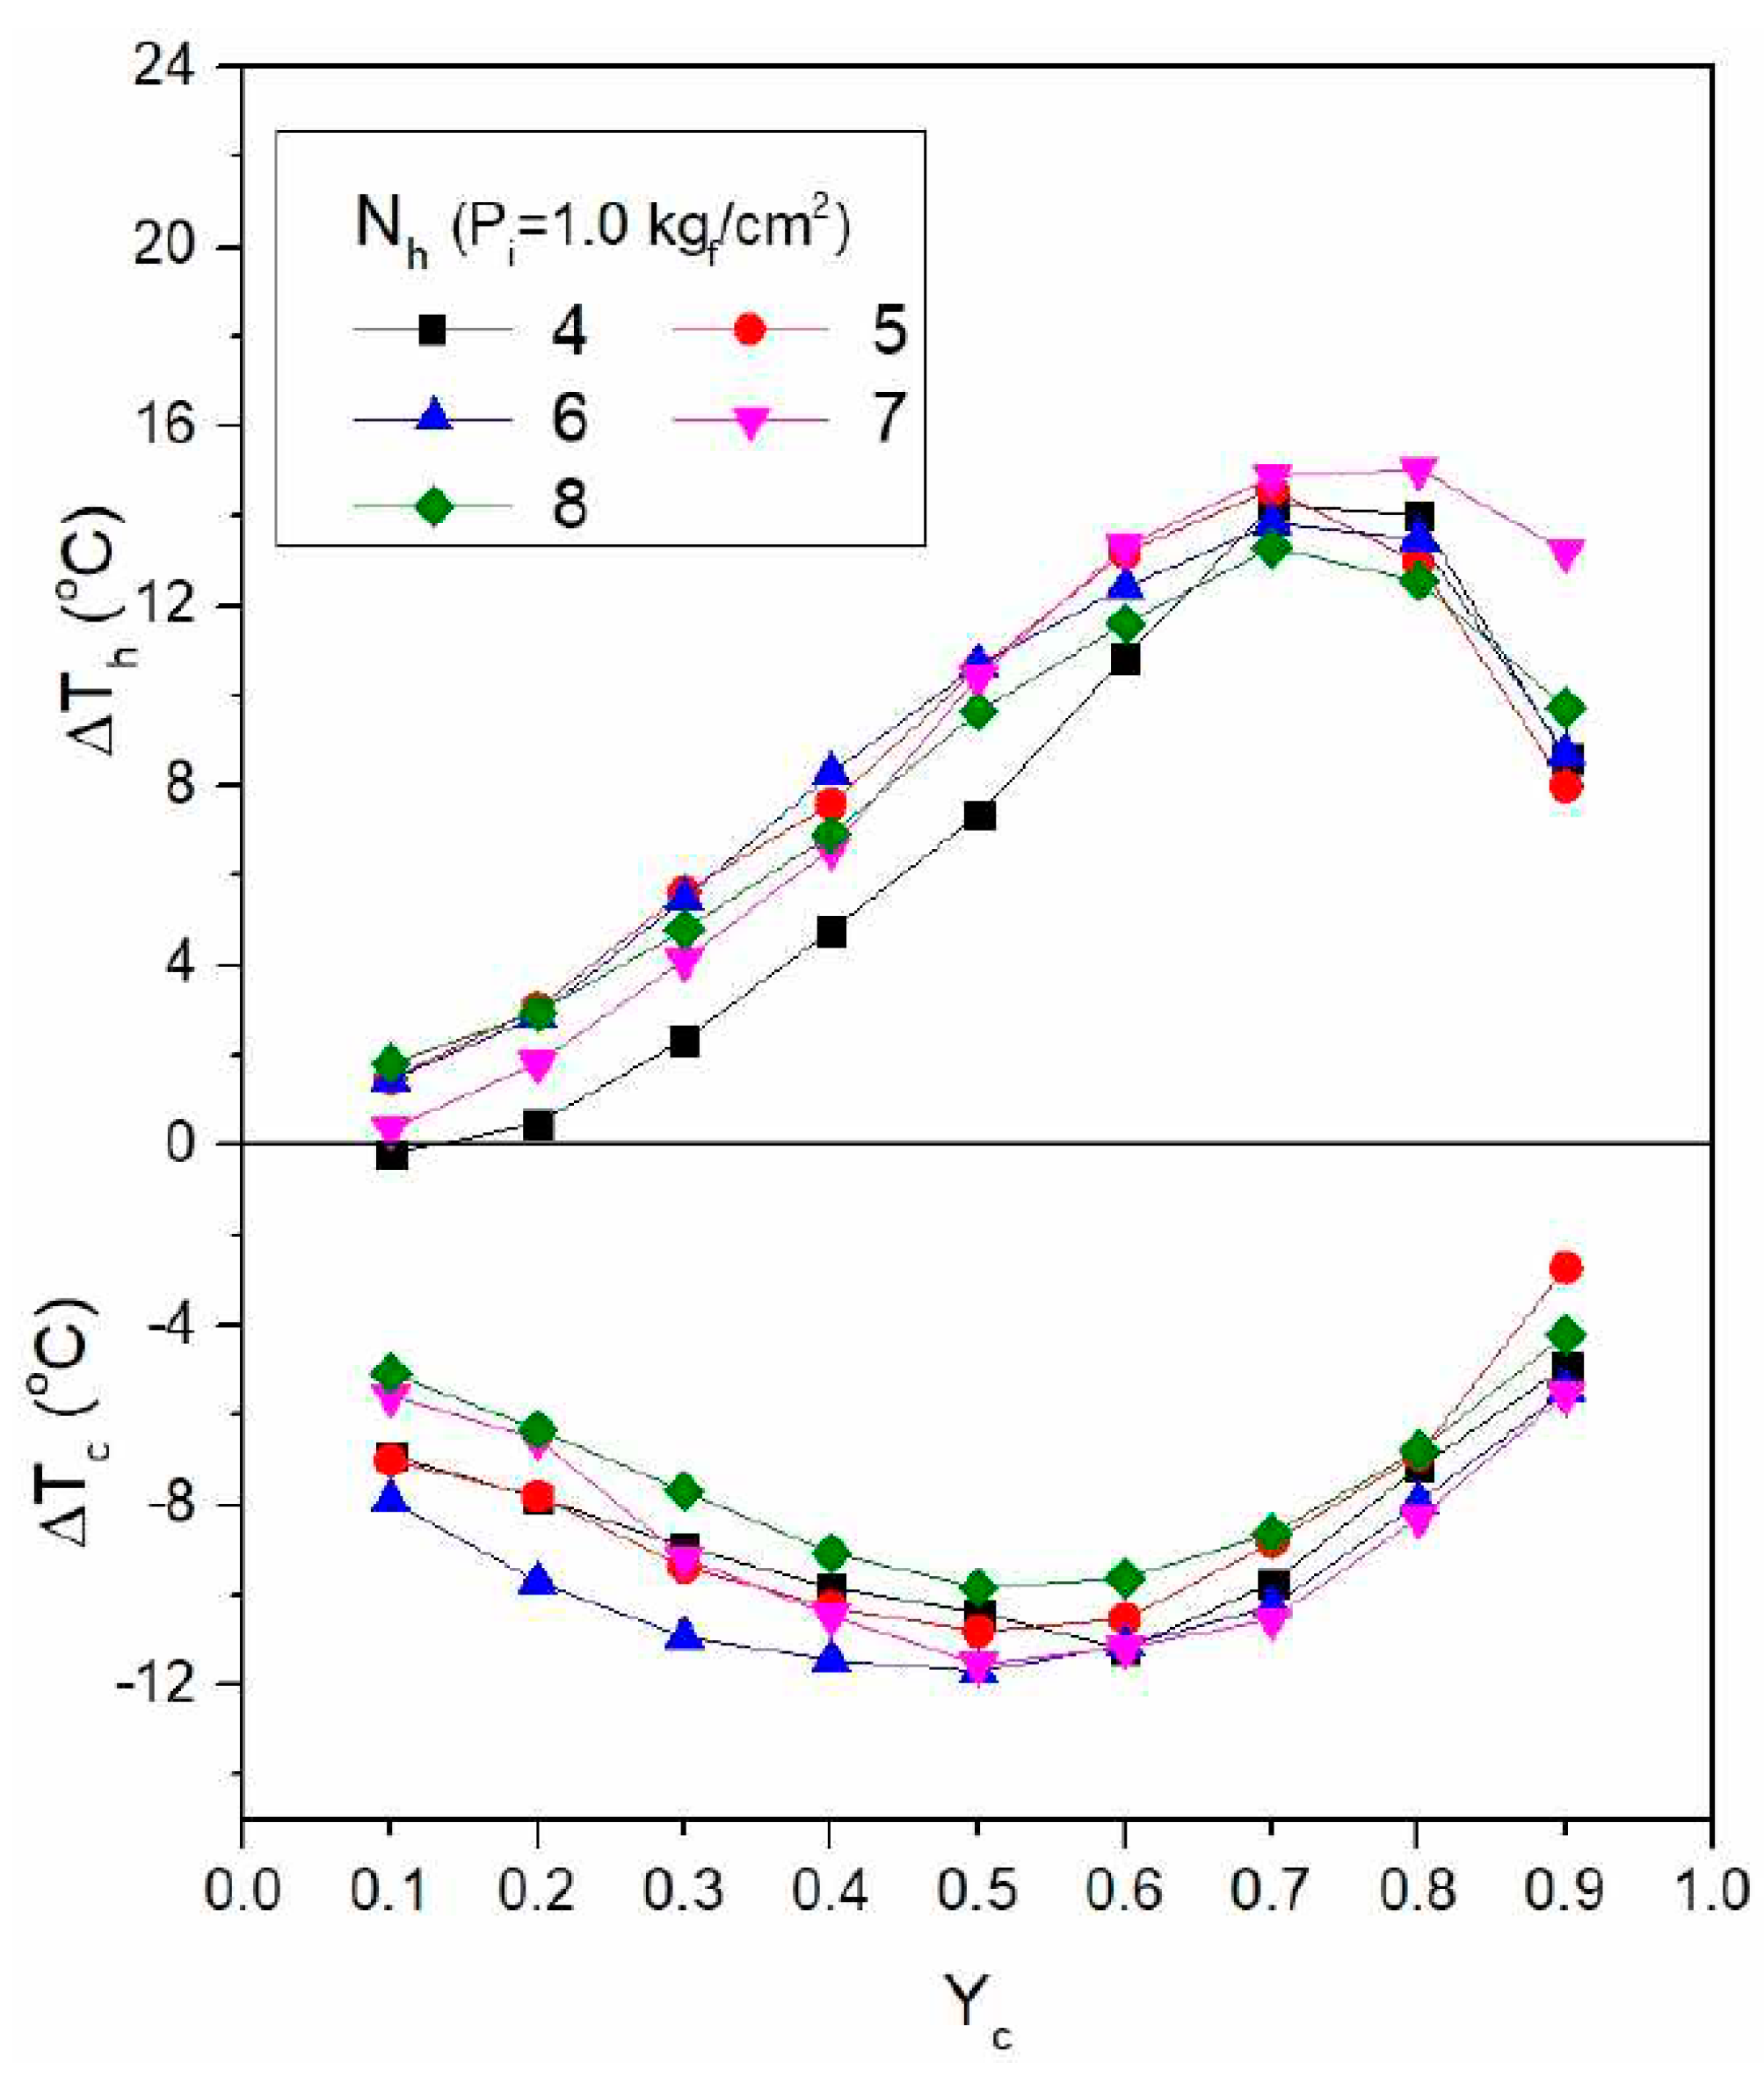
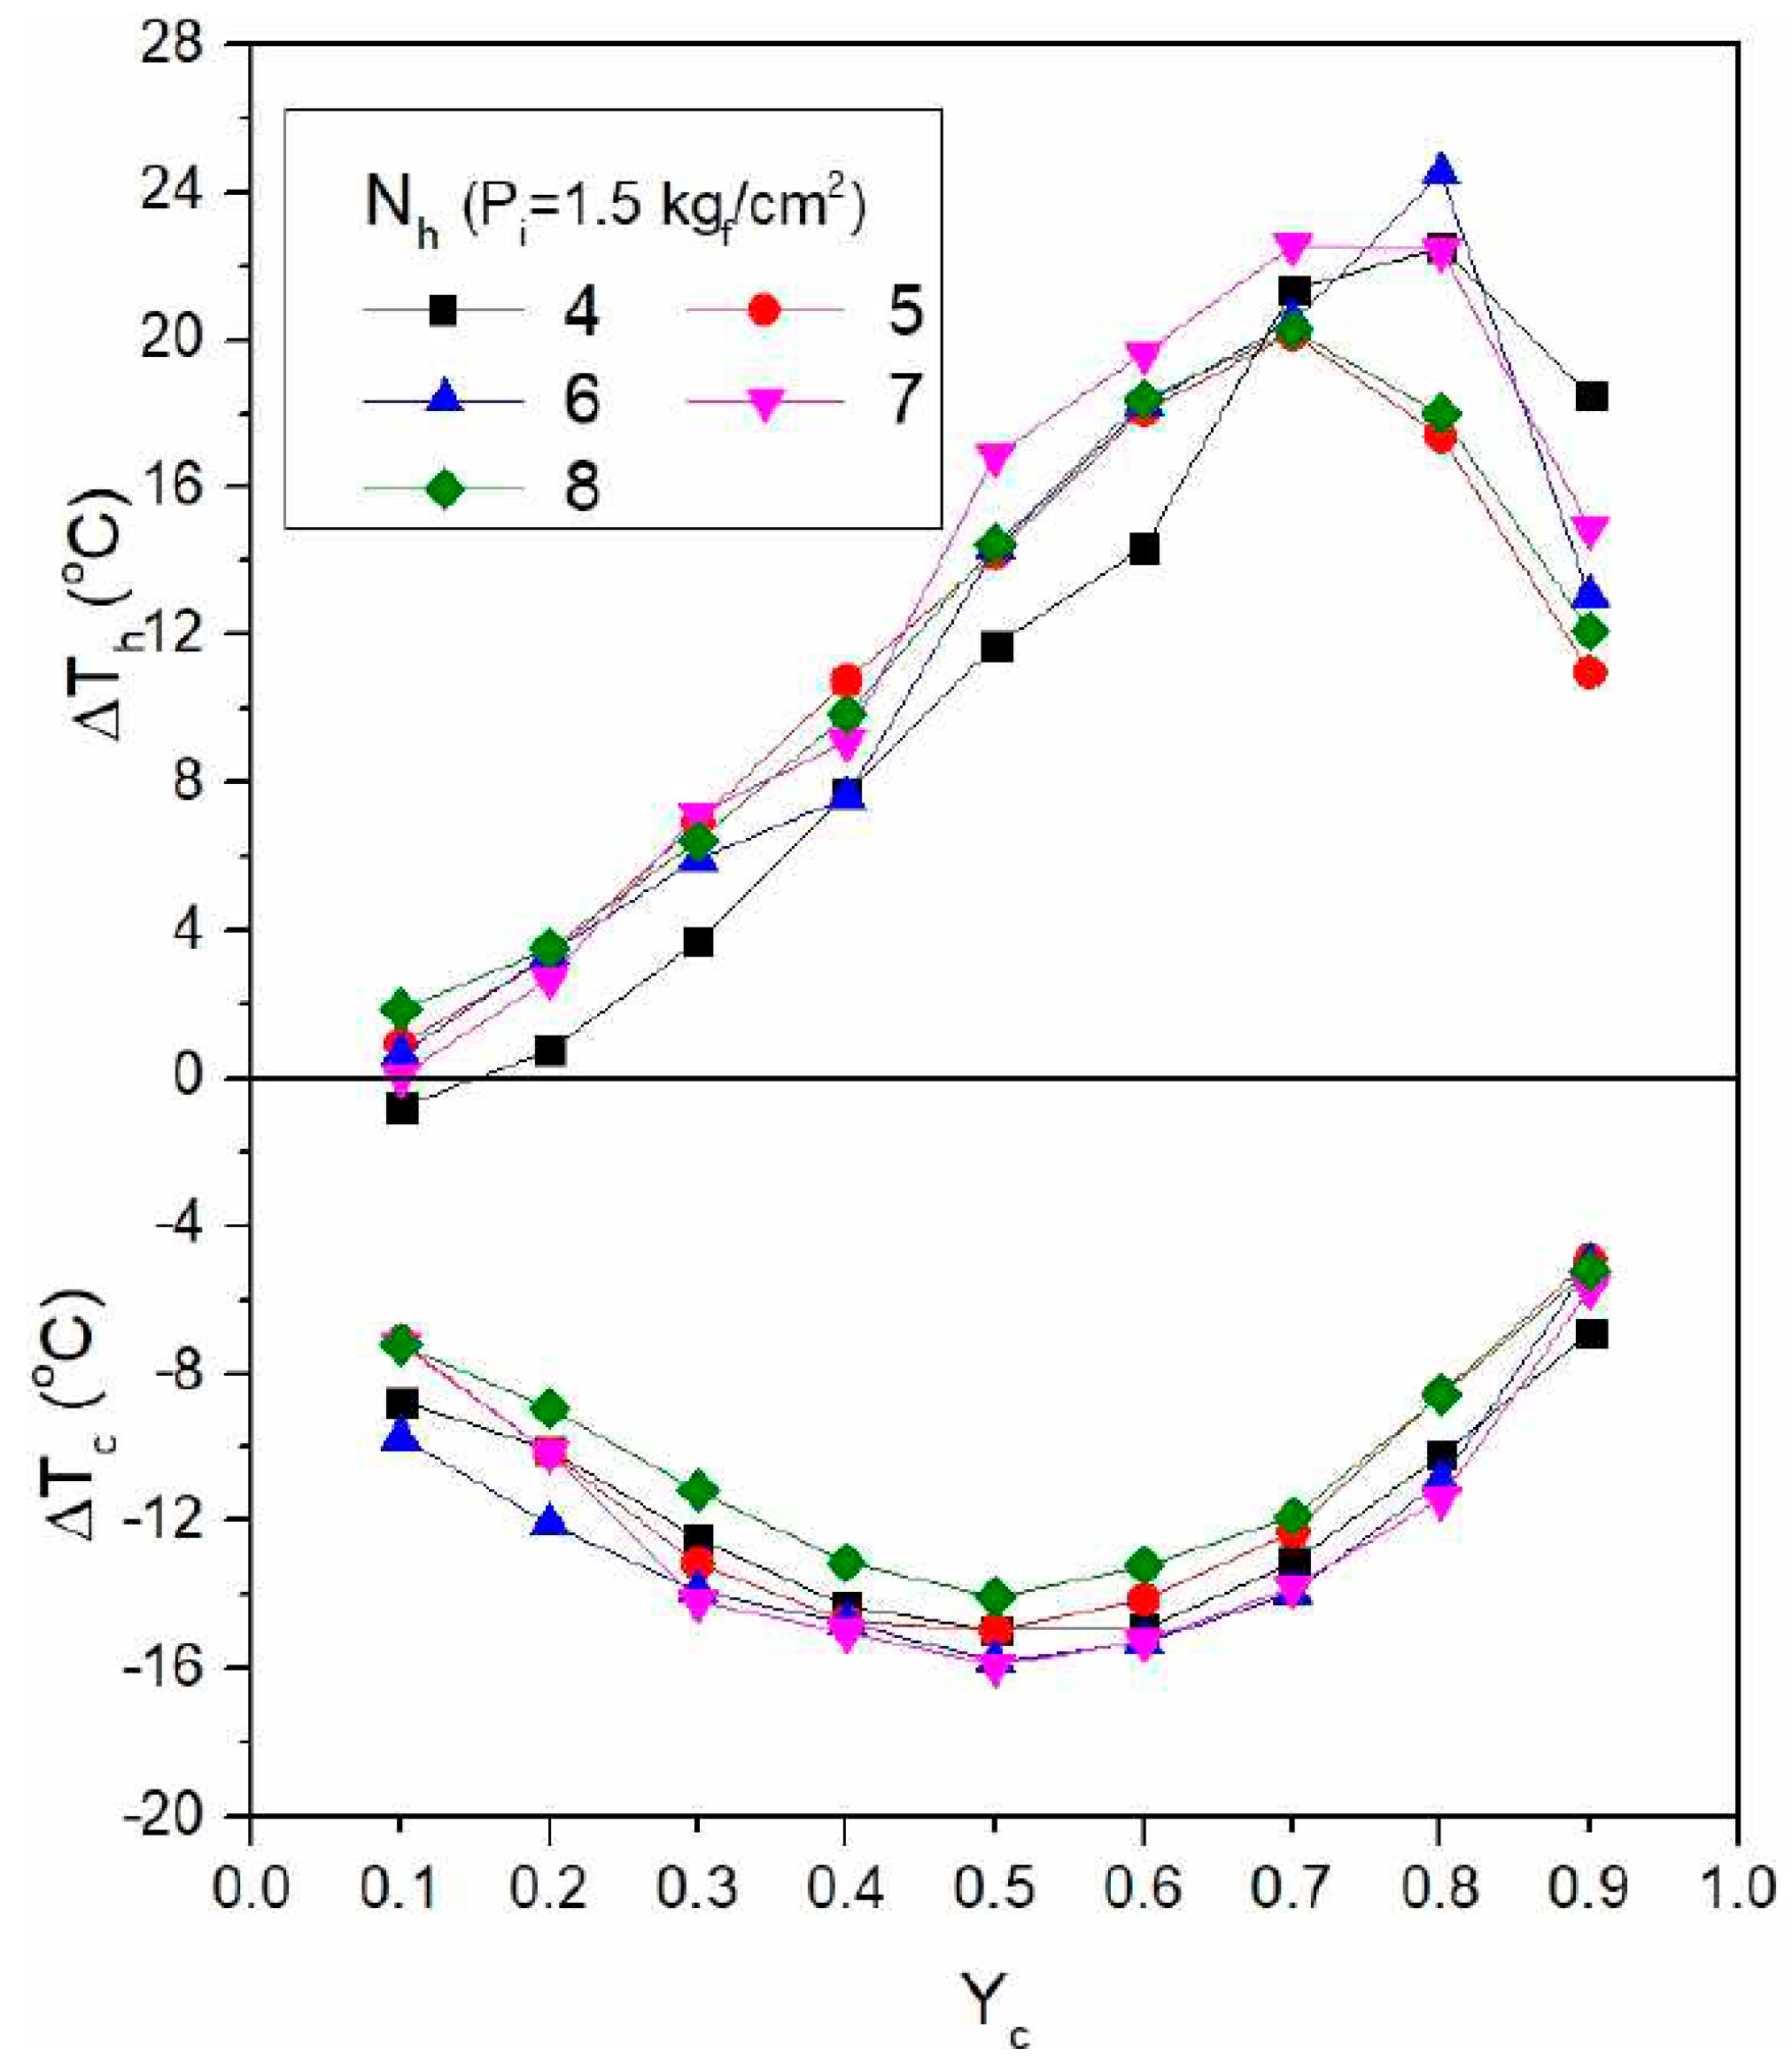
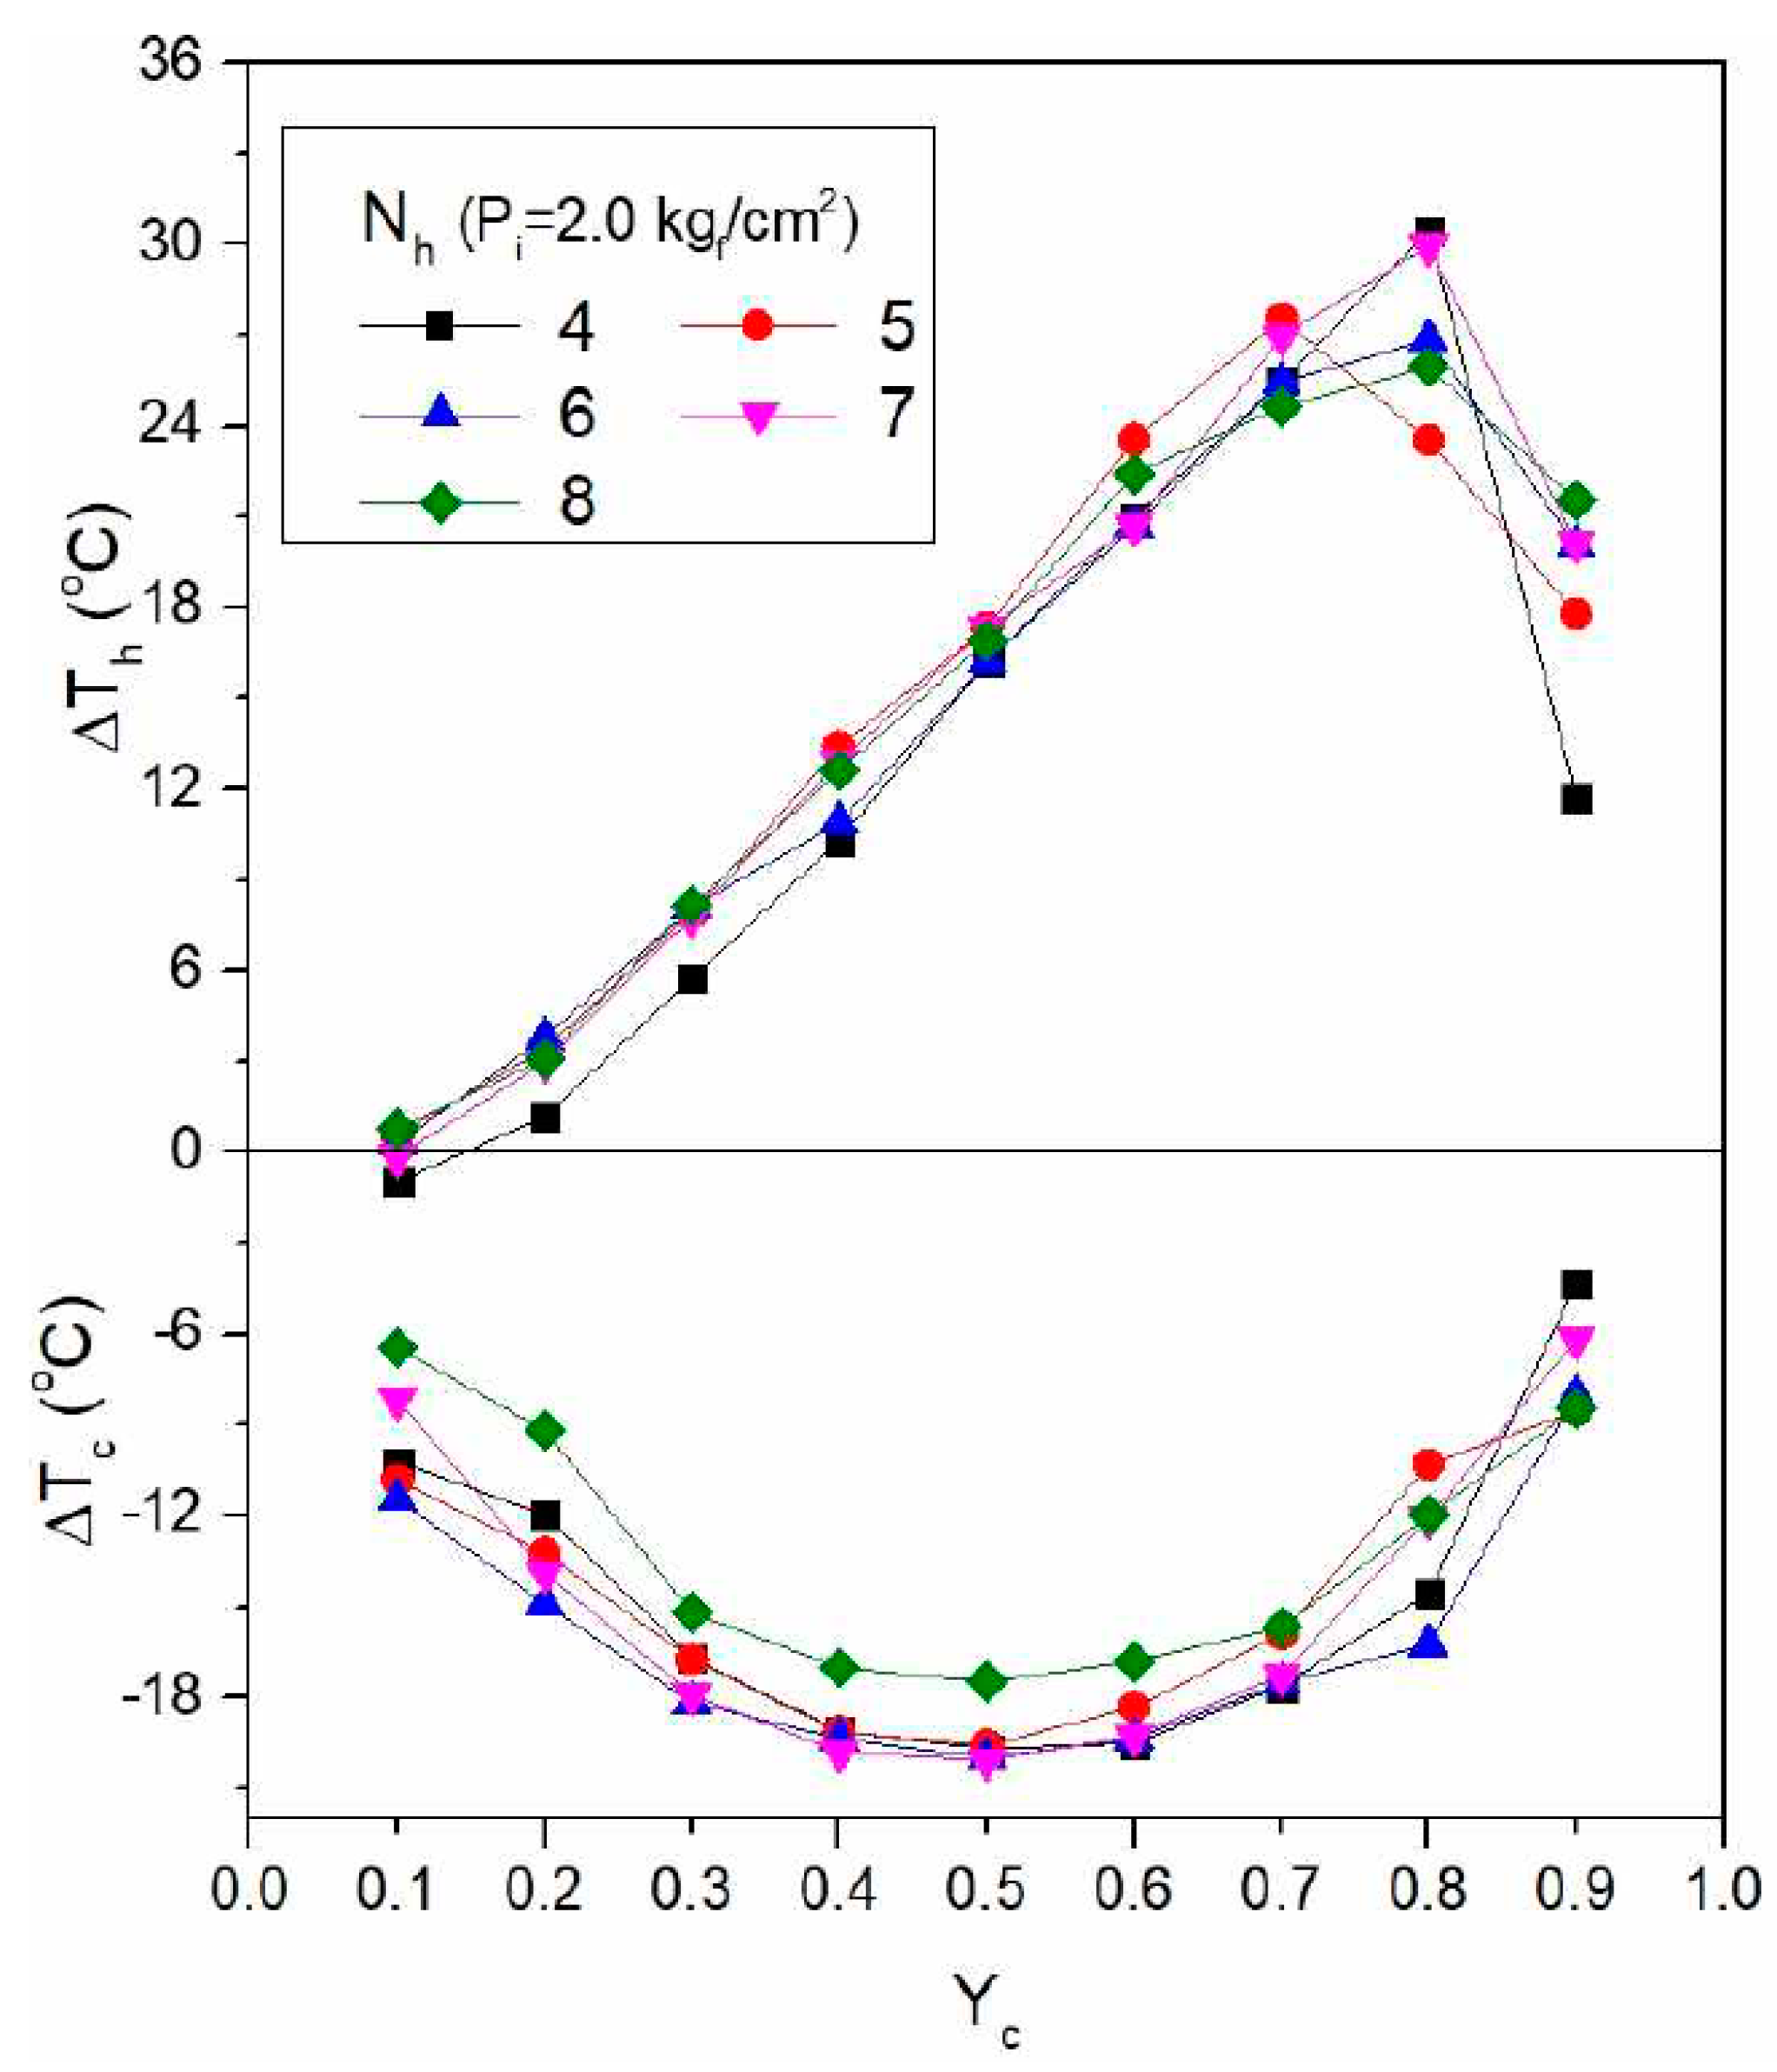
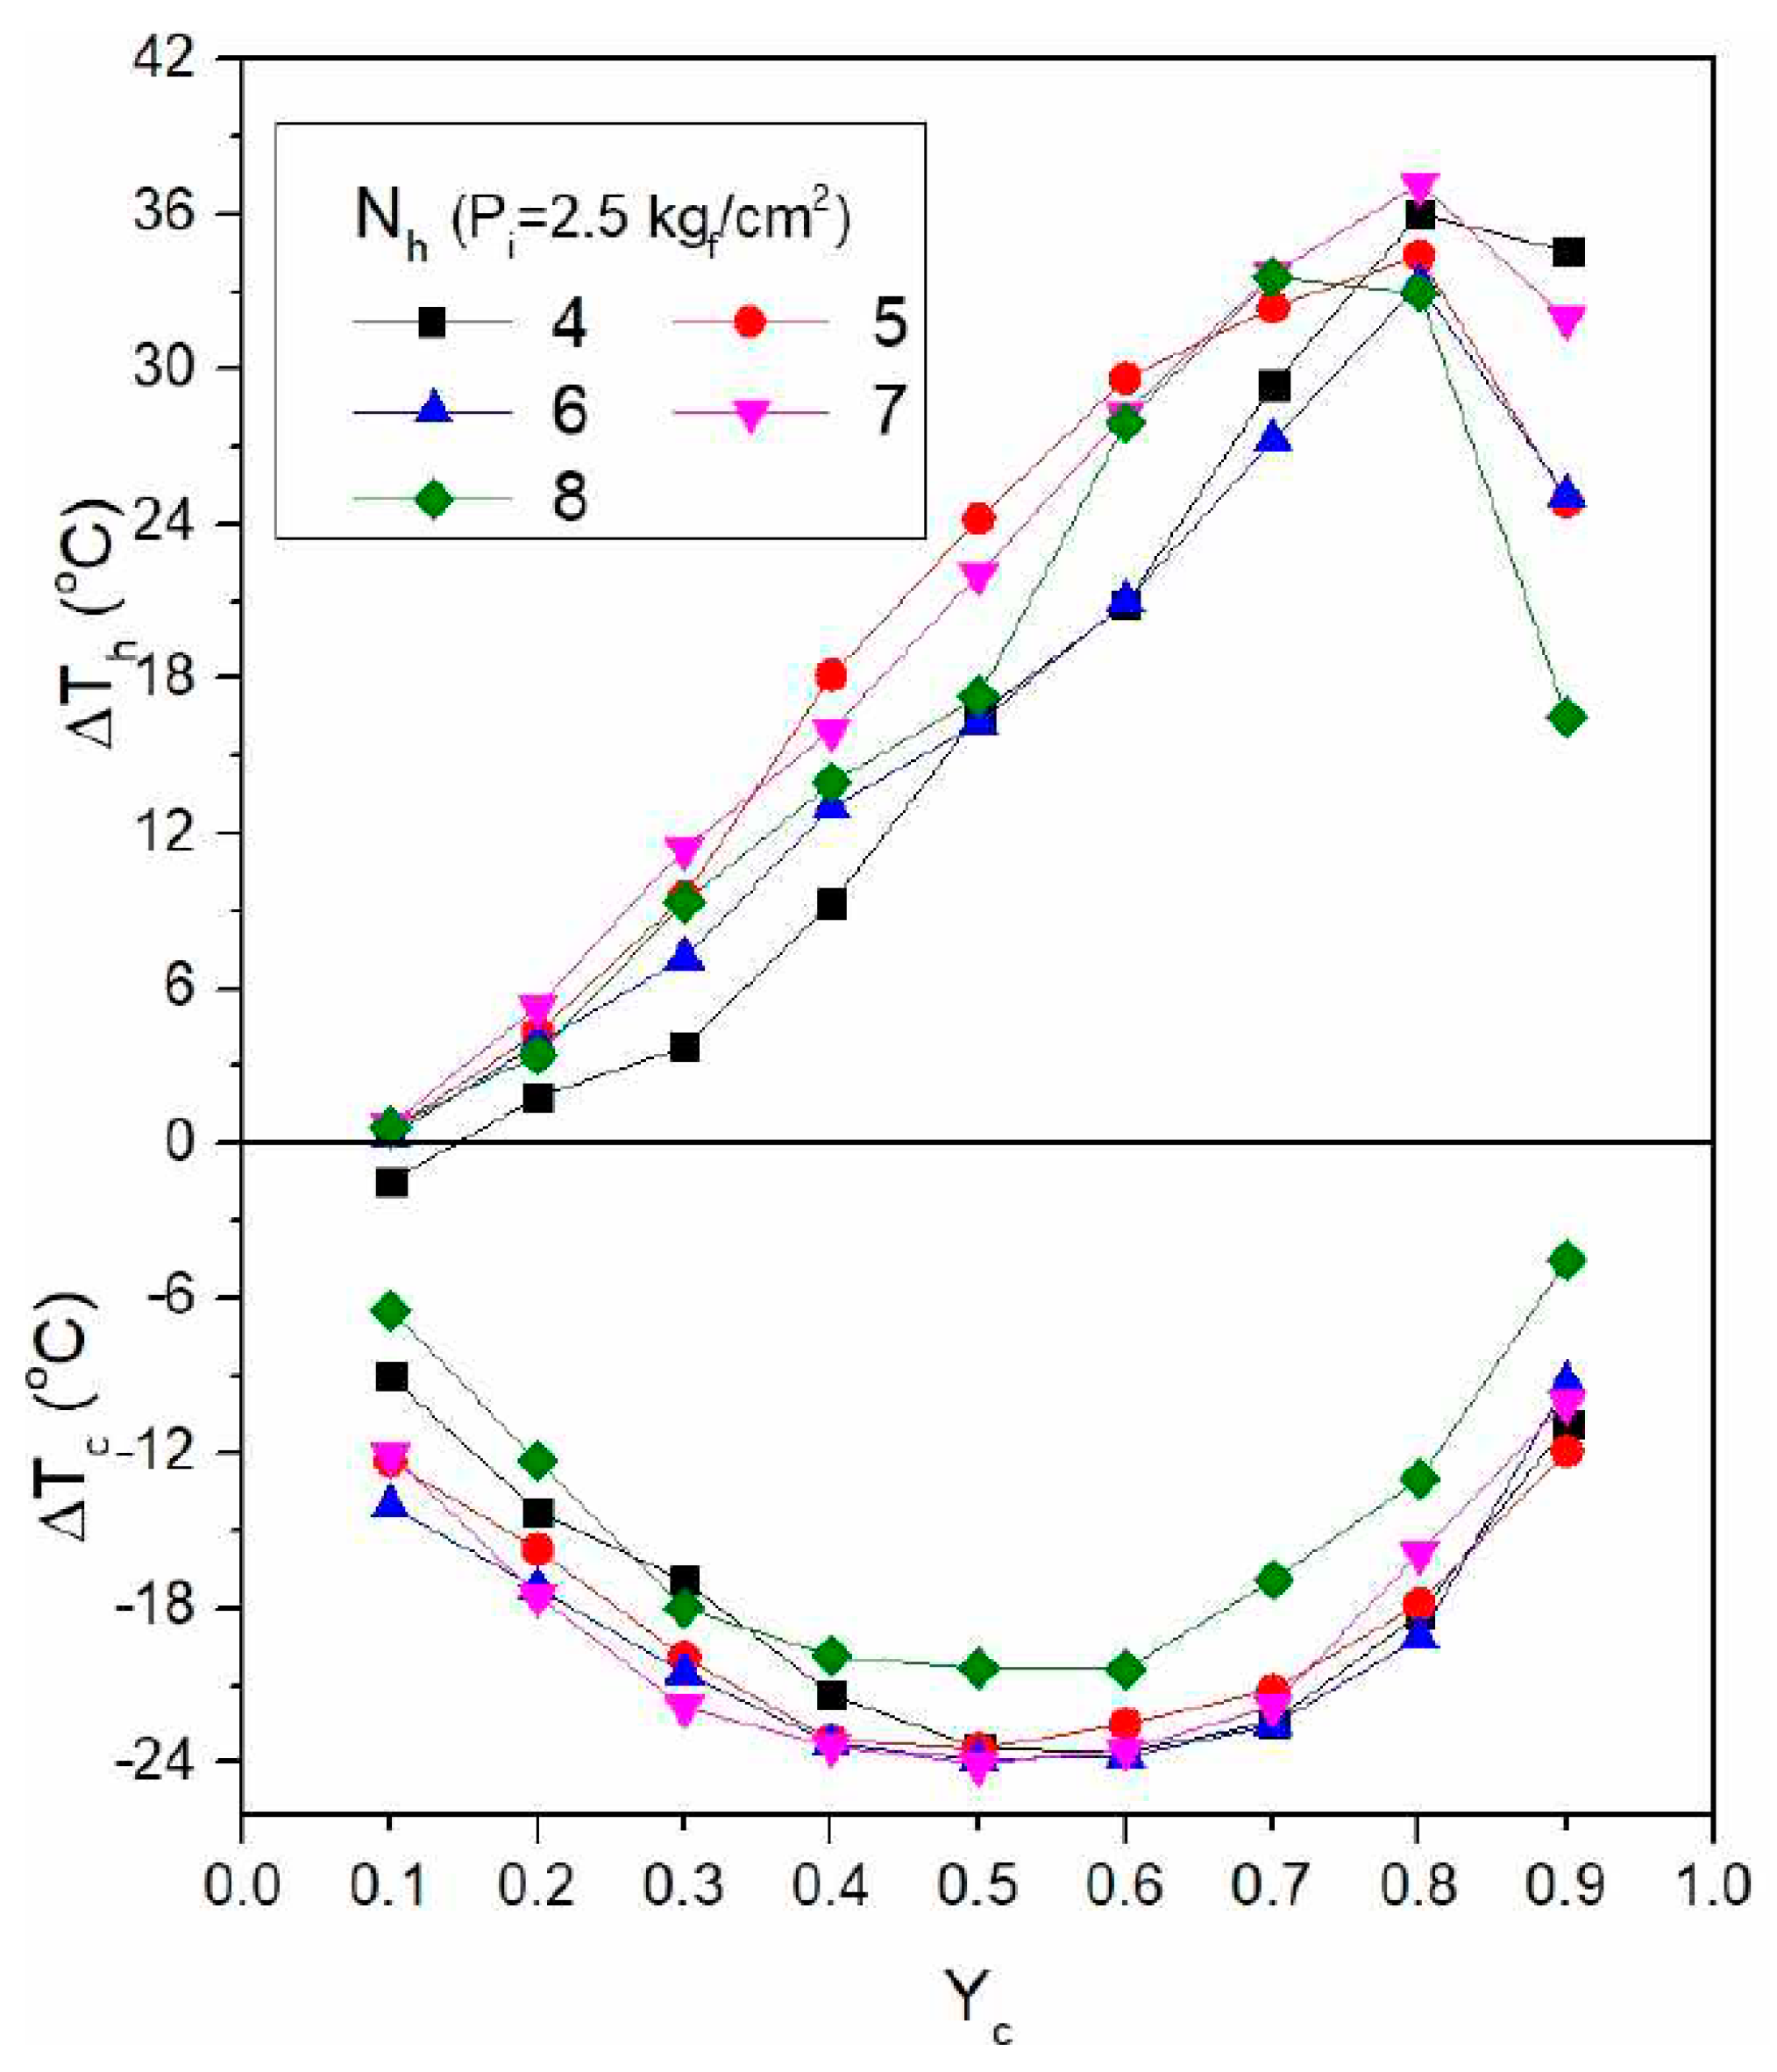
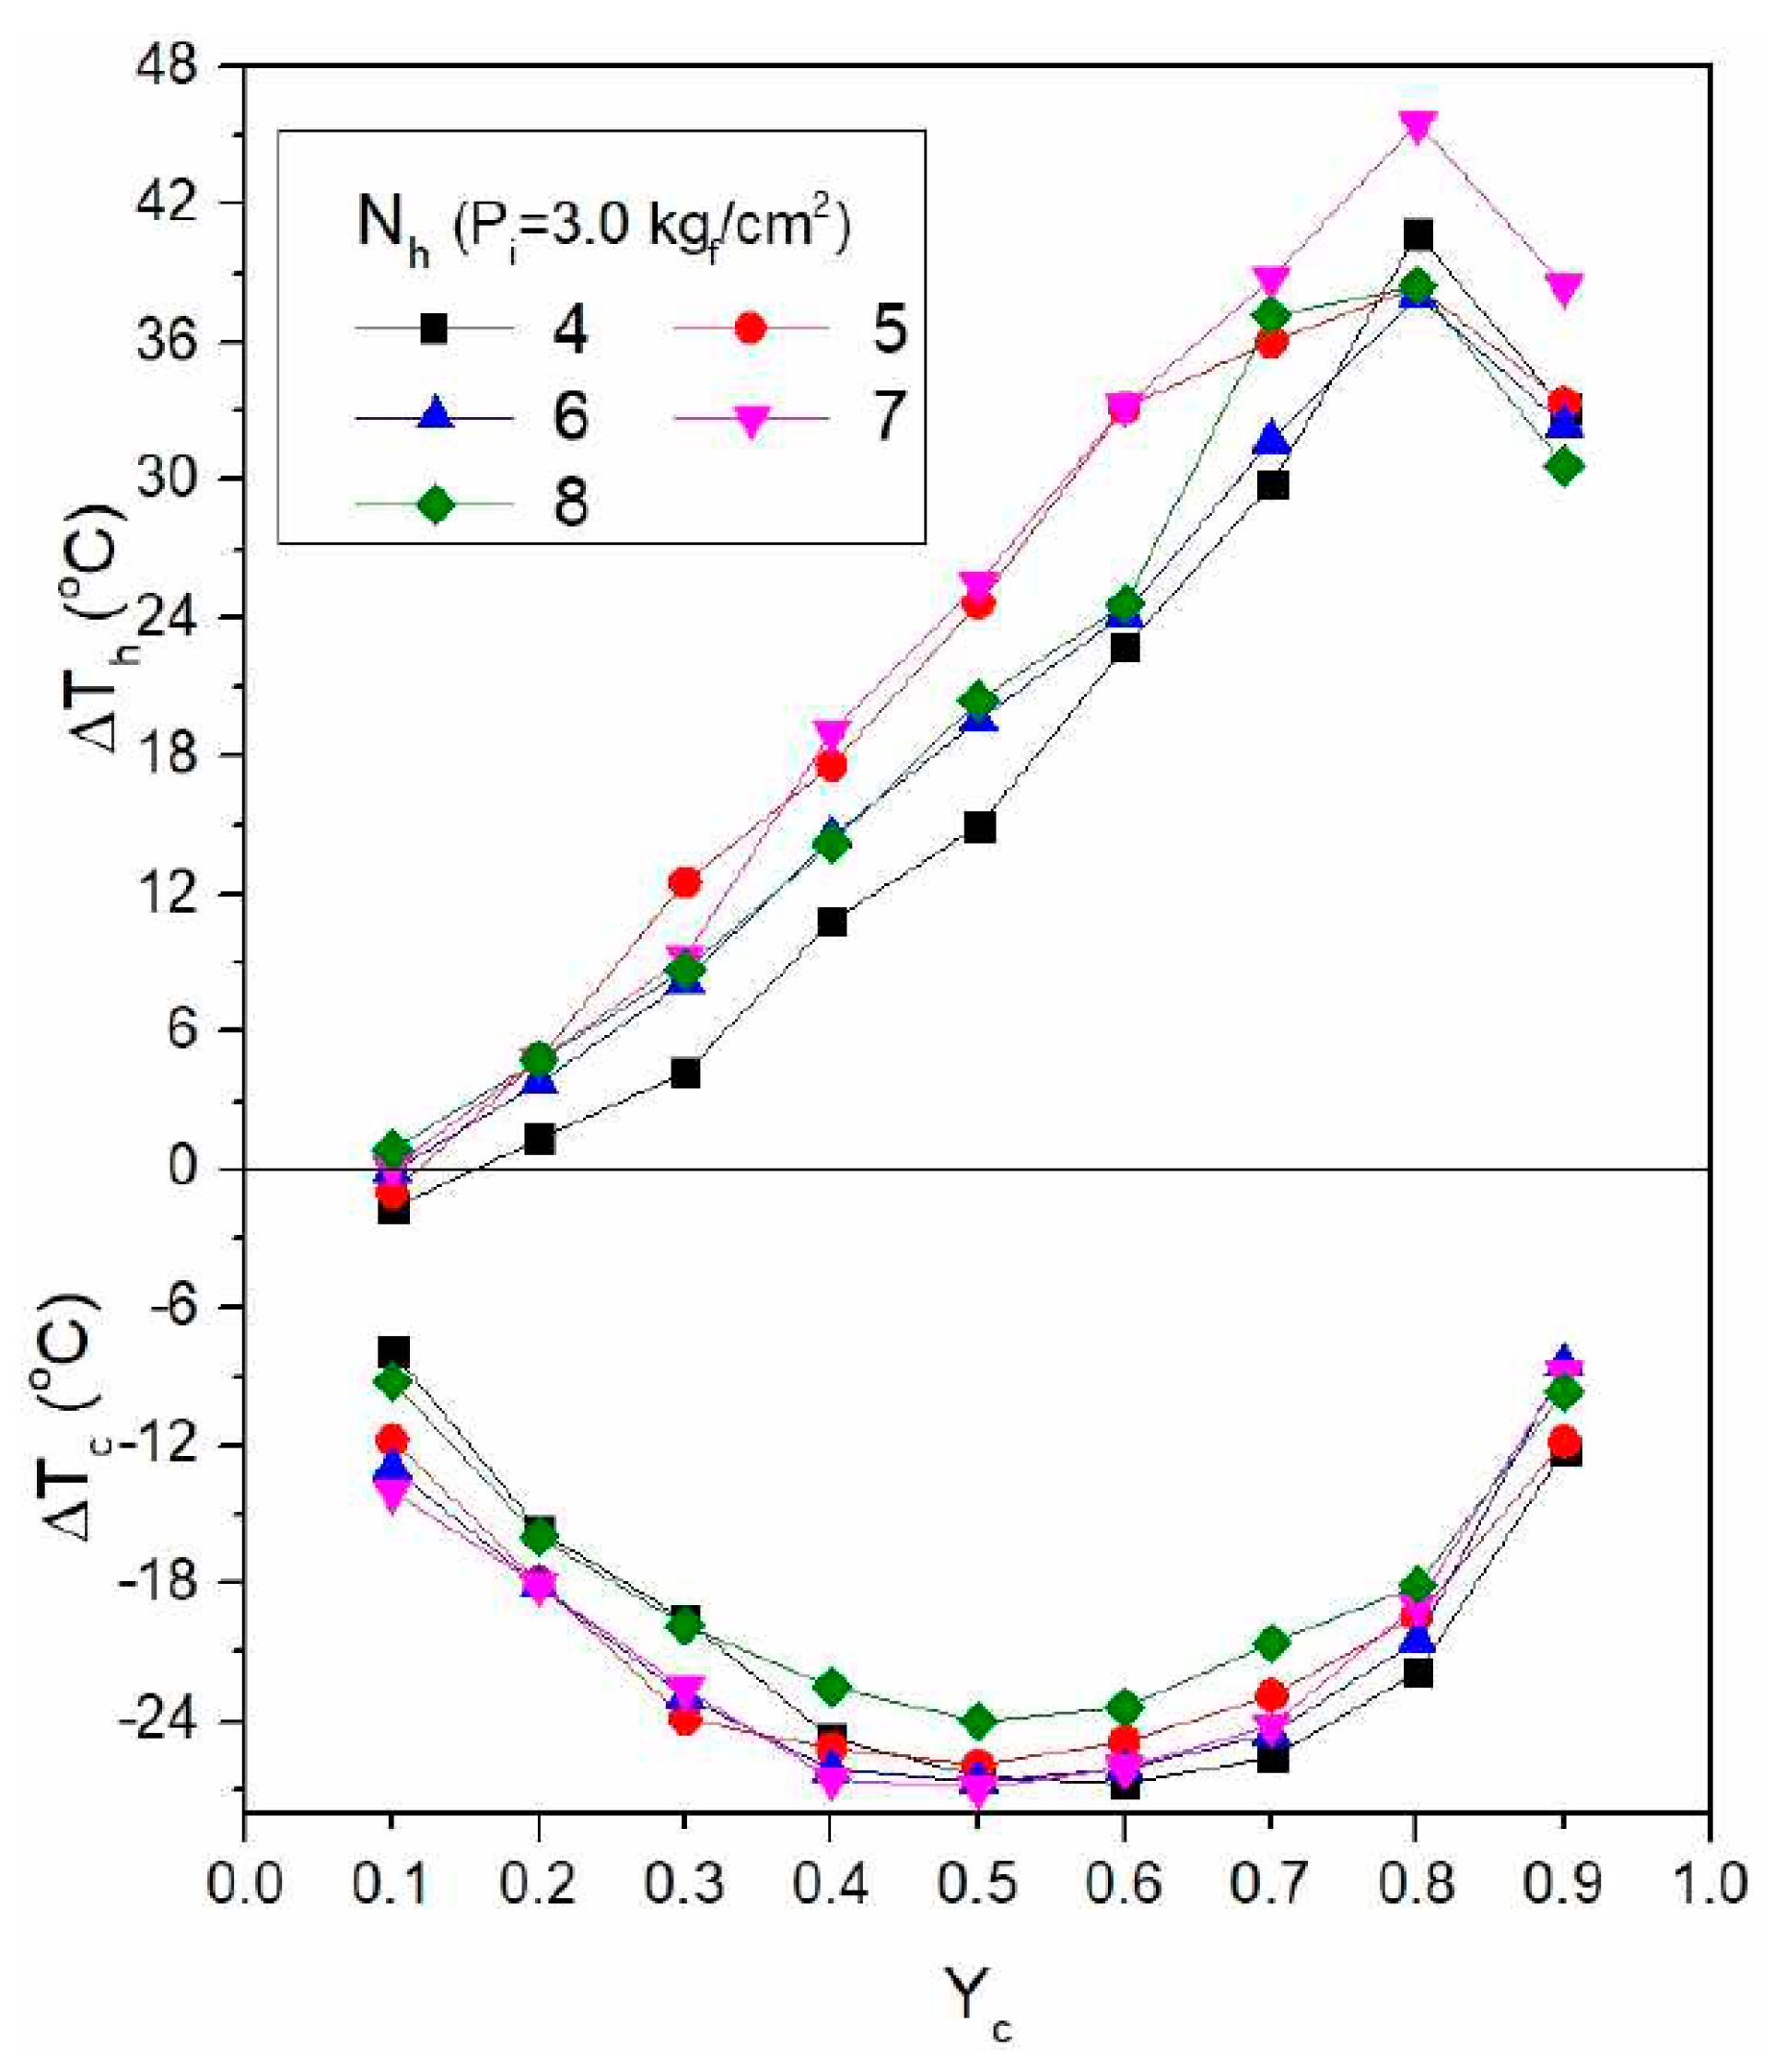
3.1. Temperature Change According to Pressure and Generator Nozzle

The temperature change according to the pressure in the vortex tube device and the number of nozzles of the generator was investigated. The nozzle area ratio of Sn = 0.142 was set using a commonly known standard. The nozzle area ratio is the standard of the vortex tube that is set to best separate high temperature air. In addition, since the vortex formed in the vortex tube varies depending on the inlet supply pressure, the experiment was performed between Pi = 0.5 kgf/cm2 and Pi = 5.0 kgf/cm2 at Pi = 0.5 kgf/cm2 intervals. For each experiment, the high-temperature air temperature difference ΔTh and the low-temperature air temperature difference ΔTc at low temperature air flow rate (yc) = 0.1~1.0 were measured. Results are shown in Figure 11, Figure 12, Figure 13, Figure 14, Figure 15, Figure 16, Figure 17, Figure 18, Figure 19 and Figure 20.
According to the experimental results, it was confirmed that ΔTh showed the highest high-temperature air from yc = 0.6 to 0.8 at high temperatures, and yc = 0.8 in the case of ΔTh, max as the pressure increased. In the case of low temperature, ΔTc showed the maximum low-temperature air from yc = 0.4 to 0.6, and in the case of ΔTc, max in the same case as the high temperature, yc = 0.5. As a result of these experiments, when the throttle valve on the high-temperature outlet is closed, yc increases and the flow cross-sectional area of the high-temperature outlet decreases. Therefore, the air at the high-temperature outlet flows back to the relatively low-temperature outlet, and the central flow becomes smooth. Additionally, when yc relatively decreases, the flow cross-sectional area of the high-temperature outlet becomes wider, and ΔTc tends to increase because the stagnation point in the vortex tube moves more toward the high-temperature outlet than it does when yc increases. It was judged that ΔTh and ΔTc increased because of active energy separation due to increases in momentum transfer between the central flow and the flow near the wall due to the change in yc. Through the experiments, it was found that ΔTh and ΔTc increased in a similar manner as the inlet pressure (Pi) flowing into the vortex tube increased. As the inlet pressure increased, the flow rate increased, and so the energy loss of the flow decreased, regardless of the number of nozzles, and the energy separation phenomenon became relatively large. This experiment trend showed similar tendencies of low-temperature outlet flow rate and entire pressure section, just as in Stephan [7]. Table 3 shows the ΔTh, max and ΔTc, max values of yc, and the number of nozzles depending on the pressure; in the case of Th, it can be seen that the number of nozzles varied from inlet pressure Pi = 0.5 to 2.0 kgf/cm2. However, after Pi = 2.0 kgf/cm2, it can be seen that the number of nozzles appears constant; in the case of Tc, the number of nozzles seems to change at Pi = 1.0 kgf/cm2. Overall, in the case of Th, the temperature was highest at yc = 0.8, and the nozzles were found to be efficient when they had seven holes. Tc was found to have its lowest temperature at yc = 0.5, and the number of nozzles was found to be efficient at seven.

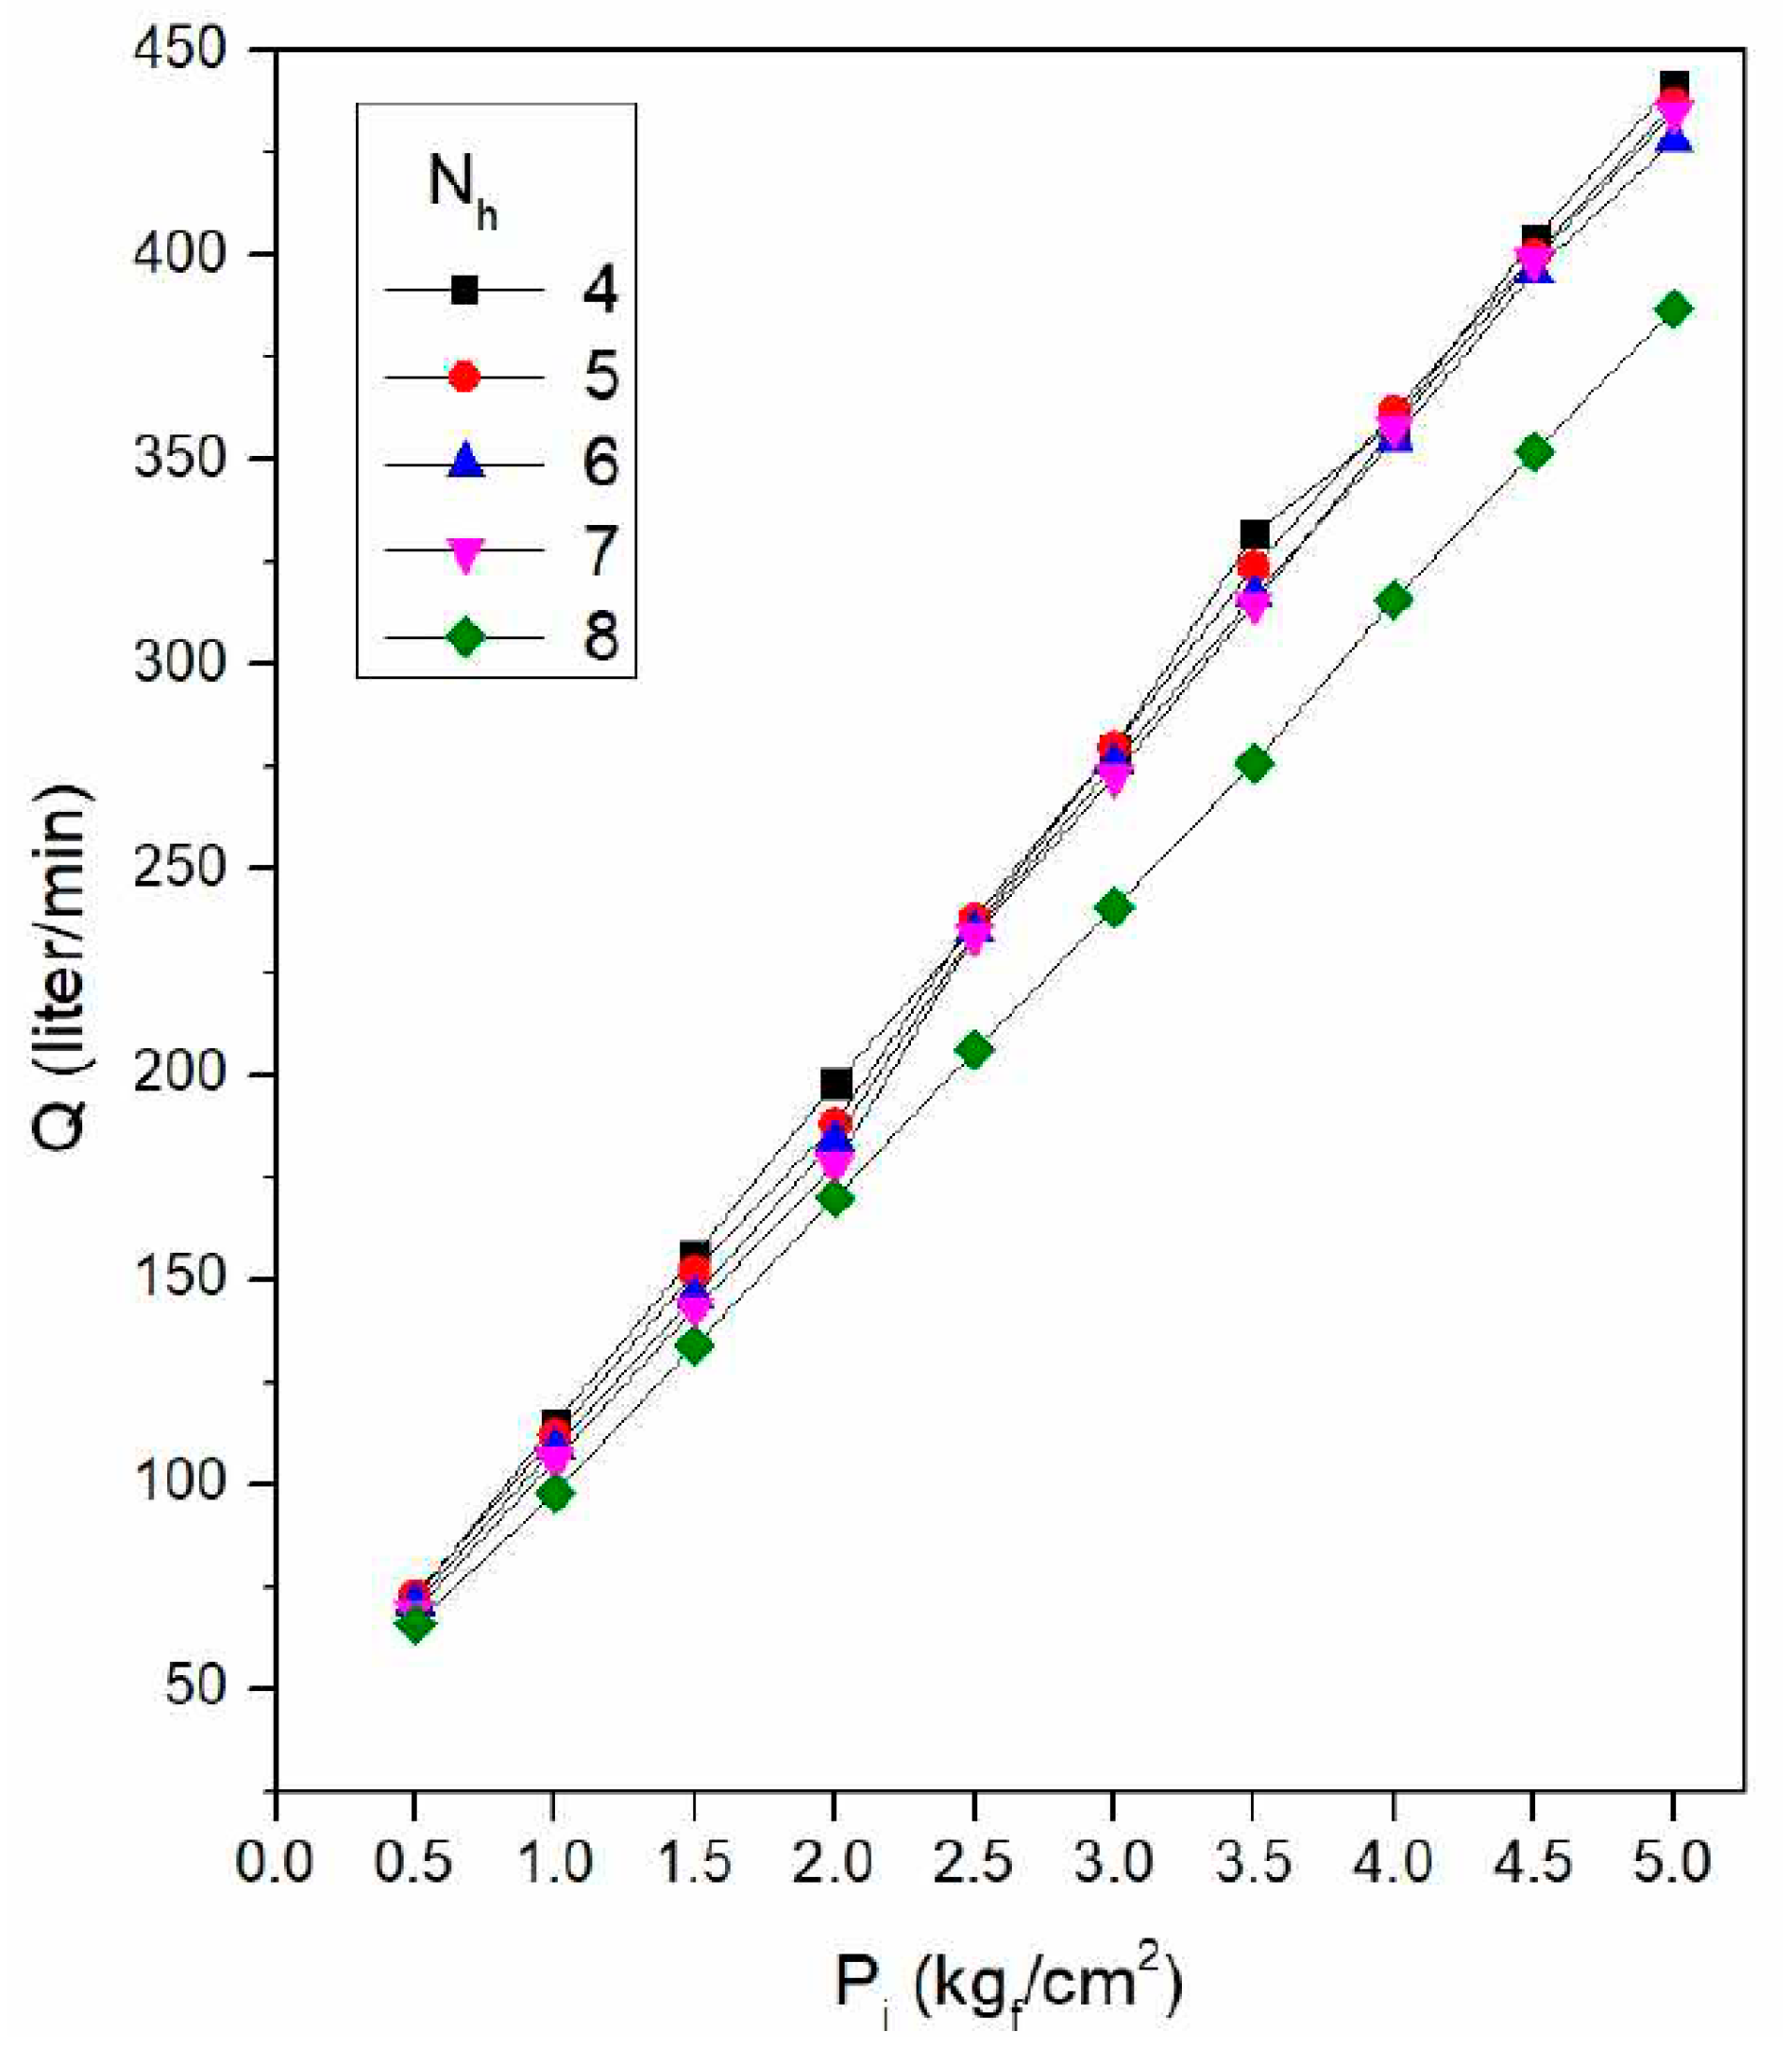
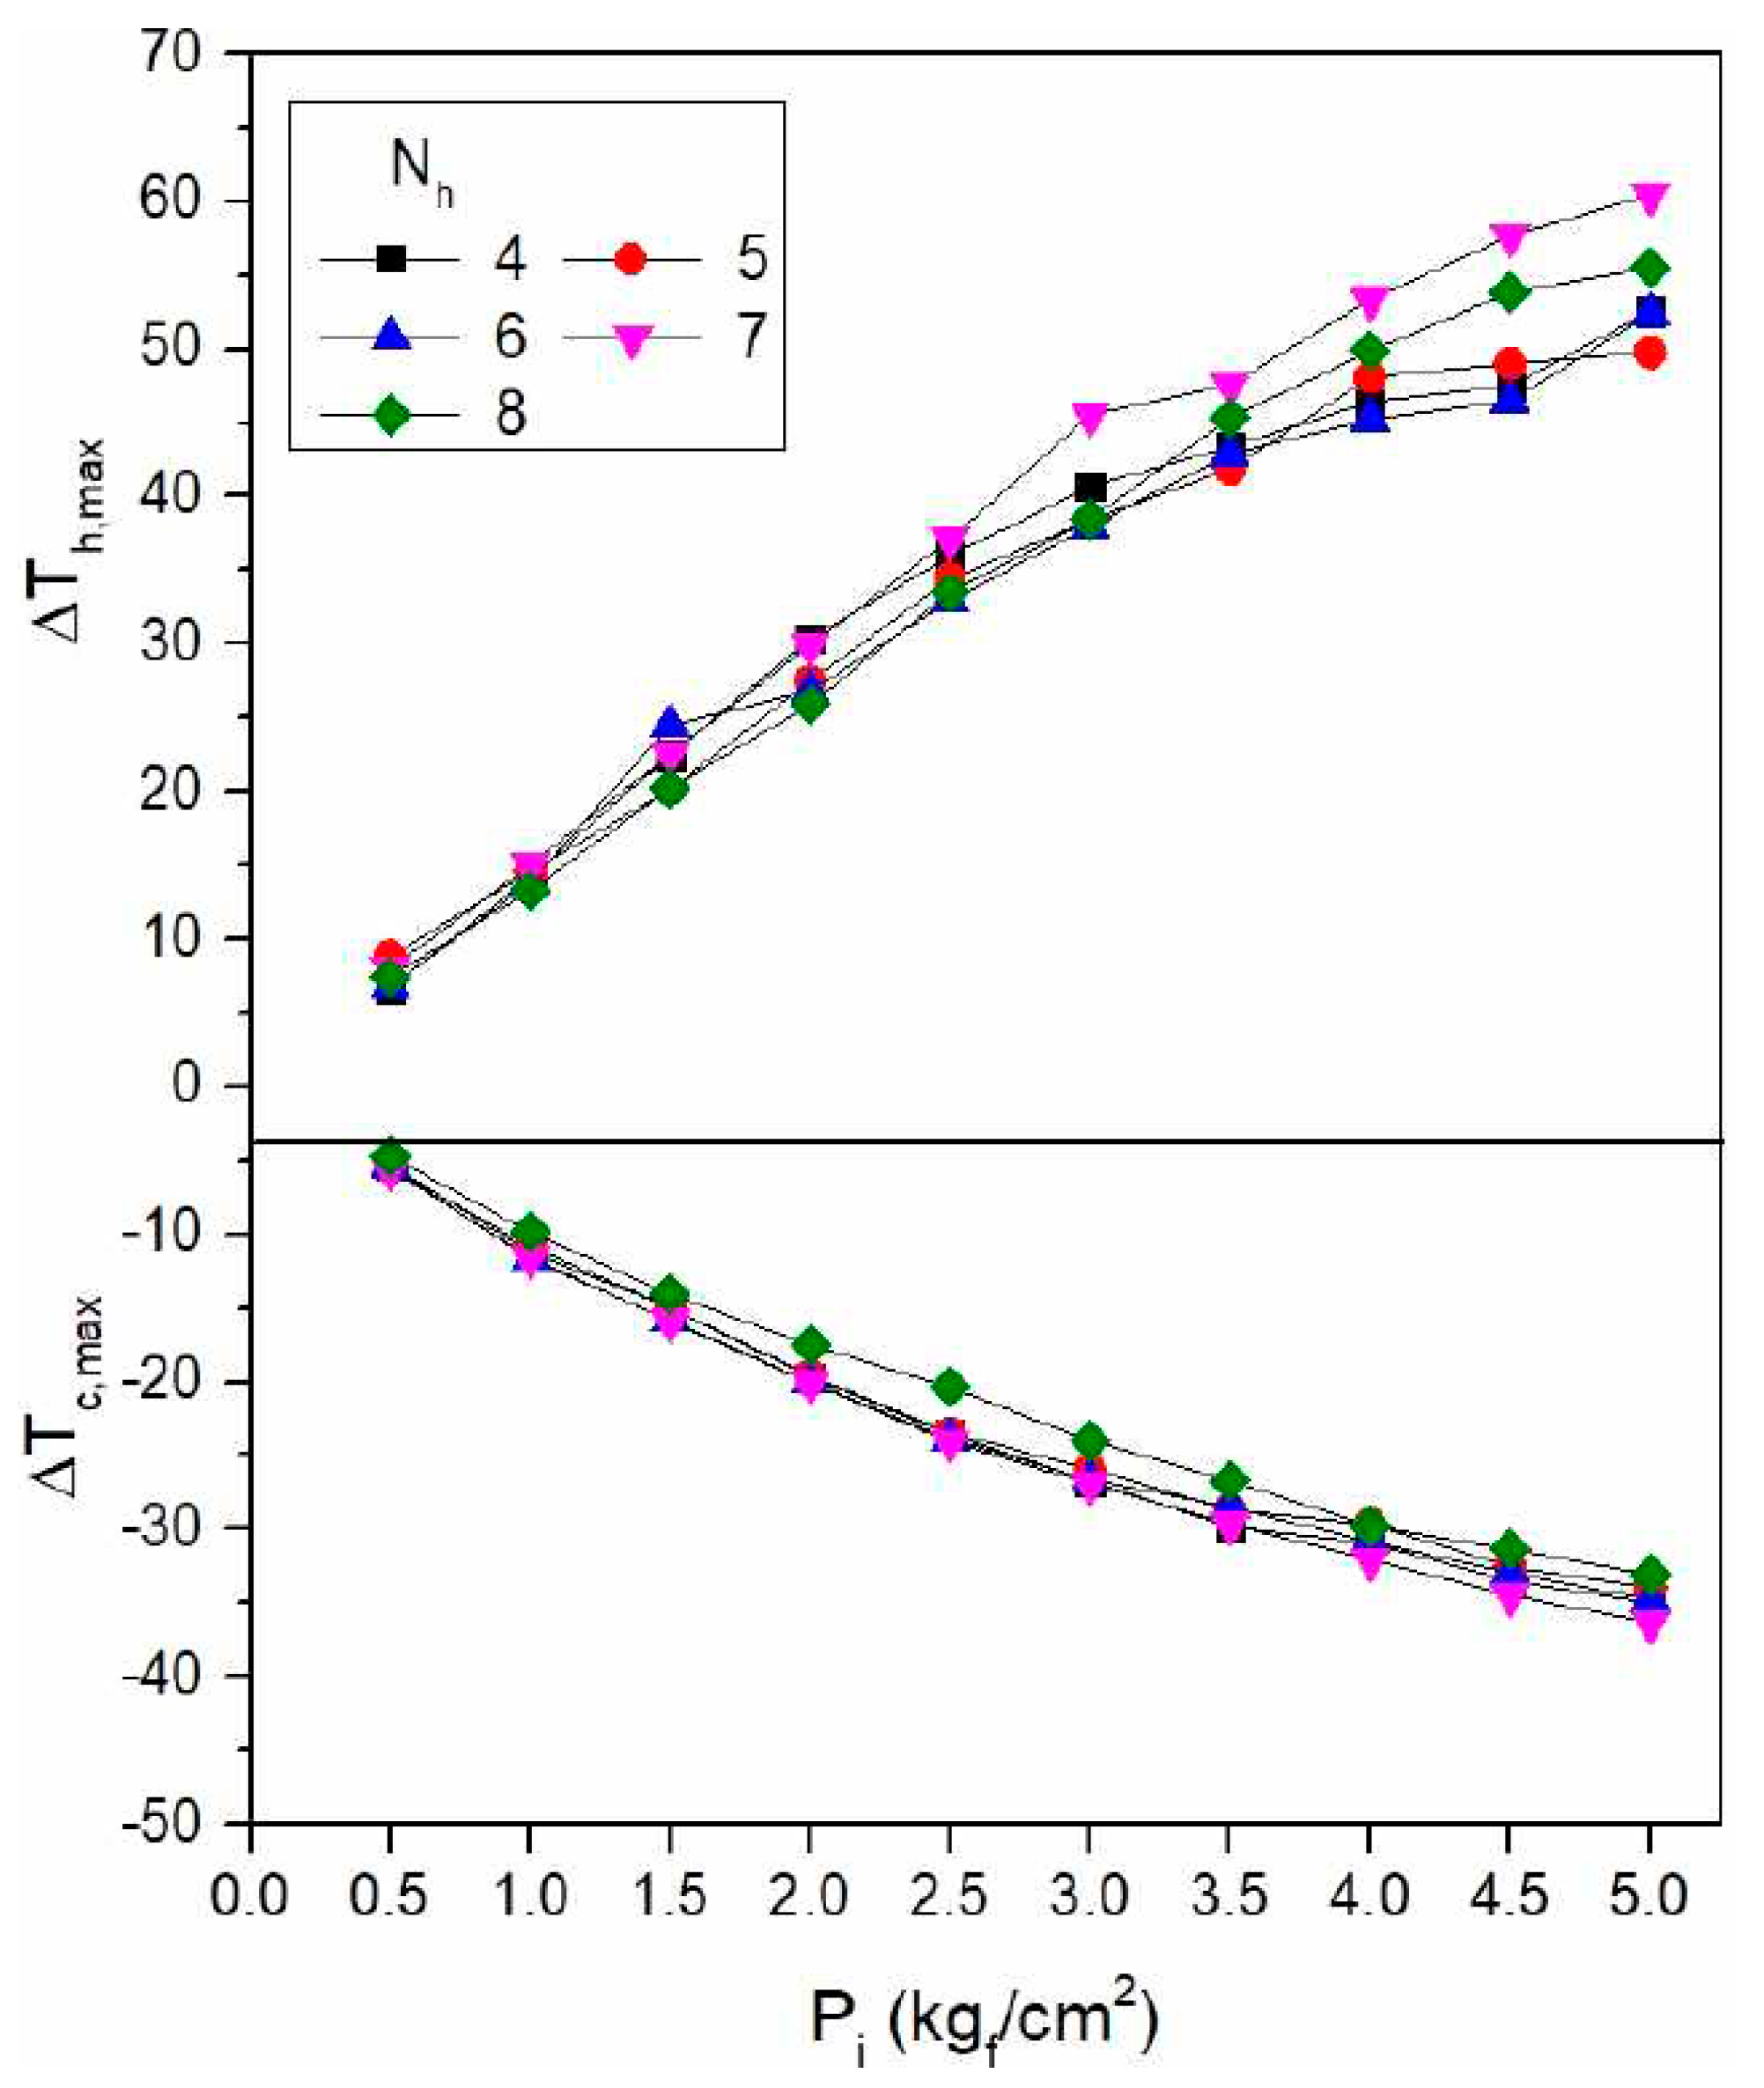
3.2. Discharge Flow Rate and Temperature Difference between ΔTh, max and ΔTc, max According to Pressure

As an initial experiment, we tried to determine the total flow rate according to the supply pressure. The table that summarizes the data according to the number of nozzles is shown in Figure 21.
The nozzle cross-section (Sn) of the generator was selected as a high-temperature type. As a result of experiments on low-temperature and high-temperature type nozzles, the temperature difference was found not to be large in the low-temperature region, but showed a difference of about 8 °C in the high-temperature region. This phenomenon is considered to be due to an increase in flow resistance because the cross-sectional area of the high-temperature nozzle has a smaller area ratio than that of the low-temperature nozzle. This can be seen in the nozzle cross-section experiment [27]. The purpose of this experiment was to determine the conditions for effective temperature separation characteristics with minimal flow. Like in the basic experiment, the supply pressure between Pi = 0.5 kgf/cm2 and Pi = 5.0 kgf/cm2 to the vortex generator was set at the interval of Pi = 0.5 kgf/cm2. In the experiment, it can be seen that the discharge flow rate increased proportionally as the inlet supply pressure increased, regardless of the number of generator nozzles. Under the same pressure condition, the number of nozzles tends to slightly increase as the size of the nozzle decreases, which means that when the generator’s nozzle cross-section (Sn) is the same, as the number of generator nozzles decreases, the nozzle inner diameter (Dn) of the nozzle cross-section (Sn) increases. Therefore, it is considered that the total discharge flow rate increases because the flow resistance of compressed air, through which the supply pressure flows through the generator nozzle, decreases. From the experimental results, according to the number of nozzles and the supply pressure of the vortex generator, the maximum high-temperature air temperature difference (ΔTh, max) and the maximum low-temperature air temperature difference (ΔTc, max) under each condition are determined and shown in Figure 22.
As a result of the experiment, most high-temperature and low-temperature air temperature separation characteristics showed good efficiency under certain conditions in the case of the seven nozzles, but there was not a large difference in temperature. Furthermore, it can be seen that for the temperature separation characteristic, the maximum high-temperature air temperature difference (ΔTh, max) and the maximum low-temperature air temperature difference (ΔTc, max) changed significantly as the supply pressure increased. The high-temperature air of the seven nozzles with high efficiency changed from 7.99 °C when the maximum hot air temperature difference (ΔTh, max) Pi = 0.5 kgf/cm2 to 60.51 °C when Pi = 5.0 kgf/cm2, and showed a temperature difference of 52.52 °C. The low temperature air varied from −5.57 °C when the maximum low temperature air temperature difference (ΔTc,max) Pi = 0.5 kgf/cm2 to −36.33 °C when Pi = 5.0 kgf/cm2, and showed a temperature difference of 30.76 °C. The result of this experiment provides information for the application of a vehicle air conditioning system. Current air conditioning systems for vehicles have values of Pi = 2.5 kgf/cm2 to Pi = 5.0 kgf/cm2, where the temperature change is constant in a vehicle with an air conditioning system using a refrigerant. Based on the experimental results, it is considered that controlling the flow rate and temperature values required for heating and cooling by checking the discharge flow rate and the temperature difference between the hot and cold parts is a key point.

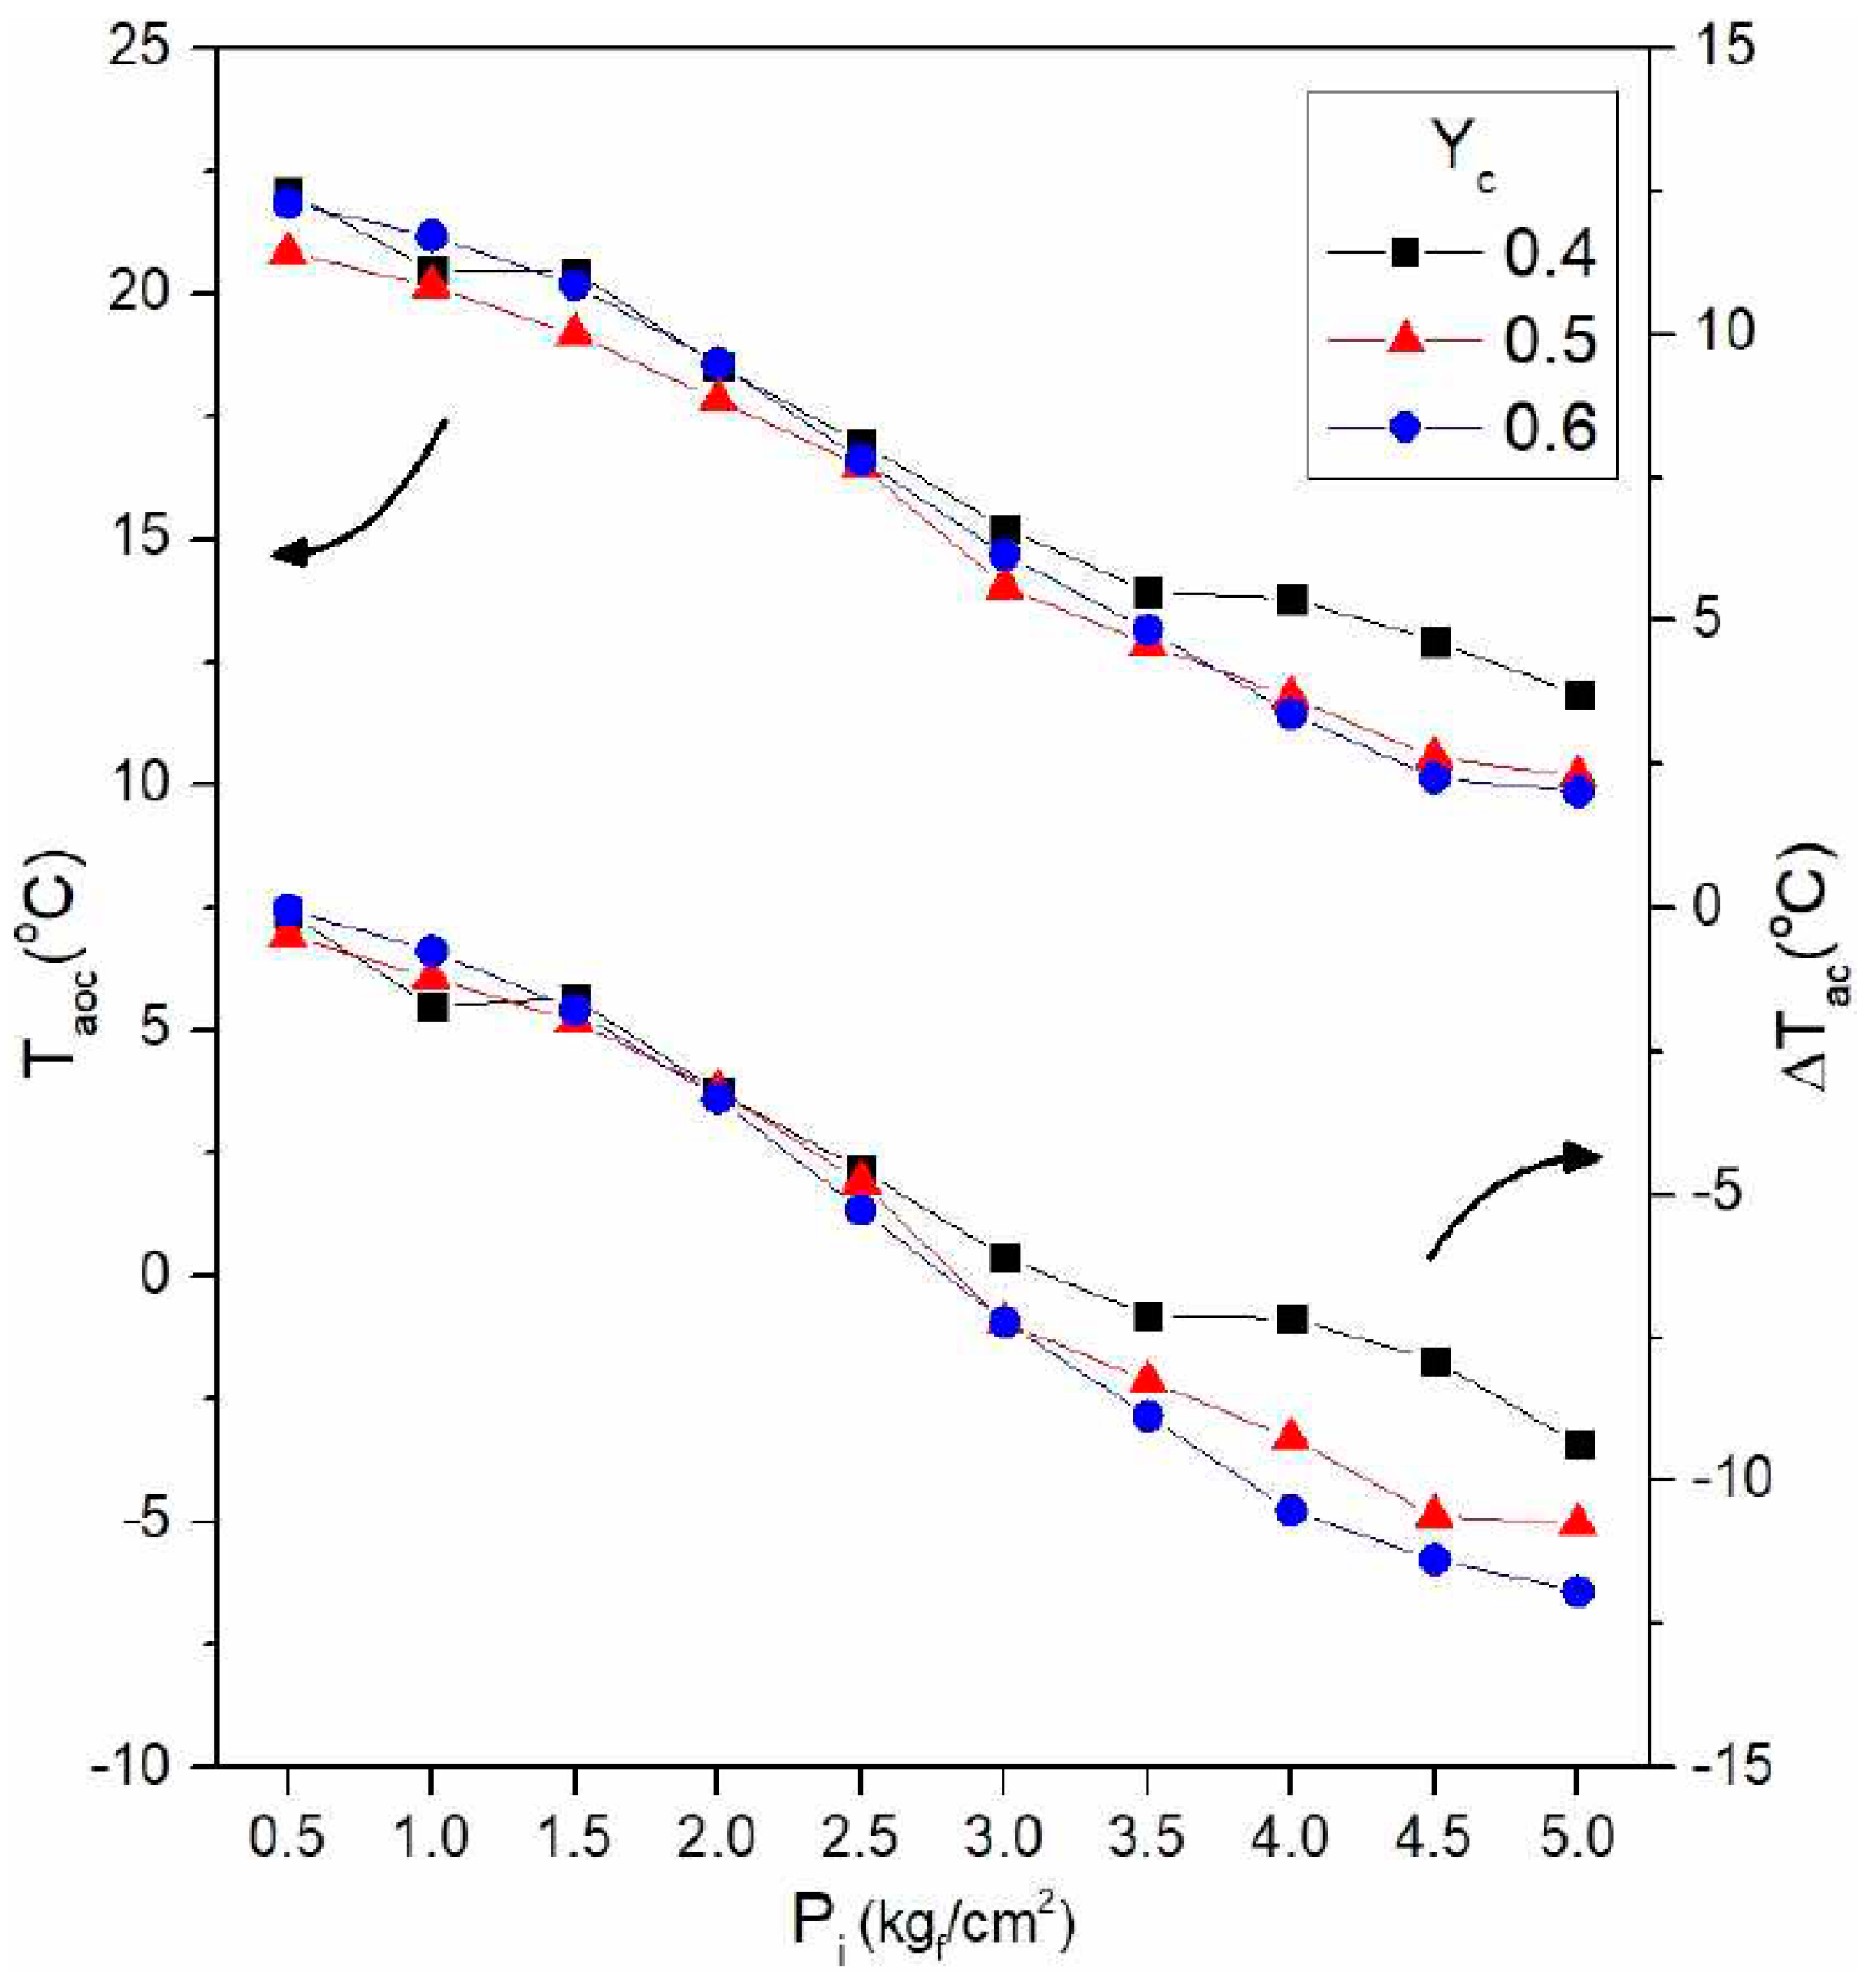
3.3. Temperature Control of Indirect Heat Exchange Method According to Pressure

To measure the temperature of the indirect heat exchanger, between Pi = 0.5 kgf/cm2 and Pi = 5.0 kgf/cm2 and Pi = kgf/cm2 were set based on the number of nozzles of the vortex generator, which was the most efficient in the basic experiment. In the high-temperature type device, the experiment was conducted at a section yc = 0.6 to 0.8 at a point where the efficiency of the low-temperature air flow rate (yc) was good; the experiment was conducted at yc = 0.4 to 0.6 for a section of low-temperature type. Figure 23 shows these results graphically. As in the basic experiment, it can be seen that the vortex tube increases in efficiency with increasing pressure. In the experiment, the value of Taoc (°C) is the point at which the temperature of both the vortex tube cold and hot outlets passes through the heater core. Additionally, the value of ΔTac (°C) was expressed by measuring the temperature of the flow flowing into the front and rear ends of the chamber surrounding the heater core. In the case of Taoc (°C), the temperature was measured by comparing the low-temperature air flow rate (yc) of the flow. In the low-temperature region, the temperature difference of Taoc (°C) was not large, but it was 21.84 °C when Pi = 0.5 kgf/cm2 at yc = 0.6, where the efficiency was best in proportion to the discharge flow rate, and when Pi = 5.0 kgf/cm2. The temperature difference changed to 9.87 °C and showed a maximum temperature difference of 11.97 °C. The value of ΔTac (°C) was also measured using the low-temperature airflow ratio (yc), and the temperature difference was similar to Taoc (°C). The value of ΔTac (°C) showed values of −0.03 °C when Pi = 0.5 kgf/cm2 at yc = 0.6, and −11.92 °C when Pi = 5.0 kgf/cm2, resulting in a maximum temperature difference of 11.95 °C. Through this, the low-temperature measurement of the indirect heat exchange method according to the pressure, yc = 0.5 was excellent in the basic experiment, but when heat exchange was performed, the resulting value of yc = 0.6, which indicates a relatively large discharge flow rate due to flow rate resistance, was the best.
As can be seen in Figure 24, the temperature difference was higher in the high-temperature region than in the low-temperature region. At yc = 0.8, the highest temperature of Taoc (°C), when Pi = 0.5 kgf/cm2, was 23.00 °C; when Pi = 5.0 kgf/cm2, this value changed to 38.79 °C, showing a maximum temperature difference of 15.79 °C. The value of ΔTac (°C) was measured through the low-temperature airflow ratio (yc), and the temperature difference had a result somewhat similar to that for Taoc (°C). At yc = 0.8, Pi = 0.5 kgf/cm2 showed a difference of 0.02 °C, and Pi = 5.0 kgf/cm2 showed a difference of 15.95 °C; the pressure difference resulted in a maximum temperature difference of 15.93 °C. However, in the high-temperature region of the indirect heat exchange method, it was confirmed that, unlike in the case at low temperature, the influence of pressure was large. In the case of yc = 0.8, it can be seen that the discharge flow rate is low and the temperature change is small until the pressure becomes Pi = 3.0 kgf/cm2; the pressure changes significantly after Pi = 3.0 kgf/cm2. Through these experiments, it is thought that the reaction rate of the heat exchanger will be higher than between yc = 0.7 and 0.8 in the indirect heat exchange method when yc = 0.6, which has a constant temperature change and a large discharge flow rate. Therefore, as a result of confirming the temperature difference according to the low-temperature air flow rate (yc) through an indirect heat exchange method that changes according to the pressure, it was determined that a value of yc = 0.6 is suitable for regions of both low temperature and high temperature.

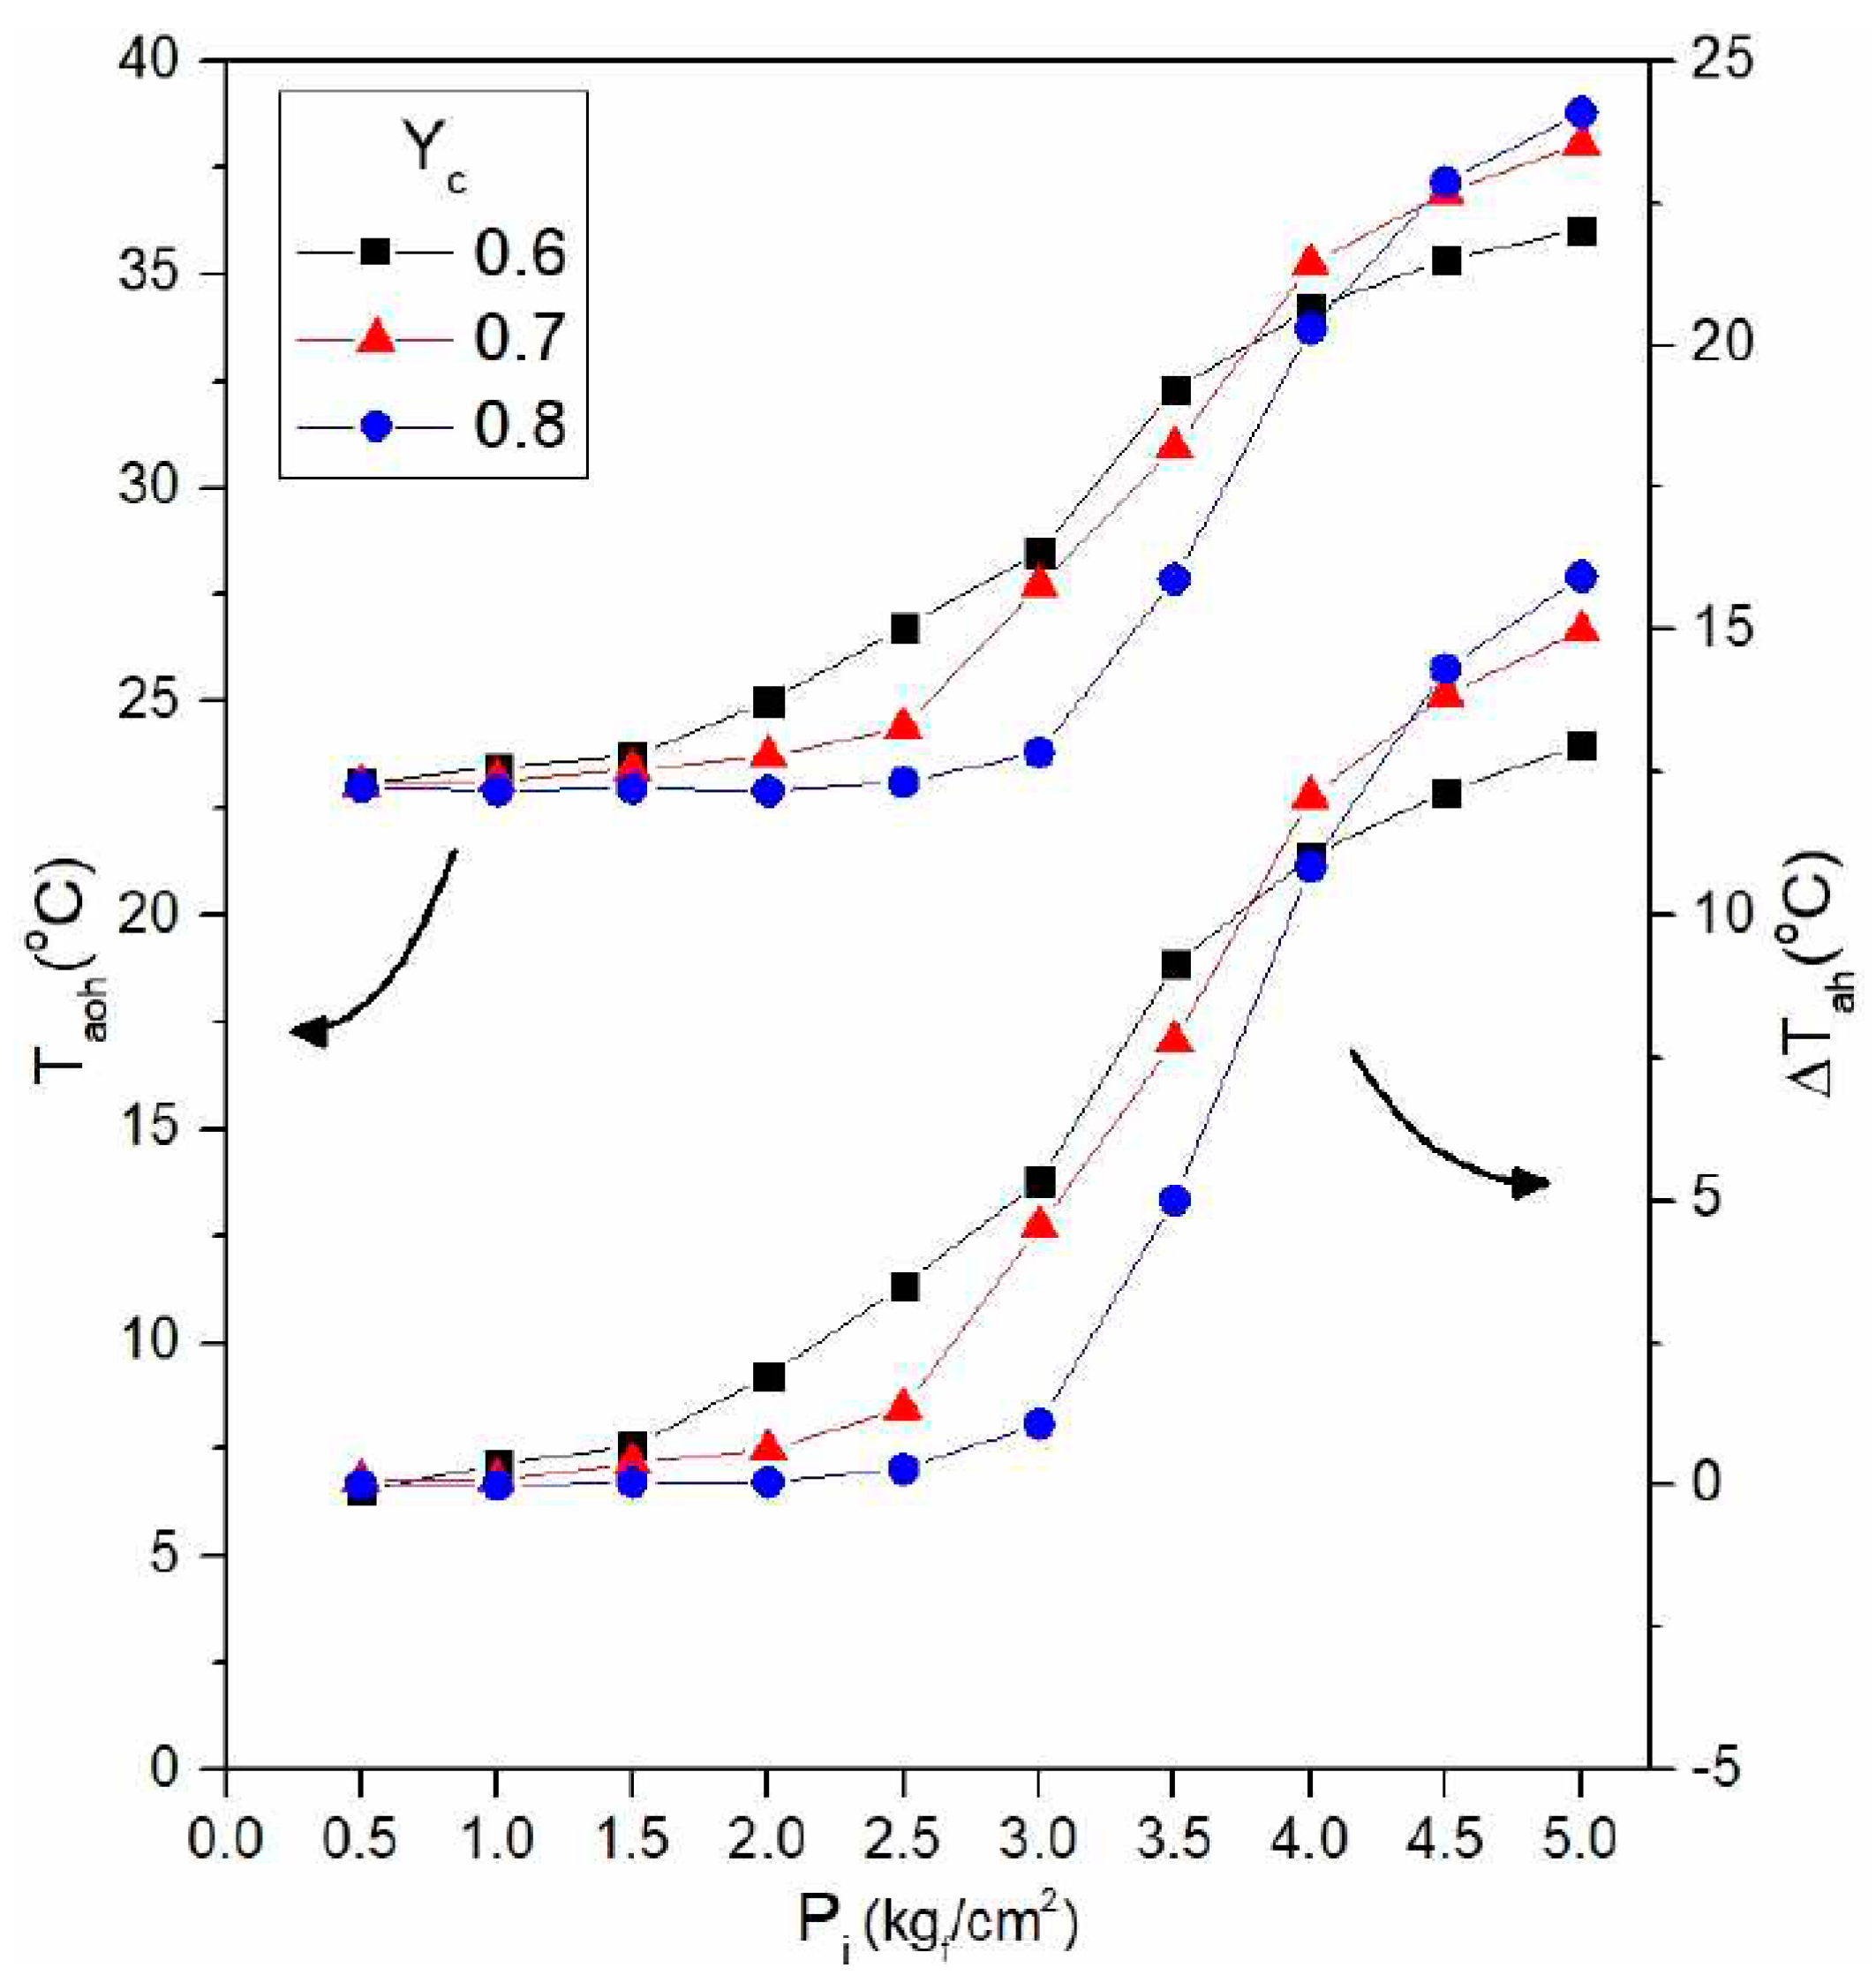
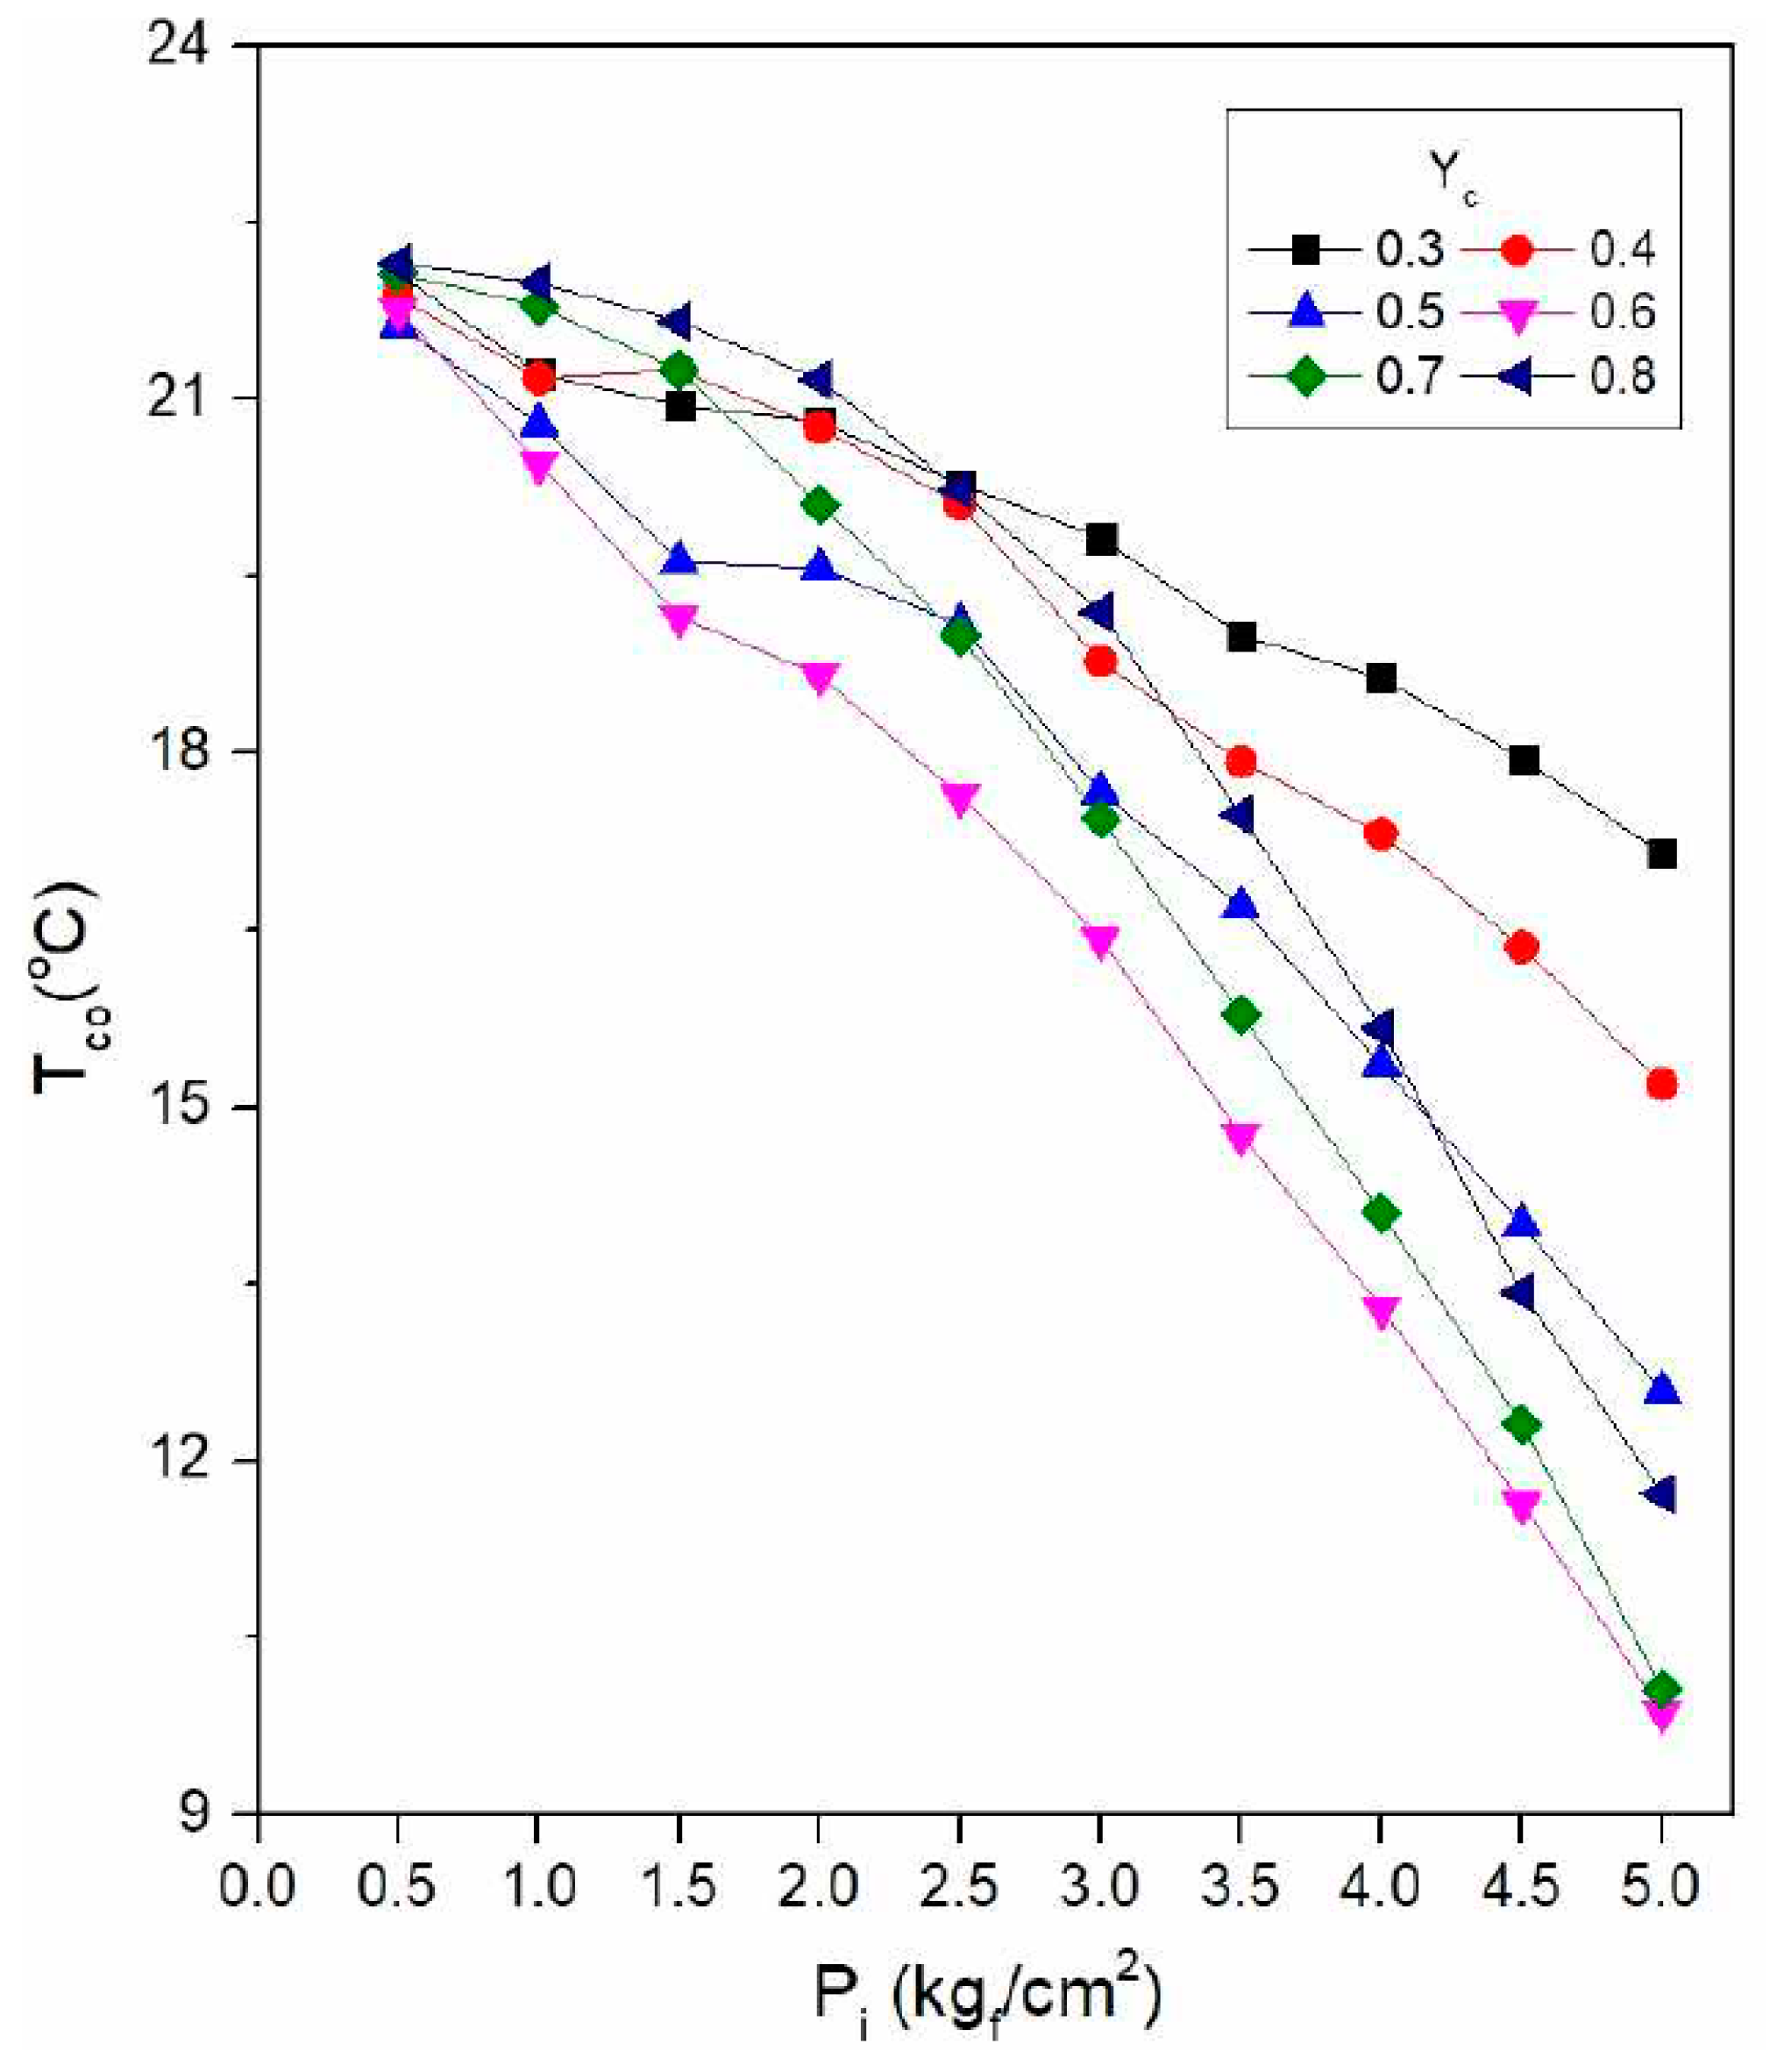
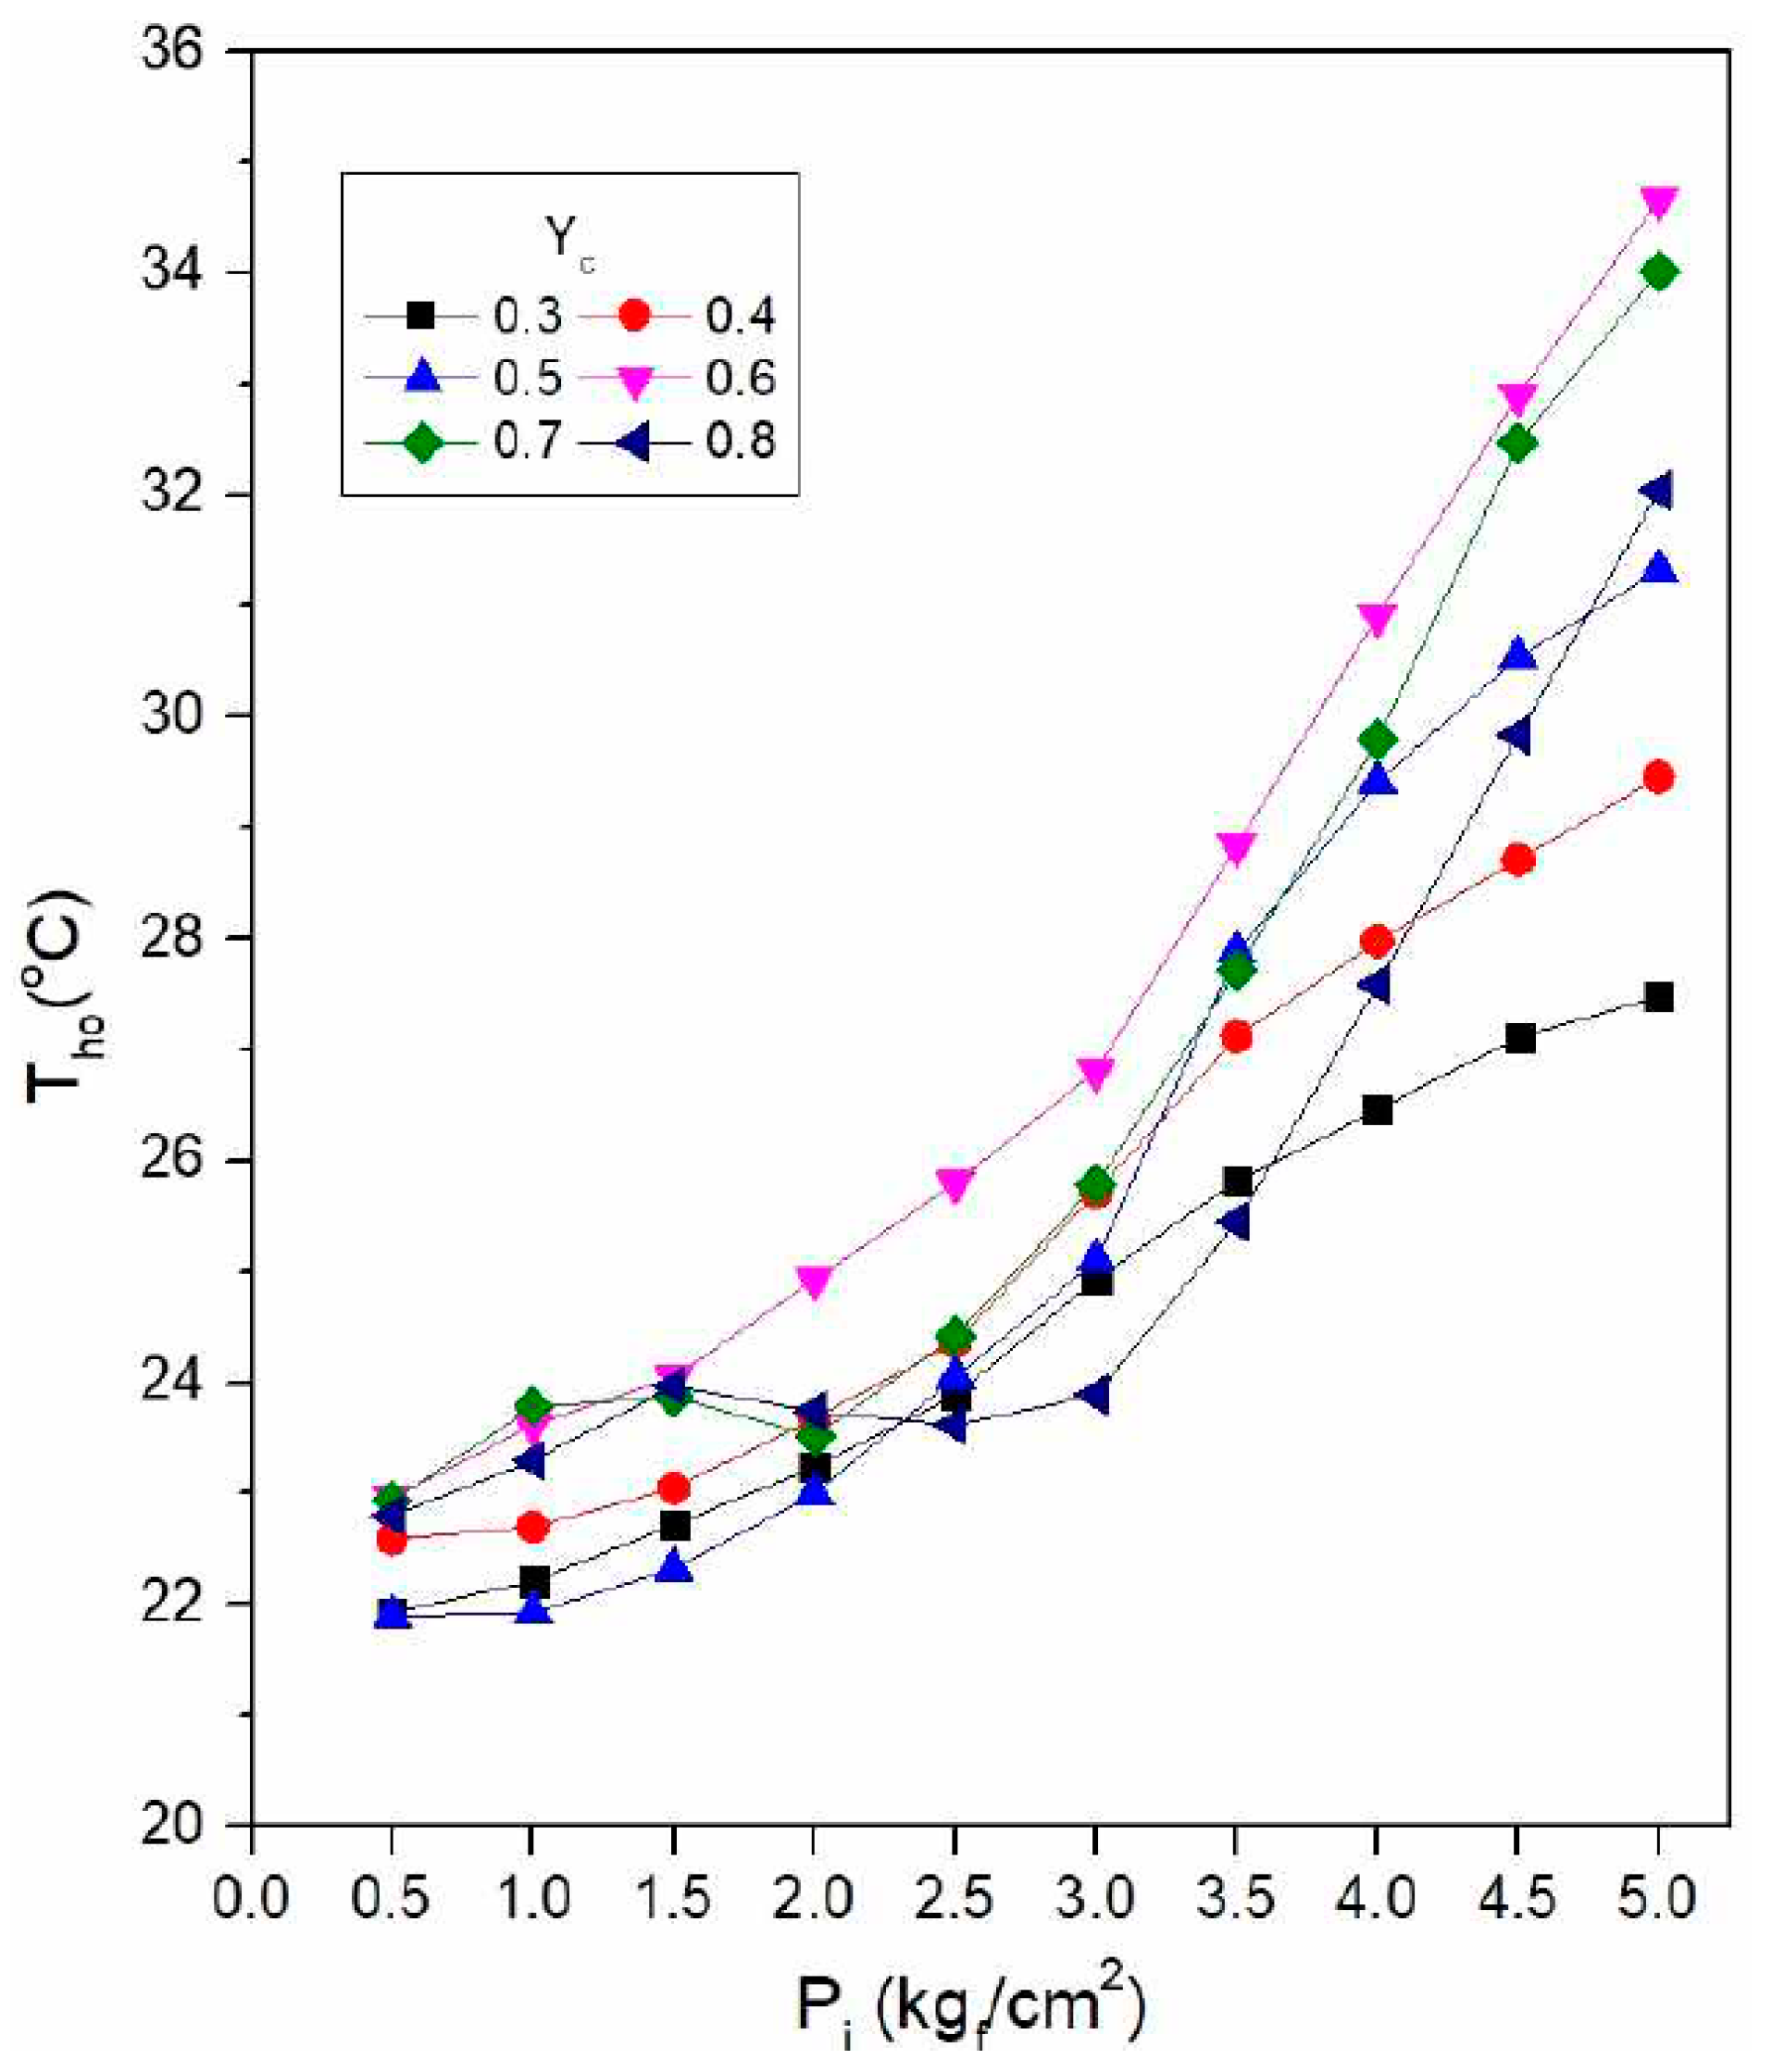
3.4. Temperature Control of Direct Heat Exchange Method According to Pressure

To evaluate the temperature difference with the indirect heat exchange method using the vortex tube, the supply pressure between Pi = 0.5 kgf/cm2 and Pi = 5.0 kgf/cm2 was the same as that in the basic experiment using seven nozzles for the vortex generator under the same test conditions. The inlet pressure was set at Pi = 0.5 kgf/cm2 intervals. Furthermore, as the direct heat exchange method has a larger discharge flow rate than that of the indirect heat exchange method, experiments were conducted at yc = 0.3 to 0.8 for both the low-temperature type and the high-temperature type by increasing the section of the low-temperature air flow rate (yc). To make a difference from the indirect heat exchange method, a heater core that does heat exchange was not used. Figure 25 and Figure 26 are the results of experiments conducted in a direct manner in which compressed air, which has undergone temperature separation, enters the chamber directly and is discharged through an air conditioning filter. Through the experiments, the value yc = 0.6, which indicates the best efficiency at the exit of the low-temperature region, led to a value of Tco (°C) = 21.76 °C when Pi = 0.5 kgf/cm2; this changed to 9.87 °C when Pi = 5.0 kgf/cm2, resulting in a maximum of 11.89 °C ΔTah (°C). Through this direct heat exchange method, the low-temperature airflow ratio (yc) did not change between the indirect and direct heat exchange methods. As a result of an experiment that involved adding yc = 0.3, 0.7, and 0.8 of Tco (°C) in the direct heat exchange method, it was confirmed that the efficiency decreased as the pressure increased because the flow rate was insufficient in the low-temperature region, similar to the cases of yc = 0.6, 0.7. It was confirmed that Tho (°C) produces a high-temperature region and has a resulting value similar to that of the indirect heat exchange method and similar to the value of the low-temperature region. The efficiency at Tho (°C) was the best at yc = 0.6; when Pi = 0.5 kgf/cm2, it was 22.97 °C. Additionally, when Pi = 5.0 kgf/cm2, it changed to 34.66 °C and showed a maximum temperature difference of 11.63 °C. Comparing the two areas, when the ratio of the discharge flow rate became high (yc = 0.3 to 0.4), it showed a trend similar to that in the basic experiment. This is because the supply pressure increases as the discharge flow rate increases in the high-temperature region, thereby increasing the flow rate discharged to the high-temperature outlet stage. Therefore, heat loss in the high-temperature chamber decreased, and the amount of temperature change decreased.

4. Conclusions

Using a vortex tube, a basic experiment was conducted to investigate the temperature separation phenomenon according to the number of nozzles of the generator according to the supply pressure (Pi) and the low-temperature air flow rate (yc). In basic temperature difference experiments, the following conclusions were obtained using indirect and direct methods with a heater core that can be applied to a vehicle air conditioning system.
1. When the supply pressure between Pi = 0.5 kgf/cm2 and Pi = 5.0 kgf/cm2, the maximum high-temperature air temperature difference (ΔTh, max) appeared at yc = 0.8, and the maximum low-temperature air temperature difference (ΔTc, max) appeared at yc = 0.5.
2. Using 4, 5, 6, 7, and 8 nozzles in the vortex tube generator, the maximum high-temperature air temperature difference (ΔTh, max) and the maximum low-temperature air temperature difference (ΔTc, max) appeared for the maximum number of seven nozzles of the vortex tube generator.
3. The total discharge flow rate was tested by setting the supply pressure between Pi = 0.5 kgf/cm2 and Pi = 5.0 kgf/cm2 at intervals of Pi = kgf/cm2 at the nozzle area ratio Sn = 0.142 (high temperature type). The discharge flow rate tended to increase in proportion to the pressure increase; and, as the number of nozzles of the generator decreased, the nozzle inner diameter (Dn) increased, resulting in four nozzles having the highest discharge flow rate.
4. In the indirect heat exchange method, efficiency was best at yc = 0.8 in the high-temperature region, and at yc = 0.5 in the low-temperature region.
5. According to the results of temperature measurement in the indirect heat exchange method, Taoc (°C) changed from 21.84 °C to 9.87 °C when the pressure was between Pi = 0.5 kgf/cm2 and Pi = 5.0 kgf/cm2 in the low-temperature region at yc = 0.6 and in the high-temperature region at yc = 0.8. Taoh (°C) showed a maximum change of 15.79 °C, from 23.00 °C to 38.79 °C.
6. In the direct heat exchange method, the flow rate was slower than in the indirect heat exchange method, so the discharge flow rate was large; the area of the low-temperature air flow rate (yc) was measured at yc = 0.3~0.8. Excellent results were obtained in the two regions at yc = 0.6. Unlike in the indirect method, yc = 0.6 was excellent at high temperature, and seems to have been affected by the discharge flow rate.
7. According to the temperature measurement results using the direct heat exchange method, when yc = 0.6 and between Pi = 0.5 kgf/cm2 and Pi = 5.0 kgf/cm2, Tco (°C) changed from 21.76 °C to 9.87 °C and its maximum difference was 11.89 °C. Additionally, Tho (°C) showed a maximum change of 11.63 °C from 22.97 °C to 34.66 °C.
To conclude this study, the temperature difference between the indirect heat exchange method and the direct heat exchange method showed a maximum value of about 4 °C in the high-temperature region; the temperature difference in the low-temperature region was insignificant. Although the indirect heat exchange method looks slightly better when comparing the time to reach normal temperature, the indirect heat exchange method takes about four times longer than the direct heat exchange method, and the direct heat exchange method seems to have an excellent reaction speed. This is because the use of an indirect heat exchange type heater core induces flow velocity resistance, and the heat exchange of the heater core is performed only with air. However, when applied to an air conditioning system, the indirect heat exchange method, using external air or internal air, can implement a filter to reduce foreign substances; however, in the direct method, compressed air can be filtered only through the air conditioning filter. It is thought that it may be necessary to solve this problem. Therefore, for a vehicle air conditioning system, a direct heat exchange method with low reaction speed and low flow resistance can be used and, in the case of low-temperature airflow ratio (yc), a value of yc = 0.6, with high efficiency in both the low temperature and high-temperature regions, will subsequently be used in the air conditioning system of an eco-friendly vehicle. It is judged that this system can be applied and used effectively.

Author Contributions

All authors contributed to this research in collaboration. Y.K. have an experiment, S.I. proposed the conceptualization, and J.H. provided substantial help with the paper schedule and implemented the proposed vehicle air conditioning system using vortex tube. All authors have read and agreed to the published version of the manuscript.

Funding

This research received no external funding.

Acknowledgments

This work was supported by the National Research Foundation of Korea (NRF) grant funded by the Korean government (MSIT) (no. NRF-2019R1G1A1100739).

Conflicts of Interest

The authors declare no conflict of interest.

Nomenclature

AThe rate of vortex flow coming inside [L/min]
cConstant
DThe inner diameter of the vortex tube [mm]
dcThe diameter of cold end orifice [mm]
DnThe inner diameter of nozzles [mm]
LTube length [mm]
PiThe pressure of inlet air [kgf/cm2]
QMean air flow rate [L/min]
SnNozzle area ratio(nozzle sectional area/vortex tube sectional area [-]
TStatic temperature [K]
∆TacThe temperature difference between inlet air and cold outlets air for chamber [°C]
(∆Tac = Taoc − Tai)
∆TahThe temperature difference between inlet air and hot outlets air for chamber [°C]
(∆Tah = Taoh – Tai)
TaocThe temperature of outlets cold air for chamber [°C]
TaohThe temperature of outlets hot air for chamber [°C]
TcThe temperature of cold air [°C]
∆TcThe temperature difference between inlet air and cold air [°C]
(∆Tc = Tc – To)
∆Tc, maxThe maximum temperature difference between inlet air and cold air [°C]
TcoThe temperature of cold outlet air for after passing the fan [°C]
ThThe temperature of hot air [°C]
∆ThThe temperature difference between inlet air and hot air [°C]
(∆Th = Th – To)
∆Th, maxThe maximum temperature difference between inlet air and hot air [°C]
ThoThe temperature of hot outlet air for after passing the fan [°C]
TaiThe temperature of inlet air for chamber [°C]
∆Tw, maxThe maximum temperature difference between inlet air and hot wall [°C]
ycCold air mass flow ratio (cold air mass flow/inlet air mass flow)
wAngular velocity [L/s]
rDiameter radial direction

Subscript

cCold air
hHot air
IInlet air
maxMaximum
NNozzle and number

References

  1. Jetter, J. Evaluation of Alternatives for HFC-134a Refrigerant in Motor Vehicle Air Conditioning. In Proceedings of the International Conference on Ozone Protection Technologies, Washington, DC, USA, 21–23 October 1996; pp. 845–854. [Google Scholar]
  2. Global Environmental Change Report, A Brief Analysis of the Kyoto Protocol. December 1997, Volume IX. No. 24. Available online: https://www.oecd.org/dev/1923191.pdf (accessed on 7 October 2020).
  3. Linderstrøm-Lang, C. Gas separation in the Ranque-Hilsch vortex tube. Int. J. Heat Mass Transf. 1964, 7, 1195–1206. [Google Scholar] [CrossRef]
  4. Ranque, G.J. Experiments on expansion in a vortex with simultaneous exhaust of hot air and cold air. Phys. Radium 1933, 112–114. [Google Scholar]
  5. Hilsch, R. The Use of the Expansion of Gases in a Centrifugal Field as Cooling Process. Rev. Sci. Instr. 1947, 18, 108–113. [Google Scholar] [CrossRef] [PubMed]
  6. Fulton, C.D. Ranque’s Tube. Refrig. Eng. 1950, 5, 473–479. [Google Scholar]
  7. Stephan, K.; Lin, S.; Durst, M.; Huang, F.; Seher, D. An investigation of energy separation in a vortex tube. Int. J. Heat Mass Transf. 1983, 26, 341–348. [Google Scholar] [CrossRef]
  8. Deissler, R.; Perlmutter, M. Analysis of the flow and energy separation in a turbulent vortex. Int. J. Heat Mass Transf. 1960, 1, 173–191. [Google Scholar] [CrossRef]
  9. Kassner, R.; Knoernschild, E. Friction Laws and Energy Transter in Circular Flow; Wright Patterson Air Force Base: Montgomery County, OH, USA, 1948; p. 259. [Google Scholar]
  10. Behera, U.; Paul, P.; Kasthurirengan, S.; Karunanithi, R.; Ram, S.; Dinesh, K.; Jacob, S. CFD analysis and experimental investigations towards optimizing the parameters of Ranque–Hilsch vortex tube. Int. J. Heat Mass Transf. 2005, 48, 1961–1973. [Google Scholar] [CrossRef] [Green Version]
  11. Gao, C.M.; Bosschaart, K.J.; Zeegers, J.C.H.; de Waele, A.T.A.M. Experimental study on a simple Ranqe-Hilsch vortex tube. Cryogenics 2005, 45, 173–183. [Google Scholar] [CrossRef]
  12. Westley, R. The College of Aeronautics (Cranfield) Note, No. 30(1955-5): No. 67(1957-7). Available online: https://www.cambridge.org/core/journals/aeronautical-journal/article/research-at-the-college-of-aeronautics-cranfield/E5F9971CA8C27168C0349632BF1AA963 (accessed on 7 October 2020).
  13. Hatnett, J.P.; Eckert, E.R.G. Experimental Study of the Velocity and Temperature Distribution in a High Velocity Vortex-type Flow. Thans. ASME 1957, 79, 751–758. [Google Scholar]
  14. Takahama, H. Studies on Vortex Tubes (2nd Report), Reynolds Number the Effect of the Cold Air Rate and the Partial Admission of Nozzle on the Energy Separation. Bull. JSME 1996, 9, 121–130. [Google Scholar] [CrossRef]
  15. Comasser, S. The Vortex tube. J. AM. Soc. Naval Eng. 1951, 63, 99–108. [Google Scholar] [CrossRef]
  16. Stephan, K.; Lin, S.; Durst, M.; Huang, F.; Seher, D. A similarity relation for energy separation in a vortex tube. Int. J. Heat Mass Transf. 1984, 27, 911–920. [Google Scholar] [CrossRef]
  17. Fröhlingsdorf, W.; Unger, H. Numerical investigations of the compressible flow and the energy separation in the Ranque–Hilsch vortex tube. Int. J. Heat Mass Transf. 1999, 42, 415–422. [Google Scholar] [CrossRef]
  18. Eiamsa-Ard, S.; Promvonge, P. Numerical investigation of the thermal separation in a Ranque–Hilsch vortex tube. Int. J. Heat Mass Transf. 2007, 50, 821–832. [Google Scholar] [CrossRef]
  19. Skye, H.M.; Nellis, G.F.; Klein, S.A. Comparison of CFD analysis to empirical vortex tube. Int. J. Refrig. 2006, 29, 71–80. [Google Scholar] [CrossRef]
  20. Kaya, H.; Uluer, O.; Kocaoğlu, E.; Kirmaci, V. Experimental analysis of cooling and heating performance of serial and parallel connected counter-flow Ranquee–Hilsch vortex tube systems using carbon dioxide as a working fluid. Int. J. Refrig. 2019, 106, 297–307. [Google Scholar] [CrossRef]
  21. Li, N.; Jiang, G.; Fu, L.; Tang, L.; Chen, G. Experimental study of the impacts of the cold mass fraction on internal parameters of a vortex tube. Int. J. Refrig. 2019, 104, 151–160. [Google Scholar] [CrossRef]
  22. Hu, Z.; Li, R.; Yang, X.; Yang, M.; Day, R.; Wu, H.-W. Energy separation for Ranque-Hilsch vortex tube: A short review. Therm. Sci. Eng. Prog. 2020, 19, 100559. [Google Scholar] [CrossRef]
  23. Rafiee, S.E.; Sadeghiazad, M.M. Experimental analysis on the impact of navigator’s angle on velocimetry and thermal capability of RH-vortex tube. Appl. Therm. Eng. 2020, 169, 114907. [Google Scholar] [CrossRef]
  24. Fotso, B.M.; Talawo, R.; Nguefack, M.F.; Fogue, M. Modeling and thermal analysis of a solar thermoelectric generator with vortex tube for hybrid vehicle. Case Stud. Therm. Eng. 2019, 15, 100515. [Google Scholar] [CrossRef]
  25. Thakare, H.; Parekh, A.D. Experimental investigation of Ranque—Hilsch vortex tube and techno—Economical evaluation of its industrial utility. Appl. Therm. Eng. 2020, 169, 114934. [Google Scholar] [CrossRef]
  26. Dutta, T.; Sinhamahapatra, K.; Bandyopadhyay, S.S. CFD Analysis of Energy Separation in Ranque-Hilsch Vortex Tube at Cryogenic Temperature. J. Fluids 2013, 2013, 1–14. [Google Scholar] [CrossRef] [Green Version]
  27. Im, S.Y. An Experimental Study on the Geometric setup of a Low-Pressure Vortex tube. Master’s Thesis, Chungnam National University, Daejeon, Korea, 2004. [Google Scholar]
Figure 1. Cross-section of the vortex tube in the “free” and “forced” vortex flow.
Energies 13 05227 g001
Figure 2. Supposed flow pattern and energy flow in the counter flow type.
Energies 13 05227 g002
Figure 3. Schematic diagram of the vortex tube system.
Energies 13 05227 g003
Figure 4. Photograph of the experimental apparatus for the vortex tube.
Energies 13 05227 g004
Figure 5. Indirect type heater core.
Energies 13 05227 g005
Figure 6. Direct type air conditioning filter.
Energies 13 05227 g006
Figure 7. Schematic diagram of the indirect heater core.
Energies 13 05227 g007
Figure 8. Photograph of an indirect experimental device with a heater core.
Energies 13 05227 g008
Figure 9. Schematic diagram of the direct air conditioning filter.
Energies 13 05227 g009
Figure 10. Photograph of the direct experimental device with air conditioning filter.
Energies 13 05227 g010
Figure 11. Temperature differences ∆Th and ∆Tc according to inlet pressure (Pi) 0.5 kgf/cm2.
Energies 13 05227 g011
Figure 12. Temperature differences ∆Th and ∆Tc according to inlet pressure (Pi) 1.0 kgf/cm2.
Energies 13 05227 g012
Figure 13. Temperature differences ∆Th and ∆Tc according to inlet pressure (Pi) 1.5 kgf/cm2.
Energies 13 05227 g013
Figure 14. Temperature differences ∆Th and ∆Tc according to inlet pressure (Pi) 2.0 kgf/cm2.
Energies 13 05227 g014
Figure 15. Temperature differences ∆Th and ∆Tc according to inlet pressure (Pi) 2.5 kgf/cm2.
Energies 13 05227 g015
Figure 16. Temperature differences ∆Th and ∆Tc according to inlet pressure (Pi) 3.0 kgf/cm2.
Energies 13 05227 g016
Figure 17. Temperature differences ∆Th and ∆Tc according to inlet pressure (Pi) 3.5 kgf/cm2.
Energies 13 05227 g017
Figure 18. Temperature differences ∆Th and ∆Tc according to inlet pressure (Pi) 4.0 kgf/cm2.
Energies 13 05227 g018
Figure 19. Temperature differences ∆Th and ∆Tc according to inlet pressure (Pi) 4.5 kgf/cm2.
Energies 13 05227 g019
Figure 20. Temperature differences ∆Th and ∆Tc according to inlet pressure (Pi) 5.0 kgf/cm2.
Energies 13 05227 g020
Figure 21. Total discharge flow rate of intake air pressure by the number of nozzles.
Energies 13 05227 g021
Figure 22. Temperature difference ∆Th, max and ∆Tc, max according to the number of nozzle holes.
Energies 13 05227 g022
Figure 23. Indirect heat exchange method of ∆Taoc and ∆Tac according to pressure.
Energies 13 05227 g023
Figure 24. Indirect heat exchange method of ∆Th according to pressure.
Energies 13 05227 g024
Figure 25. Direct heat exchange method of ∆Tco according to pressure.
Energies 13 05227 g025
Figure 26. Direct heat exchange method of ∆Tho according to pressure.
Energies 13 05227 g026
Table 1. Dimension of the vortex tube.
ParameterValueUnit
Tube length (L)128mm
Inlet diameter of vortex tube (D)9.8mm
Inner diameter of nozzles (Dn)1, 1.2, 1.4, 1.7, 2.1mm
Diameter of cold end orifice (dc)6mm
Number of nozzle holes (Nh)4, 5, 6, 7, 8-
Nozzle area ratio (Sn)0.142-
Table 2. Range and uncertainly of the equipment used in the experiment.
InstrumentModelRangeUncertainly
GraphtecGL 840 Midi Logger-±0.5%
Thermo-coupleK-type−100 to 650 °C±2.5 °C
Pressure sensorDream31 (A-type) Dream−1 to 6 bar±1.5%
Gas regulatorRenown0–6 bar±2.0%
Air compressorRenown20 HP-
Air surge tankRenown280 L-
Table 3. Th, max and Tc, max of yc and nozzle holes depending on the pressure.
Pi Th, maxycNhTc, maxycNh
0.58.86 °C0.65 hole−5.57 °C0.57 hole
1.015.06 °C0.87 hole−14.17 °C0.56 hole
1.524.51 °C0.86 hole−15.90 °C0.57 hole
2.030.42 °C0.84 hole−20.08 °C0.57 hole
2.537.17 °C0.87 hole−24.06 °C0.57 hole
3.045.55 °C0.87 hole−26.90 °C0.57 hole
3.547.61 °C0.87 hole−29.66 °C0.57 hole
4.053.38 °C0.87 hole−32.05 °C0.57 hole
4.557.70 °C0.87 hole−34.46 °C0.57 hole
5.060.51 °C0.87 hole−36.33 °C0.57 hole

