Article

Review of Key Performance Indicators for Process Monitoring in the Mining Industry

by
Paulina Gackowiec
1,*,
Marta Podobińska-Staniec
1,
Edyta Brzychczy
1,
Christopher Kühlbach
2 and
Toyga Özver
2
1
Faculty of Mining and Geoengineering, AGH University of Science and Technology, 30-059 Cracow, Poland
2
Talpasolutions GmbH, 45327 Essen, Germany
*
Author to whom correspondence should be addressed.
Energies 2020, 13(19), 5169; https://doi.org/10.3390/en13195169
Submission received: 8 September 2020 / Revised: 28 September 2020 / Accepted: 2 October 2020 / Published: 4 October 2020
(This article belongs to the Special Issue Integrated Approaches for Enterprise Sustainability)

Abstract

:
The sustainable development of an organisation requires a holistic approach to the evaluation of an enterprise’s goals and activities. The essential means enabling an organisation to achieve goals are business processes. Properly managed, business processes are a source of revenue and become an implementation of business strategy. The critical elements in process management in an enterprise are process monitoring and control. It is therefore essential to identify the Key Performance Indicators (KPIs) that are relevant to the analysed processes. Process monitoring can be performed at various levels of management, as well as from different perspectives: operational, financial, security, or maintenance. Some of the indicators known from other fields (such as personnel management, finance, or lean manufacturing) can be used in mining. However, the operational mining processes require a definition of specific indicators, especially in the context of increasing the productivity of mining machines and the possibility of using sensor data from machines and devices. The article presents a list of efficiency indicators adjusted to the specifics and particular needs of the mining industry resulting from the Industry 4.0 concept, as well as sustainable business performance. Using the conducted research and analysis, a list of indicators has been developed concerning person groups, which may serve as a benchmark for mining industry entities. The presented proposal is a result of work conducted in the SmartHUB project, which aims to create an Industrial Internet of Things (IIoT) platform that will support process management in the mining industry.

Graphical Abstract

1. Introduction

In response to the constantly growing requirements of the business environment in terms of the quality of provided products and the necessity to increase their competitiveness, companies are seeking methods and techniques for the continuous improvement of their processes. Currently, organisations have the opportunity to develop and improve their performance through progressive technological development and the dissemination of computer devices [1,2]. The present technical conditions allow for the implementation of advanced technological solutions and provide more widespread access to the infrastructure that enables the acquisition of information directly from industrial equipment. Data collection is the starting point for a comprehensive understanding of the processes and specifics of the utilised machines and, consequently, the implementation of improvements at all levels of management in the organisation.
In the context of the current industrial and digital transformation, the widely discussed term of Industry 4.0 has a significant role to play. Industry 4.0 is a concept that involves a variety of technological solutions and covers activities and measures affecting the entire industrial ecosystem [3] and may improve the policy of sustainable business development. The main assumptions of the Industry 4.0 concept are exemplified in papers undertaken by [4,5,6,7,8]. An essential component of Industry 4.0 is the Internet of Things (IoT), which enables the integration of multiple devices into one integrated system, collecting data from the entire infrastructure and environment. The monitoring of various machines based on IoT systems is an invaluable source of knowledge about the process. With a view to the application of Industry 4.0 in mines, the concept of the Industrial Internet of Things (IIoT) is particularly important, bringing the assumptions of the Internet of Things to the field of industrial operations.
The implementation of the concept of Industry 4.0 marks the beginning of intensive industrial progress and enables a new approach to the development of sustainable knowledge-based management. Sustainable development is a key factor determining the selection and deployment of appropriate process evaluation indicators, which can significantly affect not only the performance of the conducted operations but also sustainable development from a business perspective. Technological development, enabling the acquisition of measurable process parameters, may be a starting point for making reasonable decisions; properly managing resources; increasing the level of safety; and, as a result, improving the overall sustainable business performance in the mining industry.
Nevertheless, despite the considerable benefits and opportunities arising from the implementation of Industry 4.0, the potential for implementing emerging technologies often remains unexploited, and sensor-based information is rarely fully used to support decision-making systems. These challenges are mainly rooted in the high costs of implementing new technologies, the demands for the appropriate qualifications of personnel, and the necessity to store and analyse large amounts of data. A prerequisite for the optimum use of existing infrastructure and the achievement of company goals is the formulation of appropriate measures and tools for evaluating the efficiency of industrial processes. Measurable and significant instruments in assessing the success of an organisation’s objectives are indicators defined by the term Key Performance Indicators (KPIs). The definition in the paper [9] states that “KPIs act as a set of measures focusing on those sides of organisational performance that are critical for the success of the organisation”.
The improvement of the mining processes has become increasingly noticeable in recent years. Mining companies are looking for new opportunities to optimise processes, implementing new policies for automation, using digital technologies [1,5,10,11,12,13], and utilising modern computer programmes to support technological processes [14]. Taking into account the progressive digitalisation of the mining industry, there is a need to identify mining KPIs which are suited to enable the comprehensive and sustainable management of mines. Increasing the efficiency of the conducted processes is invariably the major objective of mining companies. Efficient processes determine the efficiency of the entire organisation and are dependent on the established management system in the company. The crucial issue at this point is to know how to make use of the collected data to improve the performance of the work. By taking advantage of the opportunities offered by digital transformation, such as real-time process and machine monitoring, minimising equipment downtime, and reducing maintenance costs, companies are able to implement the required infrastructure and systems to collect and store process and machine data to improve performance and increase productivity. With the accurate and detailed processing and interpretation of the data, this is the basis for a monitoring and managing system for both individual machines and processes as a whole.
Performance indicators are widely used and highly beneficial in many economic sectors [15,16,17]. Mining process management may make use of KPIs established in other fields, however, we must bear in mind that operational mining processes require the formulation of reliable performance indicators to account for a range of different mining operations. In the literature, various examples may be found describing the applicability of indicators in the field of optimisation and, less commonly, concrete KPI classification. The literature references cover very different fields, most often discussing financial and human resources and operational KPI implementation [18,19,20,21]. The topics discussed are also to be found in publications from the mining domain [21,22,23]; however, these are often incomplete and do not reflect the possibilities offered by the use of sensor data. Thus, the main contribution of our article is a comprehensive list of indicators applicable at different management levels, taking into account the main perspectives of a process, such as work environment, machinery, and the human factor.
Our paper presents the results of research conducted in the SmartHUB project (financed by EIT Raw Materials), which aims to create an IIoT platform that will support process management in the mining industry.
The paper is organised as follows: Section 2 presents an introduction to process monitoring and the methodology of Systematic Literature Review (SLR). The obtained results from the SLR and the proposal of KPIs in the mining industry and their discussion are presented in Section 3. Finally, Section 4 concludes the paper and points out the value of KPI benchmarking in the effective management of mining processes, as well as indicating possible directions for future work based on a KPI survey.

2. Materials and Methods

In this section, we present selected materials and methods crucial for the paper’s content, such as process monitoring and control, as well as a systematic literature review plan, which are presented in Section 2.1 and Section 2.2, respectively.

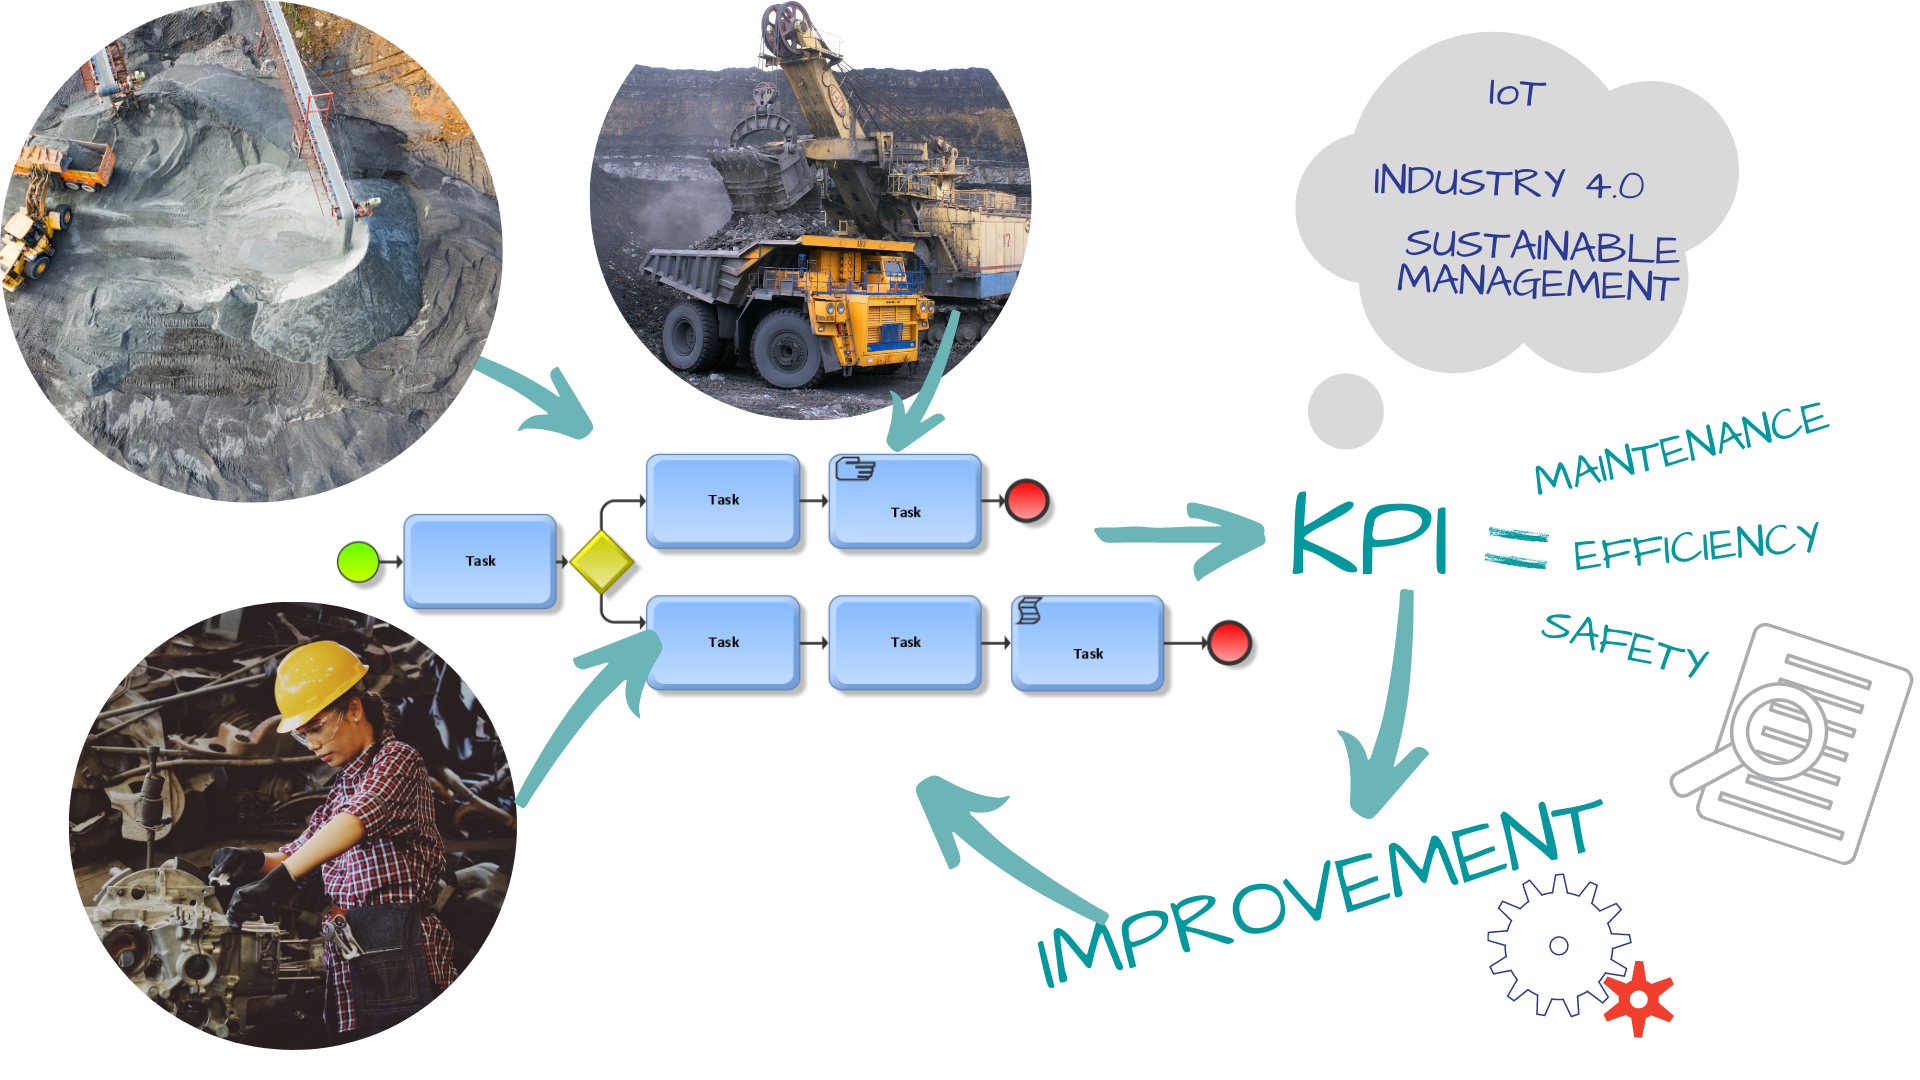
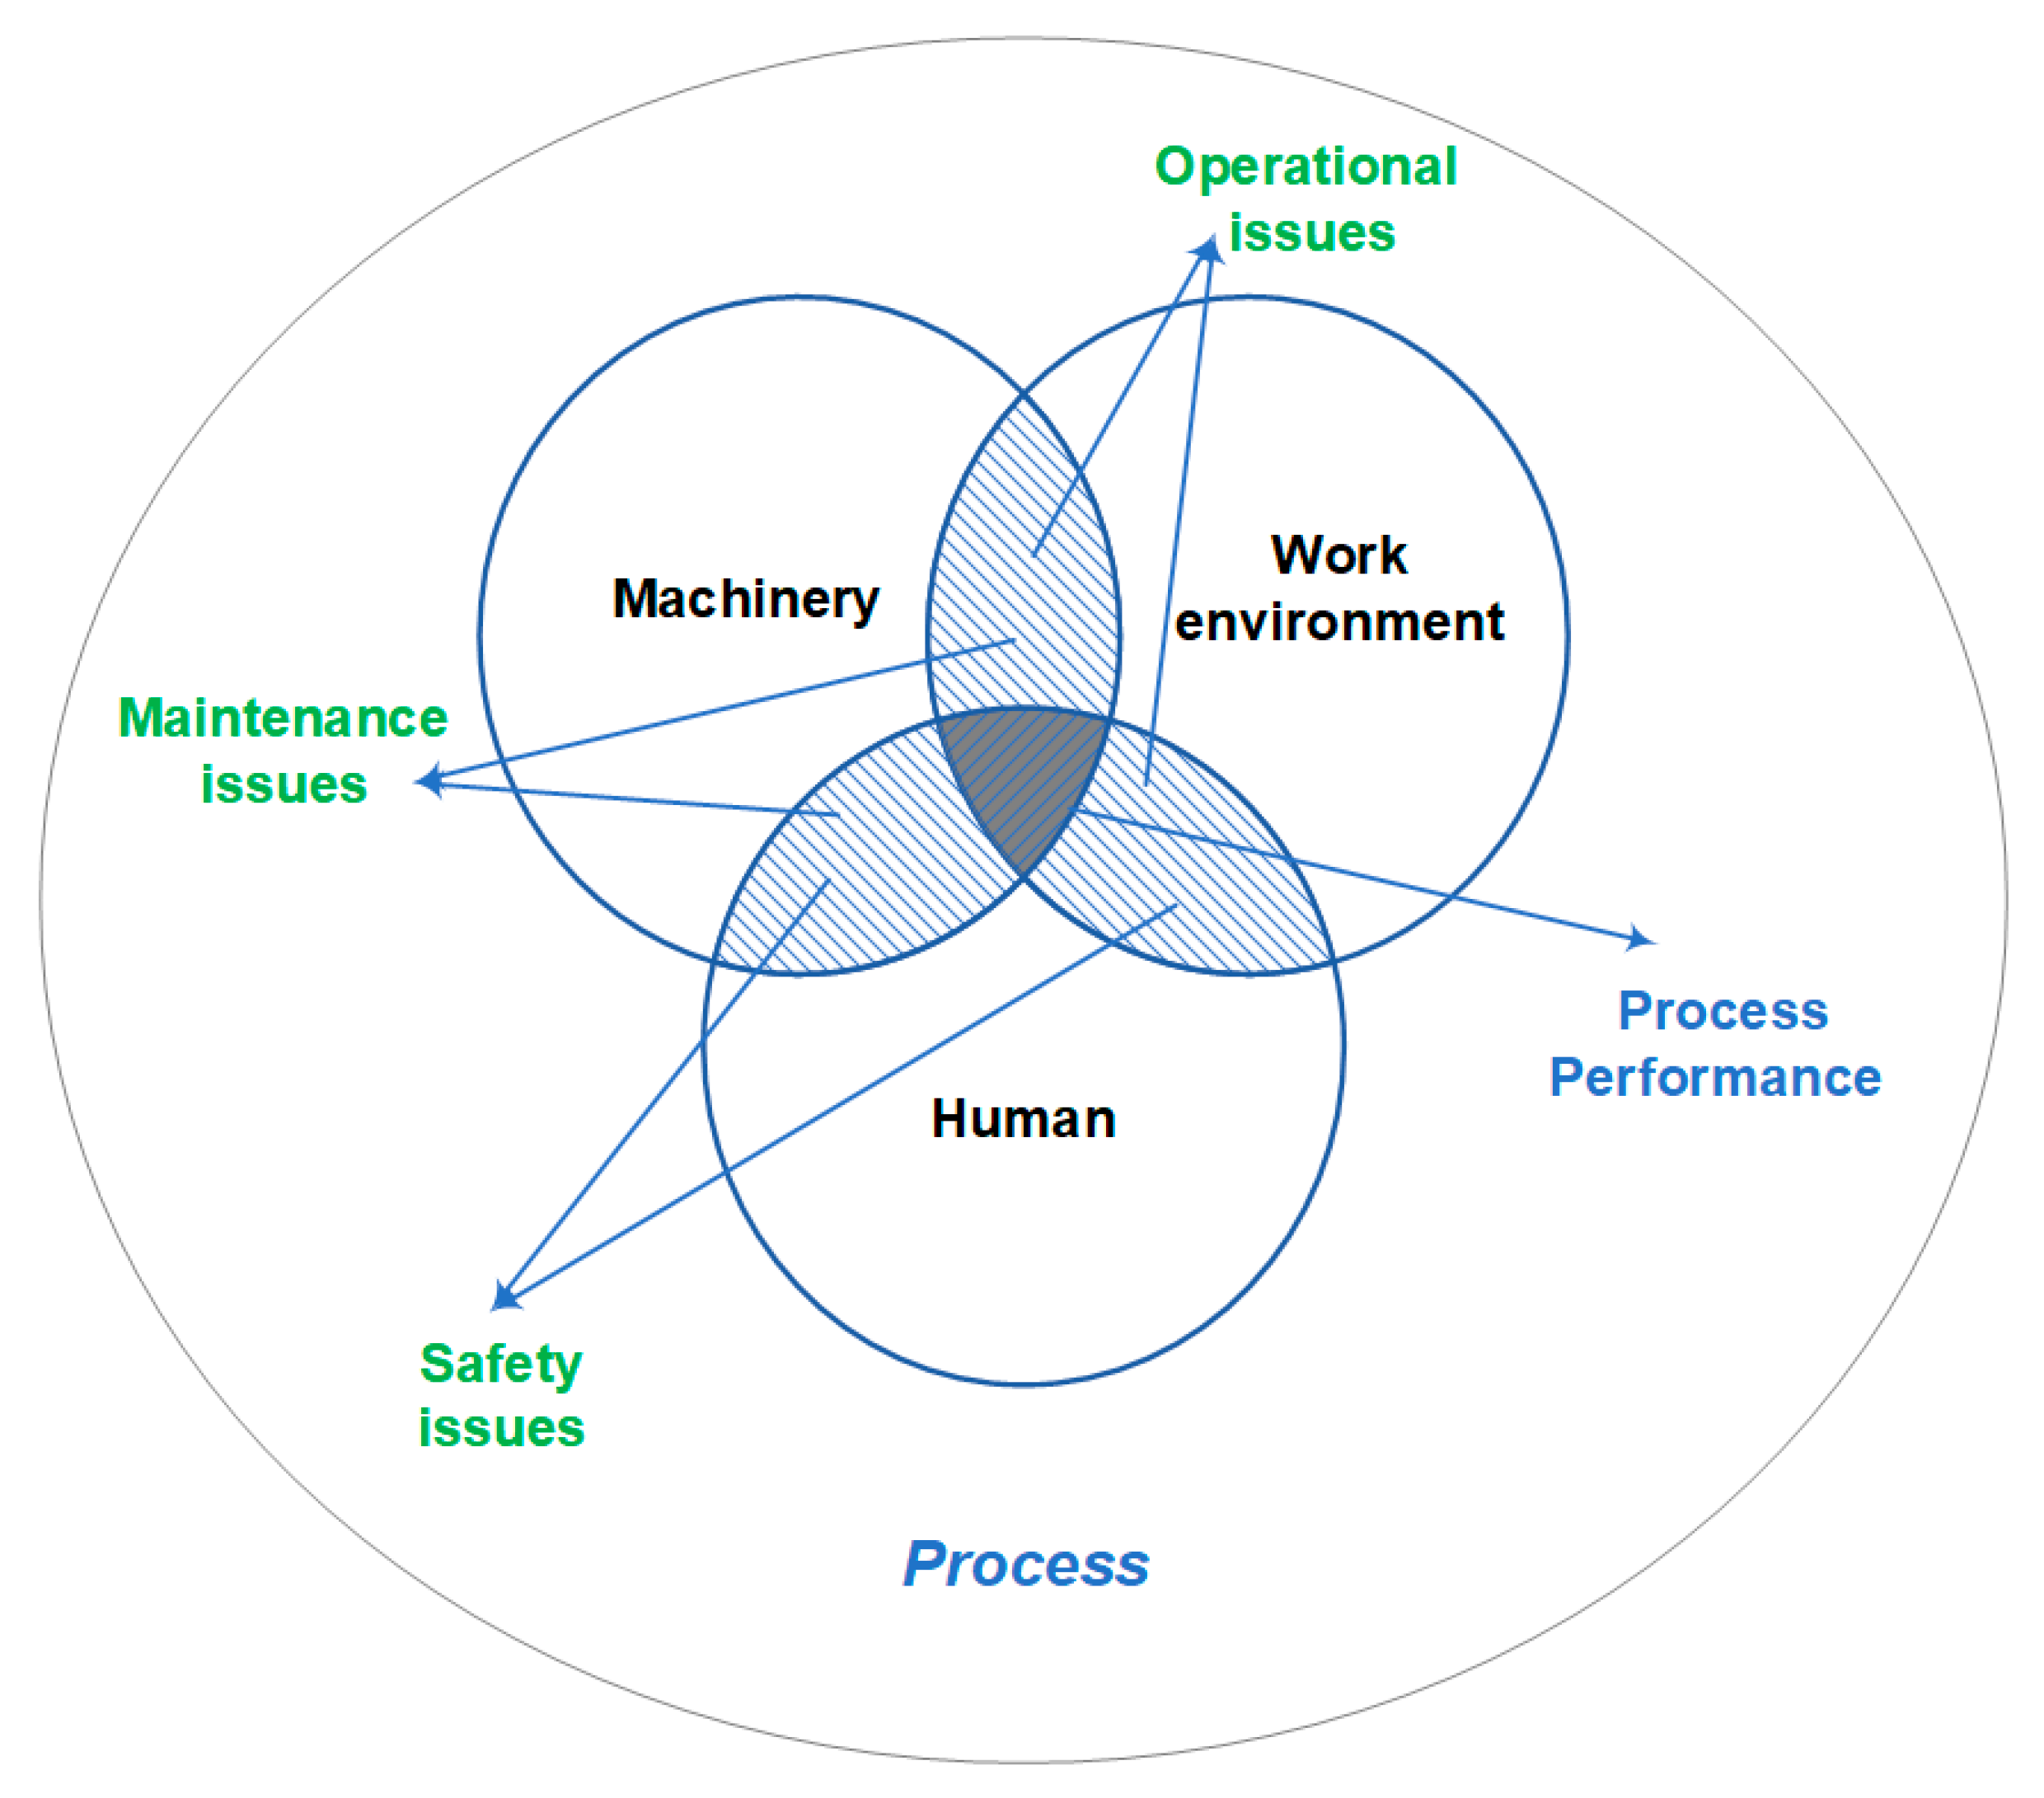
2.1. Process Monitoring and Control

Process monitoring and control is one of the essential phases of Business Process Management (BPM). The main reasons why companies have to monitor and control their business activities and processes come from legal regulations or the need to find and correct errors in process execution and increase the process efficiency. An increase in process efficiency can be achieved by using monitoring data to optimise the process, as well as performing integrated planning based on the available process data. One possibility in this area is to identify important goals and success factors and use them to define KPIs [24]. Defined KPIs are monitored in order to find deviations from the reference values, enabling immediate reaction and the provision of corrections to process execution.
Process monitoring can be performed at various levels of management, as well as from different perspectives, including technical, operational, financial, safety, or maintenance perspectives. However, it should combine extensive knowledge about the process with available data sources providing up-to-date information on its performance.
Some of the indicators known from other fields (such as personnel management, finance, or lean manufacturing) can be used in mining (e.g., earnings before deducting interest and taxes (EBIT), the turnover per employee, value added per employee, health and environment incidents, Total Effective Equipment Performance (TEEP), loading time, cycle time, etc.). However, the operational mining processes require a definition of specific indicators, especially in the context of increasing the productivity of mining machines and the possibility of using sensor data from machines and devices.
As part of the current adoption of IIoT solutions in the mining industry, mines are equipped with various sensors enabling the monitoring of processes. Among them, one can find machinery sensors, environmental sensors, and human sensors (implemented, among others, in wearable devices such as smartwatches, smart eyewear, smart clothing, wearable cameras, and others [25]). Their application covers all aspects of process execution, such as machinery performance (i.e., statuses, payloads, energy consumption); environmental conditions (i.e., temperature, humidity, air quality, raw material quality); the monitoring of natural hazards [26]; and, last but not least, human performance (i.e., body readings, such as temperature, pulse, the monitoring of the brain activity, and the detection of worker fatigue levels or worker tracking).
These rather technical readings are the basis for conversion into more general KPIs (Figure 1).
The definition of KPIs has to take into consideration the following perspectives of a mining process, such as work environment (deposit, natural hazards, ventilation issues), machinery (becoming in recent years more advanced from the information technology point of view), and finally the human factor. These three perspectives decide the process performance and raise, at their cross-sections, important issues which should be monitored and managed in the process, such as maintenance issues, safety issues, and operational issues.
In our research, we investigated the most important indicators for a mining company related to all the mentioned perspectives. The collection of KPIs was initiated with the SLR approach, whose methodology is described in the next section.

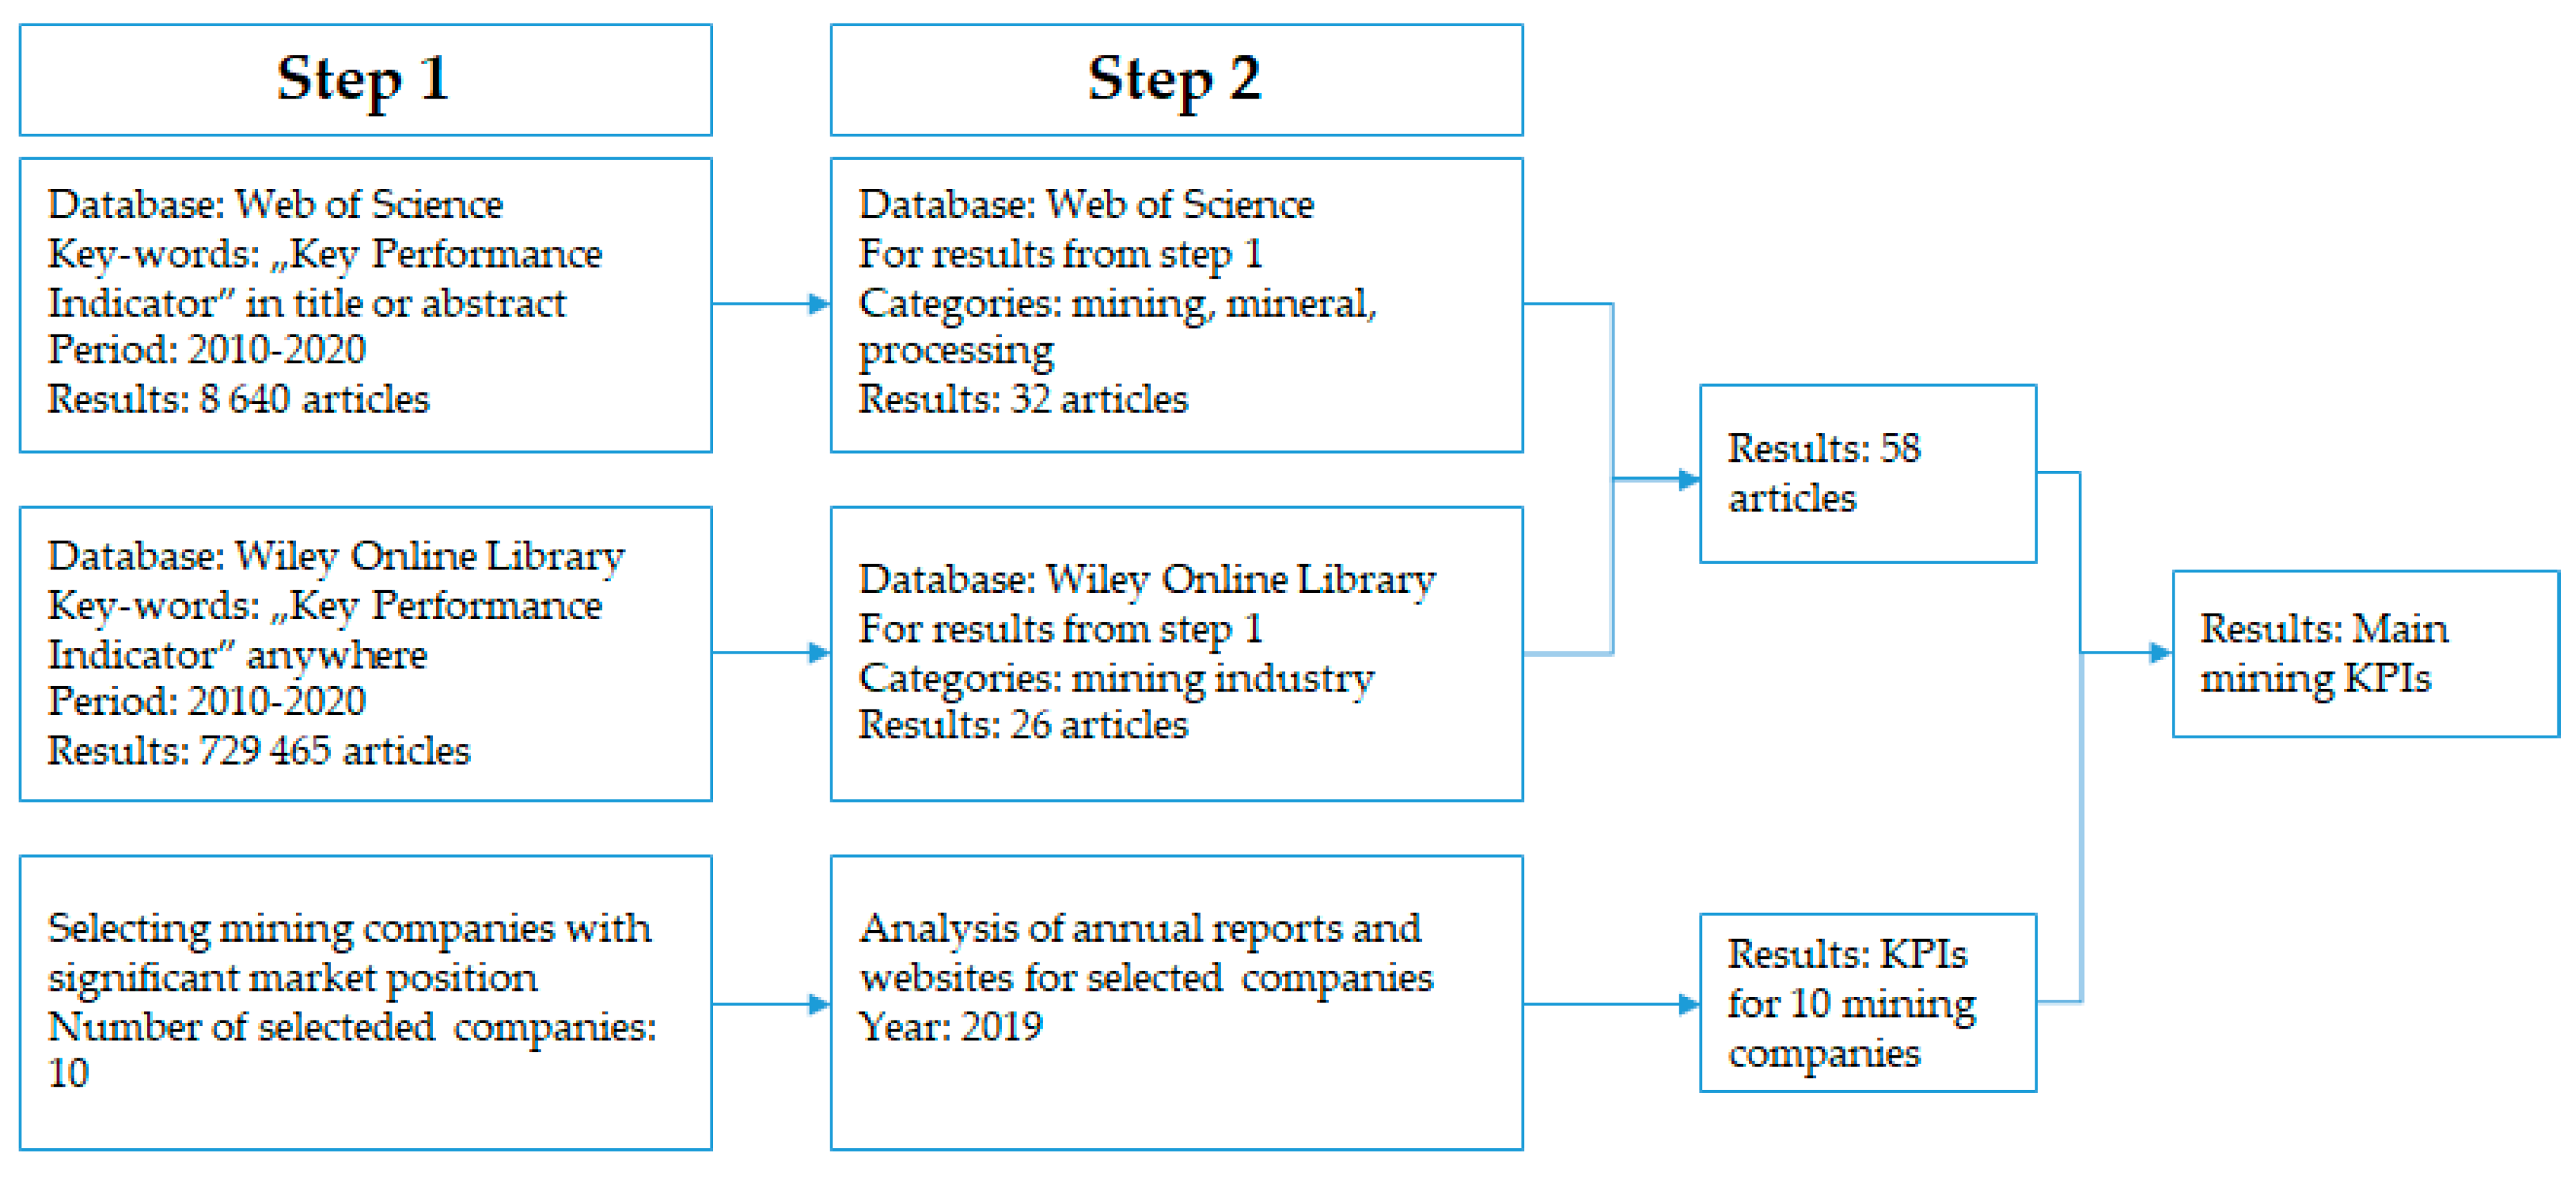
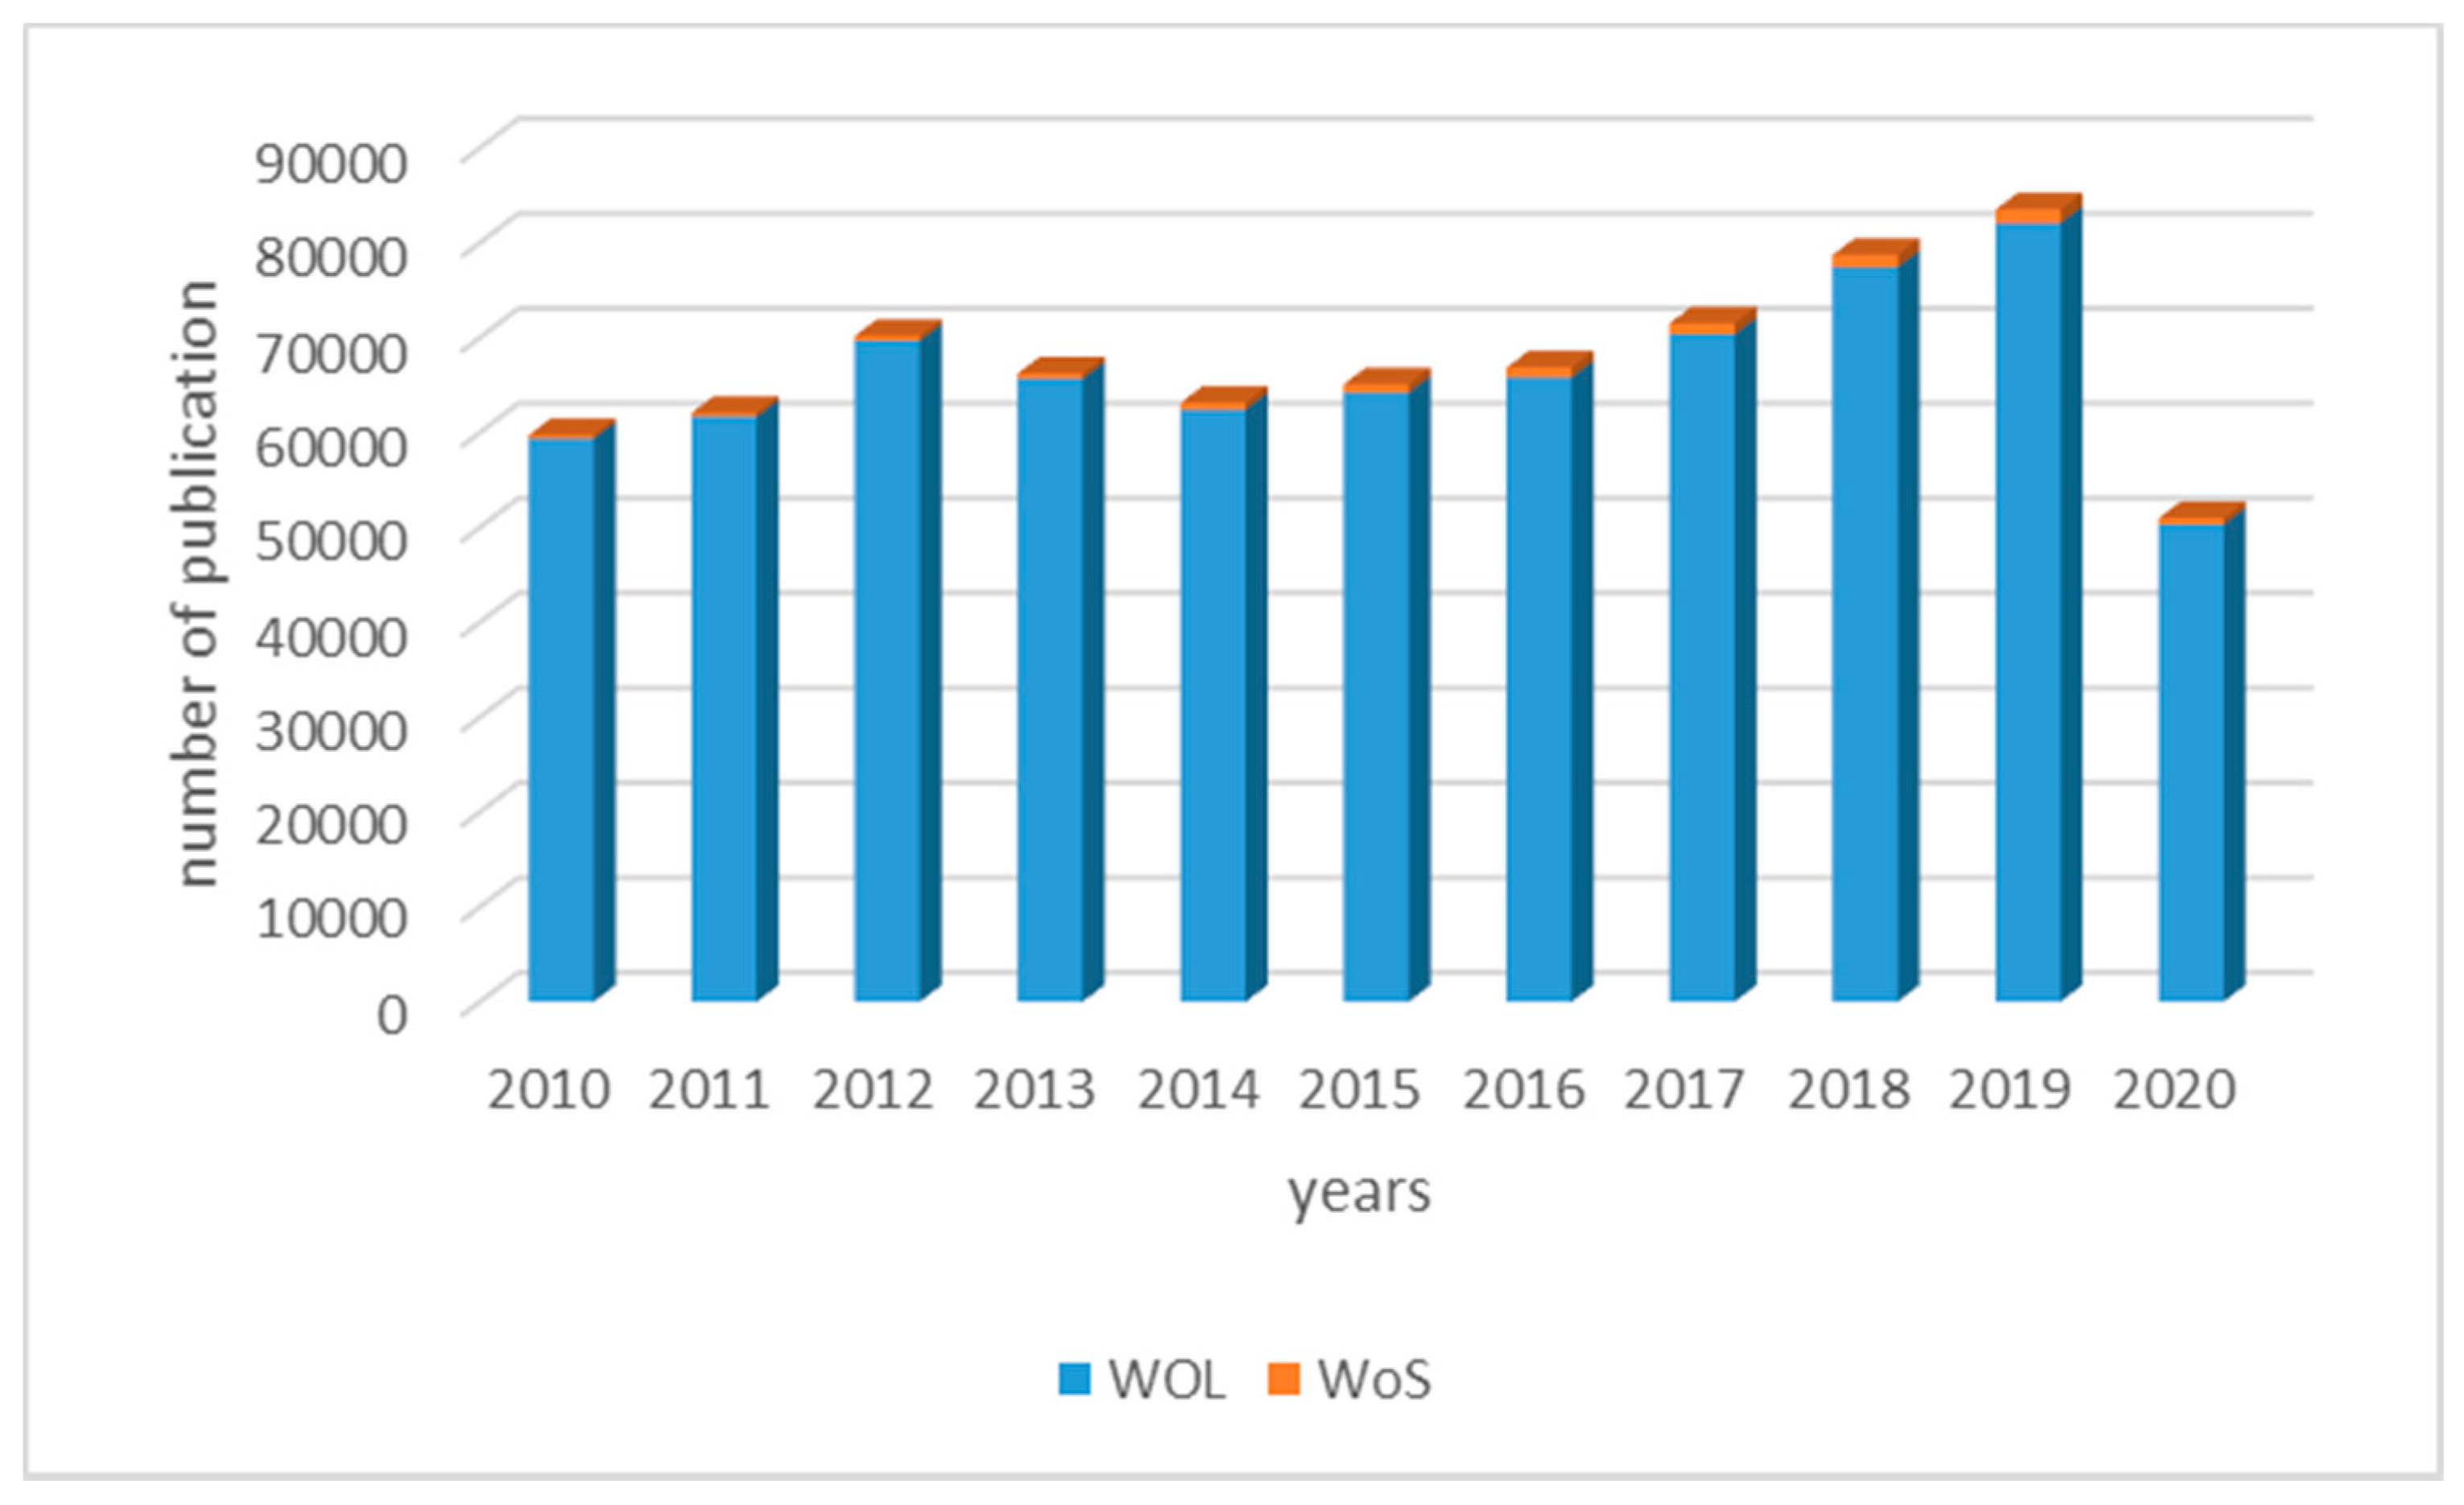
2.2. Systematic Literature Review

The company’s efforts to improve their processes over the years resulted in significant progress in terms of the development of performance indicators and popularised the subject of KPIs among decision-makers. Taking these issues and the gap observed in the mining industry in the area of process performance assessment into consideration, the following research questions (RQ) were formulated:
RQ1:
What are the main areas of the application of KPIs in an organisation?
RQ2:
What are the most commonly used KPIs for data-based process optimisation in the mining industry?
RQ1 focuses on illustrating the areas of the organisation in which KPIs are applied. Organisations adopt different performance indicators depending on the industry in which they operate and the market where they compete. The measures of process evaluation are strictly related to the function of the decision-maker, as well as the scale of operation and strategy of the company. The process understanding and availability of data will also differentiate the indicators applied in a particular organisation. It is, therefore, important to consider the various examples of the use of KPIs as a basis for further analysis and define the main fields of KPI application.
RQ2 is dedicated to identifying KPIs that have been used in the raw materials industry. The searches in this area focus on the analysis of literature examples, discussing efficiency indicators dedicated to the mining industry and the optimisation of mining processes based on specific measurements and parameters.
To identify the primary literature references covering the issue of KPIs Web of Science (WoS) and Wiley Online Library (WOL) were investigated as the primary databases for research. Both databases were selected due to their broad thematic scope and interdisciplinary papers. The main steps used in the SLR are illustrated in Figure 2.
The first step primarily focuses on literature research to find papers from a wide range of fields, covering publications from a variety of sectors as benchmarks for the examination. The period covered by the analysis is 2010–2020 and it is deemed most relevant for the study. The literature review comprises research and review articles, conference papers, book chapters, as well as additional publications and the reports of leading mining companies published on their homepages. In order to increase the relevance of the conducted search, a list of criteria has been defined to help select the most appropriate literature positions.
The keyword used for the selection of articles was “Key Performance Indicator” in the article titles or abstracts. Only peer-reviewed articles written in English were selected. In the first step of the research, we obtained a total of 8640 results in Web of Science and 729,465 results in the Wiley Online Library.
In the second step, the literature review was focused on issues covering mining and raw materials. In this case, we used a selection of options according to scientific categories. Here, the following results were obtained in science categories:
  • For the WoS searching for “mining”, mineral”, “processing”, the results are 32 articles;
  • For the WOL searching for “key performance indicator” in keywords and “mining industry”, there were 26 articles.
In the last screening evaluation, the selection was based on the full text by examining the contents of 58 articles in depth (as presented in Figure 2). The main inclusion criteria used to identify the most relevant papers for the review were as follows: the item thematically corresponds to the main objective of the research—i.e., it proposes measurable parameters for process performance evaluation and provides a significant answer to the formulated research questions.

3. Results

3.1. SLR Results

In the first step, we aimed at presenting areas of the organisation in which KPIs are used. The yearly distribution of papers resulting from the first step of SLR is shown in Figure 3.
The most popular fields with KPIs in WOL were business and management, chemical and biochemical engineering, along with agriculture. The most common science categories for KPIs in WoS were engineering, electrical, and electronics, then management and telecommunications.
We indicated the following areas in an organisation where KPIs are most often used:
  • Finance [18];
  • Human resources [19,20];
  • Customer service [16];
  • Information technology [27,28];
  • Marketing and sales [29];
  • Logistics [17];
  • Technical/operational (differentiated by industry—e.g., manufacturing, quality [21], ergonomic [30]).
In presenting the wide range of use of KPIs in industrial applications, several examples can be given to creating a benchmark list in the selected areas:
  • Human resources: compensation cost, % of participants in communication training, % of training courses matching company requirements, consistent development of leadership skills, and the strengthening of the manager’s role as a coach and a mentor (leadership index) [20].
  • Finance: value added per employee, value added in relation to cost, turnover per employee, investment per employee, value added in relation to investments, and the share of investments to the total costs [18].
  • Operational: availability, utilisation, cycle time, flow time, corrective maintenance ratio, mean time to failure, mean time to repair, overall equipment effectiveness (OEE), production effectiveness, production process ratio, quality, % of available man hours used in proactive work, the number of work order requests, % of scheduled man hours over the total available man hours, the number of unplanned maintenance interventions, unscheduled maintenance downtime, health and environment incidents, and the number of unplanned maintenance interventions [31,32].
To answer RQ2, an overview of examples of KPIs used in the mining industry was created. This study was carried out in two stages. In the first stage, we analysed selected articles (32 in Web of Science and 26 in the Wiley Online Library), which can be further divided into papers related to KPIs in the raw materials in the following domains: financial, organisational, and transport. Most of the articles used in our research were published between 2017 and 2019. In the next stage, we made a list of publications (Table 1) which could be a benchmark for creating our proposal to the mining industry.
The results of the literature review were supplemented by reports and materials published by companies operating in the mining industry. The purpose of adding these supplementary sources was to draw attention to the indicators used in practice. We referred to the reports and data published by selected mining companies, taking into account the leading indicators used by these companies to assess the performance of the organisation.
The exemplary companies selected for the analysis are the mining companies which represent a significant position on the mineral resource market and constitute an essential benchmark for the mining industry as a whole. The following companies were selected for review: BHP Billiton, Rio Tinto, Glencore, Vale, Anglo American, Fortescue Metal, Fresnillo, Newmont, Boliden, and First Quantum Minerals. In addition, these companies regularly publish reports on sustainability performance which provide information on the indicators employed. Based on the information contained in the annual reports available on the companies’ websites (year 2019), the main performance indicators used by the selected companies were identified. The summary of the reported groups’ KPIs in the selected companies is presented in Table 2.
Table 2 presents aggregated and general groups of indicators used by companies to assess performance. For instance, indicators related to financial performance, such as payments, expenditures, dividends, etc., are classified in one group of economic performance indicators, and measurements including energy consumption, biodiversity, climate change, air emissions, and waste are integrated into one group called environment performance. Based on the data presented in the table above, one can observe that many of the indicators are frequently repeated among the analysed companies. The most commonly considered performance monitoring areas cover health and safety, environmental and climate change, community and employee-related performance, and economic performance. Less often, companies address issues such as community relationships and development, production, and society in their reports. The indicators least frequently considered by enterprises are the following: business ethics and transparency, equal opportunities, and the recovery of degraded areas.
For the selected companies, the reported KPI data mainly concern performance in the sustainability dimension, and the reports do not specify indicators focused on the operational measurement of activity in the selected companies. This leads to the conclusion that mining companies concentrate their activities significantly on aspects of sustainable development, bearing in mind that the management and sustainable exploitation of resources is a necessary requirement for companies consciously planning their development.
Some examples can be found in branchial reports and other sources—e.g., “Extraction in terms of efficiency” [67], where several KPIs referring to an excavator, electric shovel, hydraulic excavator, front loader, or mining cables could be found in [68,69], where more specific indicators for the mining sector are presented. Examples of additional indicators are included in Table 3.
Based on the conducted SLR, it may be noted that in the literature, many studies address the issue of KPIs at different levels of detail. On the grounds of the literature review, it can be stated that the most commonly used non-financial groups of indicators in the raw materials industry include safety and health, employees, corporate governance, footprint management, social investment, innovation research, manufacturing, and sales.
The analysis of the selected publications and detailed examination of the indicators presented in the literature leads to the conclusion that there are no comprehensive classifications and specific examples of indicators applicable in the area of process management taking into consideration the mentioned process perspectives. Only a few publications present grouped indicators—e.g., in [68] the proposed classification we include areas such as safety, quality, cost, delivery, and fleet management, and in [22] we can find KPI classification from -process and equipment point of view. Some publications from Table 1 and Table 2 include examples of KPIs, but in our opinion this sector needs a framework enabling a meaningful analysis and classification of KPIs related to the most important issues, such as operations, maintenance, and safety.
Moreover, the unexploited potential of the Industry 4.0 concept has been identified in the use of data from machine sensors for the evaluation of the efficiency of mining processes, with particular emphasis on the operation of machinery and equipment. In response to the lack of a defined classification for indicators relying on the possibilities of IIoT development in the field of monitoring the mining process at work, an attempt was undertaken to develop a comprehensive classification of mining KPIs that also covered this issue.

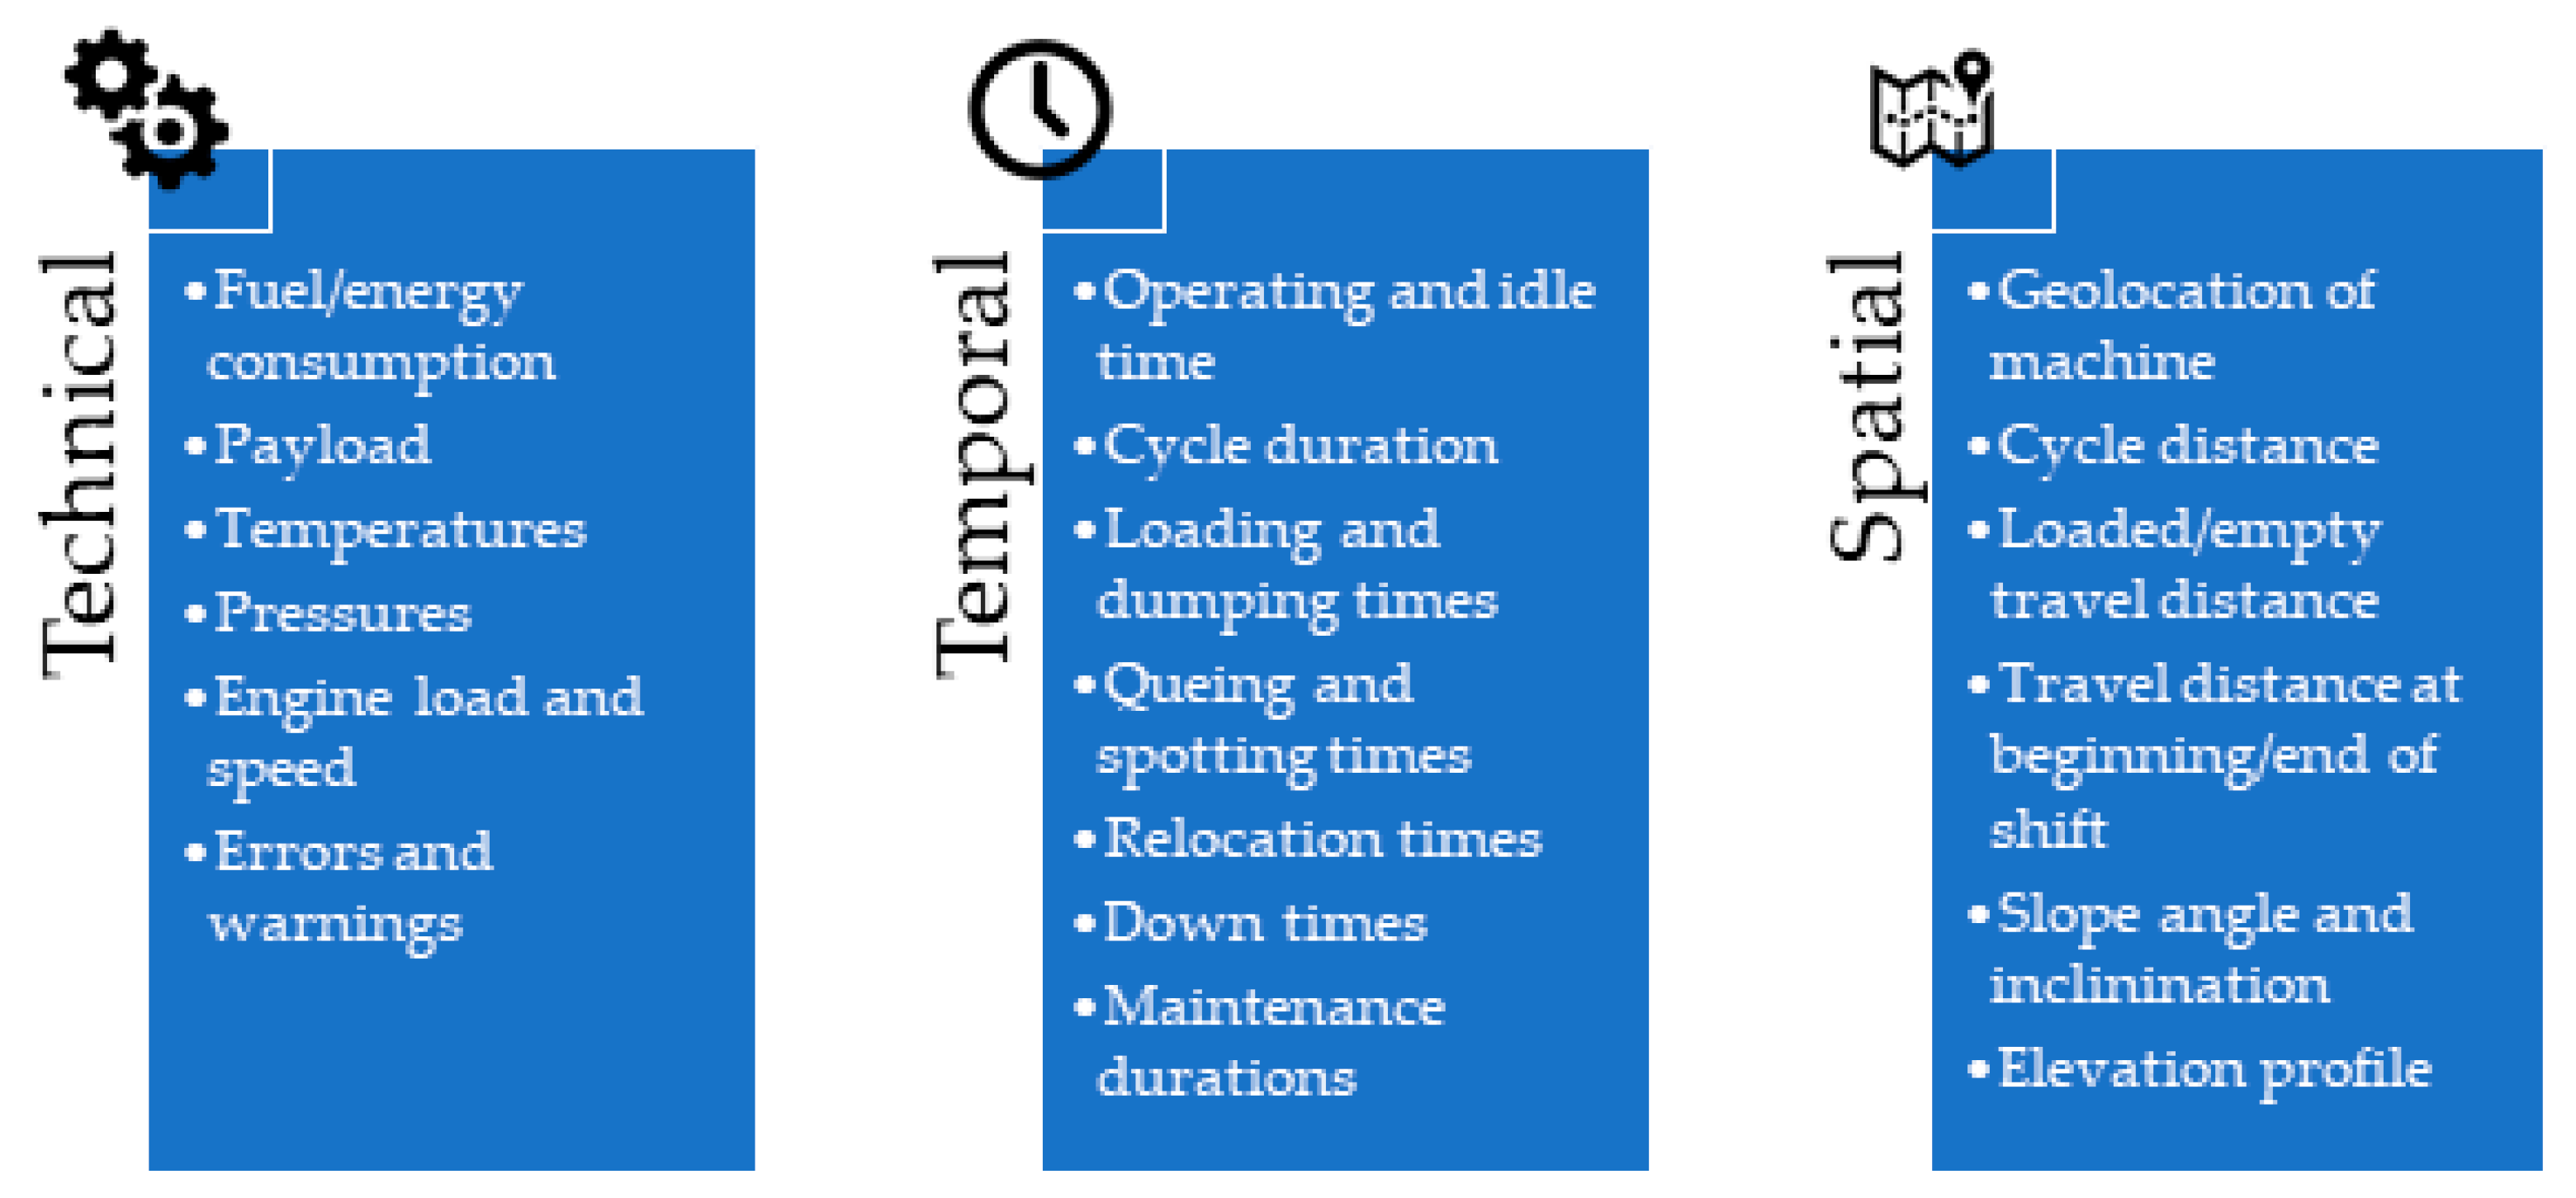
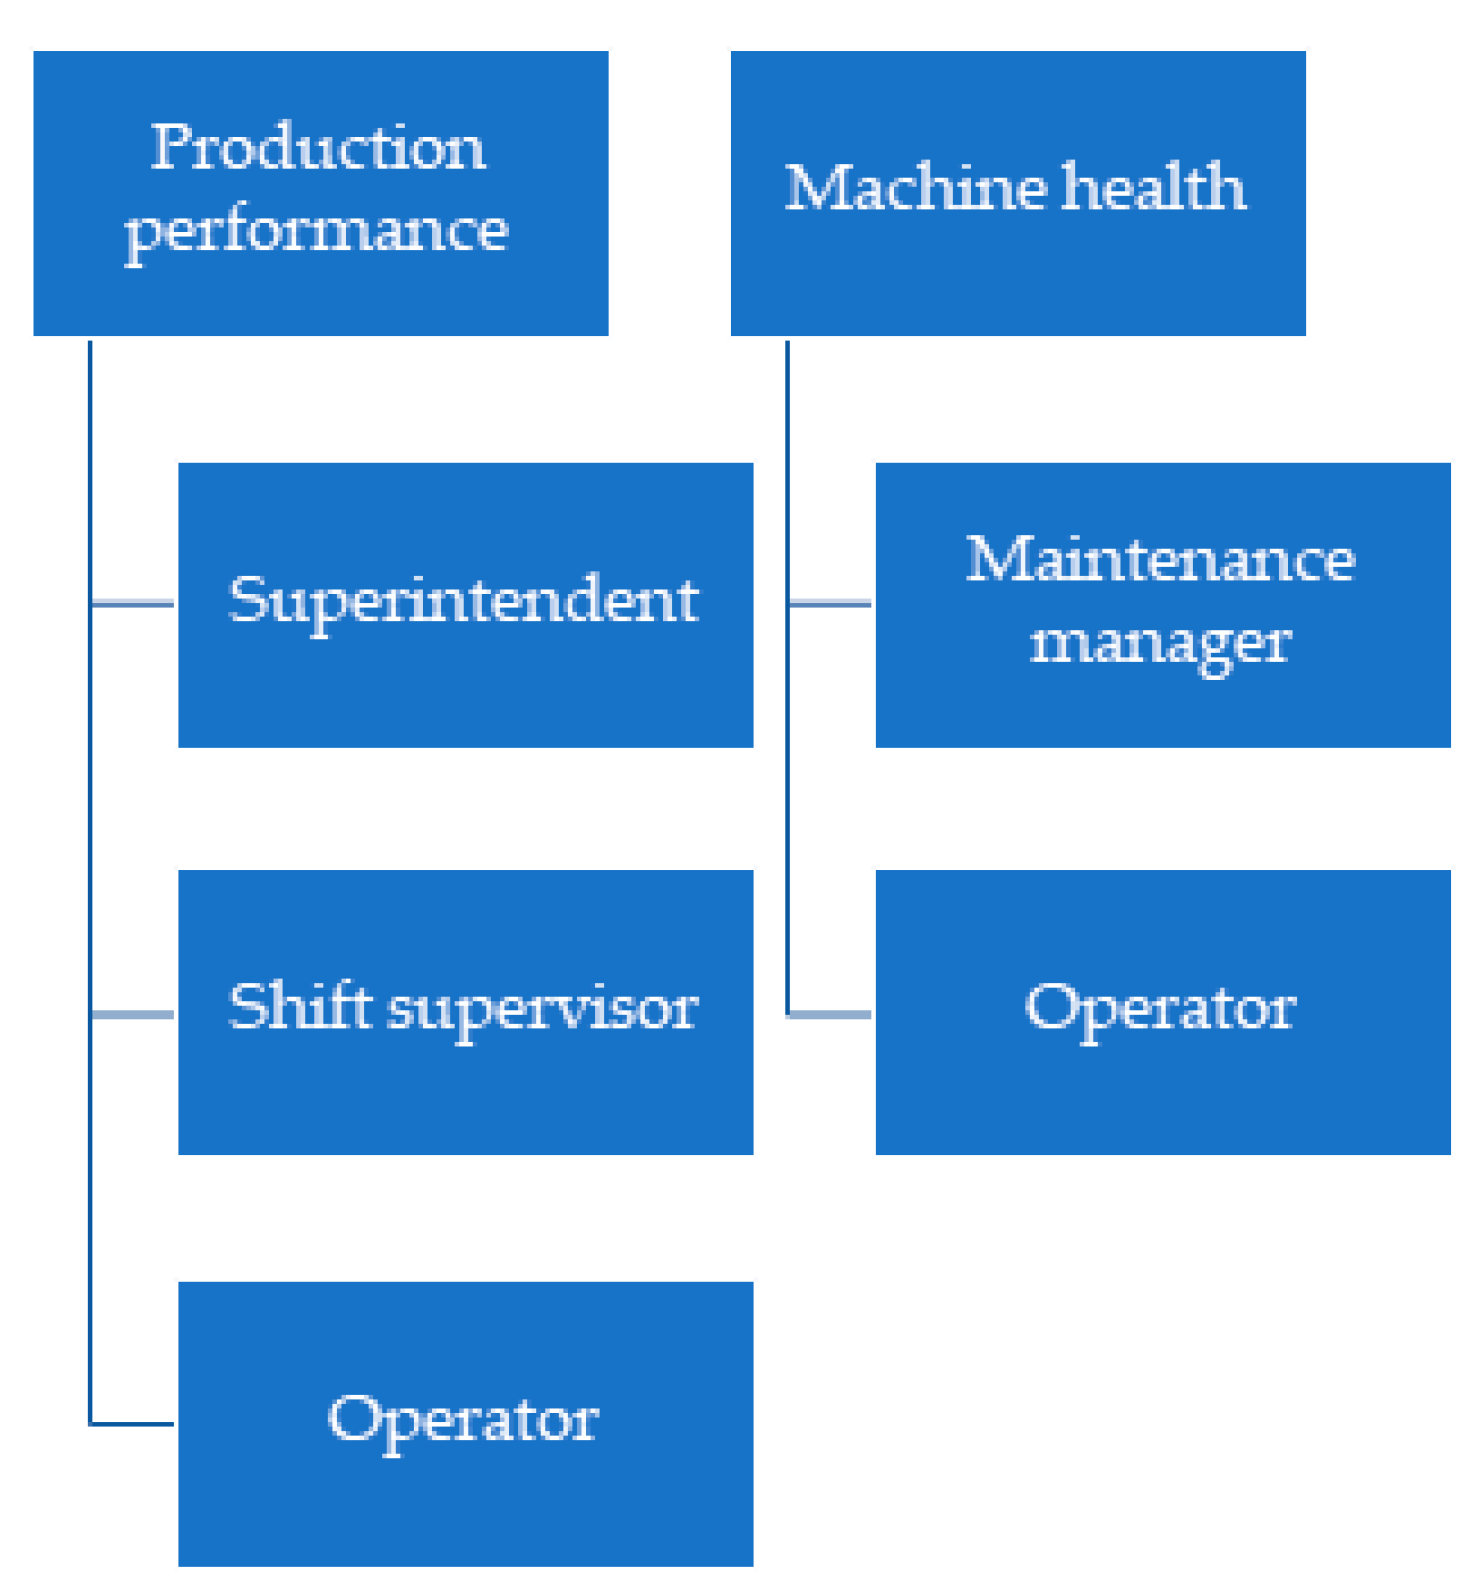
3.2. Classification and Definition of Mining KPIs for Process Monitoring

The results of the SLR presented in Section 3.1 reveal the variability of utilised KPIs based on the industry they have been defined for. A wide range of available indicators applied for many layers of operations in companies proves the significant potential of implementing KPI monitoring methods, as well as their versatility and the possibility to adapt these indicators to various industries, including mining. While there are several KPIs that overlap with similar industries (e.g., machine availability), the use of specific KPIs tailored to the mining industry is necessary to allow for the comprehensive monitoring of all the involved processes and parameters. This procedure is recommended, as the application of an excessive number of indicators to the process assessment may diminish the focus on the company’s main objectives and result in the lower efficiency of planned improvements [9].
Taking into account the findings above, to support decision-making processes in the mining industry effectively a classification of KPIs adapted to the specificity of the mining process and machinery is necessary. In the scope of this research, KPIs directly contributing to the economic viability of a mining operation are defined and classified. Special consideration is given to the underlying raw material production process and the maintenance works that enable interruption-free machine operation. The selection of indicators for process monitoring should also reflect the objectives of the company, which may require support in decision-making processes in different areas of operation. A particularly beneficial opportunity for mining companies to automate their processes and generate insights from machines is the use of indicators and measures based on real-time data obtained from the machines of the mining operation. The undertaken research was initiated by identifying the main components of performance in mines. From a process perspective, an essential viewpoint in determining KPIs for monitoring a mine’s production performance is the classification of indicators into groups related to the operational perspective, including the technical, temporal, and spatial dimensions of the machines involved in the process (Figure 4).
When considering the KPIs introduced in Figure 4, the technical KPIs are based on sensor measurements on individual machines. As those KPIs can be measured with a high frequency and level of detail, they are directly applicable for the technical monitoring of a machine’s performance. The categories of temporal and spatial KPIs, however, require analyses of machine activities and their surrounding environment, as well as additional information on the ways of working of a machine, increasing the complexity of value collection for these indicators. When looking at the use of a machine, it is relevant to consider at which step within the production process a machine is working and if it is interacting with other machines. Disregarding the required data transmission efforts, the computational effort is necessary to establish the activity and cycle classifications of individual and interacting machines.
It should be noted that, depending on the type of machine, several KPIs may be inapplicable or refer to different ways of working—e.g., while both wheel loaders and dump trucks perform cycles and can carry a payload, their cycles consist of different steps and serve different purposes in the production process. Most of the technical KPIs derived from sensors regarding the inner workings of a machine are independent of the production process and can be compared throughout a multitude of machines (Table 4). The presented technical KPIs are exemplary and can differ from machine to machine, depending on the type of sensor hardware installed on the machine.
Since most of the introduced KPIs in Table 4 only give specific insights on a single machine, they have to be collected on every machine individually. In order to provide KPIs that are representative of multiple machines and shifts or for the complete machine fleet of a mine, the data and KPIs of individual machines need to be aggregated. The most common type of aggregation is the averaging of values, as it allows for comparison with other time frames or machines. This type of aggregation is especially suitable for temporal KPIs, such as operating and idle time or cycle durations, as well as technical KPIs for other machines of the same type and/or model. When KPIs are aggregated, the level of detail decreases, while the considered time span or number of machines increases, allowing the use of KPIs for different use cases. Assigning KPIs to the groups introduced in Figure 4 allows for a segmentation based on the requirements of the different parties working with the data gathered. The different parties or persons are defined to be representative for most mining operations. In the scope of this work, the following persons have been identified and related to KPIs and monitoring requirements: superintendent, shift supervisor, operator, and maintenance manager. Depending on the size of an operation, the types of applicable persons can vary—e.g., multiple management levels can be required when a corporation runs several mine sites. Generally, the interests of these persons are the production performance of one or multiple machines, machine health, or both (Figure 5).
Similar to the hierarchical structure of the persons within a mining operation, their interests are on different levels of detail. Whereas a superintendent is interested in the production performance of the mine as a whole, a shift supervisor’s aim is to reach the production targets of his/her jurisdiction. At the same time, an operator is merely interested in his/her individual work performance. This hierarchical structure expresses an inverse relationship between the level of management and the level of detail. When considering the aspect of machine health, the interested persons are reduced to the maintenance manager, with a responsibility towards the superintendent and shift supervisor persons of ensuring machine health throughout the mining operation, and the operator, whose interest it is to have a well-working machine in order to fulfil his/her work. By segmenting the KPIs based on persons, the potential of process improvements increases, as suitable KPIs for the different types of work to be carried out allow for the application of mitigating measures at the appropriate levels of responsibility and detail. Therefore, a KPI aggregation concept, as previously introduced, can be applied to the areas of responsibility and the scope of tasks performed by a person.
In Table 5, we present our proposal of the most important KPIs concerning the introduced person groups. A discussion of the concept is presented in the next section.

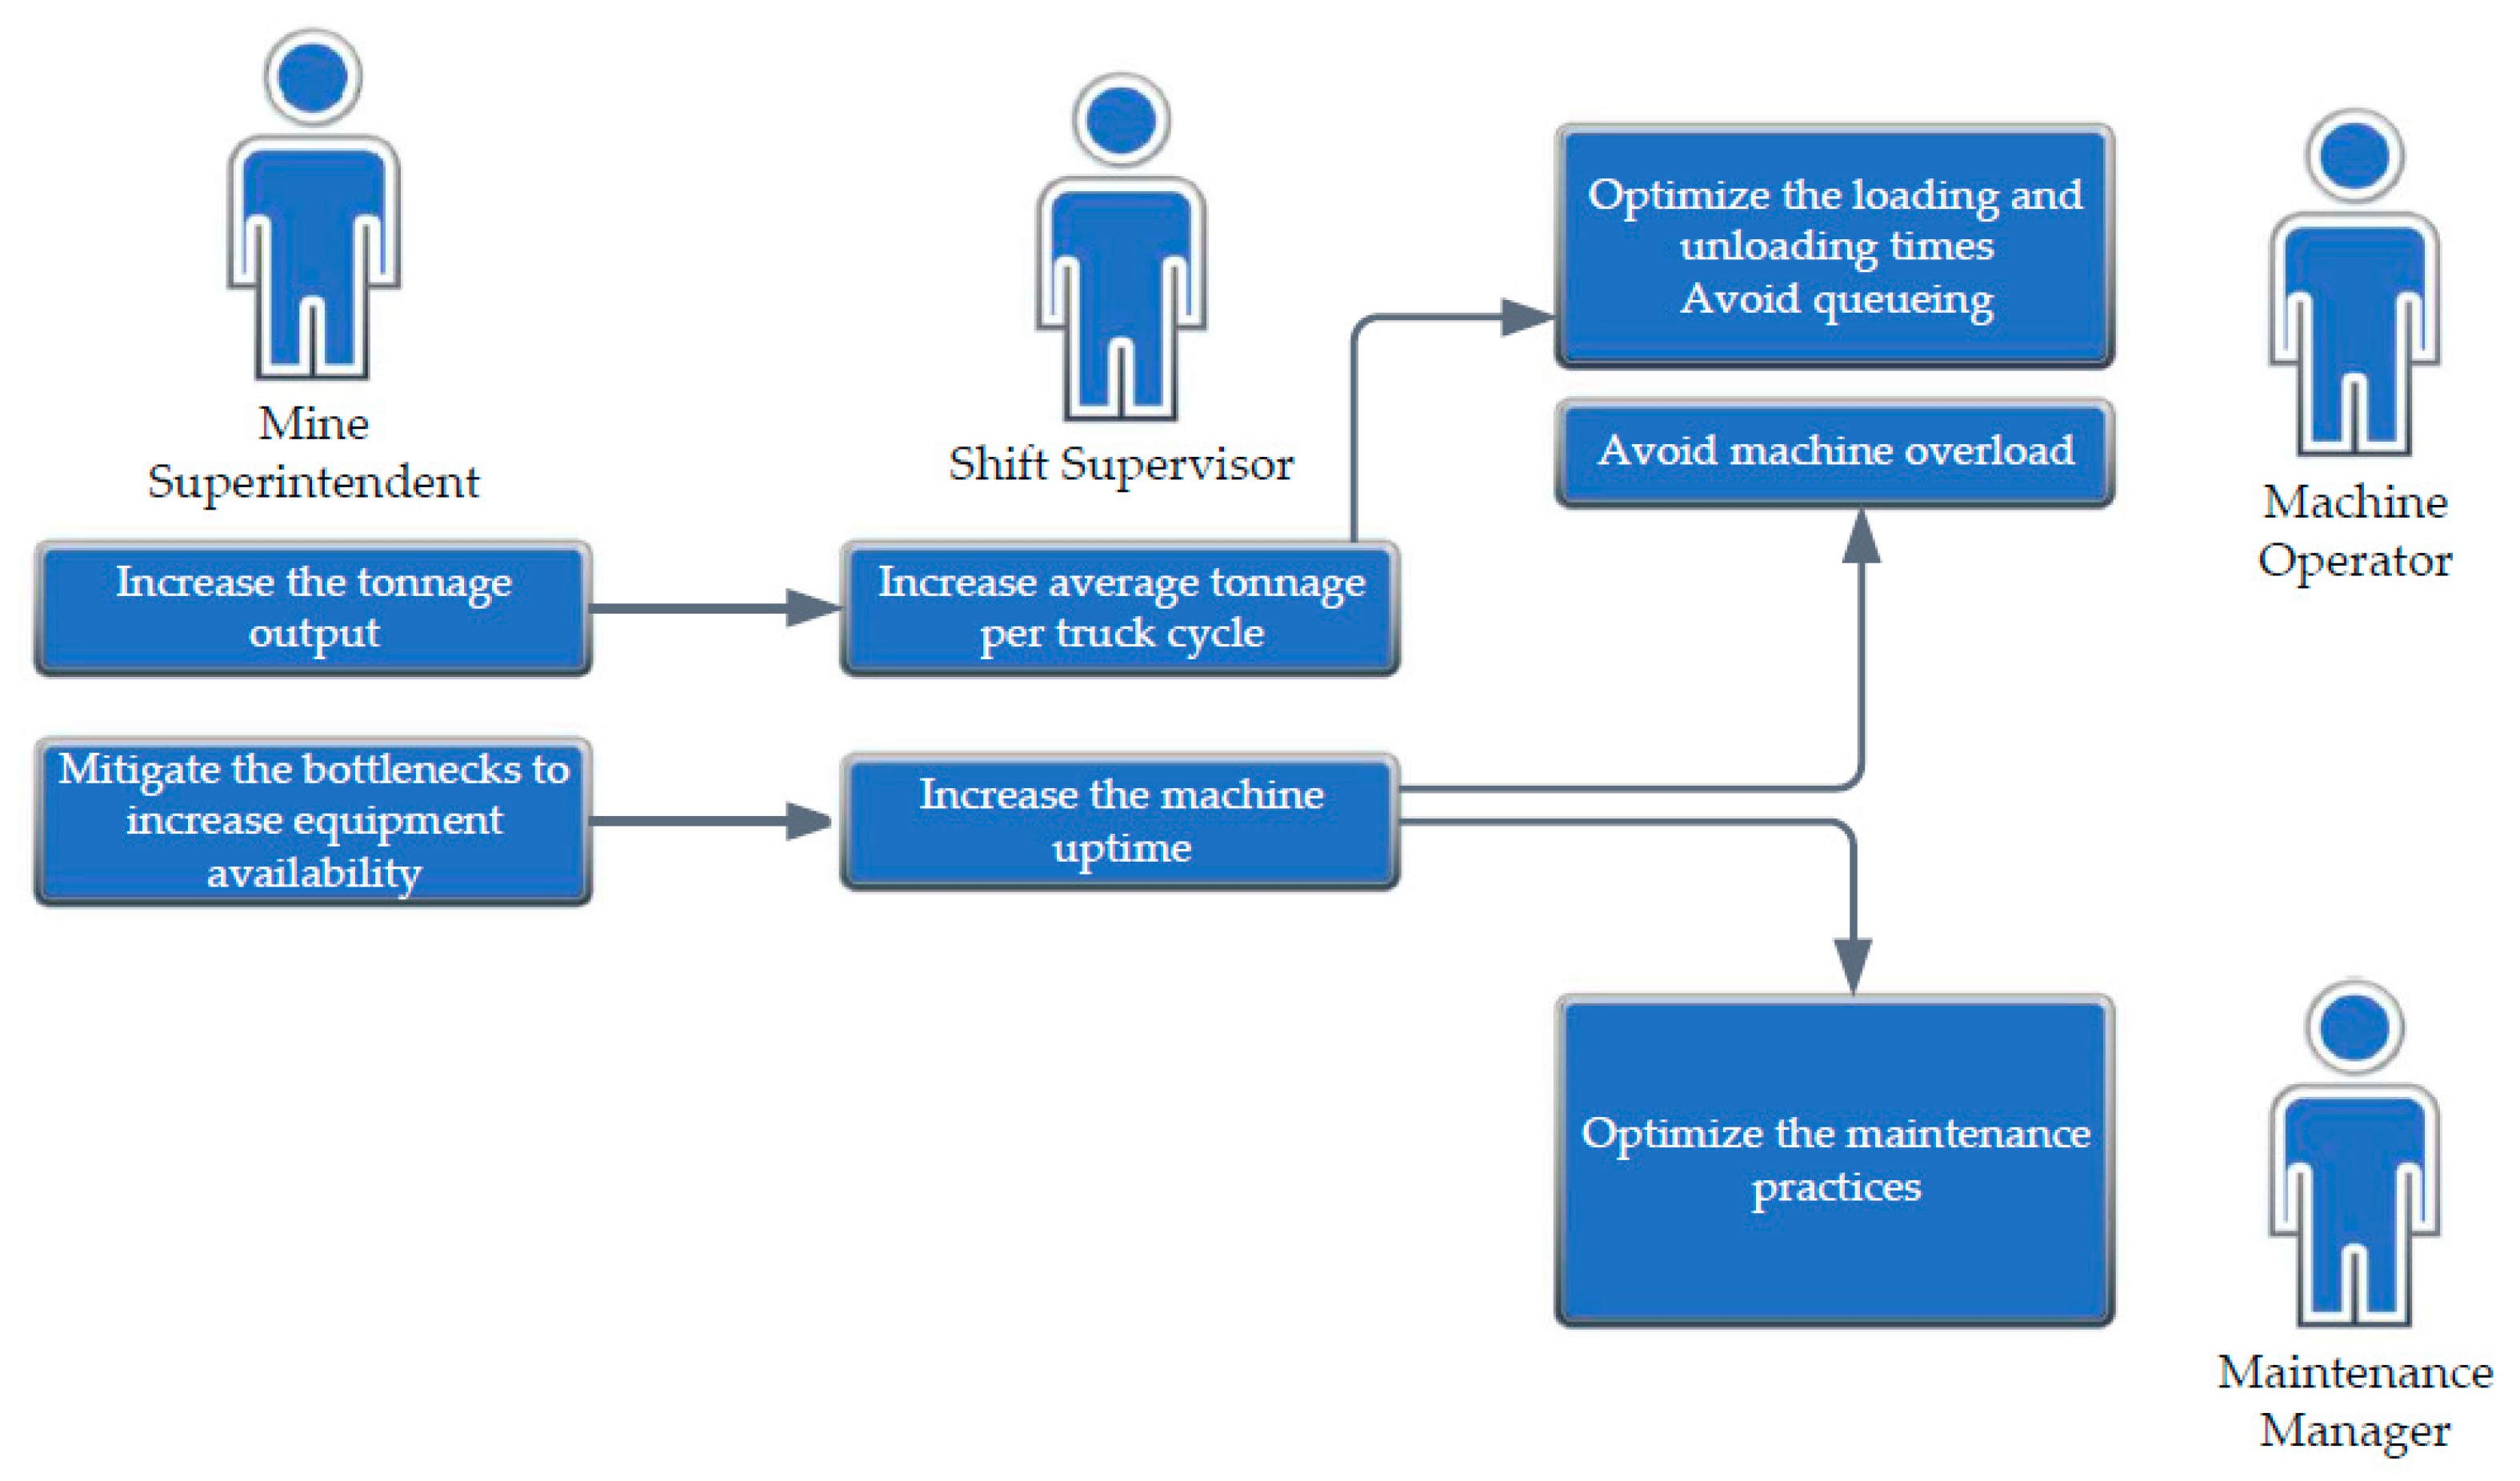
3.3. Discussion of the Presented Concept

The KPIs in Table 5 are mostly in the area of interest of multiple persons. In fact, the associated tasks regarding these KPIs vary significantly for the people involved. For instance, a machine operator recognises the trend of fuel/energy consumption, payload, temperature, engine load, and speed using IIoT solutions. Machine operators inform maintenance managers of any presence of abnormality of temperature, payload, or engine speed, and accordingly receive required directions for troubleshooting. The payload and fuel consumption data are tracked by machine operators, shift engineers, and the mine superintendent. Since the machine operators track the payload and fuel consumption data to evaluate individual performance, the shift engineers and mine superintendents analyse mostly the overall sum for specific time frames, such as shifts, days, weeks, months, or quarters.
The temporal KPIs in Table 5 constitute the combination of the design, operation, and maintenance parameters of a mine. The loading and dumping, queueing and spotting, and relocation durations of a dump truck are the components of its cycle. For a number of operating machines in the mine, the operational quality of the loading machine operator and dump truck operator; machine health; and length, inclination, and quality of the haul road are the deciding factors in these KPIs. Machine operators focus on optimising the durations associated with the cycle, while shift supervisors analyse the overall pit structure, interview the machine operators and maintenance managers regarding the temporal KPIs, and identify the potential bottlenecks in the operation to report all the factors decreasing the efficiency and increasing the cycle durations to the mine superintendents. Mine superintendents analyse all these inputs and take action regarding the mine design and operational workflows based on the temporal KPIs.
The spatial KPIs in Table 5 constitute the mine design factors discussed for spatial KPIs, excluding the KPI “geolocation” of a machine. These KPIs are the responsibility of the mine superintendents and shift supervisors, and directly correlate to the efficiency of the mine design approved by the mine superintendents and the execution quality of these plans. The geolocation of the machine is required for ensuring safety measures—for instance, to identify any machine activity or motion in forbidden areas during a blasting event.
Occupational health and safety (OHS) measures are over-hierarchical measures where compliance to the safety measures is an obligation for each person in the mining environment. The persons share the same aim to reduce the incident rate, Lost Time Injuries (LTI), and Lost Time Injury Frequency Rate (LTIFR). Refresher training is arranged by mine superintendents regularly or depending on an unexpected incident, and each mining person’s participation is mandatory. Mine superintendents collect the reports of incidents or accidents occurring in the operation from the shift supervisor to improve OHS practices and update the guidelines to avoid them in the future. Except for the financial safety indicators, the organisation involves people actively to provide further input for all safety indicators. The worker compensation costs must be tracked by the mine superintendents and included in the financial plans of the mine.
Machine failures and downtime are significant factors impacting the efficiency of a mine operation. Since they have a direct influence on the overall machine availability, the maintenance indicators in Table 5 are tracked by all the people covered in this study. Machine operators record the number of failures to track their performance and evaluate their operational excellence in order to not cause any further faults or failures. The frequency of failures and the duration of the repair works induces financial and temporal stress on the mine, as well as procurement planning and spare part stock management. Therefore, maintenance managers must report the mean time between failures, the distribution of failure types, the man-hours needed for the maintenance practices, and the other KPIs covered in Table 5. These reports must be evaluated by shift supervisors, mine superintendents, and maintenance managers to identify the cause of a machine failure. These causes can be classified as follows: poor pit conditions, low operational quality, inefficient mine design, not-fit-for-purpose machine fleet. For instance, a bumpy haul road might lead to damaged tires on a dump-truck, which then leads to suspension failure or a flat tire, where the shift supervisor is the person responsible to ensure the haul road quality of the mine. On the other hand, poor maintenance practices can cause long maintenance man-hours (MMH), mean time to restore/repair (MTTR), and mean downtime (MDT), as well as decreased mean time between failures (MTBF) and mean time between shutdowns (MTBS).
In this research, we also want to introduce the concept of a chain of causality to detail the interdependencies of different persons, their works, and their KPIs of interest within a hierarchically structured operation such as a mine (Figure 6).
The chain of causality links the tasks of various people, allowing for the analysis of the KPI’s contextual integrity along with the hierarchical levels. For example, the effective basic indicator monitoring of parameters such as hydraulic pressures or cooling water temperatures represented in Table 4 of the basic machine indicators and overall mine efficiency can be correlated using a chain of causality. A failure of a hydraulic system or exceeding safe cooling water temperatures might result in irreversible equipment failure and a decrease in uptime. As a result, the overall availability decreases and, ultimately, so does the overall efficiency. Similarly, the wrong selected gear during uphill drives of a dump truck can lead to excessive fuel consumption and the rapid wear of the equipment. This leads to eventual machine failure, reducing uptime, as well as elevated fuel consumption and time costs regarding fuel procurement. Therefore, it is recommended to group KPIs based on person groups, as well as to link them in a chain of causality to understand the process schemes and potential bottlenecks or inefficiencies of a mining operation.
The strategies developed and decisions taken by mine superintendents to improve overall efficiency are distributed to the workflow, and the other persons working in the lower hierarchical levels align themselves to the new work order in a chain of causality. As discussed above, not all the KPIs are of interest for all persons. Each person evaluates their performance and aims to achieve sufficient values for the corresponding KPIs within their field of responsibility. For example, the commitment of mine superintendents to increase the overall availability is strongly dependent on the uptime of the fleet. The monitoring and reporting of the uptime are the responsibilities of the shift supervisor. Shift supervisors try to identify factors leading to a reduction in the uptime, where the machine condition and maintenance practices are the determining factors of uptime. The commitment of a mine superintendent to increase the machine availability results in decisions which target maintenance practices. They can be exemplified by the improvement or optimisation of spare part procurement based on the feedback of the maintenance manager or the improvement of operational quality of a machine driver based on the engine load KPI. This corresponds to an increased level of detail among the downstream movement of hierarchy and different KPIs to be tracked in the chain of causality (Figure 6). As another example, commitment to increasing performance might result in strict tracking of truck cycle times of the machine operators, whereas the machine operator might aim to optimise the loading and unloading times by increasing the communication with the operator of a loading machine to reduce the queueing times or the positioning nearby of the loading machine. Furthermore, the overall efficiency of a mine can be tracked down to the KPIs of technical, temporal, and spatial dimensions, as shown in Figure 4, in the chain of causality. At the highest level of detail, the basic indicators of machinery are analysed to understand their impact on the dimensions.
By establishing a chain of causality, hierarchical dependencies and KPIs of interest can be analysed from different perspectives to provide additional insights into mining operations. This concept combines the need for KPIs tailored to the application in mining as well as the possibility to represent varying levels of detail by aggregation. Formerly difficult data acquisition on the most detailed level, as in individual machines, is becoming significantly more accessible with the use of IIoT in the mining industry. This makes it possible to base management-level KPIs on aggregated information of the underlying levels within the chain of causality. From the perspective of operational and economic performance, this concept enables different persons to draw customised insights from the same underlying data sources to address problems at the appropriate level and scope. Therefore, an aligned operational optimisation among the whole operation can be achieved by utilising state-of-the-art IIoT data logging solutions and the analysis of real-time data. The application of a chain of causality in a bottom-up approach allows us to transform high-detail, continuously collected data into KPIs with an adjustable level of detail while providing transparency for the processes involved.

4. Conclusions

The progressive development of information technology, the requirements of Industry 4.0, and the pursuit of sustainable development raise new challenges for companies currently operating on the market. One of the possibilities of addressing the emerging requirements is an in-depth understanding of the processes conducted in a company, which is enabled by the use of appropriately selected KPIs, adopted for the specific needs of a given industry. Identifying KPIs as measures and metrics tailored to the specificity of the mining industry to monitor processes and make decisions based on reliable data collection is the basis for the sustainable development of the entire company. The analysis of industry reports showed that mining companies assign considerable importance to the aspect of sustainable development, taking into account both operational issues and environmental aspects in their activities, with the intent to improve the overall sustainability of the system.
Our article aimed at filling an identified lack of a unified and comprehensive KPI list in the area of mining process monitoring for essential process perspectives such as machinery, work environment, and the human factor. In view of achieving this result, the main research questions for the SLR were formulated, and several dimensions where KPIs can be applied were defined.
The literature review investigated two research questions—what are the main areas of the application of KPIs in an organisation, and what are the most commonly used KPIs for data-based process optimisation in the mining industry. The result of the literature research was a substantial number of publications covering the subject matter of the KPIs, on the basis of which specific indicators for application in mining process management have been identified. However, we could not find comprehensive classification covering all the mentioned process perspectives, also taking into consideration the opportunities raised by the use of sensor data.
Our paper proposes an original classification of KPIs, covering the main vital issues in process monitoring, such as operational issues (divided into technical, temporal, and spatial indicators), safety, and maintenance. In addition, we also pointed out the main interest groups using the indicators in the decision-making processes. We defined the following persons, superintendent, shift supervisor, operator, and maintenance manager, and assigned them KPIs from the identified groups. In this study, we have also demonstrated the interdependencies between persons by using a chain of causality. Furthermore, we have clarified the point of view of persons on KPIs based on their area of responsibility.
When looking at the available data sources for KPIs, it becomes apparent that summarising and abstracting is required to meet the expected levels of detail for the different people. During the third industrial epoch, the acquisition and evaluation of operational data took place in a high level of aggregation based on observation and paper reports, leading to a loss of detailed operational information and relevant optimisation possibilities. The application of IIoT in mining operations reveals the influences of decisions by the mine management on the other levels of hierarchy in an organisation, as well as indicating the multiple dimensions of solving a specific problem depending on the perspective of the person being tasked with this problem.
As part of further research, we have developed a questionnaire for the evaluation of the most critical performance indicators that can be used in the mining industry. The study was prepared involving mixed methods of research to collect both qualitative and quantitative data [70] and will be distributed among mining practitioners. The survey is part of a research work carried out in the SmartHUB project, and its results will be used to select the most important indicators to be included in the SmartHUB IIoT platform for process monitoring. The study was constructed with the assumption that practitioners and people directly related to the mining industry are the best sources of information for complementing and confirming the results of the literature research on the determination of KPIs for the monitoring of mining processes. Moreover, a valuable aspect of further work will be the analysis and evaluation of the effectiveness of applying the proposed indicators in the area of process monitoring based on data from the released smartHUB platform.

Author Contributions

Conceptualisation, E.B. and P.G.; methodology, P.G., M.P.-S.; validation, P.G., M.P.-S., C.K. and T.Ö.; formal analysis, P.G., M.P.-S.; investigation, P.G., M.P-S., C.K., T.Ö.; resources, P.G., M.P.-S.; data curation, P.G., M.P.-S., writing—original draft preparation, E.B., P.G., M.P.-S., C.K., T.Ö.; writing—review and editing, E.B., P.G.; supervision, E.B. All authors have read and agreed to the published version of the manuscript.

Funding

This research was funded by EIT Raw Materials, grant number 18327, project SmartHUB—smart courier field data IIoT radio network and big data analytics.

Conflicts of Interest

The authors declare no conflict of interest.

References

  1. Zhou, C.; Damiano, N.; Whisner, B.; Reyes, M. Industrial Internet of Things (IIoT) applications in underground coal mines. Min. Eng. 2017, 69, 50–56. [Google Scholar] [CrossRef] [PubMed] [Green Version]
  2. Lin, B.; Wu, W.; Song, M. Industry 4.0: Driving factors and impacts on firm’s performance: An empirical study on China’s manufacturing industry. Ann. Oper. Res. 2019. [Google Scholar] [CrossRef]
  3. Xu, L.D.; Xu, E.L.; Li, L. Industry 4.0: State of the art and future trends. Int. J. Prod. Res. 2018, 56, 2941–2962. [Google Scholar] [CrossRef] [Green Version]
  4. Lu, Y. Industry 4.0: A survey on technologies, applications and open research issues. J. Ind. Inf. Integr. 2017, 6, 1–10. [Google Scholar] [CrossRef]
  5. Pereira, A.C.; Romero, F. A review of the meanings and the implications of the Industry 4.0 concept. Proc. Manuf. 2017, 13, 1206–1214. [Google Scholar] [CrossRef]
  6. Alcácer, V.; Cruz-Machado, V. Scanning the Industry 4.0: A Literature Review on Technologies for Manufacturing Systems. Eng. Sci. Technol. Int. J. 2019, 22, 899–919. [Google Scholar] [CrossRef]
  7. Bertayeva, K.; Panaedova, G.; Natocheeva, N.; Kulagovskaya, T.; Belyanchikova, T. Industry 4.0 in the mining industry: Global trends and innovative development. E3S Web Conf. 2019, 135. [Google Scholar] [CrossRef]
  8. Lööw, J.; Abrahamsson, L.; Johansson, J. Mining 4.0—The Impact of New Technology from a Work Place Perspective. Min. Metall. Explor. 2019, 36, 701–707. [Google Scholar] [CrossRef] [Green Version]
  9. Badawy, M.; El-Aziz, A.A.A.; Idress, A.M.; Hefny, H.; Hossam, S. A survey on exploring key performance indicators. Future Comput. Inf. J. 2016, 1, 47–52. [Google Scholar] [CrossRef]
  10. Ralston, J.; Reid, D.; Hargrave, C.; Hainsworth, D. Sensing for advancing mining automation capability: A review of underground automation technology development. Int. J. Min. Sci. Technol. 2014, 24, 305–310. [Google Scholar] [CrossRef]
  11. Sganzerla, C.; Seixas, C.; Conti, A. Disruptive Innovation in Digital Mining. Proc. Eng. 2016, 138, 64–71. [Google Scholar] [CrossRef] [Green Version]
  12. Singh, A.; Kumar, D.; Hötzel, J. IoT Based information and communication system for enhancing underground mines safety and productivity: Genesis, taxonomy and open issues. Ad. Hoc. Netw. 2018, 78, 115–129. [Google Scholar] [CrossRef]
  13. Gautham, B.P.; Reddy, S.; Runkana, V. Future of Mining, Mineral Processing and Metal Extraction Industry. Trans. Indian Inst. Met. 2019, 72, 2159–2177. [Google Scholar] [CrossRef]
  14. Skrzypkowski, K. The influence of room and pillar method geometry on the deposit utilization rate and rock bolt load. Energies 2019, 12, 4770. [Google Scholar] [CrossRef] [Green Version]
  15. Torkko, M.; Katajavuori, N.; Linna, A.; Juppo, A.M. The utilisation of quality KPIs in the pharmaceutical industry. J. Pharm. Innov. 2014, 9, 175–182. [Google Scholar] [CrossRef]
  16. Lu, D.; Asian, S.; Ertek, G.; Sevinc, M. Mind the perception gap An integrative performance management framework for service supply chains. Int. J. Phys. Distrib. Logist. Manag. 2019, 49, 33–51. [Google Scholar] [CrossRef]
  17. Torbacki, W.; Kijewska, K. Identifying Key Performance Indicators to be used in Logistics 4.0 and Industry 4.0 for the needs of sustainable municipal logistics by means of the DEMATEL method. In Proceedings of the 3rd International Conference Green Cities—Green Logistics For Greener Cities, Szczecin, Poland, 13–14 September 2018; Iwan, S., Thompson, R.G., Kijewska, K., Eds.; Elsevier Science Bv.: Amsterdam, The Netherlands, 2019; Volume 39, pp. 534–543. [Google Scholar]
  18. Hedvičáková, M.; Král, M. Benefits of KPIS For Industry Sector Evaluation: The Case Study From The Czech Republic. E+M Ekon. Manag. 2019, 22, 97–113. [Google Scholar] [CrossRef]
  19. Zámečník, R. The Qualitative Indicators in Human Resource Accounting. Mark. Manag. Innov. 2016, 4, 325–341. [Google Scholar]
  20. Gabčanová, I. Human Resources Key Performance Indicators. J. Compet. 2012, 4, 117–128. [Google Scholar] [CrossRef] [Green Version]
  21. Voronov, A.; Voronov, Y.; Voronov, A.; Demirel, N. Operation Quality Indicators for Shovel-Truck Systems at Open-Pit Coal Mines. In Proceedings of the IV International Innovative Mining Symposium, Kemerovo, Russia, 14–16 October 2019; EDP Sciences: Les Ulis, France, 2019; Volume 105. [Google Scholar]
  22. Bhadani, K.; Asbjornsson, G.; Hulthen, E.; Evertsson, M. Development and implementation of key performance indicators for aggregate production using dynamic simulation. Miner. Eng. 2020, 145. [Google Scholar] [CrossRef]
  23. Voronov, Y.; Voronov, A.; Voronov, A. Quality Criterion of the Loading and Transport System Operation at Open-Pit Mines. In Proceedings of the IV International Innovative Mining Symposium, Kemerovo, Russia, 14–16 October 2019; EDP Sciences: Les Ulis, France, 2019; Volume 105. [Google Scholar]
  24. Fisseler, D.; Kemény, Z.; Reiners, R. Monitoring and Control Framework for Business Processes in Ubiquitous Environments. In Proceedings of the 2016 Intl IEEE Conferences on Ubiquitous Intelligence Computing, Advanced and Trusted Computing, Scalable Computing and Communications, Cloud and Big Data Computing, Internet of People, and Smart World Congress (UIC/ATC/ScalCom/CBDCom/IoP/SmartWorld), Toulouse, France, 18–21 July 2016; pp. 863–868. [Google Scholar]
  25. Mardonova, M.; Choi, Y. Review of Wearable Device Technology and Its Applications to the Mining Industry. Energies 2018, 11, 547. [Google Scholar] [CrossRef] [Green Version]
  26. Skrzypkowski, K.; Korzeniowski, W.; Zagórski, K.; Zagórska, A. Adjustment of the yielding system of mechanical rock bolts for room and pillar mining method in stratified rock mass. Energies 2020, 13, 2082. [Google Scholar] [CrossRef] [Green Version]
  27. Aksu, U.; Schunselaar, D.M.M.; Reijers, H.A. Automated Prediction of Relevant Key Performance Indicators for Organisations. In Business Information Systems, PTI; Abramowicz, W., Corchuelo, R., Eds.; Springer-Verlag: Berlin/Heidelberger, Germany, 2019; Volume 353, pp. 283–299. [Google Scholar]
  28. Sathananthan, S. Data valuation considering knowledge transformation, process models and data models. In Proceedings of the 2018 12th International Conference on Research Challenges In Information Science (RCIS), New York, NY, USA, 29–31 May 2018. [Google Scholar]
  29. Kaganski, S.; Majak, J.; Karjust, K.; Toompalu, S. Implementation of Key Performance Indicators Selection Model as Part of the Enterprise Analysis Model. In Proceedings of the Manufacturing Systems 4.0, The 50th CIRP Conference on Manufacturing Systems, Taichung City, Taiwan, 3–5 May 2017; Tseng, M.M., Tsai, H.Y., Wang, Y., Eds.; Elsevier Science Bv.: Amsterdam, The Netherlands, 2017; Volume 63, pp. 283–288. [Google Scholar]
  30. Grozdanovic, M.; Savic, S.; Marjanovic, D. Assessment of the key factors for ergonomic design of management information systems in coal mines. Int. J. Min. Reclam. Environ. 2015, 29, 96–111. [Google Scholar] [CrossRef]
  31. Alkan, B.; Bullock, S. Assessing operational complexity of manufacturing systems based on algorithmic complexity of key performance indicator time-series. J. Oper. Res. Soc. 2020, 1–15. [Google Scholar] [CrossRef]
  32. Aditya, P.; Kumar, U.; Galar, D.; Stenström, C. Performance measurement and management for maintenance: A literature review. J. Qual. Maint. Eng. 2015, 21, 2–33. [Google Scholar]
  33. Visser, W.F. A Blueprint for Performance-Driven Operations Management. Min. Metall. Explor. 2020, 37, 823–831. [Google Scholar] [CrossRef]
  34. Bouffard, S.C. Benefits realised and lessons learned from modeling the production capacity of the Jansen Potash Project. Miner. Process. Extr. Metall. Rev. 2020, 41, 50–58. [Google Scholar] [CrossRef]
  35. Navarra, A.; Alvarez, M.; Rojas, K.; Menzies, A.; Pax, R.; Waters, K. Concentrator operational modes in response to geological variation. Miner. Eng. 2019, 134, 356–364. [Google Scholar] [CrossRef]
  36. Otto, T.J.; Musingwini, C. A spatial mine-to-plan compliance approach to improve alignment of short- and long-term mine planning at open pit mines. J. South. Afr. Inst. Min. Metall. 2019, 119, 253–259. [Google Scholar] [CrossRef] [Green Version]
  37. Jena, M.C.; Mishra, S.K.; Moharana, H.S. Application of Industry 4.0 to enhance sustainable manufacturing. Environ. Prog. Sust. Energy 2020, 39, 1–11. [Google Scholar] [CrossRef]
  38. Viveros Gunckel, P.; Kristjanpoller, F.; López-Campos, M.; Crespo Márquez, A.; Pascual, R. Graphical analysis for overall effectiveness management: A graphical method to support operation and maintenance performance assessment. Qual. Reliab. Eng. Int. 2018, 34, 1615–1632. [Google Scholar] [CrossRef]
  39. Pasch, O.; Uludag, S. Optimization of the load-and-haul operation at an opencast colliery. J. South. Afr. Inst. Min. Metall. 2018, 118, 449–456. [Google Scholar] [CrossRef]
  40. Olkiewicz, M.; Wolniak, R.; Ostapko, B. The Analysis of Dependencies Between Extraction And Resource Consumption in 2008–2014 on the Example of Glisno Gravel Pit. Arch. Min. Sci. 2018, 63, 801–812. [Google Scholar] [CrossRef]
  41. Li, C.; Runge, K.; Shi, F.; Farrokhpay, S. Effect of froth rheology on froth and flotation performance. Miner. Eng. 2018, 115, 4–12. [Google Scholar] [CrossRef]
  42. Bezminabadi, S.N.; Ramezanzadeh, A.; Jalali, S.-M.E.; Tokhmechi, B.; Roustaei, A. Effect of Rock Properties on Rop Modeling Using Statistical and Intelligent Methods: A Case Study of an Oil Well in Southwest of Iran. Arch. Min. Sci. 2017, 62, 131–144. [Google Scholar] [CrossRef] [Green Version]
  43. Sebutsoe, T.C.; Musingwini, C. Characterising a mining production system for decision-making purposes in a platinum mine. J. South. Afr. Inst. Min. Metall. 2017, 117, 199–206. [Google Scholar] [CrossRef] [Green Version]
  44. Bester, M.; Russell, T.; van Heerden, J.; Carey, R. Reconciliation of the mining value chain—Mine to design as a critical enabler for optimal and safe extraction of the mineral reserve. J. South. Afr. Inst. Min. Metall. 2016, 116, 407–411. [Google Scholar] [CrossRef]
  45. Fourie, H. Improvement in the overall efficiency of mining equipment: A case study. J. South. Afr. Inst. Min. Metall. 2016, 116, 275–281. [Google Scholar] [CrossRef]
  46. Petit, P.J. Business optimisation for platinum mining projects and operations. J. South. Afr. Inst. Min. Metall. 2016, 116, 123–130. [Google Scholar] [CrossRef] [Green Version]
  47. Zaruba Natalyi, A.; Egorova Natalyi, N. Lean Governance as a Condition for the Creation of Intellectual Coal Industry. In Proceedings of the 8th Russian-Chinese Symposium Coal In The 21st Century: Mining, Processing, Safety, Kemerovo, Russia, 10–12 October 2016; Tailakov, O.V., Ed.; Atlantis Press: Paris, France, 2016; Volume 92, pp. 39–44. [Google Scholar]
  48. Nikulin, C.; Ulloa, A.; Carmona, C.; Creixell, W. A Computer-Aided Application For Modeling And Monitoring Operational And Maintenance Information In Mining Trucks. Arch. Min. Sci. 2016, 61, 695–708. [Google Scholar] [CrossRef] [Green Version]
  49. Prakash, A.; Murthy, V.M.S.R.; Singh, K.B. A new rock cuttability index for predicting key performance indicators of surface miners. Int. J. Rock Mech. Min. Sci. 2015, 77, 339–347. [Google Scholar] [CrossRef]
  50. Segopolo, P.R. Optimization of shuttle car utilisation at an underground coal mine. J. South. Afr. Inst. Min. Metall. 2015, 115, 285–296. [Google Scholar] [CrossRef]
  51. Czaplicka-Kolarz, K.; Burchart-Korol, D.; Turek, M.; Borkowski, W. Model of Eco-Efficiency Assessment of Mining Production Processes. Arch. Min. Sci. 2015, 60, 477–486. [Google Scholar] [CrossRef]
  52. Dauber, C.; Bendrat, N. Key performance indicators—A tool to assess ICT applications in underground coal mines. J. South. Afr. Inst. Min. Metall. 2014, 114, 1017–1022. [Google Scholar]
  53. Schoevaerts, B.; Balg, C.; Brown, S.; Van Zyl, C. Fast, safe, and fully mechanised installation of high-tensile chain-link mesh for underground support. J. South. Afr. Inst. Min. Metall. 2012, 112, 127–133. [Google Scholar]
  54. Tan, P. Modeling and control of copper loss in smelting slag. JOM 2011, 63, 51–57. [Google Scholar] [CrossRef]
  55. Mkhwanazi, D. Optimizing LHD utilisation. J. South. Afr. Inst. Min. Metall. 2011, 111, 273–280. [Google Scholar]
  56. Marais, C.; Aldrich, C. The estimation of platinum flotation grade from froth image features by using artificial neural networks. J. South. Afr. Inst. Min. Metall. 2011, 111, 81–85. [Google Scholar]
  57. BHP Sustainability Report. 2019. Available online: https://www.bhp.com/-/media/documents/investors/annual-reports/2019/bhpsustainabilityreport2019.pdf (accessed on 26 June 2020).
  58. Rio Tinto. Sustainability Reporting. Available online: https://www.riotinto.com/sustainability/sustainability-reporting (accessed on 25 June 2020).
  59. Glencore. Sustainability Reporting Highlights 2019. Available online: https://www.glencore.com/dam:jcr/c7f6c5fc-b275-4e12-9448-de5302805781/2019-Glencore-Sustainability-Highlights--.pdf (accessed on 22 June 2020).
  60. Vale. Sustainability Report 2019. Available online: http://www.vale.com/EN/investors/information-market/annual-reports/sustainability-reports/Sustainability%20Reports/Relatorio_sustentabilidade_vale_2019_alta_en.pdf (accessed on 29 June 2020).
  61. Anglo American. Sustainability Report. 2019. Available online: https://www.angloamerican.com/~/media/Files/A/Anglo-American-Group/PLC/investors/annual-reporting/2020/aa-sustainability-report-2019-v1.pdf (accessed on 23 June 2020).
  62. Fortescue Metal Group Ltd. Annual Report FY19. Available online: https://www.fmgl.com.au/docs/default-source/annual-reporting-suite/fy19-annual-report.pdf (accessed on 29 June 2020).
  63. Fresnillo PLC Annual Report and Accounts. Available online: http://www.fresnilloplc.com/media/451923/fres-33085-annual-report-2019-web.pdf (accessed on 23 June 2020).
  64. Newmont. Sustainability Report Performance Data. 2019. Available online: https://s24.q4cdn.com/382246808/files/doc_downloads/2019/sustainability/Newmont-2019-sustainability-report-ESG-tables.pdf (accessed on 26 June 2020).
  65. Boliden Annual and Sustainability Report 2019. A Sustainable Future with Metals. 2019. Available online: https://vp217.alertir.com/afw/files/press/boliden/202003107199-1.pdf (accessed on 22 June 2020).
  66. First Quantum Minerals Environment, Safety and Social Data Report. 2019. Available online: https://s24.q4cdn.com/821689673/files/doc_downloads/environmental-health-and-safety/2019-Environment-Safety-Social-Data-Report-FINAL.pdf (accessed on 29 June 2020).
  67. Lumley, G.; McKee, M. Mining for Efficiency; PricewaterhouseCoopers: London, UK, 2014. [Google Scholar]
  68. Dougall, A.W.; Mmola, T.M. Identification of key performance areas in the southern African surface mining delivery environment. J. South. Afr. Inst. Min. Metall. 2015, 115, 1001–1006. [Google Scholar] [CrossRef]
  69. Korski, J.; Tobór-Osadnik, K.; Wyganowska, M. Mining machines effectiveness and OEE Indicator. IOP Conf. Ser. Mater. Sci. Eng. 2017, 268. [Google Scholar] [CrossRef]
  70. Johnson, R.B.; Onwuegbuzie, A.J. Toward a Definition of Mixed Methods Research. J. Mix. Methods Res. 2007, 1, 112–133. [Google Scholar] [CrossRef]
Figure 1. Background of Key Performance Indicators definition regarding the process perspectives (own development).
Energies 13 05169 g001
Figure 2. Selection of papers for Systematic Literature Review.
Energies 13 05169 g002
Figure 3. Number of papers from selected databases by year (WOL—Wiley Online Library; WoS—Web of Science).
Energies 13 05169 g003
Figure 4. Mining KPIs from technical, temporal, and spatial dimensions.
Energies 13 05169 g004
Figure 5. Interests of persons in a mining operation.
Energies 13 05169 g005
Figure 6. Exemplary chain of causality representing availability and performance optimisation in a mining organisation.
Energies 13 05169 g006
Table 1. Types of indicators in the selected publications.
Author (s)YearField of ApplicationExamples of KPIs
Provided by Article
KPI Types Used
[33]2020Mining and mineral processingYesIndicators related to a mine’s organisation.
[34]2020PotashYesDegree of blockage or degree of starvation.
[22]2020Rock raw materialsYesMeasurement of performance in an aggregate production process—simulation in real time.
[35]2019GeometallurgyNox
[36]2019Iron oreYesMining process planning—NPV (net present value) and LOM (life of mine).
[21]2019CoalYesQuality indicator set.
[23]2019MineralsYesIndicators related to loading and transport systems.
[37]2019Cement plantYesEnergy consumption, carbon footprint, specific water consumption, effectiveness.
[38]2018Mining industryYesEffectiveness, maintenance, and operations management indicators.
[39]2018CoalYesProductivity improvement (e.g., bucket fill factor, loading conditions, cycle time).
[40]2018GravelYesEmployees’ working time, time of running machines, fuel consumption, and electricity consumption.
[41]2018MineralYesKey flotation performance indicators: froth height above the recovery and silica recovery.
[42]2017Rock in oil wellYesRate of penetration.
[43]2017PlatinumYesProduction (e.g., face length mined, achieved blasts, development to mill).
[44]2016RockNox
[45]2016PlatinumYesImprovement in the overall efficiency of mining equipment at levels of availability, utilisation, productivity, and quality.
[46]2016PlatinumYesFinancial.
[47]2016CoalNox
[48]2016CopperNox
[49]2015CoalYesPredicting the performance of surface miner production.
[50]2015Coal haulingYesOptimisation of shuttle car utilisation (e.g., analysing the away time and safety).
[30]2015CoalYesErgonomic.
[51]2015CoalYesEnvironmental and economic.
[52]2014CoalYesTransport (e.g., time to repair, time to reach a person).
[53]2012Hard rockNox
[54]2011CopperYesProduction (e.g., maximising settle time, no slag skimming when tap hole is open to the vessel).
[55]2011Load haul dump machineryYesMachine availability and utilisation.
[56]2011Platinum flotation gradeNox
Table 2. KPIs monitored by the selected mining companies.
Mining CompaniesBHP BillitonRio TintoGlencoreValeAnglo AmericanFortescue MetalFresnilloNewmontBolidenFirst Quantum Minerals
Main Groups of KPIs
Business ethics and transparencyx x
Community relationships and development xxx x x
Economic performance xxxxx xx
Environmentxxxxxxxxxx
Equal opportunities x
Health and safetyxxxxxxxxxx
People/employeesxx x xx
Production xx
Recovery of degraded areas x
Societyx x x
Socio-political performance x
Source: based on [57,58,59,60,61,62,63,64,65,66].
Table 3. Examples of KPIs in the selected fields.
FieldExemplary KPIs
MaintenanceAverage bucket weight, average fuel use per machine, average number of loads per hour/day/week/month, average loading time, average swing time, average number of dumps per hour/day/week/month, dump time, total minutes lost per shift due to breaks, average payload, overall equipment effectiveness (OEE).
FinancialCash operating costs per unit produced, lifting costs, unit variable costs, utilisation.
TemporalChange time (time between cycles), empty travel time, lost time incident frequency rate, cycle distance, loaded travel time, tons of ore feed, cycle time, loaded stop time, tons per load, tons per hour, empty stop time.
SafetyFatality frequency rate, incident rate (accidents, etc.) per hour.
Physical characteristicDegree of purity and physical characteristics, raw material substitution rate (percentage), dilution of ore, reserve and resource replacement, the efficiency of metallurgical recovery, fuel consumption (e.g., litres/hour), waste volume, waste per ton, waste recycling (e.g., tons per time unit).
Source: based on [68,69].
Table 4. Basic technical indicators for machinery.
EngineTransmissionHydraulic SystemsTires and SuspensionsExhaust Aftertreatment
Engine speedRetarder oil temperatureOil pressurePressureFilter regeneration
TorqueRetarder oil pressureOil temperatureTemperatureExhaust temperatures
Coolant temperatureShaft gearPower supplyStrainAdBlue consumption
Oil temperatureOil level Gas mass flow rate
Oil pressure
Engine fuel rate
Throttle
Table 5. The most important KPIs for different person groups.
Decision-MakersSuperintendentShift SupervisorOperatorMaintenance Manager
KPIs
Technical KPIs
Fuel/energy consumptionxxx
Payload xxx
Temperatures xx
Pressures xx
Engine load and speed xx
Errors and warnings xxx
Hydraulic systems x
Tires and suspensions x
Exhaust after-treatment x
Temporal KPIs
Operating and idle timexxxx
Cycle durationxxx
Loading and dumping times xx
Queuing and spotting times xx
Relocation times xx
Downtimes xxx
Maintenance durationsxxxx
Spatial KPIs
Geolocation of machine xxx
Cycle distance xx
Loaded/empty travel distance x
Travel distance at beginning/end of shift xx
Slope angle and inclination x x
Safety KPIs
Lost Time Injuries (LTI)xx
Lost Time Injury Frequency Rate (LTIFR)xx
Frequency of refresher training xxxx
Planned routine safety checks versus completed routine safety checks xx x
Percentage reduction in exposure hours to hazardous materials/activities xxxx
Worker compensation costs xx
Incident rate (accidents, etc.) per x hours xx
Maintenance KPIs
Number of equipment failures per day/week/month/year) xxxx
Total minutes lost per shift due to breaks xxxx
Mean time between failures (MTBF) xxxx
Maintenance man-hours (MMH) xx x
Mean time between shutdowns (MTBS) x x
Mean time to restore/repair (MTTR)xxxx
Mean downtime (MDT) xxxx
Maintenance ratio (MR = maintenance man-hours/equipment operating hours)xx x
Availability xx x
Source: own development.

