Abstract
Since various foreign bodies can cause clogging and wear in single-channel pumps, considerable attention has been focused on the numerical study of solid-liquid flows in the single-channel pump. However, conventional numerical simulation cannot responsibly assess the significant effect of the particle material properties, inter-particle collision, and size on the pump. In consideration of the particle features and behaviors, the Computational Fluid Dynamics (CFD)-Discrete Element Method (DEM) coupling method was applied for the first time to simulate the solid-liquid flows in a single-channel pump. The results showed that the smaller particles possessed a wider velocity distribution range and velocity peak, while the larger particles exerted a greater contact force. Additionally, the pie-shaped particles had the most severe collisions, and spherical particles had the least in total. Furthermore, the hub and shroud wall suffered a minor contact force, but the blade and volute wall both sustained a considerable contact force. This paper could present some supply data for future research on the optimization of a single-channel pump.
1. Introduction
A single-channel pump is one type of sewage pump with a specially designed impeller. For the transport of various foreign objects in sewage, such as solids and fibers, it is intended that there is only one blade in the impeller. With the advantage of anti-clogging, a single-channel pump has been widely used for domestic and industrial sewage transport systems. However, compared with conventional centrifugal pumps, this particular design also brings some problems that cannot be ignored, such as hydrodynamic unbalance and relatively lower efficiency [1]. In order to improve the hydraulic performance of a single-channel pump, many numerical and experimental studies have focused on the inner flow field in the pump. Benra et al. [2,3] used PIV (Particle Image Velocimetry) technology to measure the periodic unsteady flow field in the impeller of a single-channel pump and compared the experimental results with numerical ones. The velocity field inside the pump investigated by PIV showed a good agreement with numerical one, which validated that using commercial Navier–Stokes solvers appears to be reliable. Nishi et al. [4] adopted LDV (Laser Doppler Velocimetry) and CFD (Computational Fluid Dynamics) methods to study the internal flow field of a single-channel pump. The results showed that the flow stagnation point on the work surface of the blade is far away from the inlet edge of the blade, resulting in a flow separation zone near the inlet edge. Auvinen et al. [5] used the OpenFOAM software to research the velocity field in a single-channel pump, and the results indicated that on the premise of high grid quality, the grid resolution had a slight influence on the pump performance prediction. Generally, these CFD methods above treated the fluid in a single-channel pump as a single-phase flow and obtained the flow characteristics of a liquid. However, those solid particles and fibers in sewage systems in fact have an essential effect on the pump performance. The particle features, material properties, shapes, and sizes can not get an accurate assessment in this way. Moreover, these CFD methods cannot provide a reliable estimate for the behaviors of particle-particle and particle-wall, such as collision, which may damage the pump.
Alternatively, the Discrete Element Method (DEM), a professional numerical method for processing discrete phases, has been widely applied in the calculation of particle systems. DEM can provide an accurate description of the particle property and calculate its dynamic motions in accordance with Newton’s second law. Given this, the DEM coupled with the CFD method was proposed to improve the computational efficiency and numerical accuracy in two-phase flow by Tsuji et al. [6] and Kafui et al. [7]. On the other hand, with an increasing realization of the relevance of particle shapes in soil behavior and flow patterns [8,9,10], the modeling of particle shapes has been developed into various constructs instead of a single sphere in the DEM. Cleary et al. [8] compared the effect of particle shapes on granular flows in hopper discharge. Santamarina et al. [9] concluded that particle shape emerges as a significant parameter needing to be properly characterized and documented as part of every soil characterization exercise. Pena et al. [10] studied the influence of particle shape on the global mechanical behavior of dense granular media.
Although the CFD-DEM coupling method has incomparable superiority, it was seldom applied to study solid-liquid two-phase flow in a centrifugal pump. Taking specific particle features, including size and material property into consideration, Huang et al. [11] used the CFD-DEM coupling method to calculate the unsteady solid-liquid two-phase flow in a centrifugal pump and obtained the solid phase distribution. Liu et al. [12] studied the crystal particles’ behavior in a centrifugal pump with the CFD-DEM coupling method, and the results showed that some crystal particles begin to get aggregation near the inlet edges of blades, forming the larger particles. Li et al. [13] used this method to simulate the reflux of different-diameter particles with the same volume concentration in a mixed pump. The results indicated that particles with a diameter of 50 mm cannot be refluxed, and they are likely to accumulate at the junction of the impeller and vanes.
Based on the above, in consideration of the particle features, the CFD-DEM coupling method was employed for the first time to study the distribution and motion of solid particles in a single-channel pump. The distribution and motion of the particles were analyzed by a DEM code inside the commercial CFD tool STAR-CCM+. The calculation factors in the shape and size with the material properties of the particles and the interactions of particle–particle, particle-wall, and particle-liquid. These results could be used to highlight some design guidance for designing a single-channel pump by obtaining the flow characteristics of solid particles.
2. Methodology
2.1. Computational Domain and Meshing
In order to verify the accuracy of the numerical method compared with the experimental data [14], a single-channel pump consisting of the inlet pipe, impeller, and volute was selected in this work to study the inner flow field. This single-channel pump model was kept the same as that used in experiments, and the basic parameters of the centrifugal pump are as follows: design discharge Q = 210 m3/h, head H = 20 m, rotational speed n = 1800 rpm, inlet diameter D1 = 50 mm, impeller diameter D2 = 138 mm, pump outlet diameter D3 = 110 mm. The polyhedron meshes are generated in the entire computational domain, as shown in Figure 1a. In addition, for the turbulent flow simulation, an appropriate resolution of the near-wall region is needed, and 5 prism layers are created next to all the wall surfaces (see Figure 1b) to improve the accuracy of the flow solution. Table 1 shows the results of the mesh dependency test for the head of the pump. It shows that the pump head remains steady when the grid number exceeds 535,665. Given the great amount of CFD-DEM coupling calculations, relatively few meshes are significant for simulation efficiency in the subsequent optimization process. Hence, the optimal number of mesh cells was determined as 535,665. As a kind of real-mass particle, the acceleration of gravity (g = 9.81 m/s2) is also taken into consideration, with its direction opposite to the y-axis.
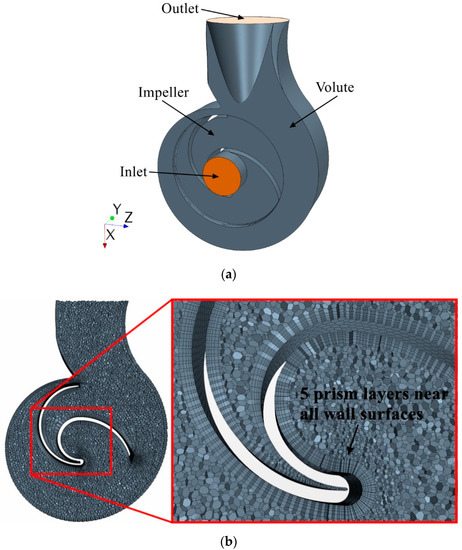
Figure 1.
(a) Computational domain; (b) mesh cells.

Table 1.
Mesh dependency test.
2.2. Governing Equations
The equations of continuity and momentum (Navier–Stokes equation) that govern the liquid phase are as follows in the tensor form:
where ρf is the fluid density, u is the fluid velocity, p is the pressure of the fluid, μeff is the effective viscosity, x is the coordinates, g is the acceleration of gravity, and Fs is the drag force between the particles and the liquid. represents the porosity around the particle, which can be calculated as:
where Vp,i represents the volume of particle i in a CFD cell, n represents the number of particles inside the cell, Vcell represents the volume of the cell.
Particle trajectory and particle behavior are controlled by the combined influence of hydrodynamic interactions and external force, which are described by Newton’s laws of motion. According to DEM, the translational and rotational movements of a particle can be calculated with Newton’s kinetic equation:
where Fc represents the contact force, Fdrag represents fluid drag force, m is the particle mass, and I is the moment of inertia of the particle. dv/dt is the translational acceleration of the particle, dω/dt is the angular acceleration of the particle, Tc is the contact torque, and Tf is the torque caused by the fluid.
2.3. CFD-DEM Coupling
During the two-way coupling adopted in this study, the modeling of the particle by DEM code is at the individual particle level, while the liquid flow by the CFD solver is at the computational cell level [15]. The coupling is initiated by analyzing the liquid flow based on CFD simulation. Once the iterative calculation in the CFD simulation is converged within a given time step, the DEM simulation then starts to calculate the instantaneous fluid–particle interaction force exerted on the individual particles from the CFD results. Thereafter, the new position and velocities of all the particles in the next fluid time step are determined. Inputting the updated particle information into the CFD solver, the forces on the fluid from particles are subsequently introduced into the liquid for the next loop through a series of momentum source terms [16].
2.4. Particle Model
In order to factor the size and shapes of particles, the simulation was divided into two groups. One group (mixed-size particles group) represents spherical particles with a certain range of diameters, and another (different-shaped particles group) represents three types of particles with different shapes. For the mixed-size particles group, the size of the particles varied from 1.0 to 5.0 mm in diameter in a random manner. For the different-shaped particles group, the shapes of particles in the simulation were set as a cylinder, pie, and sphere (see Figure 2a–c, respectively), which are the most three representative shapes of foreign matter in sewage. In addition, the cylindrical and pie-shaped particles were formed from rigid sphere clusters, where the adhesion force between spheres was set to infinity, and they would not separate during the simulation. The density of the particles was taken as 2000 kg/m3, and the particles were selected in a diameter of 3.0 mm, while the particle flow rate was set to 4000 particles/s at the pump inlet. When the particles contact each other or solid boundaries, their momentum and energy are exchanged. This necessitates a DEM phase interaction model to describe the particle–particle and particle–wall interactions. In this model, the Hertz–Mindlin contact model [17] was adopted to solve the contact forces of particles, which were described by a soft-sphere model [18]. The Hertz–Mindlin contact model is the standard model that was used for describing the particle–particle and particle–wall interactions. The collision parameters used in the models are summarized in Table 2.
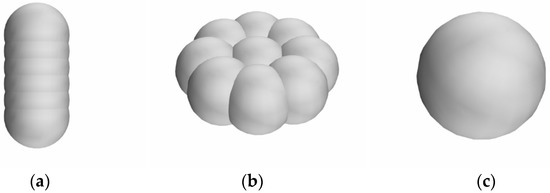
Figure 2.
Particle shape models: (a) cylinder particle, (b) pie-shaped particle, (c) spherical particle.
Table 2.
Collision parameters in the Hertz–Mindlin contact model.
2.5. Fluid Phase Setup
In this work, the transient fluid phase flow was analyzed through CFD simulations, based on solutions of the transient Reynolds averaged Navier–Stokes (RANS) equation. The realized two-layer k-ε model and “high-y+ wall treatment” in the STAR-CCM+ platform were employed for turbulence modeling. This wall treatment assumes that the near-wall cell lies within the region of the boundary layer. In the present simulations, the values of y+ ranged from 0.31 to 259.74, and the average y+ values for the impeller and volute surfaces are 80.38 and 109.64, respectively. The distribution of y+ for the impeller and volute is shown in Figure 3. The flow was assumed to be isothermal and incompressible with the properties of water (μ = 8.887 × 10⁻³ Pa·s, ρ = 998 kg/m3). The pump walls as well as particle surfaces were defined as no-slip walls, and the pump outlet was defined as a pressure outlet with p = 1.0bar. At the velocity inlet, a constant profile was specified. The absolute convergence criterion for the calculated residuals was set as 10−4 by default, together with monitoring the variations in average pressure at the pump inlet during the computations, as shown in Figure 4.
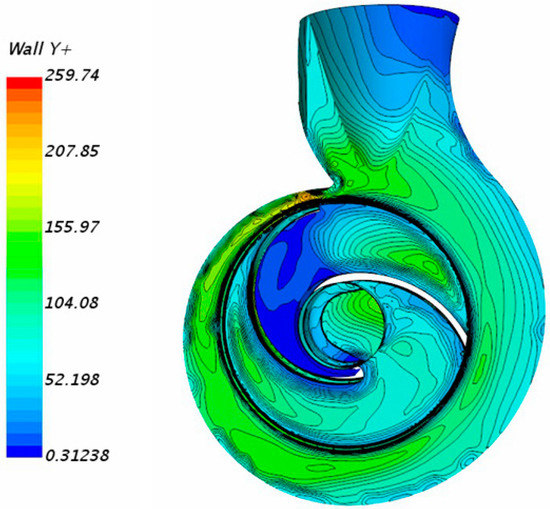
Figure 3.
Distribution of y+ for the impeller and volute.
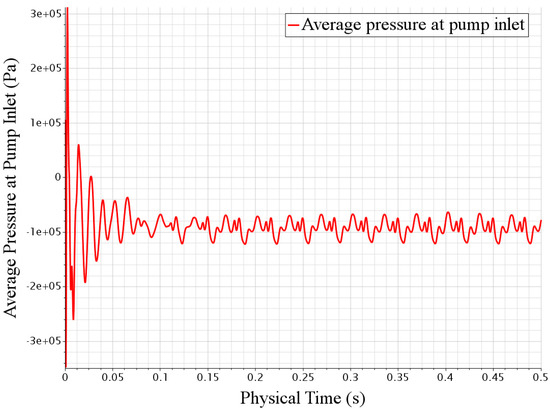
Figure 4.
Variations in the average pressure at the pump inlet.
3. Results and Discussion
3.1. Validation
For verifying the reliability of the CFD-DEM coupling method, the numerical results of the total head were compared with the existing experimental data [14] for the single-channel pump, as shown in Figure 5. The flow rate, size, and rotational speed of the computational pump model are the same as those of the pump model 22 used in the experiment. The total computational head of the pump is 18.41m, showing a good agreement with that of the experimental one—19.85 m. Additionally, this indicates the feasibility of the CFD-DEM coupling method. Meanwhile, the head predicted by means of CFD-DEM was a little bit lower than the experimental one. This discrepancy could result from the clean water used in the experiment compared to the solid-liquid two-phase flow in the simulation.

Figure 5.
Comparison of the total head between the present simulation and the experimental data [12].
3.2. Mixed-Sized Particle
3.2.1. Particle Trajectory and Distribution
Figure 6 shows the trajectory and size distribution of spherical particles whose diameter varied from 1.0 to 5.0 mm in a random manner (see Figure 6a). Remarkably, to reduce the impeller weight and unbalanced mechanical force, the blade is normally hollow (see Figure 6b). In this case, the hollow area is large enough that the flow status and particle motion in it cannot be ignored. In the impeller passage, the particle number density is different in different regions, with the characteristic of larger density in the vicinity of the inlet section and the blade pressure side.
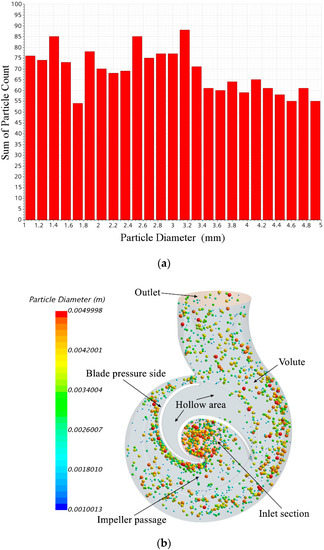
Figure 6.
Particle size distribution (a) and trajectory (b) mixed-size particles.
Besides this, to distinguish the trajectories of different-sized particles, the larger particles are presented in warmer colors, while smaller particles are shown in cooler colors. In general, the particles tended to maintain a steady trajectory towards the volute that corresponds with the shape of the impeller blade. After entering the volute, the particles tended to cluster along the volute outside wall and move downstream towards the outlet. However, the smaller particles had a much more uniform distribution in the passage of the impeller and volute than the larger ones. The most likely cause of this was the lower inertia of the smaller particles.
3.2.2. Particle Velocity Distribution
Figure 7 shows the scatter plot of the particle velocity and diameter. It can be seen that the smaller size the particles possess, the greater the velocity distribution range and velocity peak they get. Generally, the majority of the particle velocity would be between 1 and 7.5 m/s. In this case, when the particle size is tiny enough, the maximum speed reaches 14.7 m/s. With the increase in particle size, the velocity distribution range becomes smaller. This can be manifested by the decrease in the maximum speed—that is, the smaller particles are more likely to acquire a higher velocity.
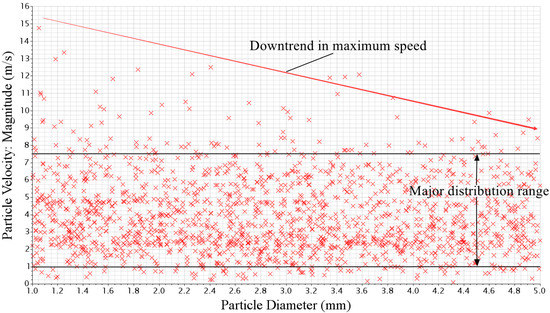
Figure 7.
Scatter plot of particle velocity and diameter.
Figure 8 presents the variations in the volume-average velocities of both the liquid phase and solid phase in the pump domains. The results show that the average velocity of the liquid phase approached a nearly steady value of 4.7 m/s, while that of the solid phase reached a considerably lower value of 4.1 m/s. There are apparently slip velocities between the liquid and solid phase flows inside the pump. Furthermore, the average velocity of the liquid phase approached a steady value after t = 0.15 s, while the average velocity of particles spent 0.24 s attaining a stable value. Preliminary analysis suggests that the dominant influence on particles could be exerted by the liquid phase. Coupled with the inertia of the particles, the average velocity of the particles would take longer to reach a plateau.
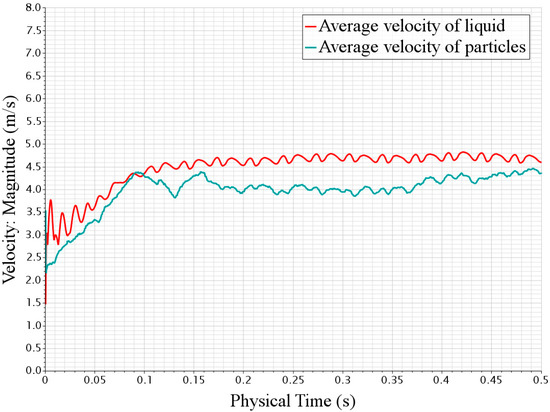
Figure 8.
Variations in the volume-average velocities of the liquid and particles in flow domains.
3.2.3. Particle Contact Force Distribution
Figure 9 shows the histogram of the particle size to contact force at t = 0.5 s. It is obvious that the larger the particle size is, the greater the contact force particles would be. The small particles (diameter less than 2.4 mm) had a fairly weak but even contact force compared to the large particles. Although the contact force of the large particles increased significantly due to the greater surface area and mass, the force was rather uneven, especially for those particles whose diameters ranged from 2.4 to 4.0 mm.
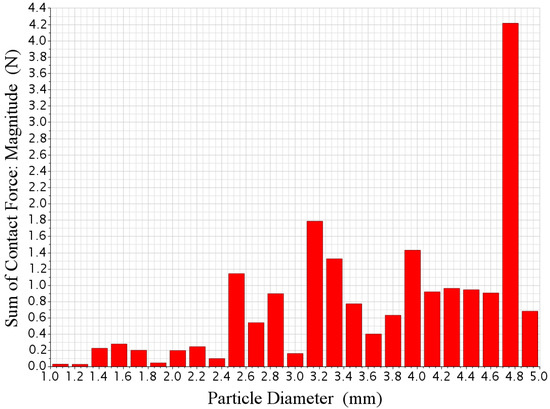
Figure 9.
Histogram of the particle size to contact force.
3.3. Different-Shaped Particles
3.3.1. Particle Trajectory and Distribution
Figure 10 shows the trajectories and distribution of three distinct-shaped particles at the same particle flow rate. In the comparison of these three figures, it can be seen that the trajectory of cylindrical particles in the impeller was close to the pressure side (see Figure 10a). After acquiring a significant speed from the impeller, cylindrical particles tended to scatter in the volute passage. With regard to the trajectory of the pie-shaped particles, it was similar compared to that of the cylindrical particles but closer to the pressure side of the impeller passage (see Figure 10b). Meanwhile, the pie-shaped particles were distributed more uniformly than the cylindrical particles in the volute passage. In contrast, the distribution of spherical particles became most uniform in the impeller and volute compared to the other two cases (see Figure 10c). This may indicate that the motion of spherical particles would be mainly under the influence of the liquid phase so that they can disperse uniformly in the passage.
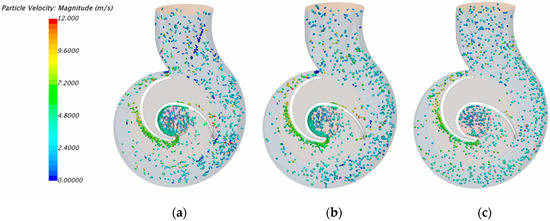
Figure 10.
Trajectory and distribution of three distinct-shaped particles (a) cylinder practice; (b) pie-shaped particle; (c) spherical particle.
3.3.2. Velocity Field of Liquid Phase
Figure 11 shows the relative velocity distribution of the liquid phase at the mid-span of the impeller for the three shape cases. It can be seen that there is little difference in the relative velocity fields of the three cases, which may reveal the subtle effect on liquid exerted by particles with different shapes under this particle flow rate. Additionally, it can be clearly seen that a wide low-velocity region is generated in the vicinity of the pump inlet. This can be explained by the fact that the inlet angle of the blade is pretty small, causing stagnation points both on the pressure side and suction side near the inlet edge. Thus, a certain range of flow separation occurs along the downstream direction of the inlet edge. Simultaneously, there is a vortex field in the hollow area of the blade, causing a backflow at the interface of the impeller volute. These second flows would significantly impact the pump performance.
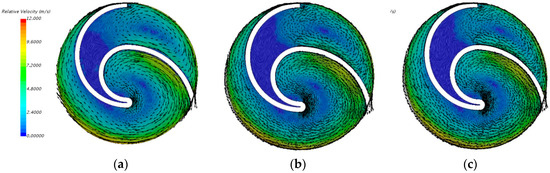
Figure 11.
Relative velocity field of the liquid phase at the mid-span of the impeller for the three shape cases: (a) cylinder particle, (b) pie-shaped particle, (c) spherical particle.
On the other hand, compared with the results of the particle distribution, it can be reasoned that the liquid phase might possess the dominant influence on particles. Especially for those particles in the hollow area of the blade, the backflow would carry the particles back to the hollow area.
3.3.3. Collision Between Particle and Wall
The following figure illustrates the particle–wall contact force for three shape cases (refer to Figure 12). It is clear that the pie-shaped particles have the most serious collision, and spherical particles have the least in total. When it comes to the collision of particles with hub and shroud, it can be obtained that both the hub and shroud suffer a minor contact force, whose value was under around 1.0 N, by all the three types of particles. On the contrary, the blade and volute wall both sustained considerable contact force from particles, especially from the cylindrical and pie-shaped particles. This indicates that these solid particles may cause severe wear problems on the blade and volute areas. Hence, in the further optimization of the single-channel pump, the blades and volute can be designed to have more wear-resistance than the other parts. Moreover, before entering the pump, the particles or foreign bodies could be made as round as possible to reduce wear.
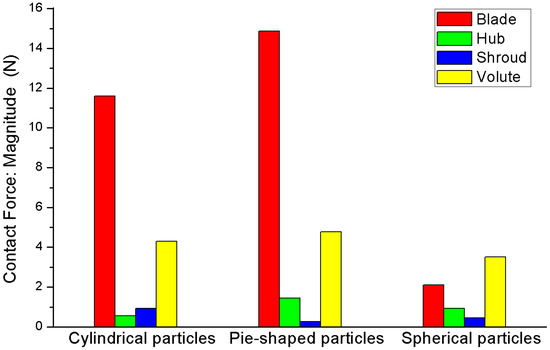
Figure 12.
Particle–wall contact force for the three shape cases.
4. Conclusions
In this paper, the CFD-DEM coupling method was applied to study the distribution and motion features of various-sized and three different-shaped particles in a single-channel pump. The results are compared with the experimental ones, which prove that the CFD-DEM method used in this paper is reliable. The conclusions obtained from this research are as follows:
- Particles tended to maintain a steady trajectory towards the volute that corresponds with the shape of the impeller blade. The smaller particles had a much more uniform distribution in the passages of the impeller and volute than the larger ones.
- The smaller-sized particles possessed a greater velocity distribution range and velocity peak but a smaller contact force compared with the larger particles. Besides this, there were apparent slip velocities between the liquid and solid-phase flows inside the pump.
- The trajectories of the cylindrical and pie-shaped particles in the impeller were close to the pressure side. However, the spherical particles were dispersed more uniformly in the impeller and volute than the other two cases.
- The pie-shaped particles had the most severe collisions, and the spherical particles had the least in total. The hub and shroud wall suffered a minor contact force, but the blade and volute wall both sustained a considerable contact force.
- In order to reduce wear, the blades and volute can be designed to have more wear resistance than other parts. Moreover, before entering the pump, the particles or foreign bodies can be made as round as possible to reduce wear.
- According to the limited particle model and flow parameters in this research, the other shapes and rigidity of particles with different fluid viscosities and other fluid properties could be factored into the CFD-DEM coupling method for future research.
Author Contributions
Conceptualization, C.T. and Y.-J.K.; methodology, C.T. and Y.-J.K.; software, C.T.; validation, C.T. and Y.-J.K.; formal analysis, C.T.; investigation, C.T.; resources, C.T. and Y.-J.K.; data curation, C.T.; writing—original draft preparation, C.T. and Y.-J.K.; writing—review and editing, C.T. and Y.-J.K.; supervision, Y.-J.K. All authors have read and agreed to the published version of the manuscript.
Funding
This work was supported by the Korea Agency for Infrastructure Technology Advancement (KAIA) grant funded by the Ministry of Land, Infrastructure and Transport (Grant 20CTAP-C157760-01).
Conflicts of Interest
The authors declare no conflict of interest.
References
- AOKI, M. Instantaneous interblade pressure distributions and fluctuating radial thrust in a single-blade centrifugal pump. Bull. JSME 1984, 27, 2413–2420. [Google Scholar] [CrossRef]
- Benra, F.; Dohmen, H. Numerical and experimental evaluation of the time-variant flow field in a single-blade centrifugal pump. In Proceedings of the 5th International Conference on Heat Transfer, Fluid Mechanics and Thermodynamics, Sun City, South Africa, 1–4 July 2007. [Google Scholar]
- Benra, F.-K.; Dohmen, H.J. Investigation on the time-variant flow in a single-blade centrifugal pump. In Proceedings of the 5th WSEAS International Conference on Fluid Mechanics (FLUIDS’08), Acapulco, Mexico, 25–27 January 2008. [Google Scholar]
- Nishi, Y.; Matsuo, N.; Fukutomi, J. A study on internal flow in a new type of sewage pump. J. Fluid Sci. Technol. 2009, 4, 648–660. [Google Scholar] [CrossRef]
- Auvinen, M.; Ala-Juusela, J.; Pedersen, N.; Siikonen, T. Time-accurate turbomachinery simulations with Open-Source® CFD: Flow analysis of a single-channel pump with OpenFOAM®. In Proceedings of the ECCOMAS CFD, Lisbon, Portugal, 14–17 June 2010. [Google Scholar]
- Tsuji, Y.; Kawaguchi, T.; Tanaka, T. Discrete particle simulation of two-dimensional fluidized bed. Powder Technol. 1993, 77, 79–87. [Google Scholar] [CrossRef]
- Kafui, K.; Thornton, C.; Adams, M. Discrete particle-continuum fluid modelling of gas–solid fluidised beds. Chem. Eng. Sci. 2002, 57, 2395–2410. [Google Scholar] [CrossRef]
- Cleary, P.W.; Sawley, M.L. DEM modelling of industrial granular flows: 3D case studies and the effect of particle shape on hopper discharge. Appl. Math. Model. 2002, 26, 89–111. [Google Scholar] [CrossRef]
- Santamarina, J.; Cho, G.-C. Soil behaviour: The role of particle shape. In Advances in Geotechnical Engineering: The Skempton Conference: Proceedings of a Three Day Conference on Advances in Geotechnical Engineering, Organised by the Institution of Civil Engineers and Held at the Royal Geographical Society, London, UK, on 29–31 March 2004; Thomas Telford: London, UK, 2015; pp. 604–617. [Google Scholar]
- Pena, A.; Garcia-Rojo, R.; Herrmann, H.J. Influence of particle shape on sheared dense granular media. Granul. Matter 2007, 9, 279–291. [Google Scholar] [CrossRef]
- Huang, S.; Yang, F.; Su, X. Unsteady Numerical Simulation for Solid-Liquid Two-Phase Flow in Centrifugal Pump by CFD-DEM Coupling. Sci. Technol. Rev. 2014, 27, 15. [Google Scholar]
- Liu, D.; Tang, C.; Ding, S.; Fu, B. CFD-DEM Simulation for Distribution and Motion Feature of Crystal Particles in Centrifugal Pump. Int. J. Fluid Mach. Syst. 2017, 10, 378–384. [Google Scholar] [CrossRef]
- Yuanwen, L.; Shaojun, L.; Xiaozhou, H. Research on reflux in deep-sea mining pump based on DEM-CFD. Mar. Georesour. Geotechnol. 2020, 38, 744–752. [Google Scholar] [CrossRef]
- Lee, J.-G.; Kim, Y.-J. Effect of The Impeller Discharge Angle on the Performance of a Spurt Vacuum Pump. Appl. Sci. Converg. Technol. 2017, 26, 1–5. [Google Scholar] [CrossRef]
- Chu, K.; Yu, A. Numerical simulation of complex particle–fluid flows. Powder Technol. 2008, 179, 104–114. [Google Scholar] [CrossRef]
- Huang, S.; Su, X.; Qiu, G. Transient numerical simulation for solid-liquid flow in a centrifugal pump by DEM-CFD coupling. Eng. Appl. Comput. Fluid Mech. 2015, 9, 411–418. [Google Scholar] [CrossRef]
- Mindlin, R.D. Compliance of elastic bodies in contact. J. Appl. Mech. ASME 1949, 16, 259–268. [Google Scholar]
- Hertz, H. Ueber die Berührung fester elastischer Körper. J. Für Die Reine Und Angew. Math. 1882, 1882, 156–171. [Google Scholar]
© 2020 by the authors. Licensee MDPI, Basel, Switzerland. This article is an open access article distributed under the terms and conditions of the Creative Commons Attribution (CC BY) license (http://creativecommons.org/licenses/by/4.0/).