Thévenin Equivalent Parameter Adaptive Robust Estimation Considering the Erroneous Measurements of PMU


Abstract
1. Introduction
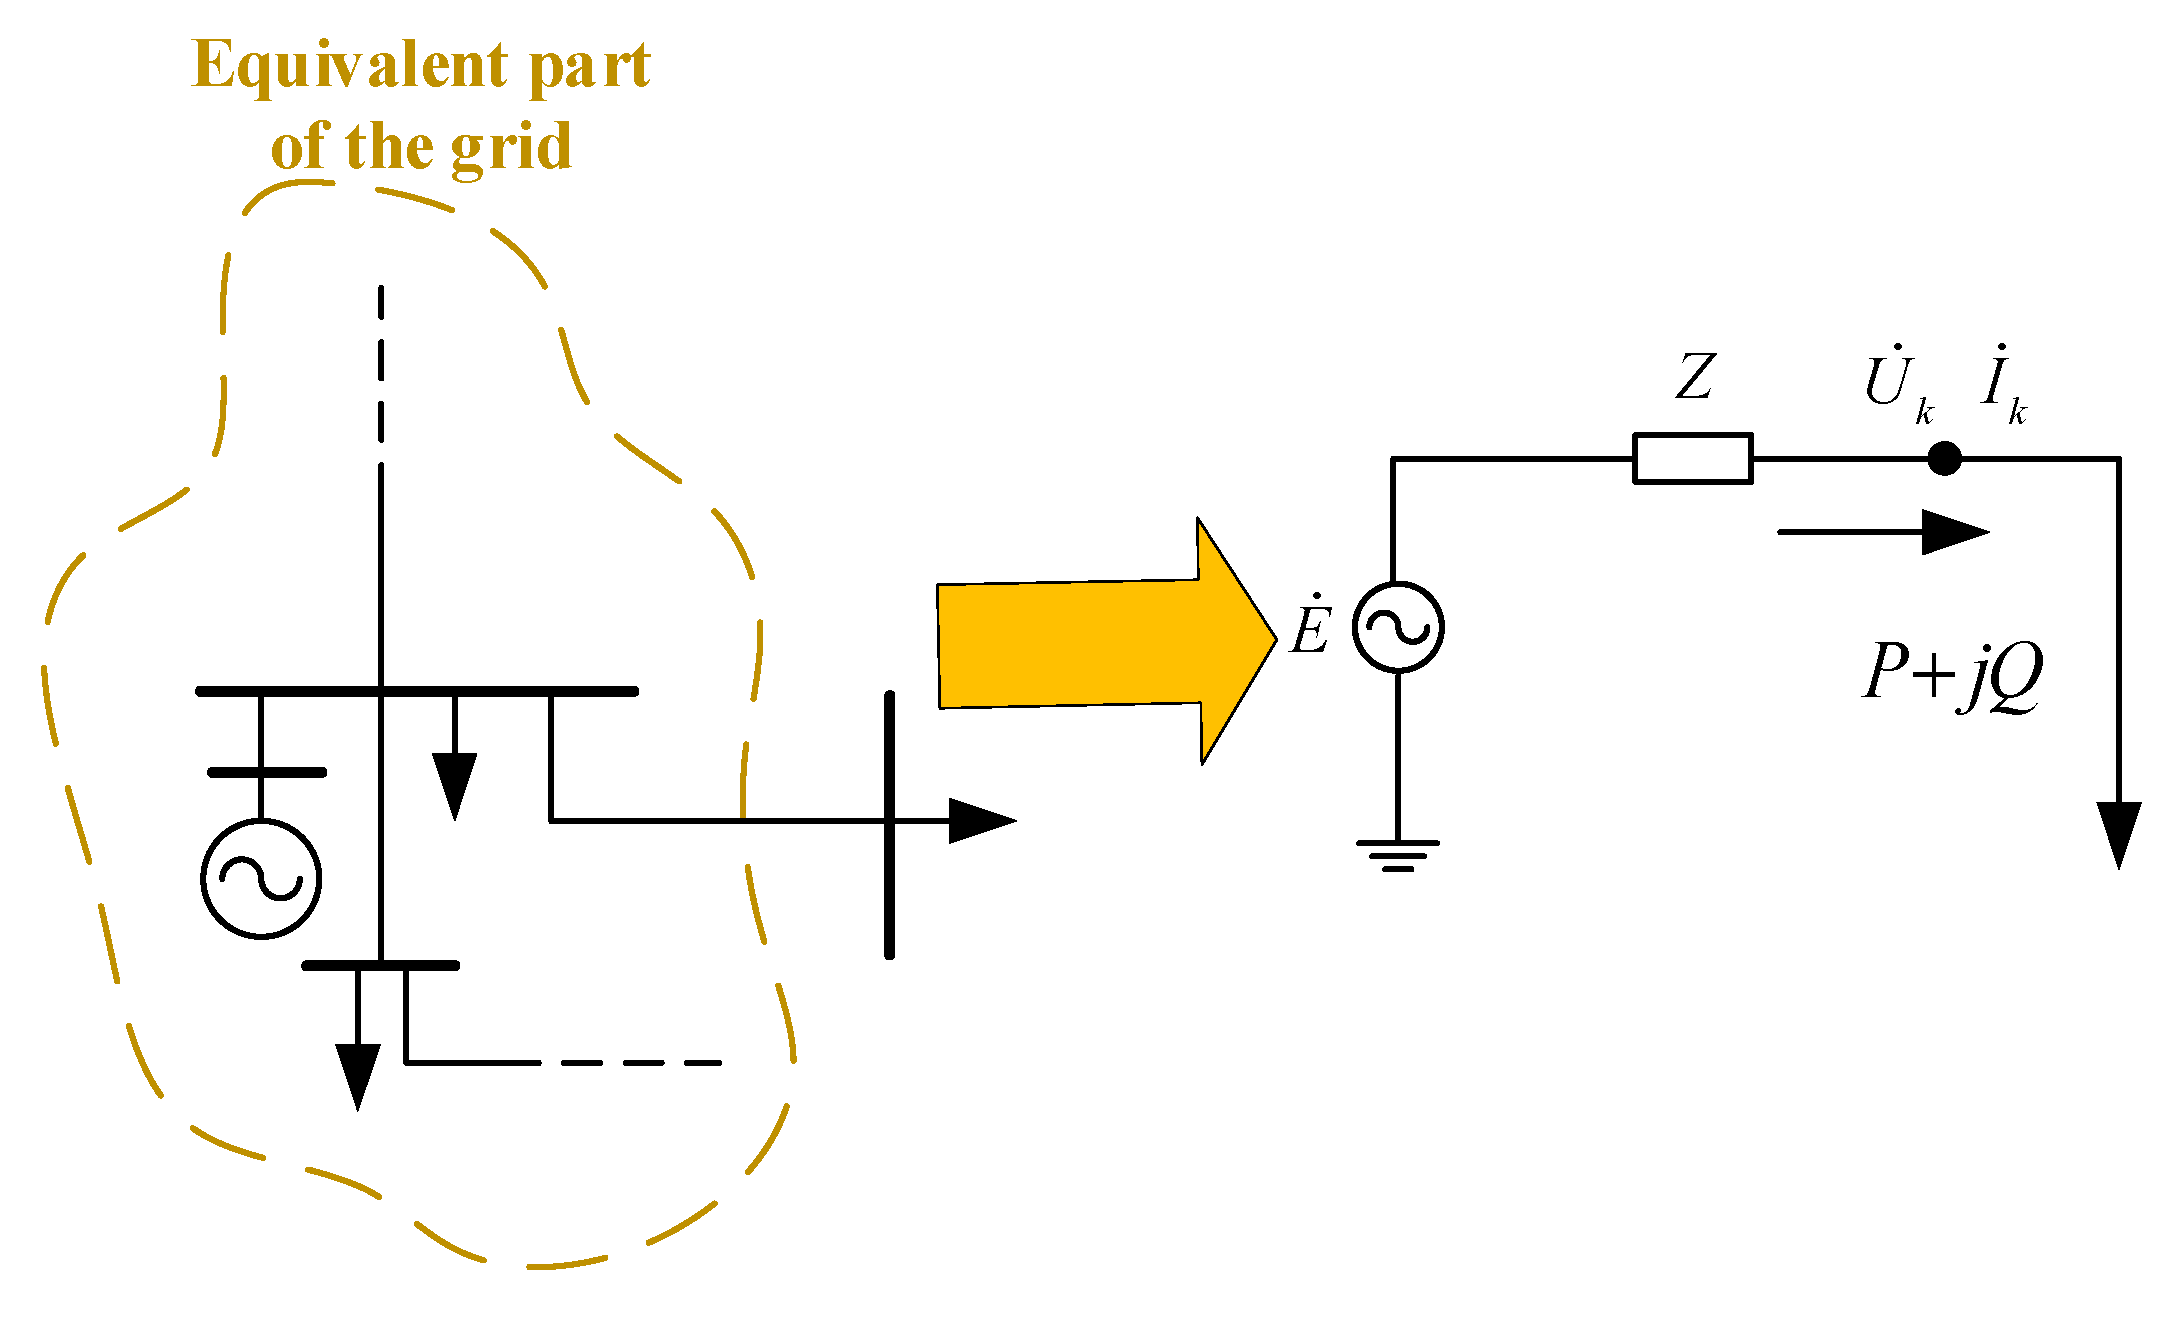
2. TEP Estimation Method
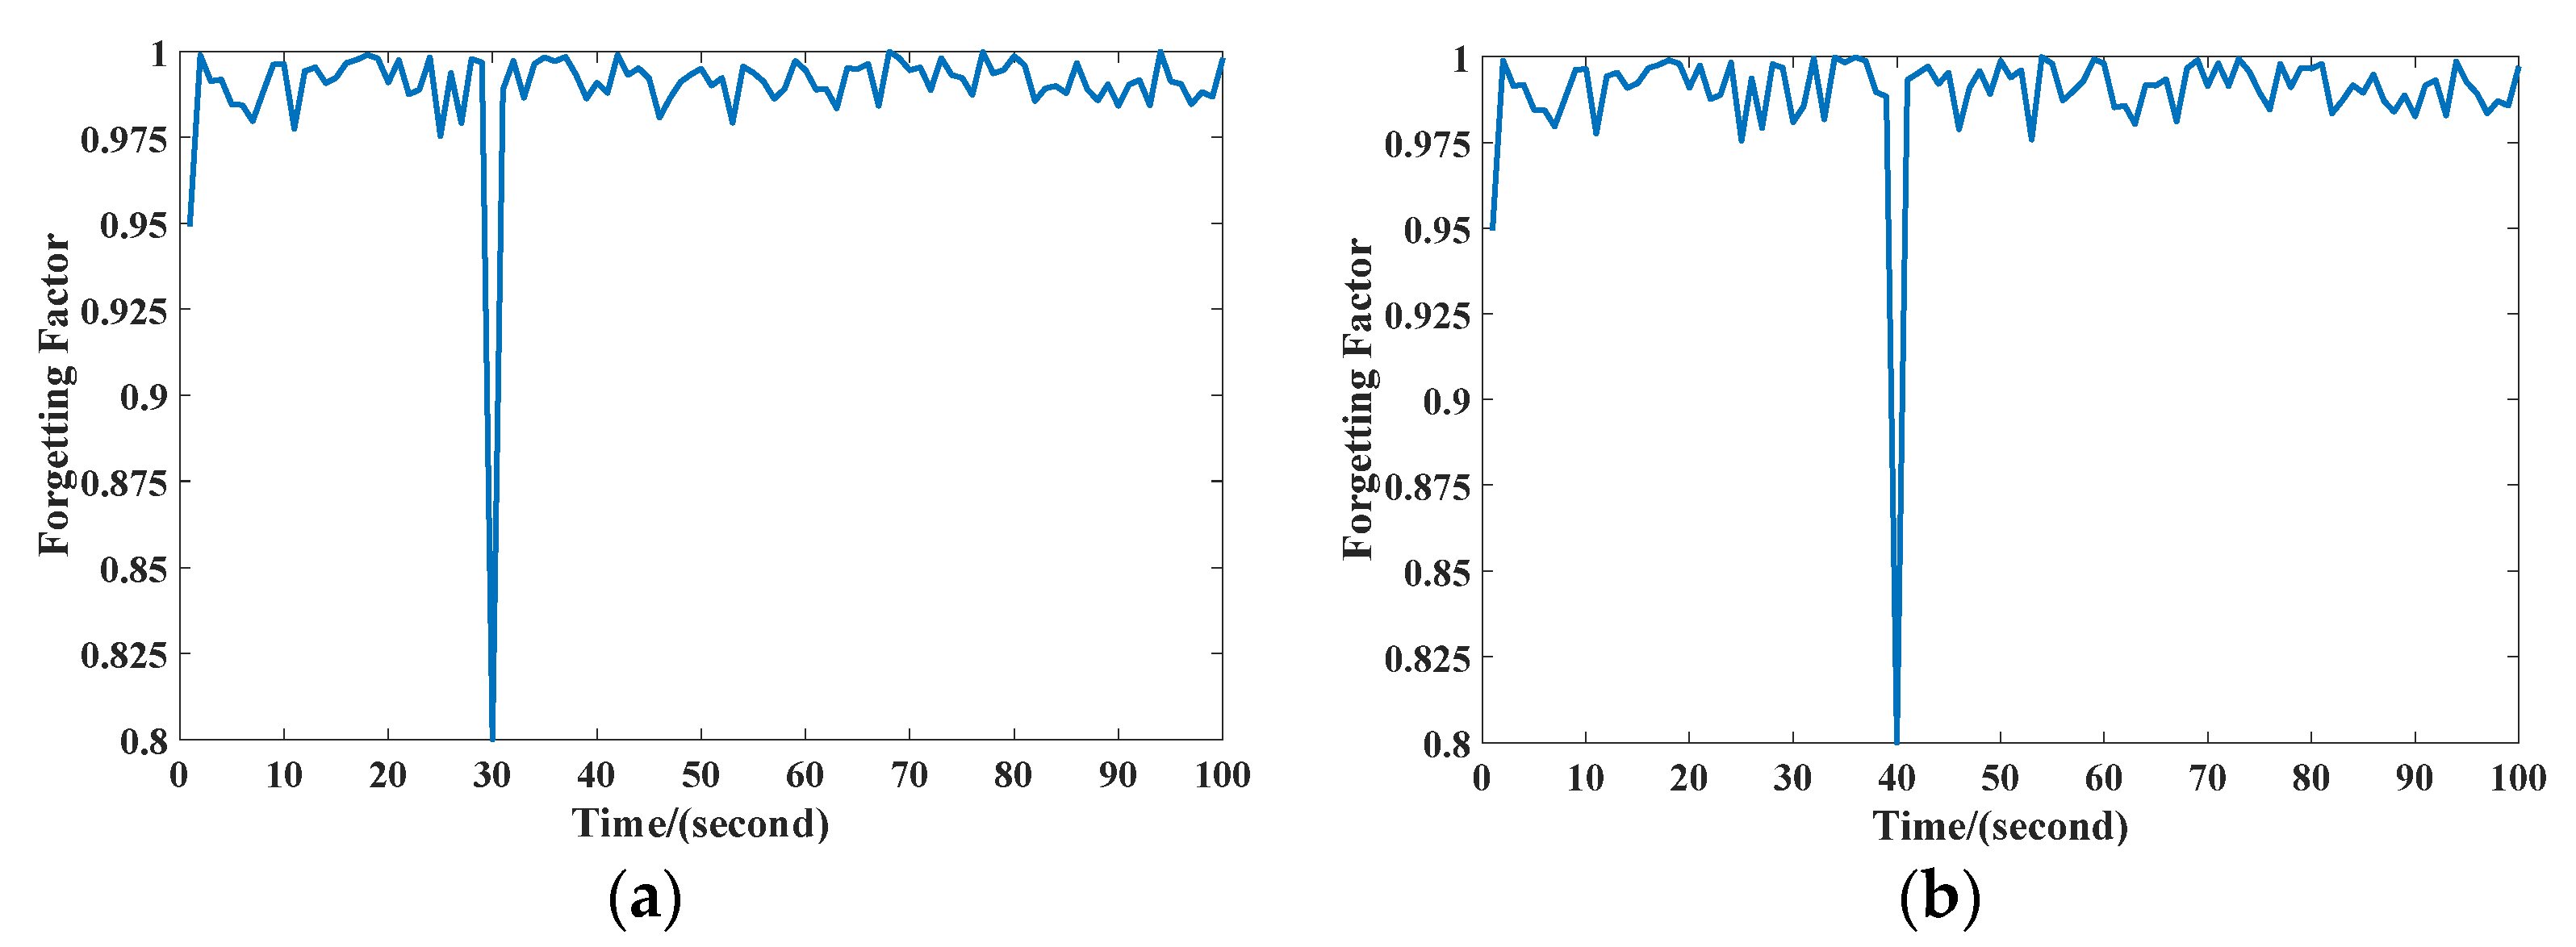
2.1. Variable Forgetting Factor
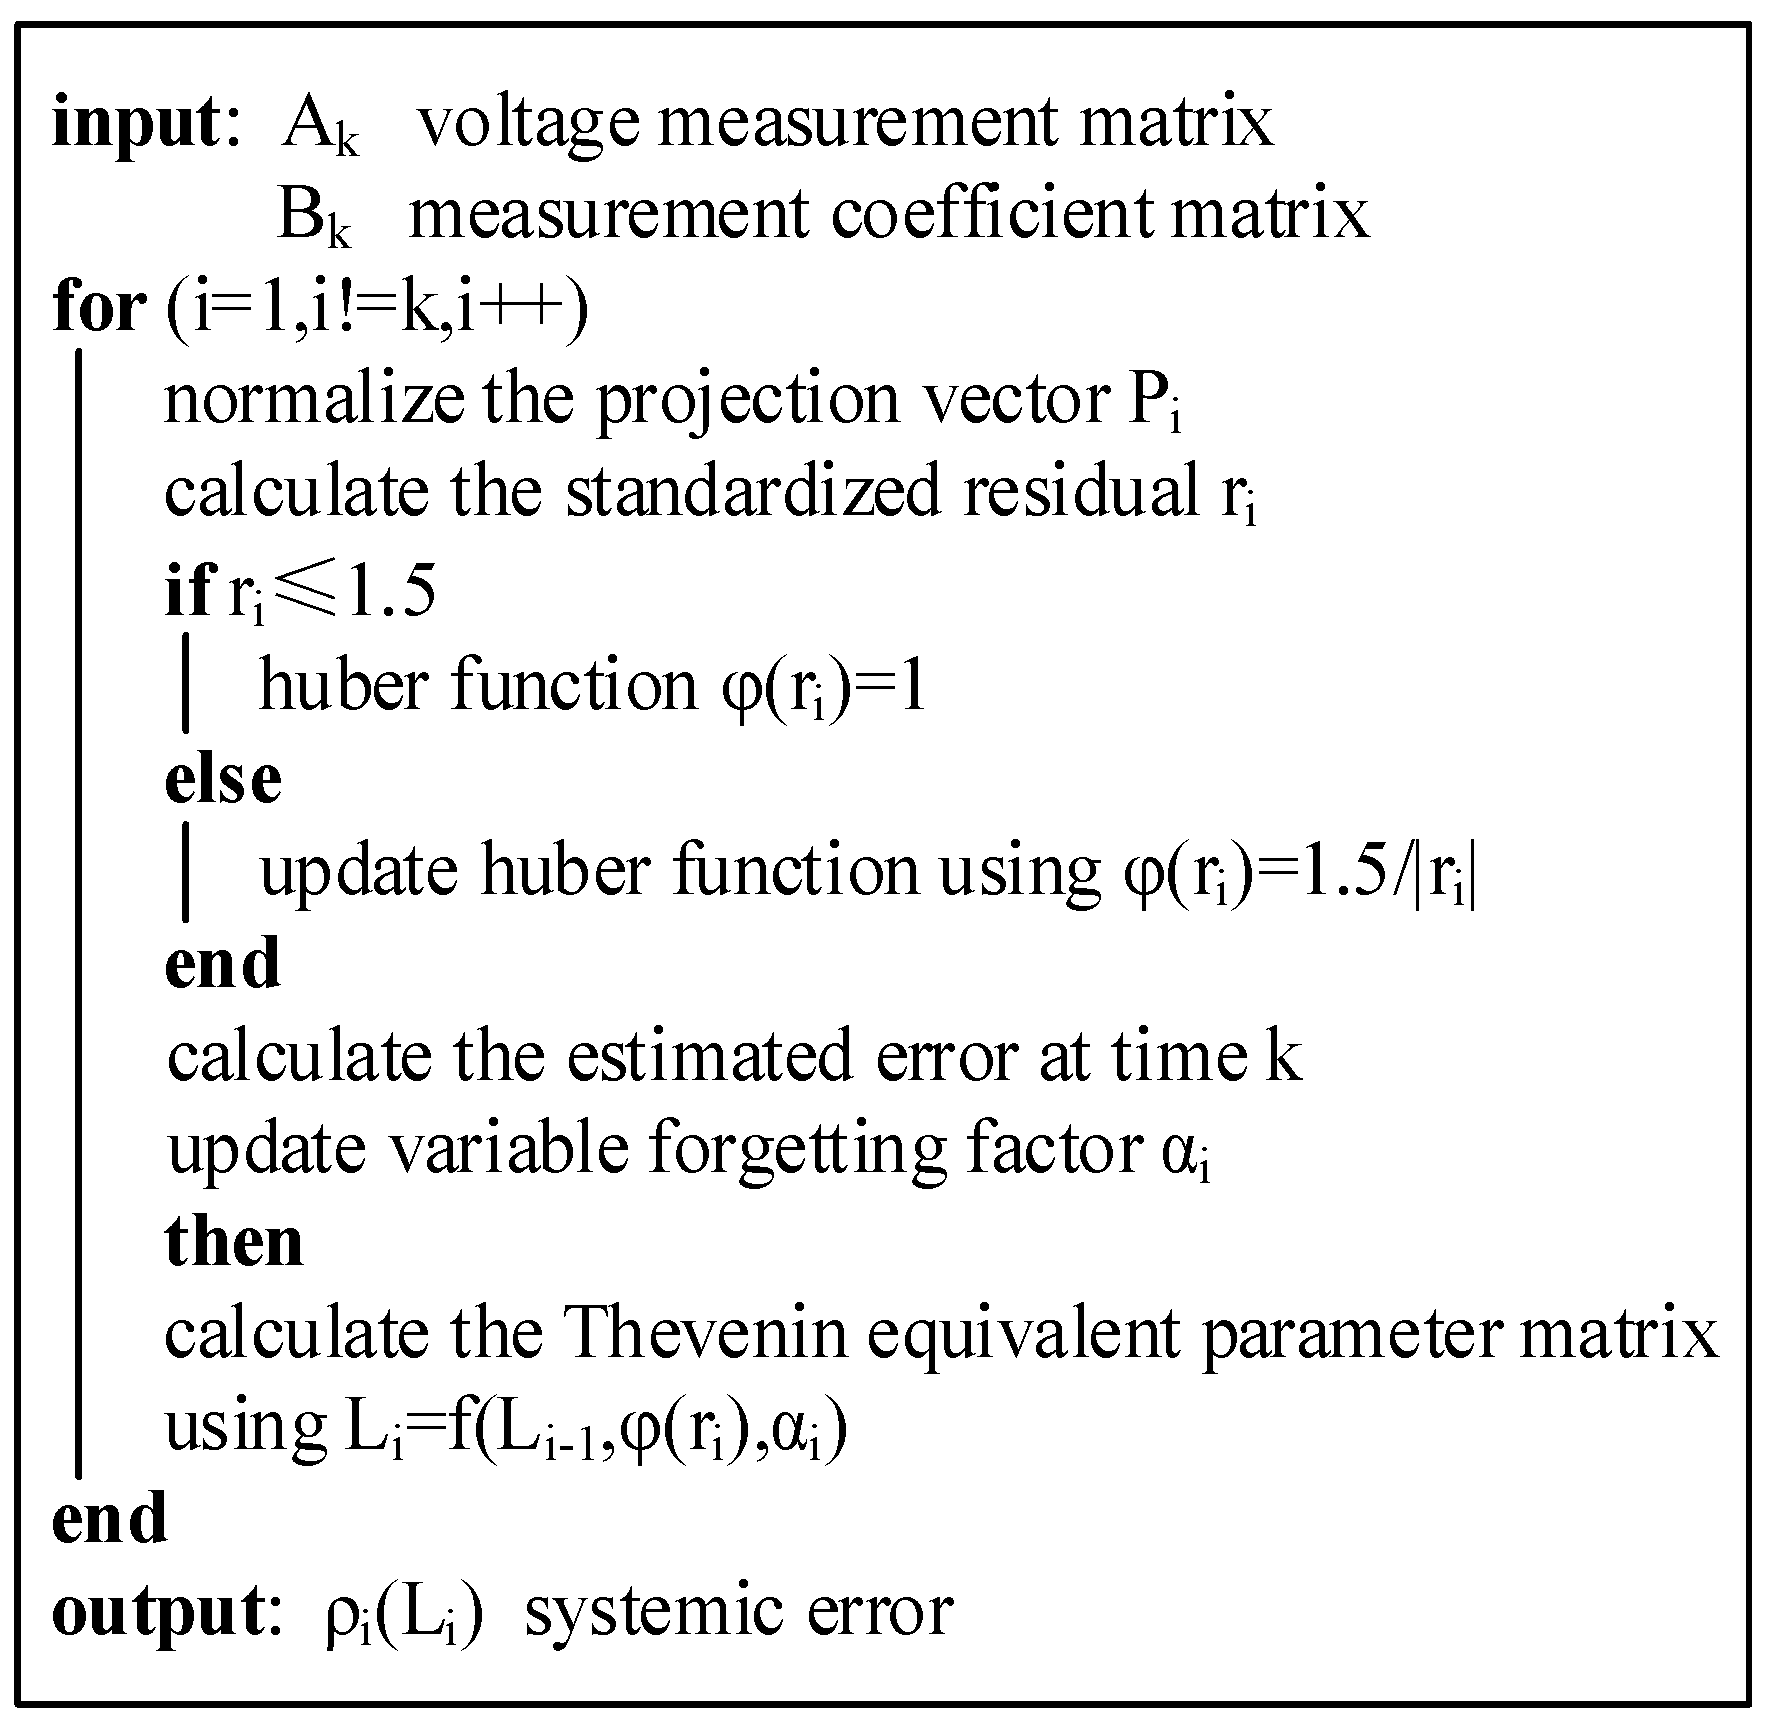
2.2. TEP Estimation Method Based on VFF, PS, and Huber’s M-Estimation
3. Simulation Verification
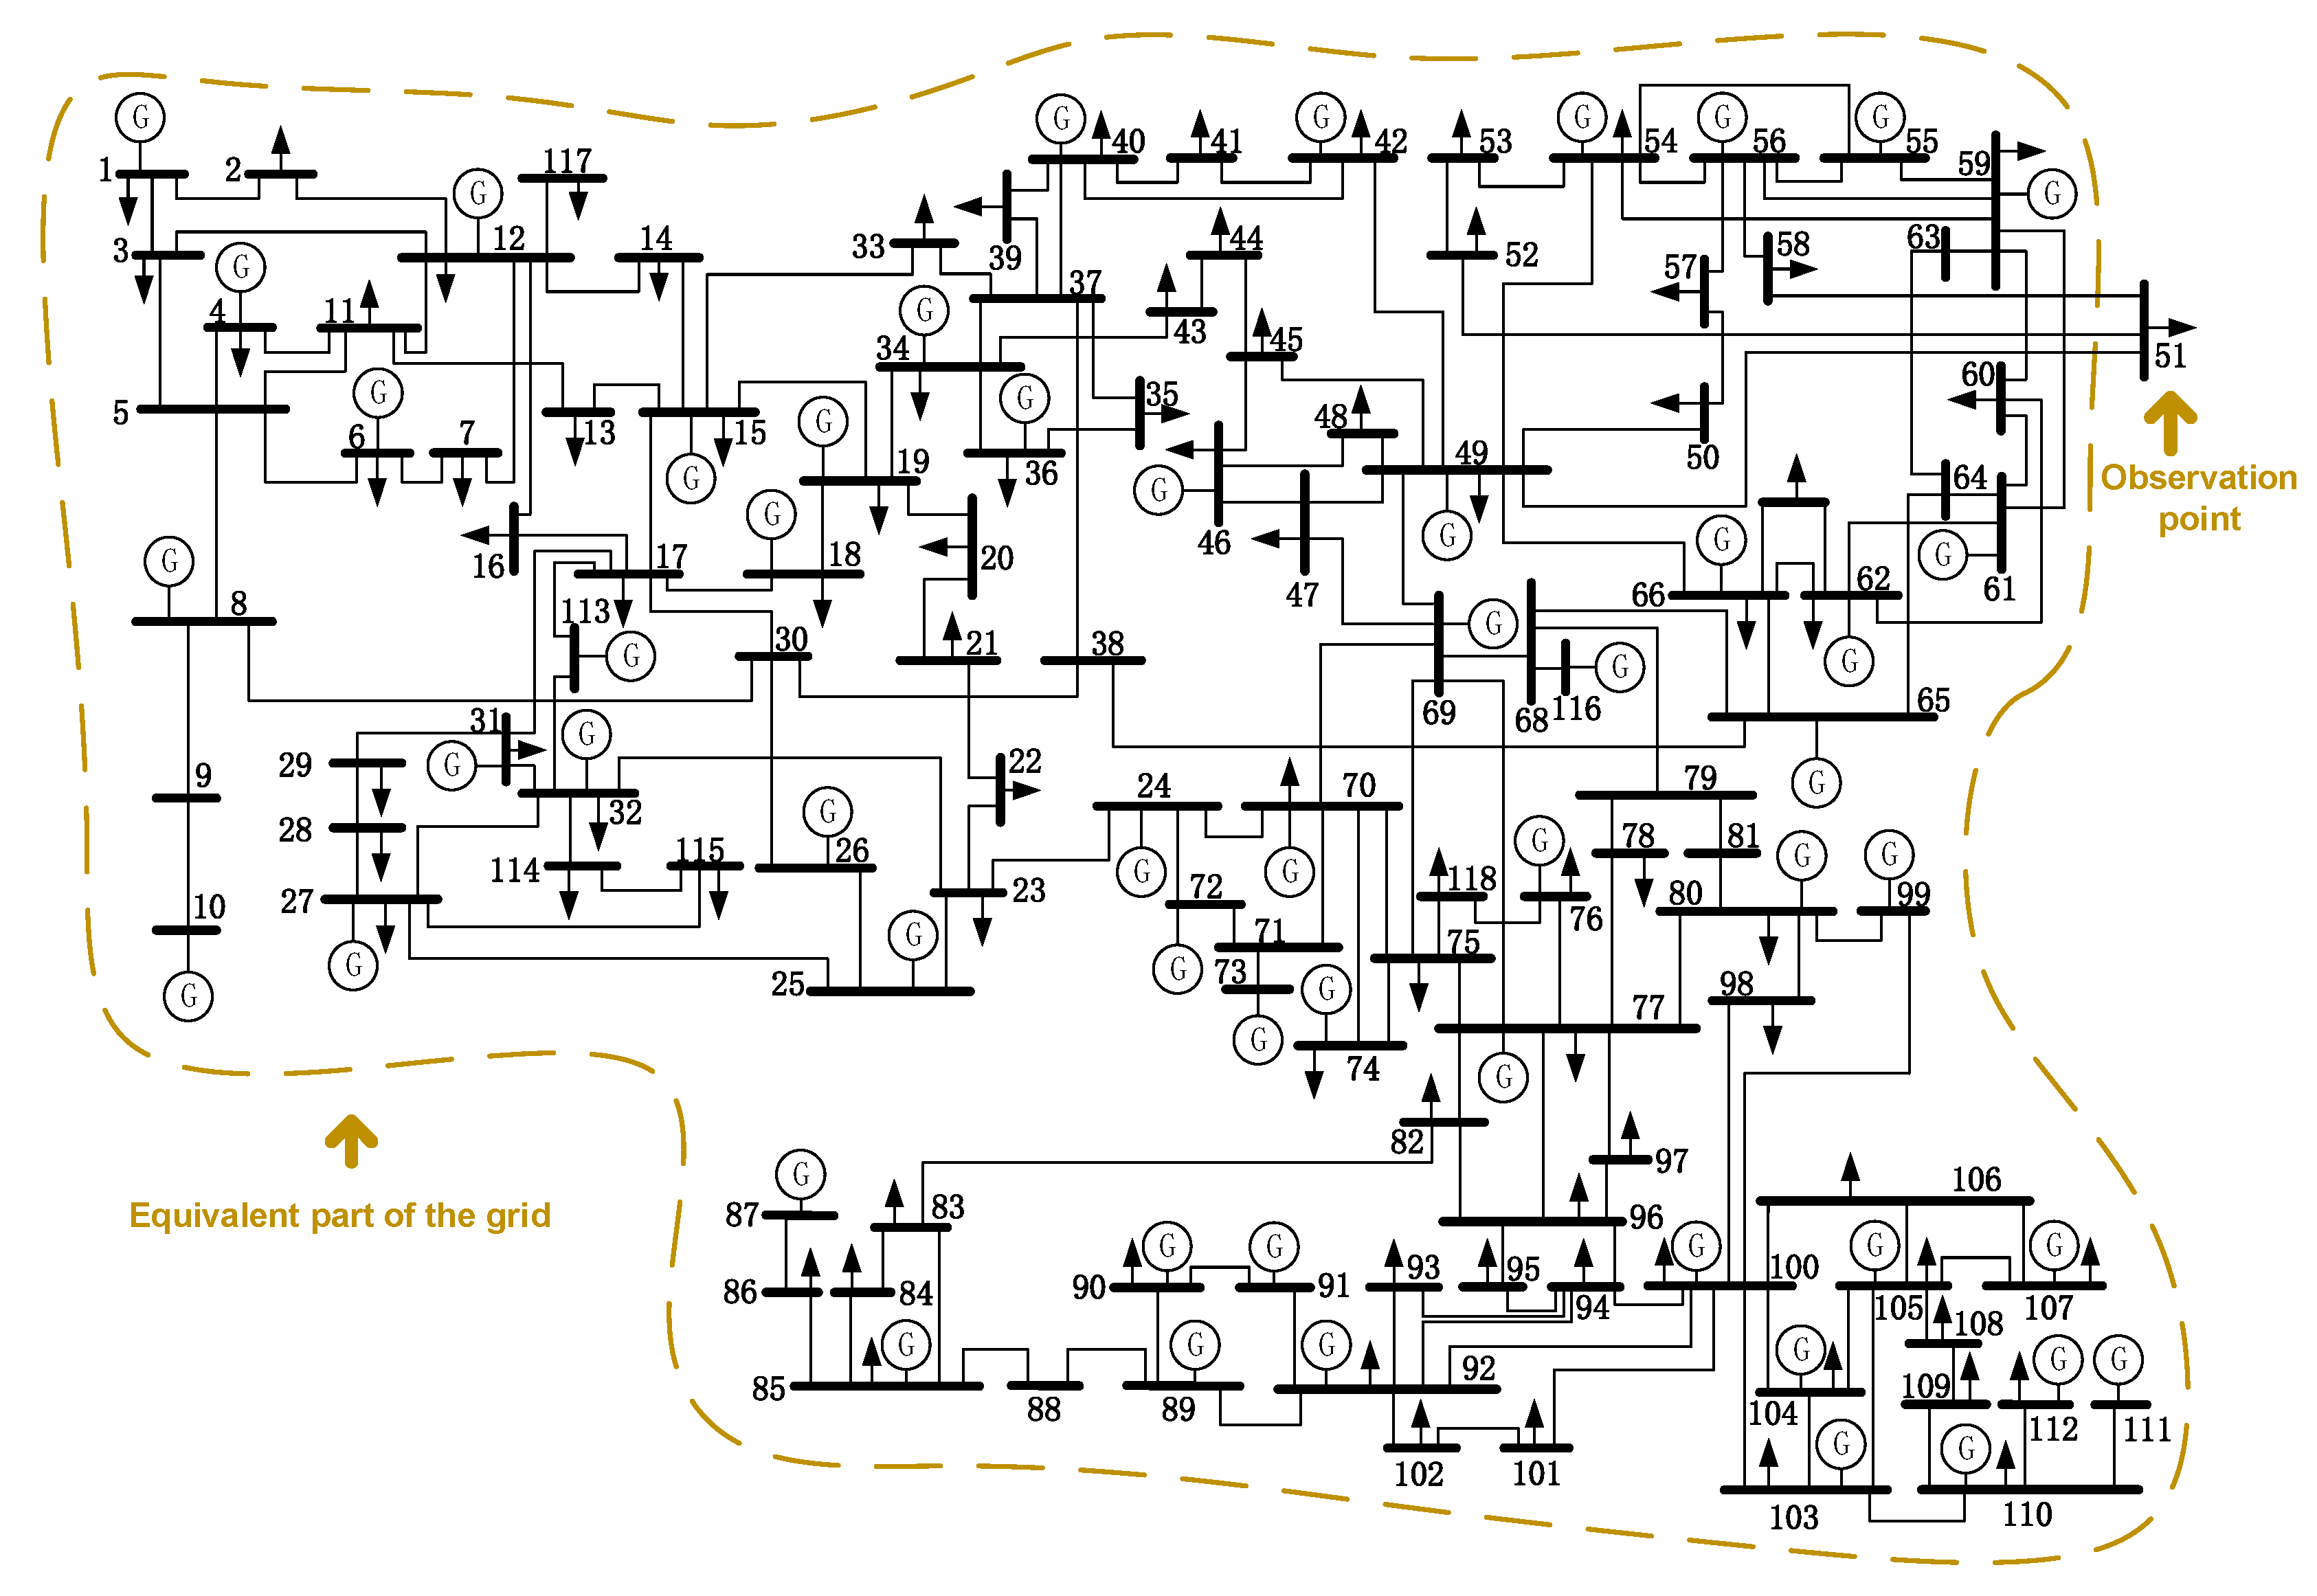
3.1. Case I: Simulation Verification on IEEE 118-Bus System
- (1)
- Scenario 1: The voltage and current values at the 30th second increased to 4 times and 6 times, respectively, and recorded as the leverage measurement. A fixed forgetting factor was applied in Huber’s M-Estimation algorithm.
- (2)
- Scenario 2: Increased the values at the 40th second to 6 times as outliers. A fixed forgetting factor was applied in Huber’s M-Estimation algorithm.
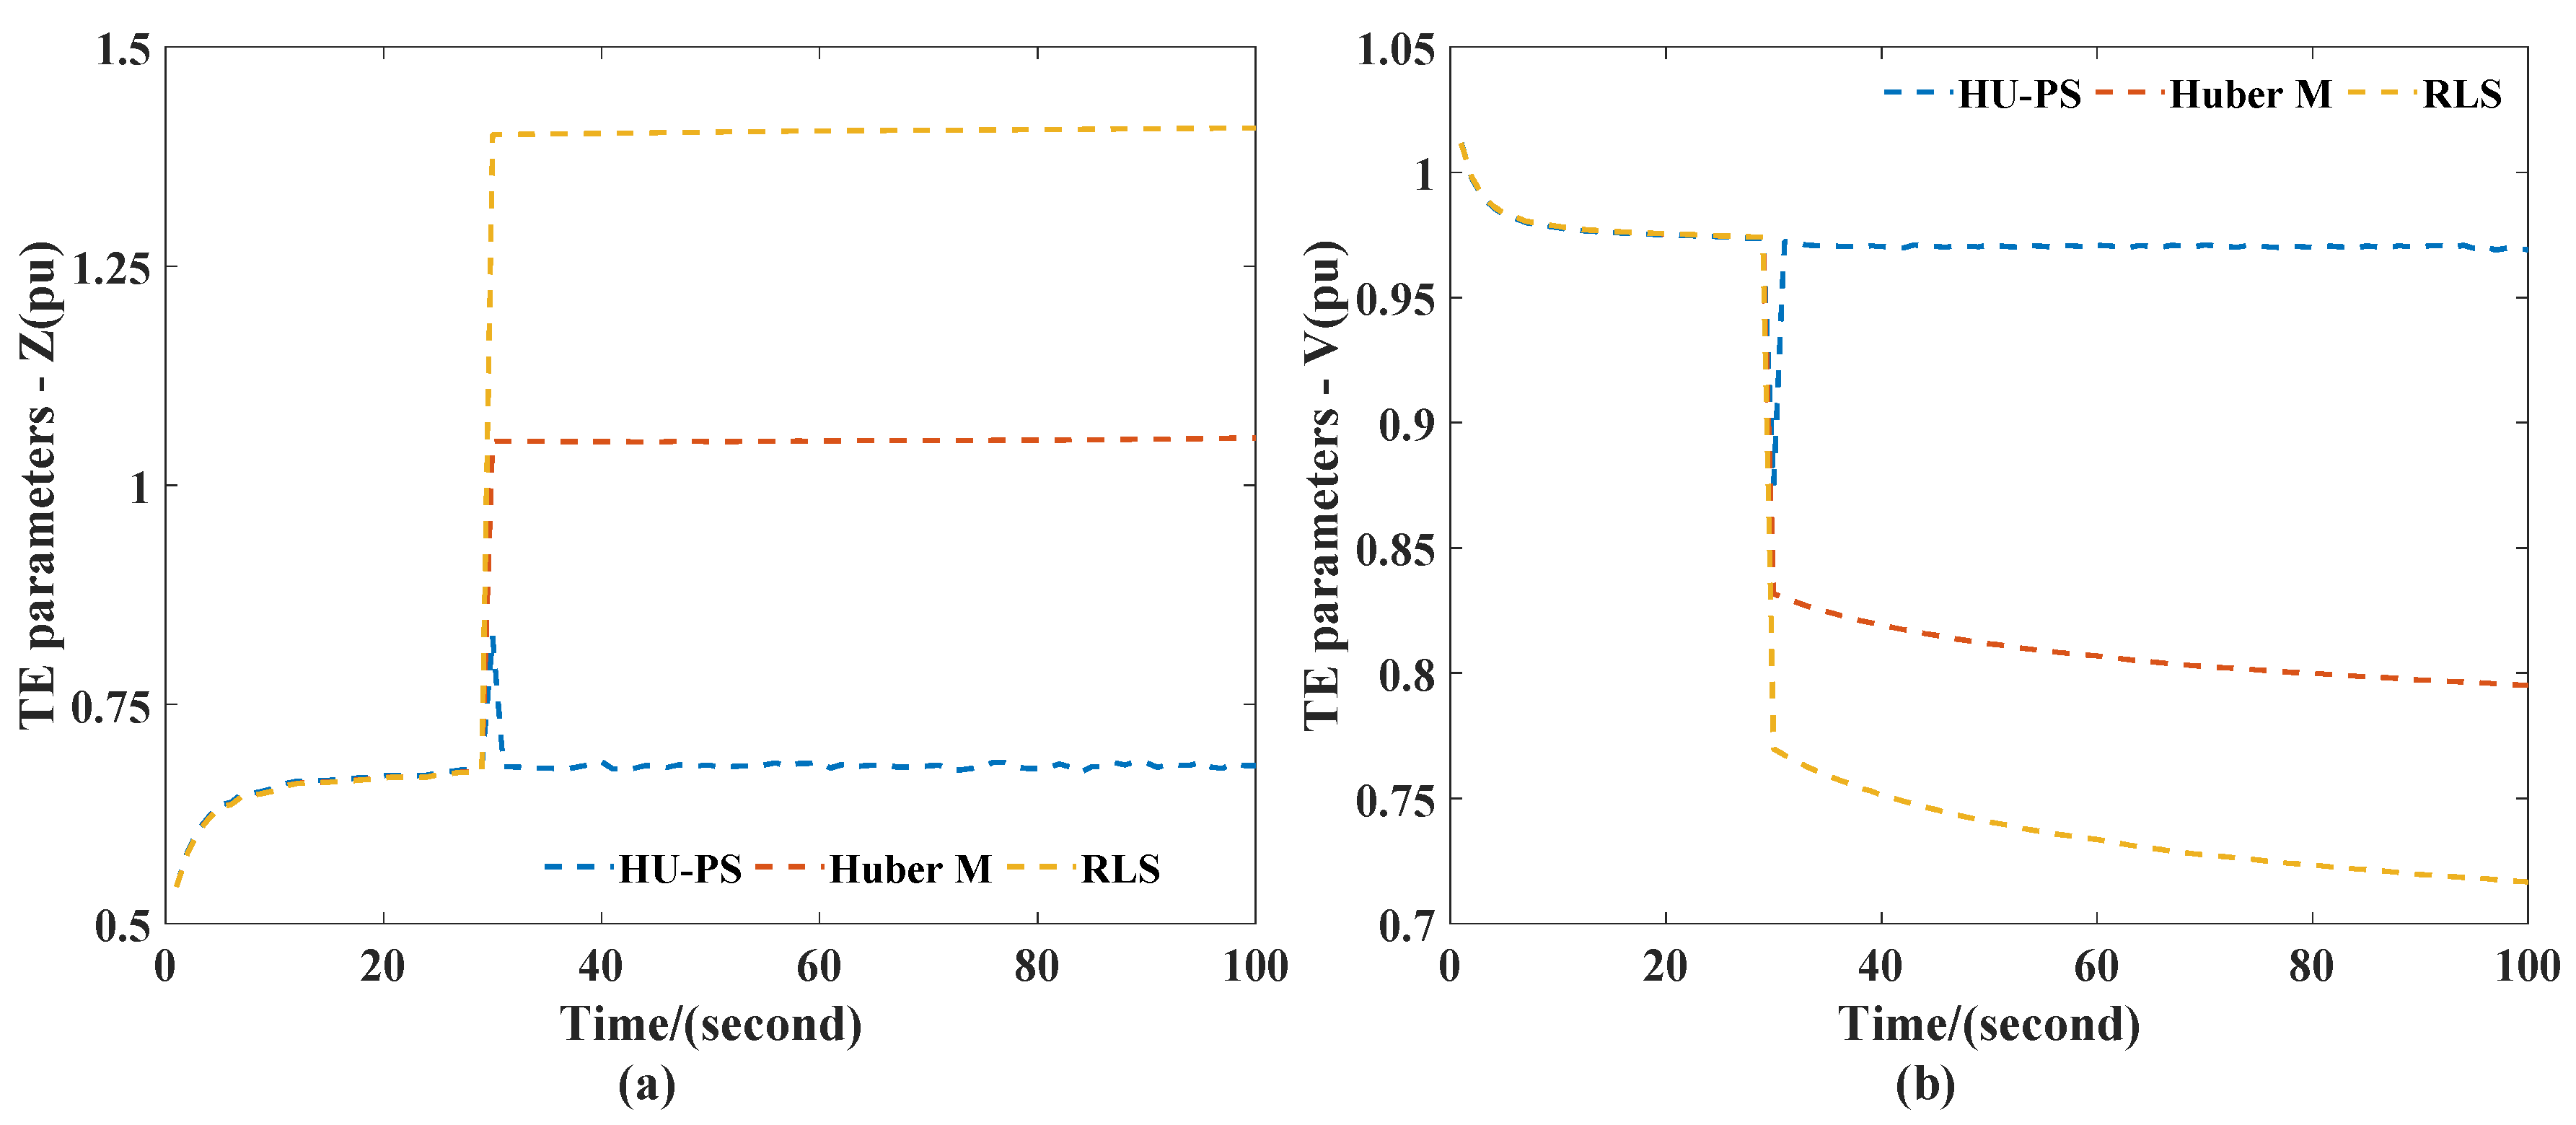
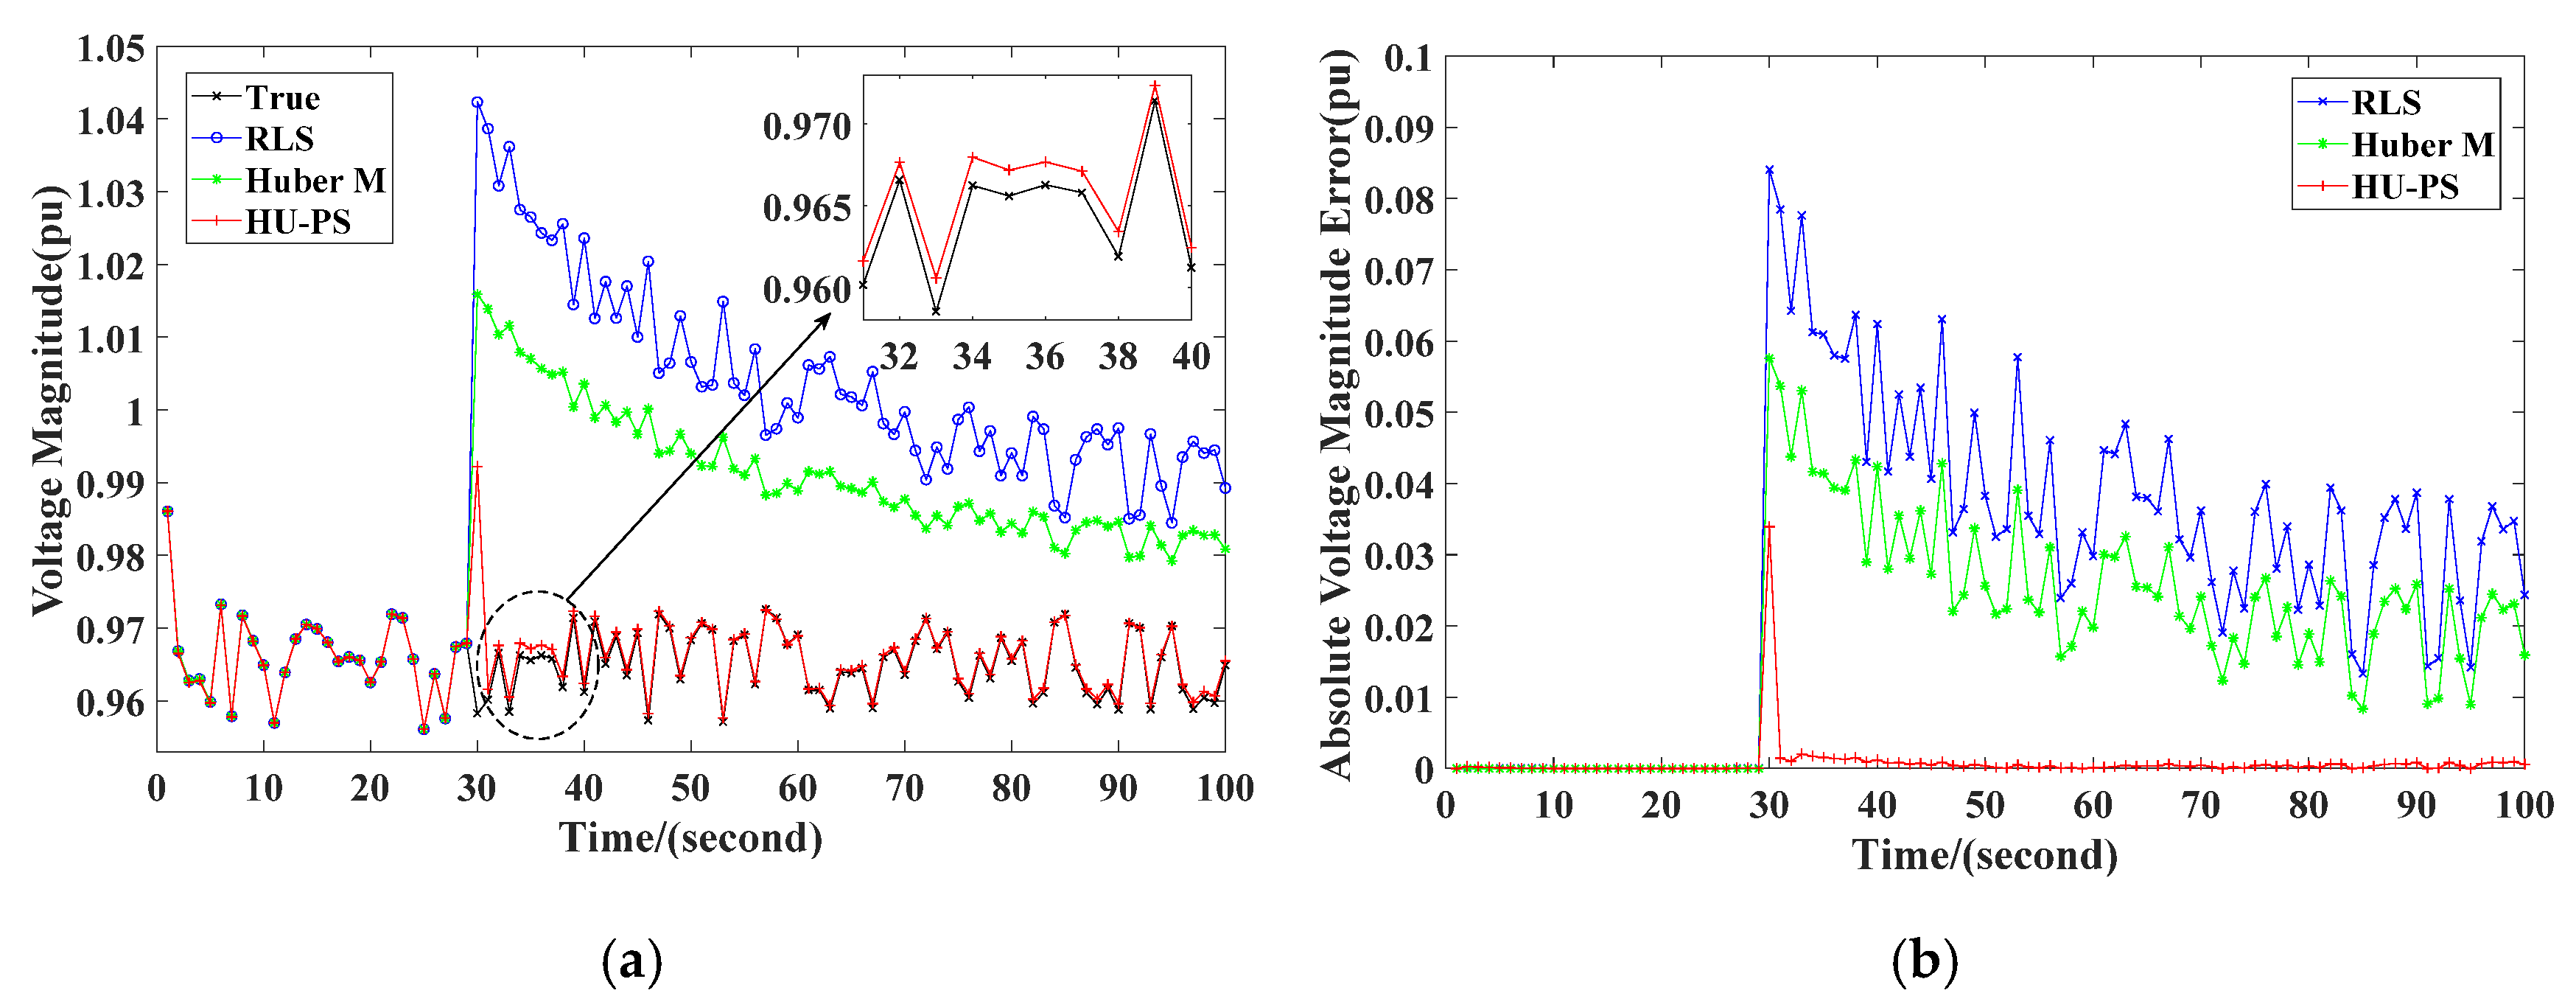
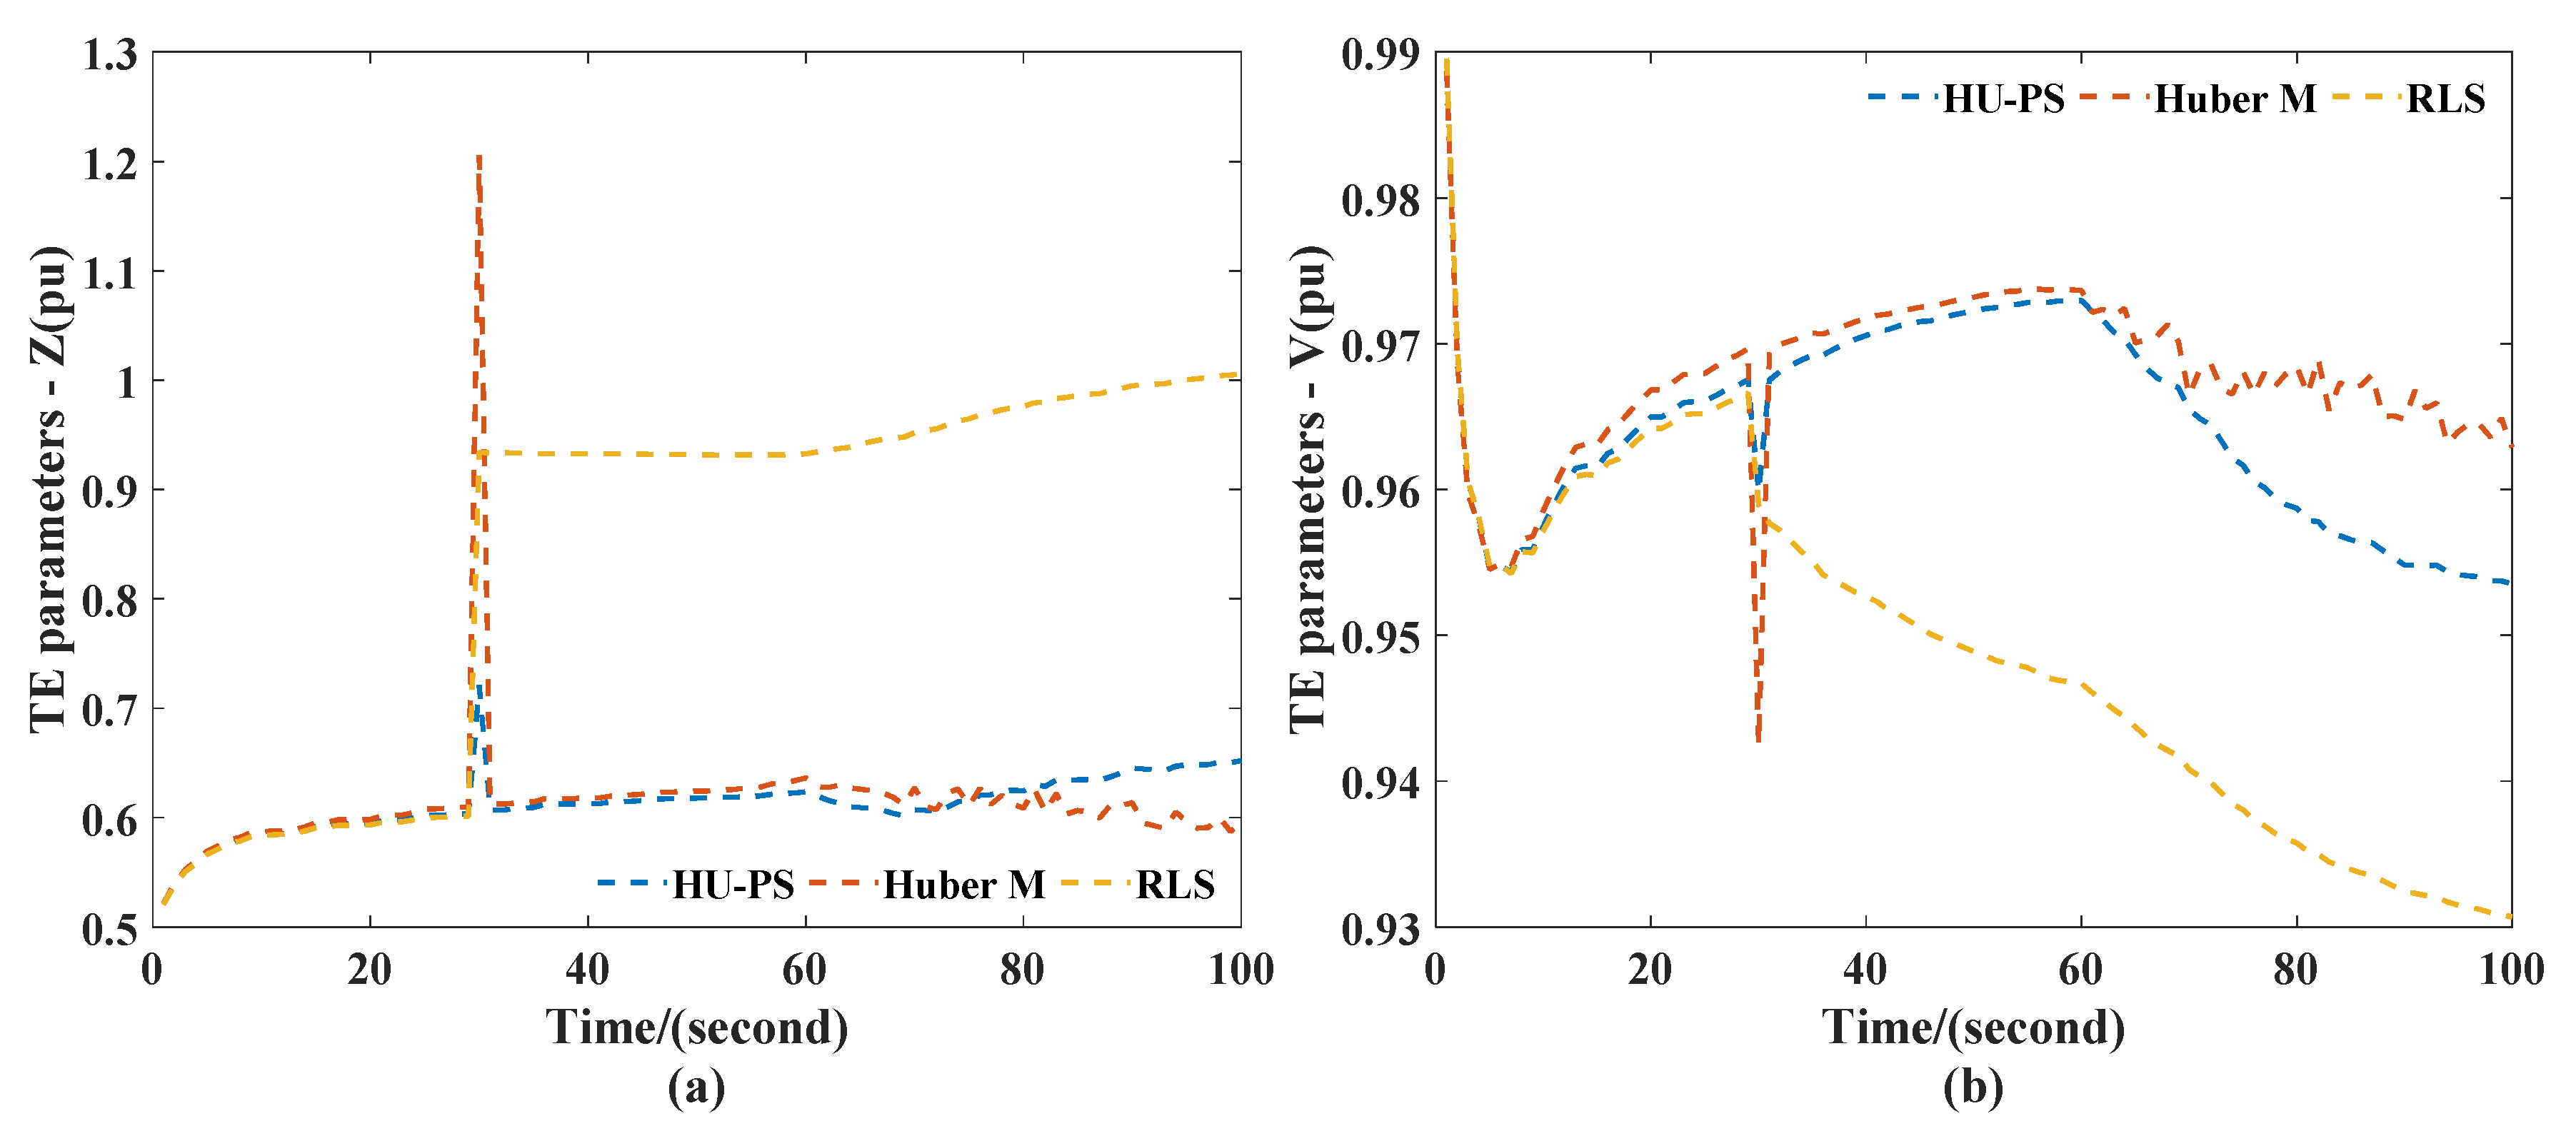
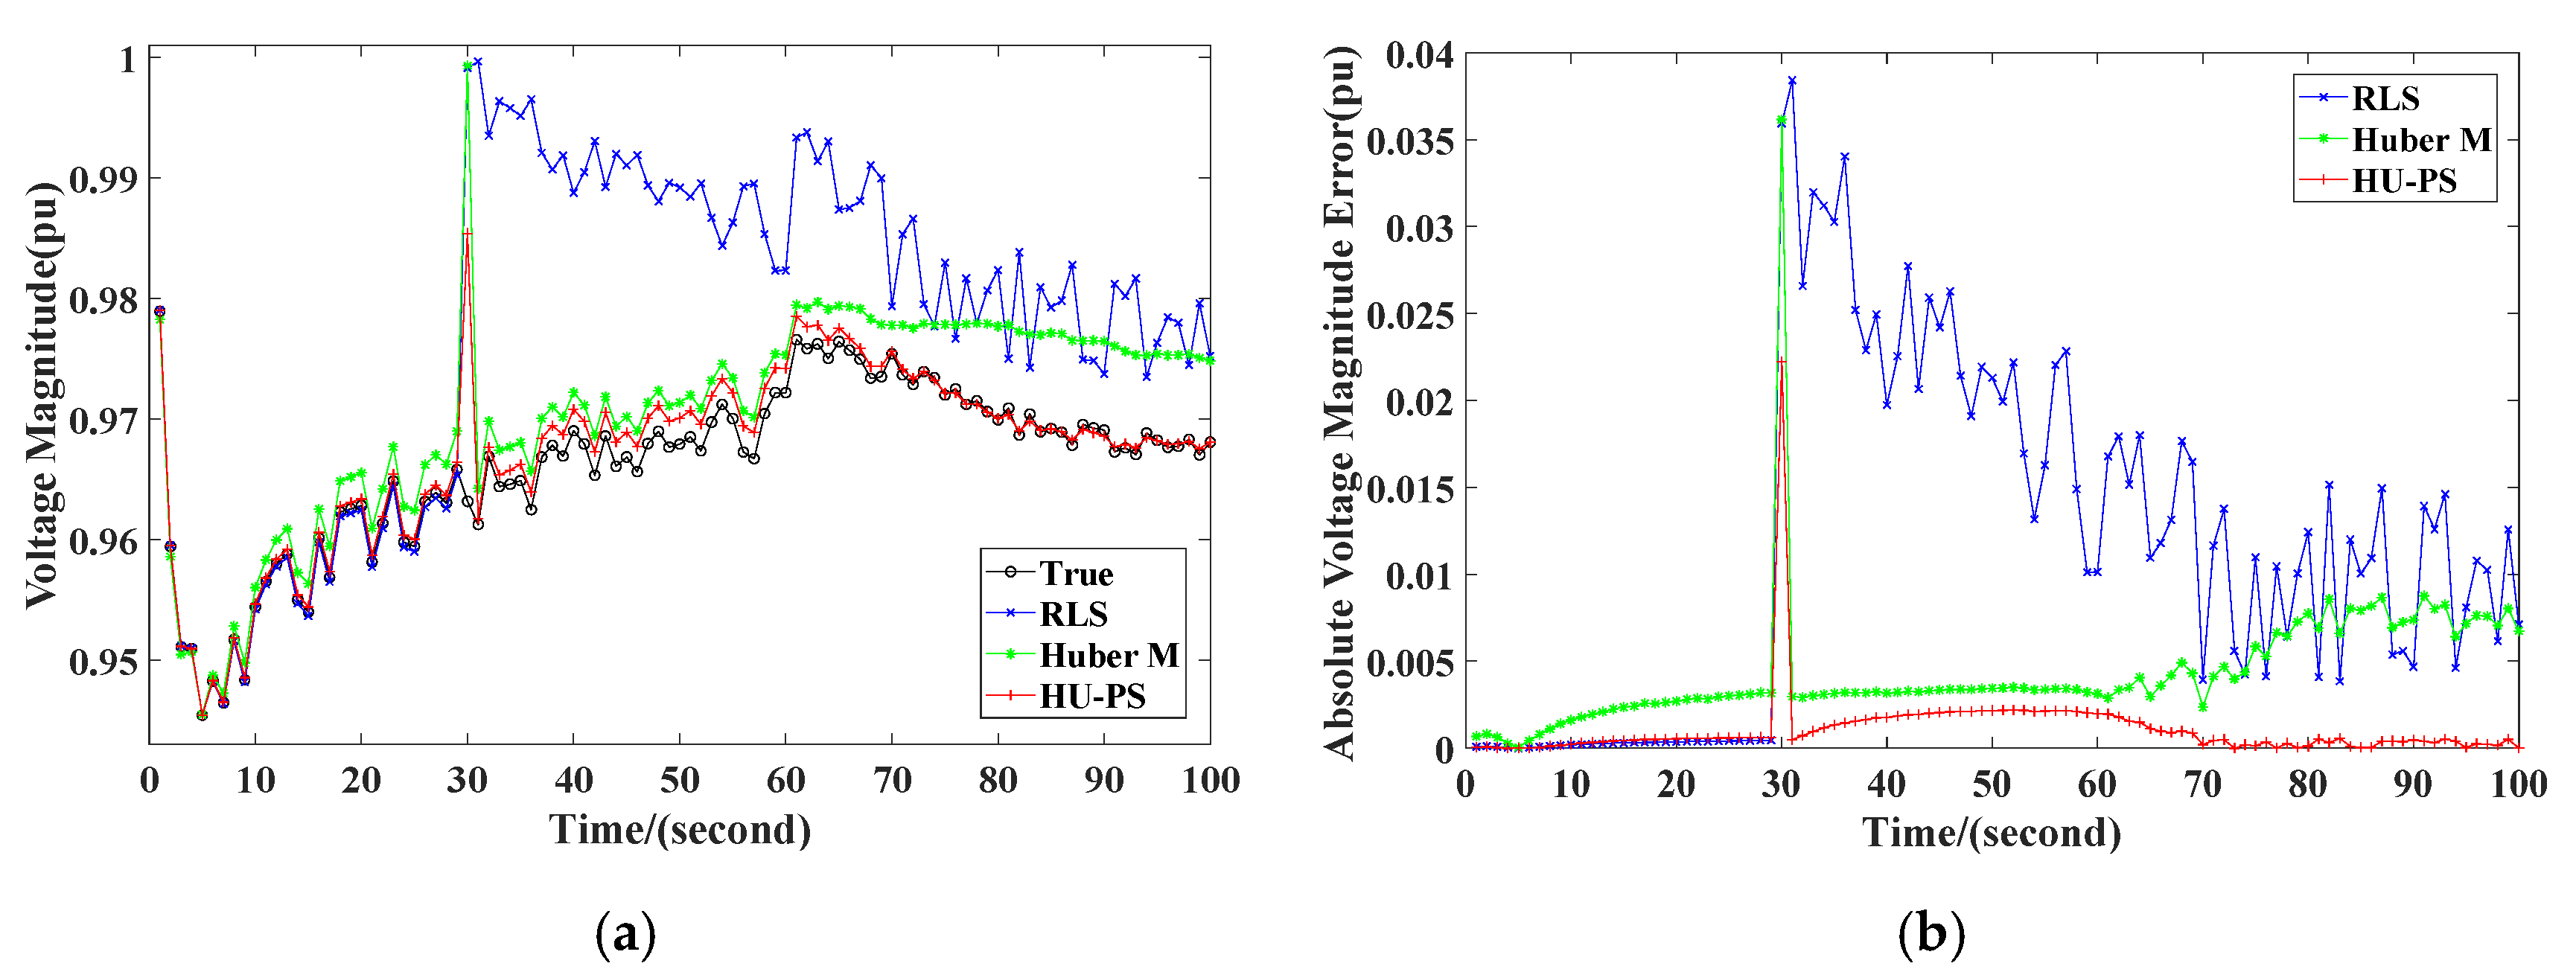
3.1.1. Scenario 1: Leverage in the Measurement Data
3.1.2. Scenario 2: Outlier in the Measurement Data.
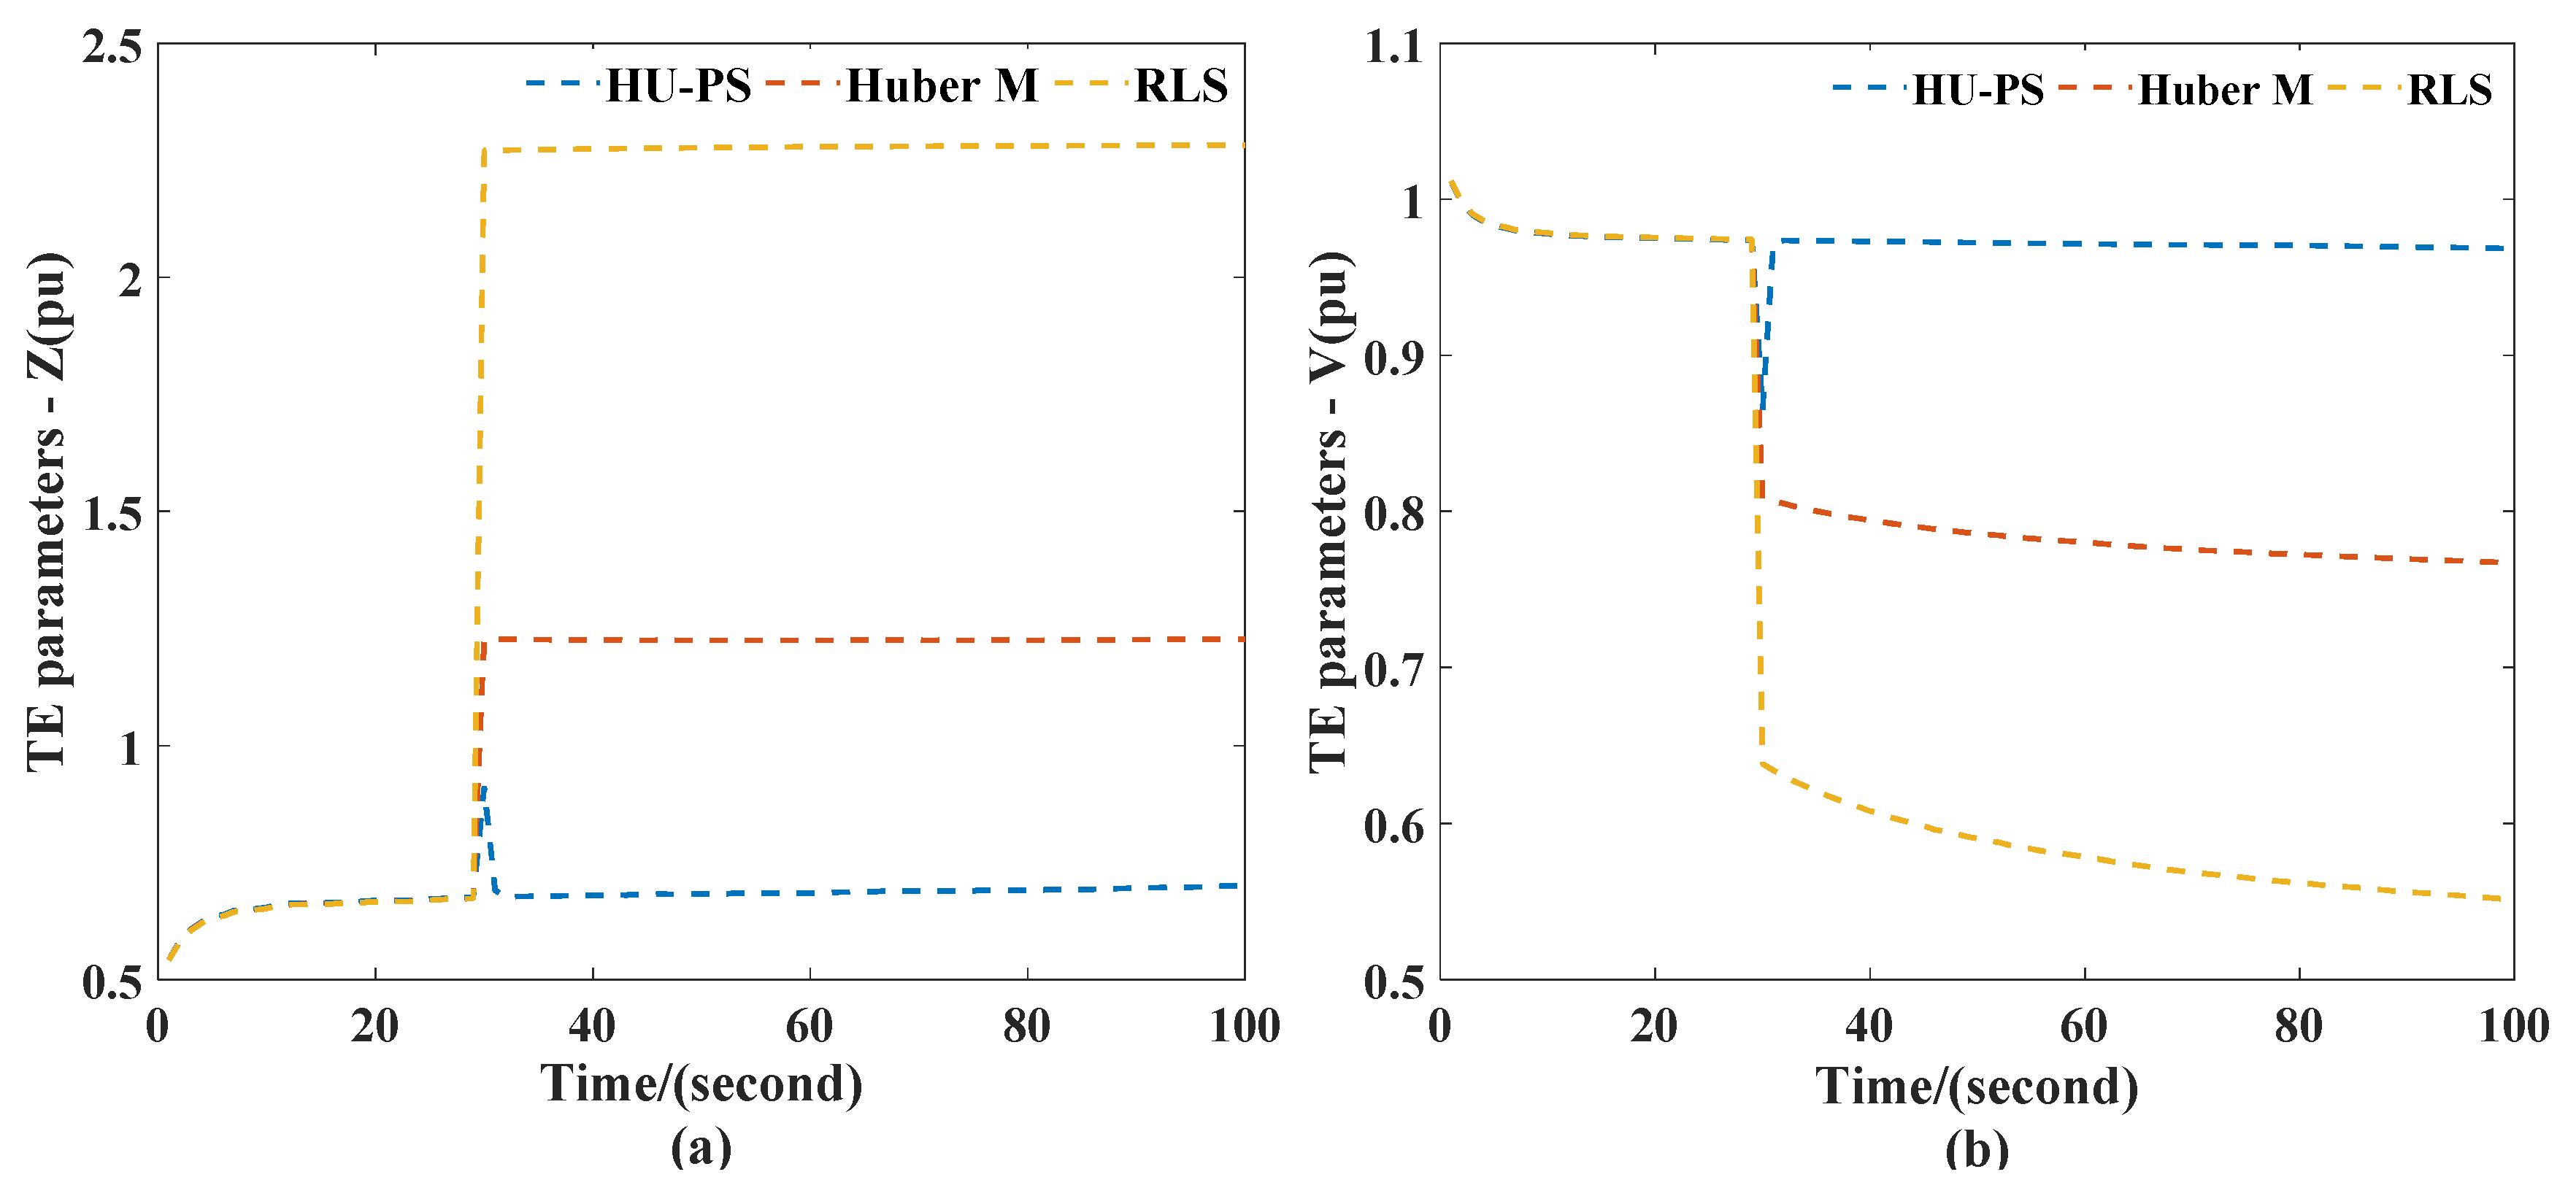
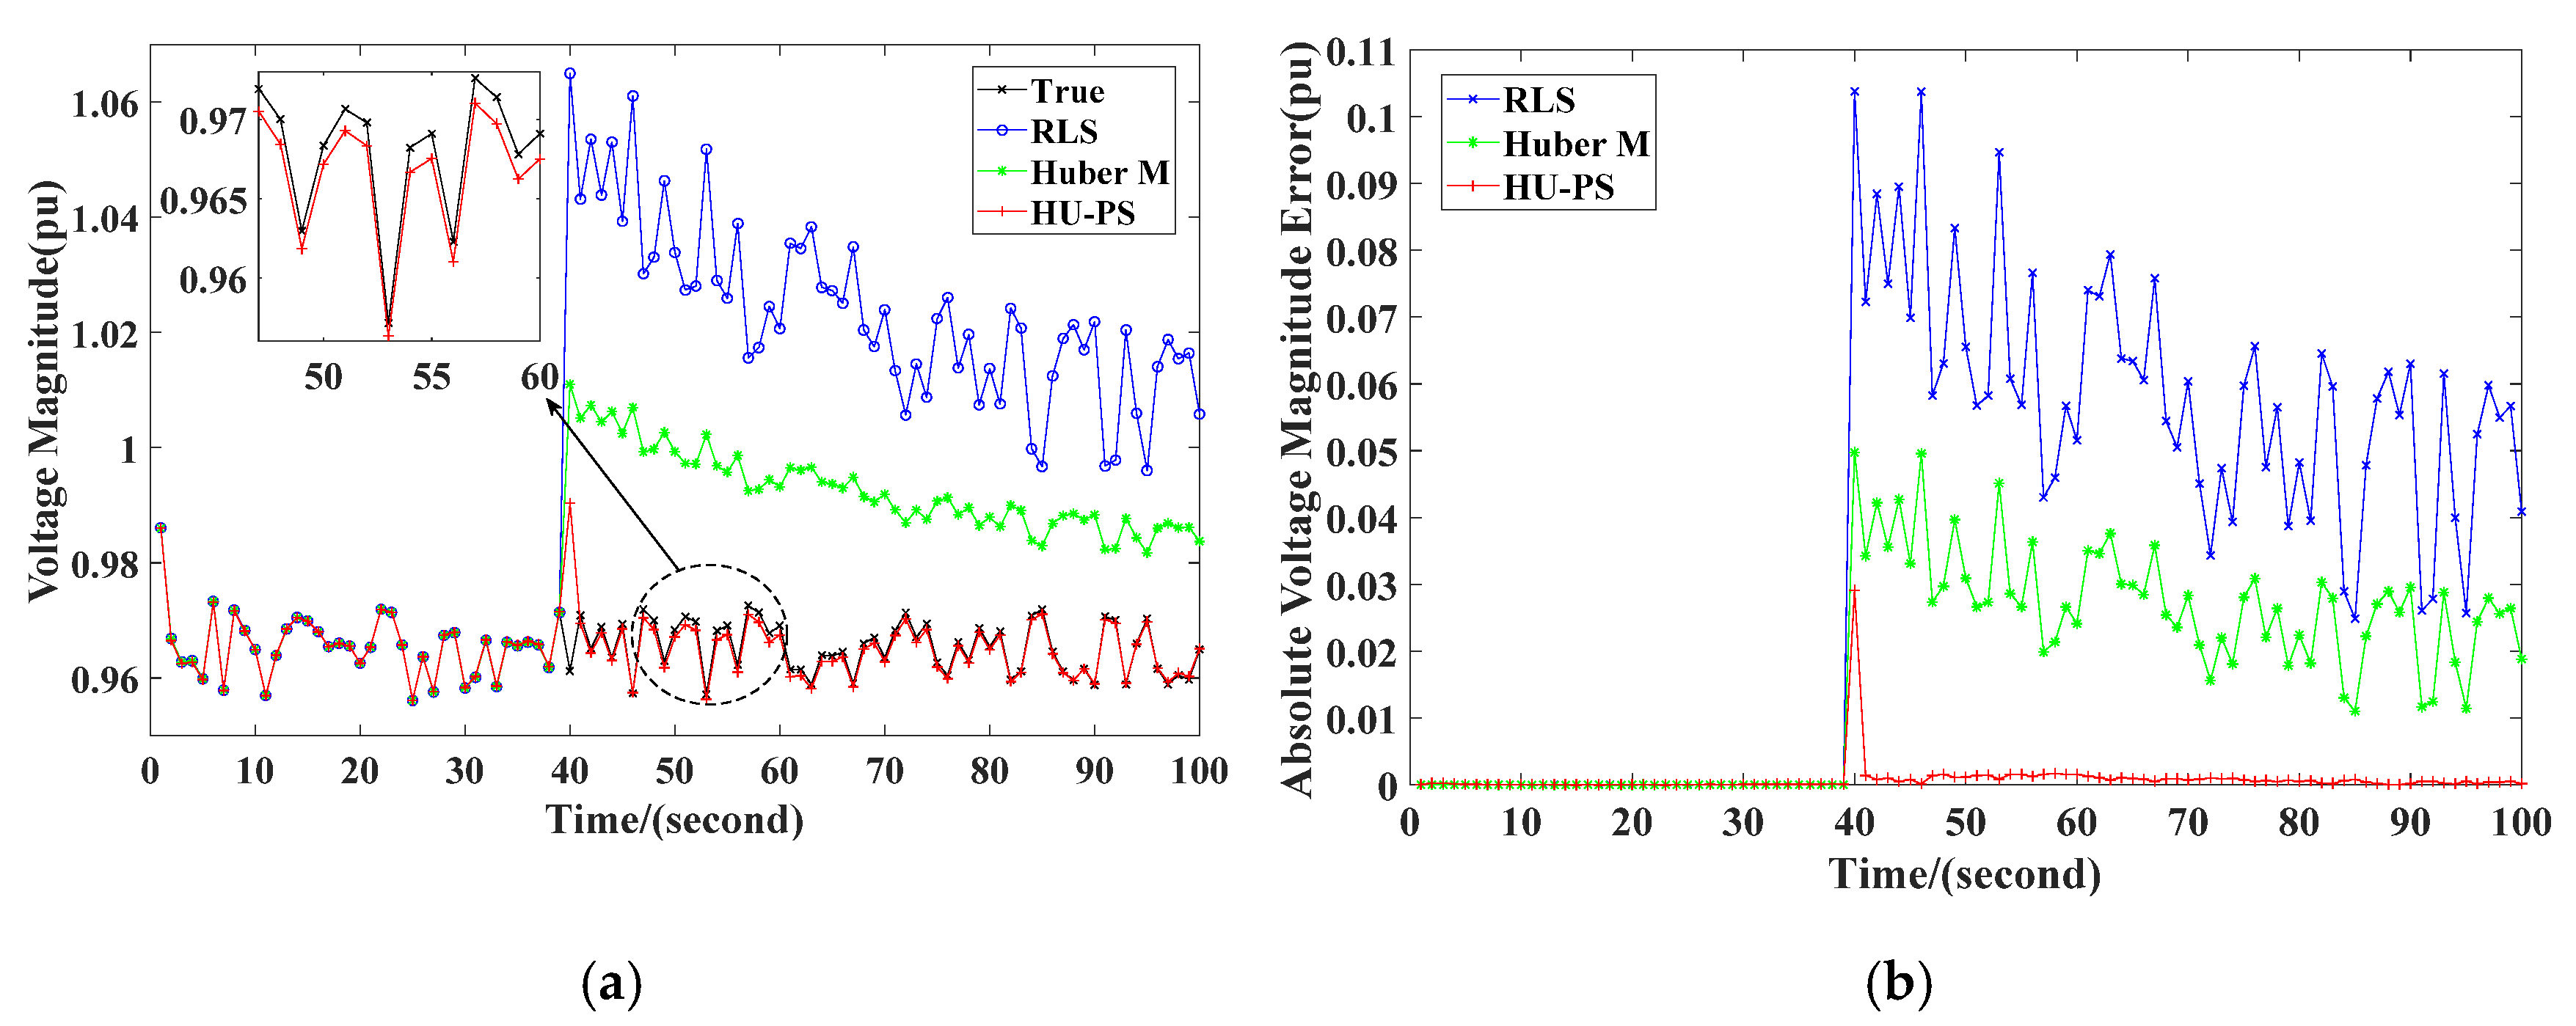
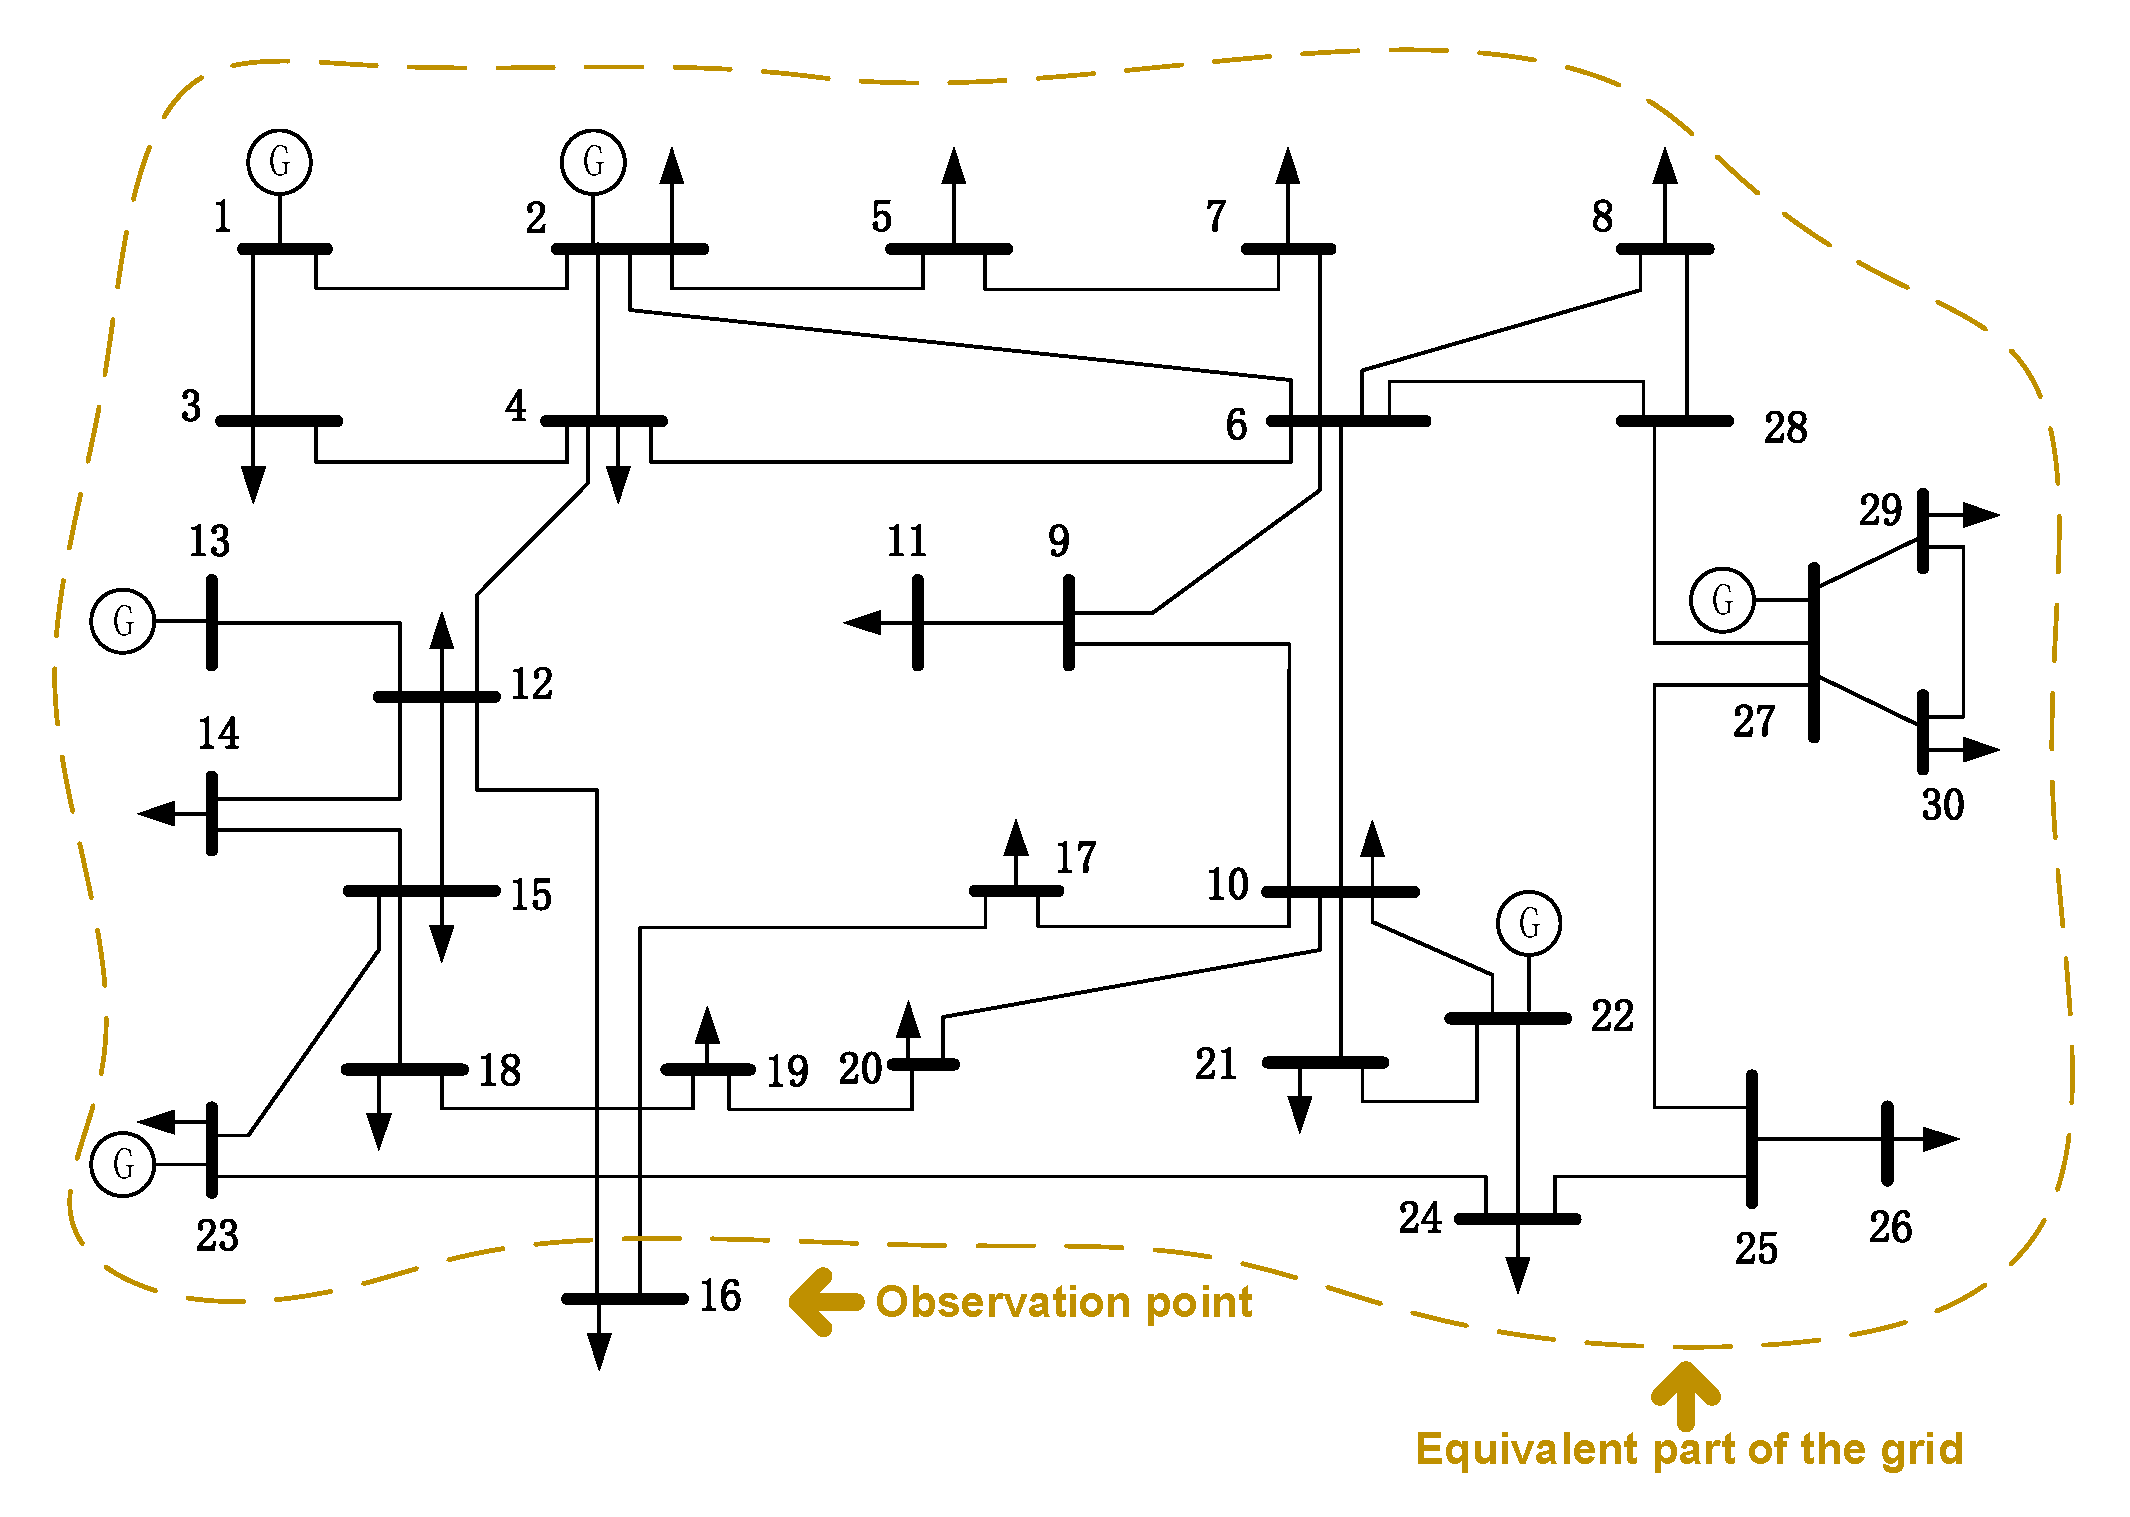
3.2. Case II: Simulation Verification on IEEE 30-Bus System
- (1)
- Scenario 1: selected the values at the 30th second as the original values, and increased the voltage and current values to 2.8 and 20 times, respectively, as the leverage measurement. VFF was used in the Huber’s M-Estimation algorithm. At the 60th second, the branch of node 26 was cut off.
- (2)
- Scenario 2: selected the values at the 30th second as the original values and increased them by 4 times as the outliers. VFF was used in the Huber’s M-Estimation algorithm. At the 60th second, the output of the generator of node 27 decreased.
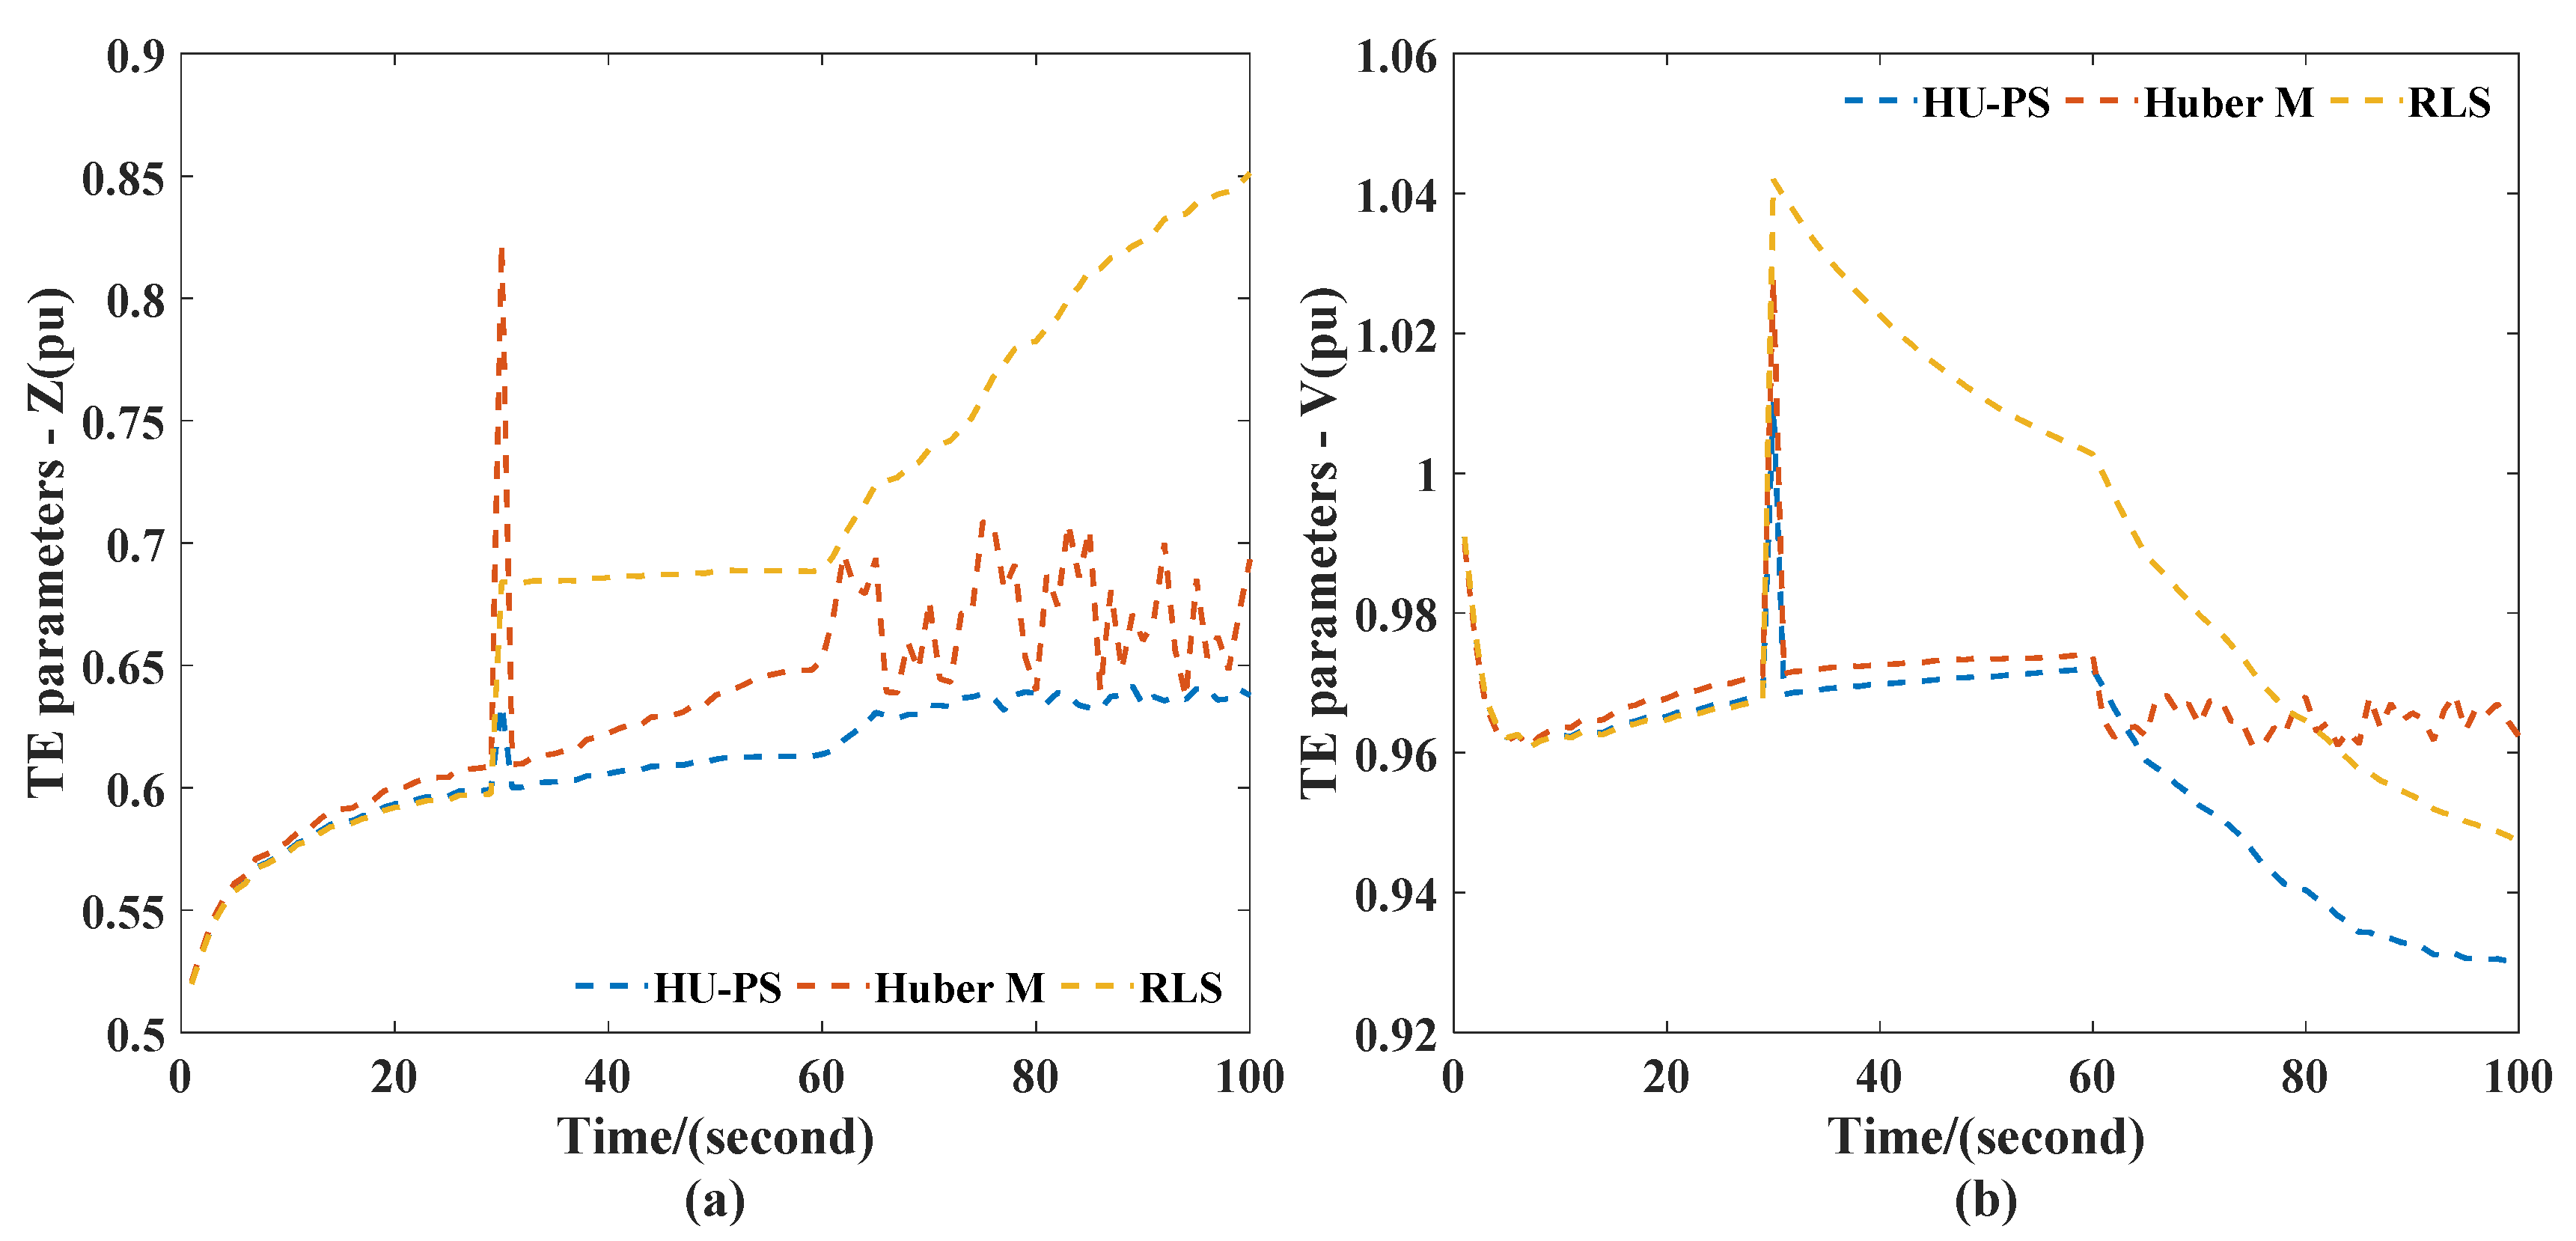
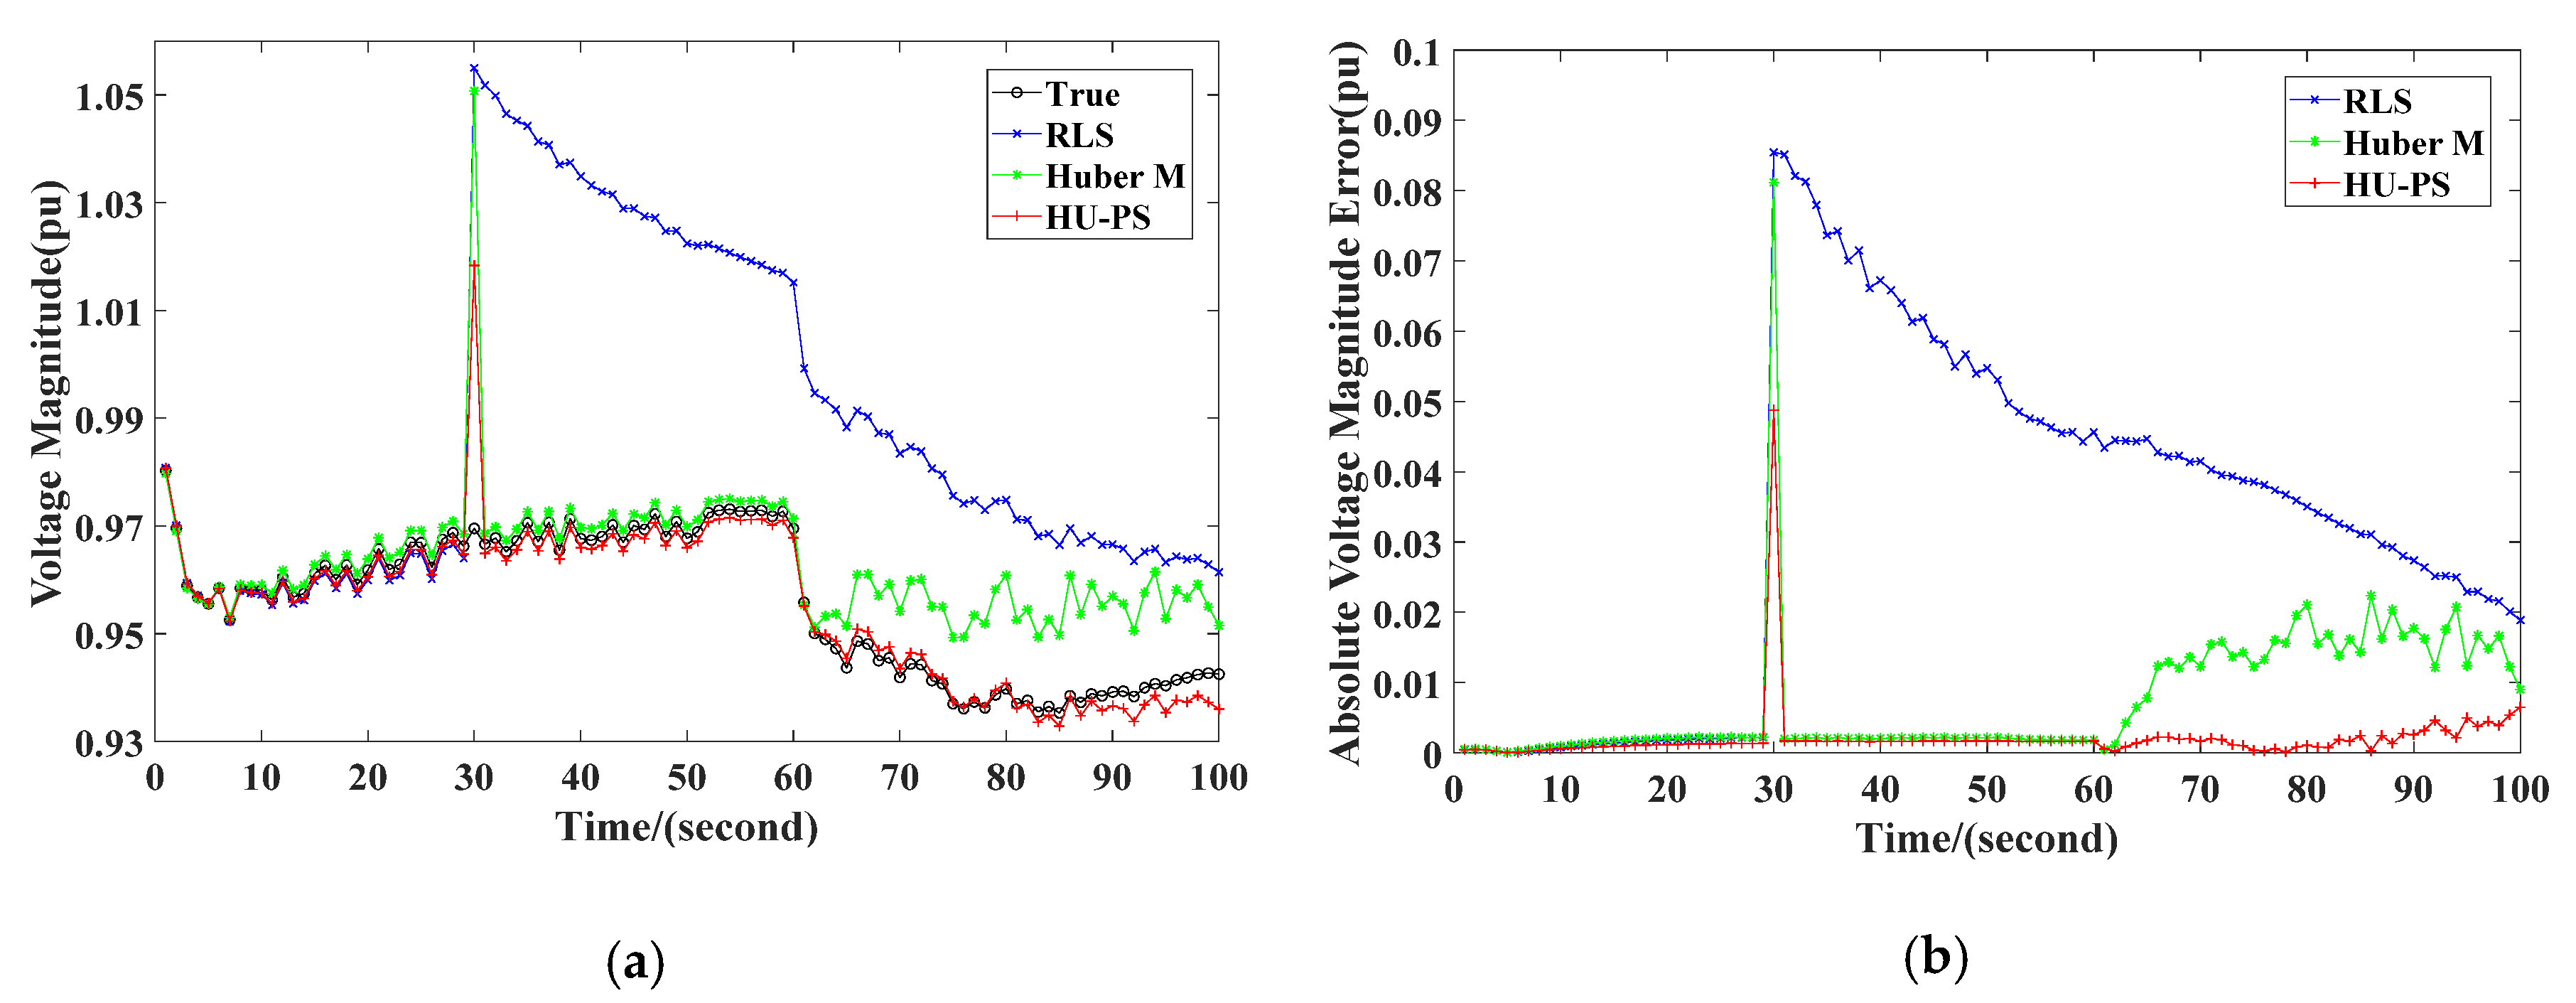
3.2.1. Scenario 1: System Branch Was Cut Off.
3.2.2. Scenario 2: The Output of the System Generator Was Reduced.
4. Conclusions
- (1)
- Huber function and PS are introduced to eliminate the influence of erroneous measurements and model uncertainty in PMU measurement data.
- (2)
- With the proposed VFF, the shortcomings of the fixed forgetting factor that converges slowly when the system changes suddenly can be overcome, thereby further enhancing the real-time tracking ability and adaptability of online estimation.
- (3)
- The dynamic tracking ability and adaptability of the TEP solution algorithm are improved through recursion theory.
Author Contributions
Funding
Conflicts of Interest
Appendix A

References
- Al-Mohammed, A.H.; Abido, M.A. A Fully Adaptive PMU-Based Fault Location Algorithm for Series-Compensated Lines. IEEE Trans. Power Syst. 2014, 29, 2129–2137. [Google Scholar] [CrossRef]
- Matavalam, A.R.R.; Singhal, A.; Ajjarapu, V. Monitoring Long Term Voltage Instability due to Distribution & Transmission Interaction using Unbalanced μPMU & PMU Measurements. IEEE Trans. Smart Grid 2019, 11, 873–883. [Google Scholar]
- Su, H.-Y.; Liu, C.-W. Estimating the Voltage Stability Margin Using PMU Measurements. IEEE Trans. Power Syst. 2015, 31, 3221–3229. [Google Scholar] [CrossRef]
- Shen, S.; Lin, D.; Wang, H.; Hu, P.; Jiang, K.; Lin, D.; He, B. An Adaptive Protection Scheme for Distribution Systems with DGs Based on Optimized Thevenin Equivalent Parameters Estimation. IEEE Trans. Power Deliv. 2015, 32, 411–419. [Google Scholar] [CrossRef]
- Mazhari, S.M.; Safari, N.; Chung, C.Y.; Kamwa, I. A Hybrid Fault Cluster and Thévenin Equivalent Based Framework for Rotor Angle Stability Prediction. IEEE Trans. Power Syst. 2018, 33, 5594–5603. [Google Scholar] [CrossRef]
- Hentunen, A.; Lehmuspelto, T.; Suomela, J. Time-Domain Parameter Extraction Method for Thévenin-Equivalent Circuit Battery Models. IEEE Trans. Energy Convers. 2014, 29, 558–566. [Google Scholar] [CrossRef]
- Arancibia, A.; Soriano–Rangel, C.A.; Mancilla-David, F.; Ortega, R.; Strunz, K. Finite–time identification of the Thévenin equivalent parameters in power grids. Int. J. Electr. Power Energy Syst. 2020, 116, 105534. [Google Scholar] [CrossRef]
- Yun, Z.; Cui, X.; Ma, K. Online Thevenin Equivalent Parameter Identification Method of Large Power Grids Using LU Factorization. IEEE Trans. Power Syst. 2019, 34, 4464–4475. [Google Scholar] [CrossRef]
- Vasquez, J.A.V.; Matavalam, A.R.R.; Ajjarapu, V. Fast calculation of Thévenin equivalents for real-time steady state voltage stability estimation. In Proceedings of the 48th North American Power Symposium (NAPS), Denver, CO, USA, 18–20 September 2016; pp. 1–7. [Google Scholar]
- Hashmi, U.; Choudhary, R.; Priolkar, J.G.; Umar, H. Online thevenin equivalent parameter estimation using nonlinear and linear recursive least square algorithm. In Proceedings of the 2015 IEEE International Conference on Electrical, Computer and Communication Technologies (ICECCT), Coimbatore, India, 5–7 March 2015; pp. 1–6. [Google Scholar]
- Vu, K.; Begovic, M.M.; Novosel, D.; Saha, M.M. Use of local measurements to estimate voltage-stability margin. IEEE Trans. Power Syst. 2002, 14, 1029–1035. [Google Scholar] [CrossRef]
- Wang, Y.; Li, W.; Lu, J. A new node voltage stability index based on local voltage phasors. Electr. Power Syst. Res. 2009, 79, 265–271. [Google Scholar] [CrossRef]
- Haji, M.M.; Xu, W. Online Determination of External Network Models Using Synchronized Phasor Data. IEEE Trans. Smart Grid 2016, 9, 635–643. [Google Scholar] [CrossRef]
- Corsi, S.; Taranto, G. A Real-Time Voltage Instability Identification Algorithm Based on Local Phasor Measurements. IEEE Trans. Power Syst. 2008, 23, 1271–1279. [Google Scholar] [CrossRef]
- Wang, Y.; Pordanjani, I.R.; Li, W.; Xu, W.; Chen, T.; Vaahedi, E.; Gurney, J. Voltage Stability Monitoring Based on the Concept of Coupled Single-Port Circuit. IEEE Trans. Power Syst. 2011, 26, 2154–2163. [Google Scholar] [CrossRef]
- Vanouni, M. Discussion of “Online tracking of Thévenin equivalent parameters using PMU measurements”. IEEE Trans. Power Syst. 2013, 28, 1899. [Google Scholar] [CrossRef]
- Abdelkader, S.; Morrow, D.J. Online Tracking of Thévenin Equivalent Parameters Using PMU Measurements. IEEE Trans. Power Syst. 2012, 27, 975–983. [Google Scholar] [CrossRef]
- Alinezhad, B.; Karegar, H.K.; Alinejad, B. On-Line Thévenin Impedance Estimation Based on PMU Data and Phase Drift Correction. IEEE Trans. Smart Grid 2016, 9, 1033–1042. [Google Scholar] [CrossRef]
- Smon, I.; Verbic, G.; Gubina, F. Local voltage-stability index using Tellegen’s theorem. IEEE Trans. Power Syst. 2006, 21, 1267–1275. [Google Scholar] [CrossRef]
- Matavalam, A.R.R.; Ajjarapu, V. Sensitivity based Thevenin index with systematic inclusion of reactive power limits. IEEE Trans. Power Syst. 2017, 33, 932–942. [Google Scholar] [CrossRef]
- Abdelkader, S.; Morrow, D.J. Online Thévenin Equivalent Determination Considering System Side Changes and Measurement Errors. IEEE Trans. Power Syst. 2014, 30, 2716–2725. [Google Scholar] [CrossRef]
- Burchett, S.M.; Douglas, D.; Ghiocel, S.G.; Liehr, M.W.A.; Chow, J.H.; Kosterev, D.; Faris, A.; Heredia, E.; Matthews, G.H.; Liehr, M. An Optimal Thévenin Equivalent Estimation Method and its Application to the Voltage Stability Analysis of a Wind Hub. IEEE Trans. Power Syst. 2018, 33, 3644–3652. [Google Scholar] [CrossRef]
- Abdelkader, S.; Eladl, A.; Saeed, M.A.; Morrow, D.J. Online Thévenin equivalent determination using graphical phasor manipulation. Int. J. Electr. Power Energy Syst. 2018, 97, 233–239. [Google Scholar] [CrossRef]
- Islam, M.N.; Ongsakul, W. Thevenin equivalent parameter tracking for on-line voltage stability assessment. In Proceedings of the 2015 IEEE Innovative Smart Grid Technologies—Asia (ISGT ASIA), Bangkok, Thailand, 3–6 November 2015; pp. 1–7. [Google Scholar] [CrossRef]
- Wang, C.; Qin, Z.; Hou, Y.; Yan, J. Multi-Area Dynamic State Estimation with PMU Measurements by an Equality Constrained Extended Kalman Filter. IEEE Trans. Smart Grid 2016, 9, 900–910. [Google Scholar] [CrossRef]
- Su, H.-Y.; Liu, T.-Y. Robust Thevenin Equivalent Parameter Estimation for Voltage Stability Assessment. IEEE Trans. Power Syst. 2018, 33, 4637–4639. [Google Scholar] [CrossRef]
- Zhou, N.; Pierre, J.W.; Trudnowski, D.J.; Guttromson, R.T. Robust RLS Methods for Online Estimation of Power System Electromechanical Modes. IEEE Trans. Power Syst. 2007, 22, 1240–1249. [Google Scholar] [CrossRef]
- Zhou, N.; Trudnowski, D.; Pierre, J.; Mittelstadt, W. Electromechanical Mode Online Estimation Using Regularized Robust RLS Methods. IEEE Trans. Power Syst. 2008, 23, 1670–1680. [Google Scholar] [CrossRef]
- Peker, E.; Wiesel, A. Fitting Generalized Multivariate Huber Loss Functions. IEEE Signal Process. Lett. 2016, 23, 1647–1651. [Google Scholar] [CrossRef]
- An, T.; Zhou, S.; Yu, J.; Lu, W.; Zhang, Y. Research on Illed-Conditioned Equations in Tracking Thevenin Equivalent Parameters with Local Measurements. In Proceedings of the 2006 International Conference on Power System Technology, Chongqing, China, 22–26 October 2006; pp. 1–4. [Google Scholar]
- Roca, I.L.; Carvalho, P.M. Solving Ill-Conditioned State-Estimation Problems in Distribution Grids with Hidden-Markov Models of Load Dynamics. IEEE Trans. Power Syst. 2020, 35, 284–292. [Google Scholar] [CrossRef]
- Kovacevic, B.; Milosavljevic, M.; Veinović, M. Robust recursive AR speech analysis. Signal Process. 1995, 44, 125–138. [Google Scholar] [CrossRef]
- IEEE Standard Association. C37.118.1-2011—IEEE Standard for Synchrophasor Measurements for Power Systems; IEEE Standard Association: New York, NY, USA, 2011. [Google Scholar] [CrossRef]
- Chang, L.; Li, K.; Hu, B. Huber’s M-Estimation-Based Process Uncertainty Robust Filter for Integrated INS/GPS. IEEE Sens. J. 2015, 15, 3367–3374. [Google Scholar] [CrossRef]
- Wang, S.; Zhang, W.; Yin, C.; Feng, Y. Huber-based Unscented Kalman Filters with the q-gradient. IET Sci. Meas. Technol. 2017, 11, 380–387. [Google Scholar] [CrossRef]
- Zhao, J.; Zhang, G.; Dong, Z.Y.; La Scala, M. Robust Forecasting Aided Power System State Estimation Considering State Correlations. IEEE Trans. Smart Grid 2016, 9, 2658–2666. [Google Scholar] [CrossRef]
- Golub, G.H.; van Loan, C.F. Matrix Computations; JHU Press: Baltimore, MD, USA, 2012; p. 65. [Google Scholar]


| Scenario | Algorithm | MAER (p.u.) | MAE (p.u.) |
|---|---|---|---|
| 1 | HU-PS | 0.0339 | 0.0007 |
| RLS | 0.0840 | 0.0276 | |
| Huber’s M-Estimation | 0.0576 | 0.0185 | |
| 2 | HU-PS | 0.0291 | 0.0008 |
| RLS | 0.1038 | 0.0356 | |
| Huber’s M-Estimation | 0.0498 | 0.0167 |
| Scenario | Algorithm | MAER (p.u.) | MAE (p.u.) |
|---|---|---|---|
| 1 | HU-PS | 0.0222 | 0.0011 |
| RLS | 0.0384 | 0.0115 | |
| Huber’s M-Estimation | 0.0361 | 0.0044 | |
| 2 | HU-PS | 0.0488 | 0.0021 |
| RLS | 0.0854 | 0.0329 | |
| Huber’s M-Estimation | 0.0811 | 0.0074 |
© 2020 by the authors. Licensee MDPI, Basel, Switzerland. This article is an open access article distributed under the terms and conditions of the Creative Commons Attribution (CC BY) license (http://creativecommons.org/licenses/by/4.0/).
Share and Cite
Zhang, A.; Tan, W.; Cheng, M.; Yang, W. Thévenin Equivalent Parameter Adaptive Robust Estimation Considering the Erroneous Measurements of PMU. Energies 2020, 13, 4865. https://doi.org/10.3390/en13184865
Zhang A, Tan W, Cheng M, Yang W. Thévenin Equivalent Parameter Adaptive Robust Estimation Considering the Erroneous Measurements of PMU. Energies. 2020; 13(18):4865. https://doi.org/10.3390/en13184865
Chicago/Turabian StyleZhang, Anan, Wenting Tan, Ming Cheng, and Wei Yang. 2020. "Thévenin Equivalent Parameter Adaptive Robust Estimation Considering the Erroneous Measurements of PMU" Energies 13, no. 18: 4865. https://doi.org/10.3390/en13184865
APA StyleZhang, A., Tan, W., Cheng, M., & Yang, W. (2020). Thévenin Equivalent Parameter Adaptive Robust Estimation Considering the Erroneous Measurements of PMU. Energies, 13(18), 4865. https://doi.org/10.3390/en13184865