Article

An Agent-Based Approach for the Planning of Distribution Grids as a Socio-Technical System

by
Luciano Cavalcante Siebert
1,2,
Alexandre Rasi Aoki
2,
Germano Lambert-Torres
3,*,
Nelson Lambert-de-Andrade
3 and
Nikolaos G. Paterakis
4
1
Department of Intelligent Systems, Delft University of Technology, 2628 XE Delft, The Netherlands
2
Department of Electrical Engineering, Federal University of Paraná, Curitiba 82590-300, Brazil
3
Gnarus Institute, Itajubá 37500-052, Brazil
4
Department of Electrical Engineering, Eindhoven University of Technology, 5600MB Eindhoven, The Netherlands
*
Author to whom correspondence should be addressed.
Energies 2020, 13(18), 4837; https://doi.org/10.3390/en13184837
Submission received: 29 June 2020 / Revised: 30 August 2020 / Accepted: 3 September 2020 / Published: 16 September 2020

Abstract

:
Recent developments, such as smart metering, distributed energy resources, microgrids, and energy storage, have led to an exponential increase in system complexity and have emphasized the need to include customer behavior and social and cultural backgrounds in planning activities. This paper analyzes how emergent behavior in electricity consumption can affect the planning of distribution grids with a smart grid vision. For this, an agent-based model that uses insights from the field of behavioral economics to differentiate four consumer categories (high income, low income, middle class, and early adopters) was used. The model was coupled with a real distribution feeder and customer load curve data, and the results showed that heterogeneity of customer’s preferences, values, and behavior led to very distinct load growth patterns. The results emphasize the relevance of modeling customer’s behavioral aspects in planning increasingly complex power systems.

Graphical Abstract

1. Introduction

Since the deregulation of the power and energy sector and the increasing use of automation and distributed control, electrical power systems have increased in not only size and participant agents, but also in complexity. This tendency is emphasized by the increasing participation of consumers in distributed generation (prosumers) and flexibility actions (such as demand response). New business models and technologies, such as automated demand response, peer-to-peer electricity markets, and the increasing participation of electric vehicles and distributed energy storage are expected to change the landscape of power systems in even further [1]. These technologies will make the task of balancing the goals of maximizing asset lifespan, efficiency, reliability, and profitability increasingly complex [2].
Due to their increasing complexity, power systems should be studied as a complex socio-technical system. Approaches to studying it should consider both the social and technical factors that influence its functionality and usage, and acknowledge the complex relationships between organizations, people, and technological systems [3]. While power systems may be present on continental scales, it is not this feature that gives them the characteristic of being a complex system, since size itself does not necessarily lead to complexity. Electrical power system complexity comes from the interactions of the physical layer with the rest of the hierarchical levels governing and using the infrastructure [4], which is a large number of heterogeneous agents acting on different layers such as the physical-layer (generators, transformers, and substations), the cyber-layer (communication units and data management), and the human decision layer. Its complexity, therefore, lies in the multiplicity of interacting players that operate with and within a defined environment as independent decision-makers, with autonomous behaviors, goals, and attitudes. These broader socio-technical networks form a community with high levels of interaction and integration among its actors [5], and for this reason, smart grid technical developments cannot be done in isolation from the environmental, social, and economic environments [6].
In traditional modeling approaches, the main agent of the power grid is the consumer (or even better, the customer), for whom the entire infrastructure is built and for whom the energy is delivered. However, the consumer is often not properly considered. People’s behavior in regards to energy consumption is not easily predictable, and deficiencies in considering cognition processes can lead to overly simplified behavioral assumptions that may jeopardize or even make unfeasible the modeling of consumer energy behavior. Furthermore, the use of traditional approaches may be hindered due to the existence of heterogeneous agents that exhibit nonlinear feedbacks [7]. Hence, we need approaches that go beyond the conventional and simplifying homo economicus assumption, in which humans are considered to be agents that are consistent, self-interested, and pursue their goals optimally. In other words, it is necessary to acknowledge that the cognitive limitations (particularly concerning computational and predictive ability) of humans can at best be an extremely crude and simplified approximation of global rationality [8].
This paper analyzes how emergent complex behavior on the electricity consumption of residential consumers can affect the planning of distribution grids under a smart grid vision. For this, an agent-based model that uses insights from the field of behavioral economics to differentiate four consumer categories (e.g., prosumers and early adopters) was used and was adapted from the model presented in Reference [9]. The main contribution of this paper is to show that planning studies on distribution systems can (and should) be supported by the proper modeling of customer behavior. For this, we coupled and simulated the model with a real distribution feeder and customer load curve data. The results showed that the heterogeneity of customer’s preferences, values, and behaviors lead to varied emergent load growth behaviors on the system level.
The remainder of this paper is structured as follows: Section 2 analyzes residential electricity consumer behavior. Section 3 presents the developed methodology, followed by Section 4, which presents the materials and results of our case study. Finally, Section 5 presents the conclusions of this work.

2. Analysis of Residential Electricity Consumer Behavior

The analysis of consumer behavior and modeling of power systems should go beyond financial aspects. While price undoubtedly affects energy consumption, this factor has often not been as influential as one may have assumed. For residential electricity consumers, energy bills can be a rather small part of the household budget, making behavioral changes seem to not be “worth the effort.” The choice and design of interventions should be well understood and evidence-based to increase the likelihood of the success of interventions with customers.
Monetary incentives (such as demand response) have several downsides, such as the rebound effect [10,11], since people may feel entitled not to act efficiently. When monetary savings are relatively small (or take a long time to happen), people that focus exclusively on the private cost versus global benefits are not likely to change their consumption patterns. Monetary gains may undermine people’s intrinsic motivation to engage in energy-saving behaviors. Choices, preferences, and behaviors of individuals influence energy demand and shape technologies, strategies, and policies in order to achieve a sustainable energy transition [12]. Many factors influence energy consumption, both intrinsic as extrinsic, and can be divided into six main areas, described in the following sub-sections.

2.1. Values and Beliefs

Values are defined as abstract motivations that guide, justify or explain attitudes, opinions, and actions [13]. They can be divided into hedonic values (what makes people feel good and reduce effort), egoistic values (how to increase their resources), altruistic (benefit others), and biospheric values (focus on nature and the environment) [14]. Energy-related actions related to values are of particular interest because they can affect a wide range of behaviors, making them an essential target in order to promote consistent sustainable energy behavior. Nevertheless, they are usually tough to change [12].
A person’s sense of identity and their way of perceiving themselves are also strong factors in developing certain behaviors. People tend to interpret, favor, and recall information that confirms or supports one’s existing beliefs. If a given action is consistent with one’s beliefs, it may motivate them to act this way again in order to be consistent and act in line with how they see themselves. This is also known as the positive spillover effect [12].
Understanding the values and beliefs that lead end-users to form preferences is especially relevant to the introduction of novel technological concepts for behavioral changes [15]. However, understanding and directing actions toward specific values is very difficult, since what people say and what they do are sometimes very different things. For example, people may know about, intrinsically value, hold positive attitudes towards, and genuinely intend to act in some socially desirable way, but may not translate that into actual behavior [16].

2.2. Behavioral

It is essential to understand the paradigms that shape the behavior and decision-making processes of people [15]. A growing body of scientific research demonstrates that people are rarely the rational decision-makers that traditional economic models of human behavior envisaged them to be. They deviated from this expected behavior in several situations [16], leading to the development of simple heuristics to energy consumption that derive from traditional rational economic models [17]. This derivation comes from different sources, e.g., the restricted or limited information, cognitive biases, risk or loss aversions, or short-sightedness in regards to nearby or immediate cost/benefits.

2.3. Social Norms

Social norms are guidelines and expectations regarding ones’ behavior. They shape the decisions of people to conform to what is socially acceptable [16].
People tend to contribute to a given cause because it makes them feel good about themselves or how they are perceived by other people—the so-called warm glow effect [17,18]. Regarding public goods, such as electricity, most individuals will only collaborate or contribute to a given goal (such as energy efficiency) if others do the same [17]. Thus, on the one hand, highly visible behavior such as driving an electric vehicle or installing residential solar panels can be socially rewarding, but on the other hand, less visible actions such as installing an efficient air-conditioning system may not.
As people tend to compare themselves to other people, peer-based comparative feedback can serve as a stimulus for changing their behavior regarding energy [19]. For example, when people learn that others act more sustainably than they do, and the comparison group is similar to the receiver [12]. Nevertheless, it must be considered that different types of customers respond differently to stimuli, and customized feedback is required to achieve the desired result [20].

2.4. Socio-Demographic

Factors directly related to the user that form the context of their surroundings, such as various socio-demographic indicators (age, gender, education, employment status, household type, and income), also play an essential role in energy consumption [21,22]. Living arrangements, such as the type, size, geographical location, and ownership of the dwelling, determine to a certain extent the users’ electricity patterns of consumption. However, demographic characteristics only partially explain the variance regarding energy and pro-environmental behavior, and are less suitable in predicting energy-saving behavior than attitudinal and behavioral variables [23]. Thus, socio-demographic characteristics come as secondary explanatory variables on top of other internal factors.

2.5. Access to Information and Technology

Technological advances, such as distributed generation, storage systems, smart meters, and home automation, allow distribution system operators to have better insights into the operation of their networks and can also manage bi-directional power flows and resolve local problems in the networks through using services offered by users, such as demand response [11,24]. The digitalization and the application of ICT techniques in electricity networks have opened possibilities for direct and more individualized communication with users. For instance, smart meter data can be visualized on in-home-displays, web portals, or smartphone apps. Therefore companies can provide household electricity consumption feedback, tailored energy conservation tips, and specific alerts to inhabitants when a given device is malfunctioning. This kind of information may help citizens to make better-informed decisions regarding their energy use [25]. Nevertheless, even with abundant information, human computational capability is limited. Rational optimal decisions are not commonplace [9].

2.6. Institutional Arrangements
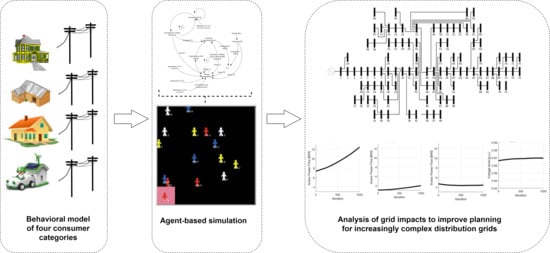
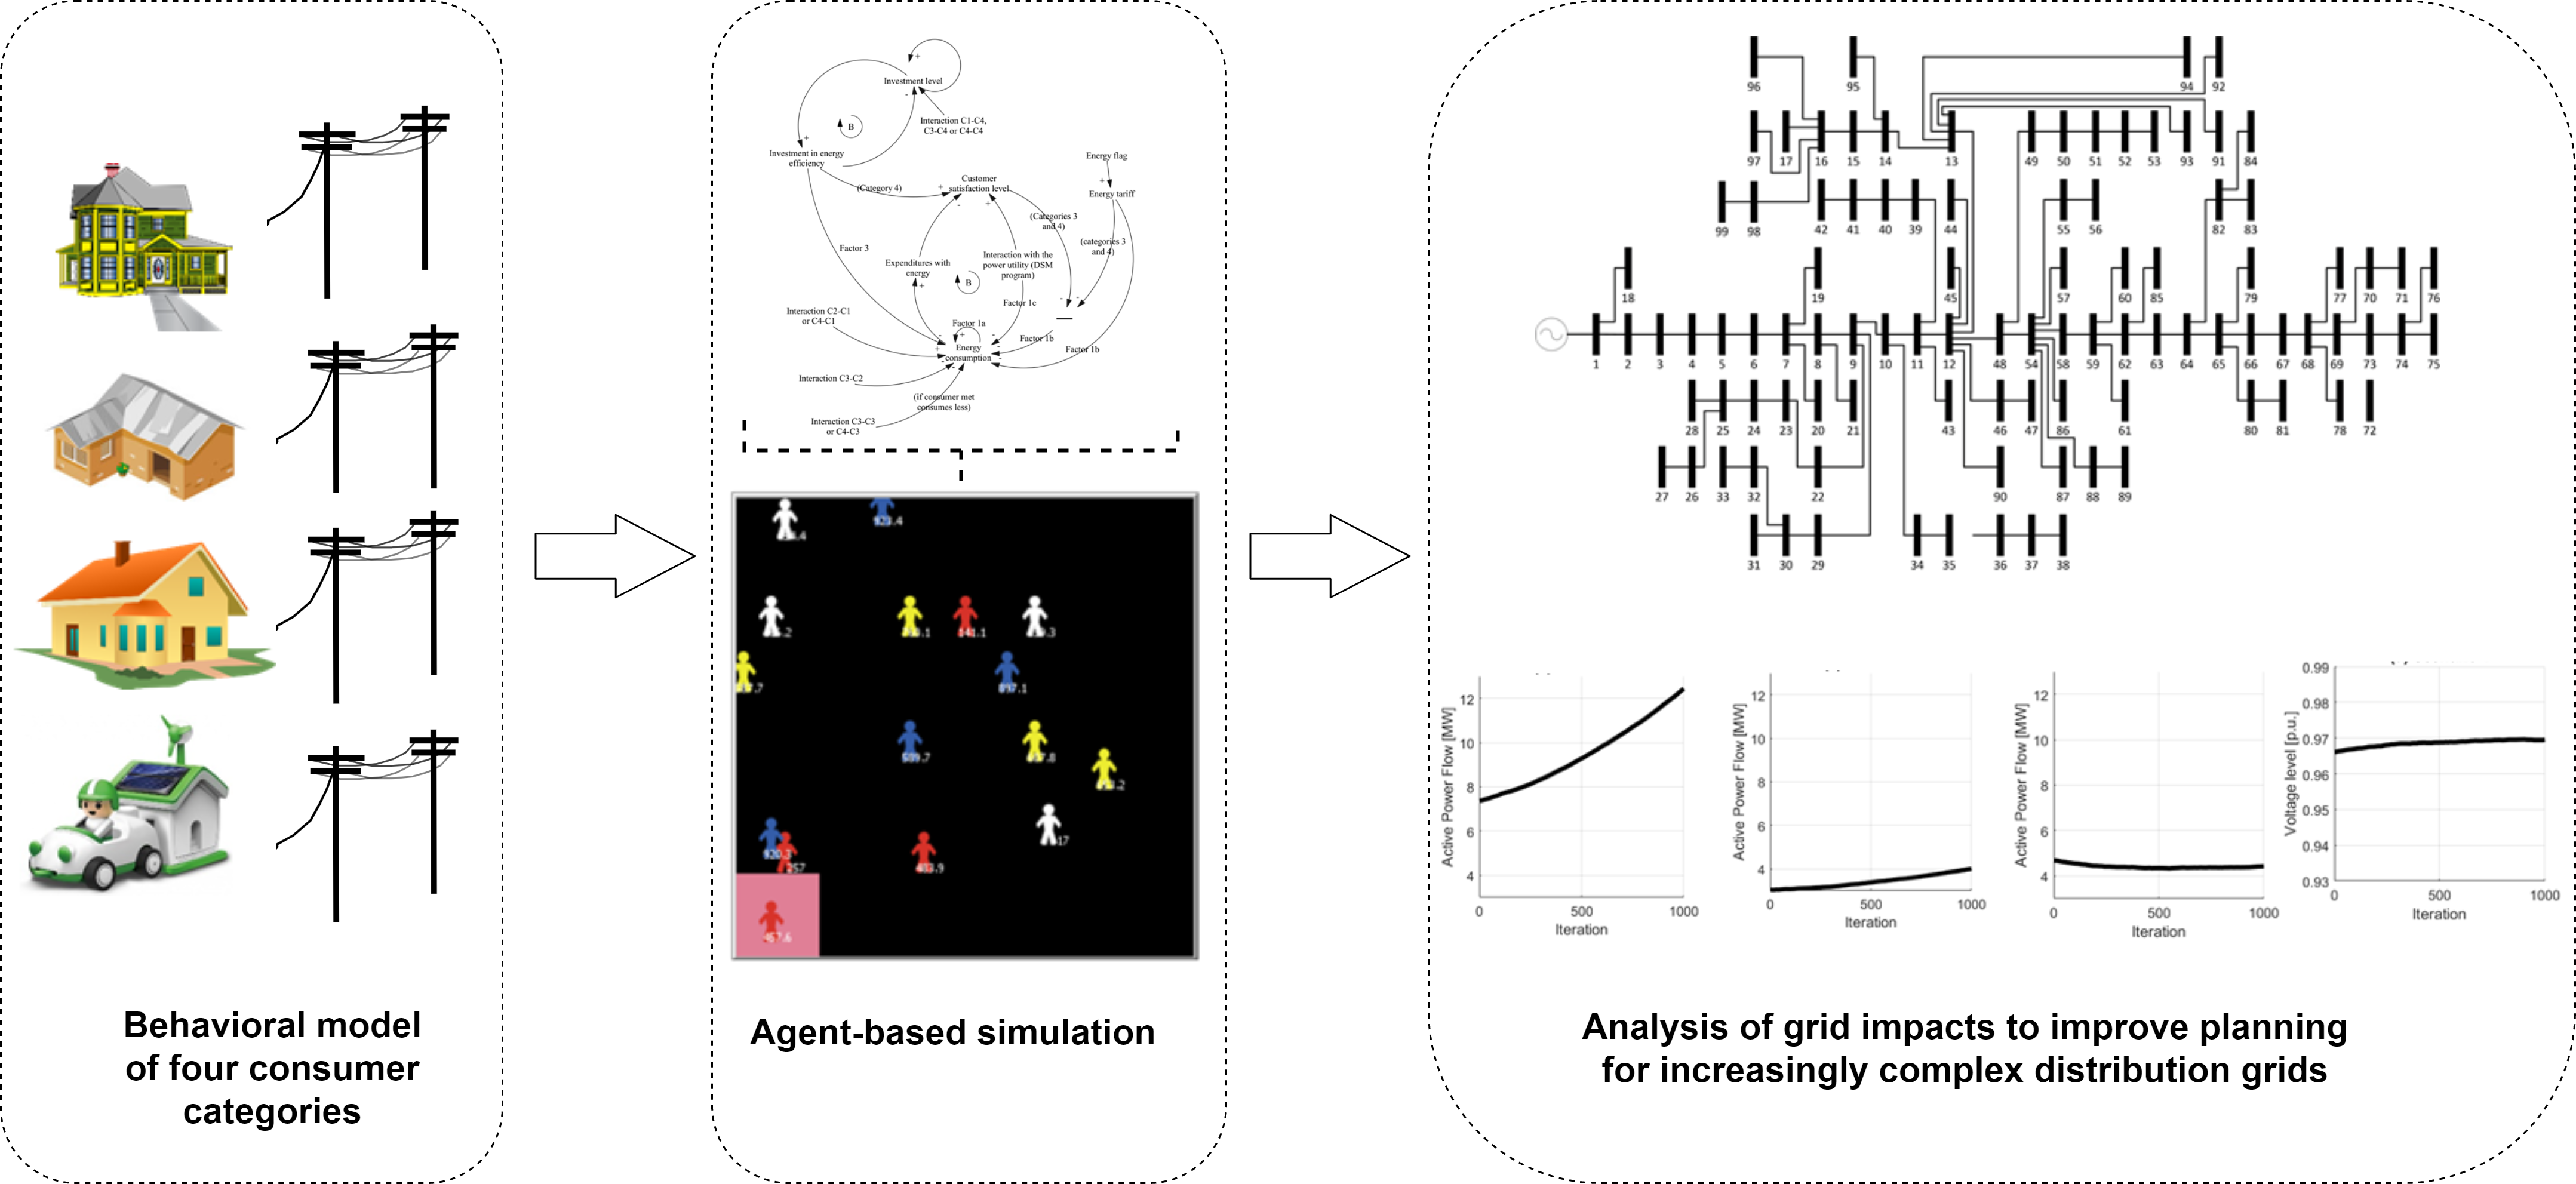
Even with enough information and technological access, regulations that are too restrictive can inhibit or even prevent the desired energy-related behavior. For instance, in the Brazilian electricity retail sector, large consumers can purchase electricity directly from an open market, while smaller consumers are limited to their local retailers. It might jeopardize operation and planning actions since consumers on the open market are much more sensitive to tariff variations than the average consumer [26].
Policies and market-based instruments tend to have a relatively narrow view of the user as a consumer making conscious rational choices on the energy market from a set of pre-defined options. While this approach enables the optimization of current user behavior, it does little to stimulate large-scale transformations [27]. Policies to encourage sustainable energy behaviors will be more effective when important drivers of the desired behavior are targeted, and significant barriers to change are removed. A policy can be aimed at rewarding or facilitating sustainable energy behavior (pull measures) or punishing and inhibiting undesired behavior (push measures). The related behavior change can be voluntary or imposed. Measures that punish or inhibit unwanted responses can be useful, but generally meet more public resistance than reward or facilitating measures [12].

3. Methodology

In our previous work [9], an agent-based approach to analyze people’s behavior on electricity consumption using a behavioral economics framework was presented. This work provided insights into the relevance of modeling consumer behavior for power systems, but lacked an in-depth analysis of the electrical system aspects. In this work, we focused on how emergent complex behavior could affect the planning of distribution grids under a smart grid vision, using an adapted version of the agent-based model that was previously presented in Reference [9]. Hence, we conducted simulations using a real distribution feeder and customer load curve data. Furthermore, we provide a causal loop diagram (CLD) that provides a birds-eye-view of the agent-based model, representing its feedback structure of the model.
The proposed methodology has two main phases: (1) the agent-based electricity consumption model, which calculates the individual and overall energy consumption for a given scenario by considering the heuristics of four consumer categories and (2) the energy and power analysis, which includes power flow and voltage analysis in order to evaluate possible implications on planning actions.

3.1. Agent-Based Electricity Consumption Model (ECM)

To incorporate the insights of behavioral economics into the agent-based model [9], the main factors that influence electricity consumption were listed, and the mutual relations among the agents (consumers) were analyzed. We aimed to assess how changes in these variables could impact energy consumption. Five aspects, divided further into three groups, were considered:
  • Factor 1a: A fixed increase rate on electricity consumption, considered to mimic changes in consumer behavior due to economic growth and the more frequent use of technologies;
  • Factor 1b: Their elasticity to electricity price variations;
  • Factor 1c: The interactions with the power utility through demand-side management programs;
  • Factor 2: Their social interactions; and
  • Factor 3: The investments made in energy-efficient technologies.
These factors apply differently to each of the four categories modeled in Reference [9], according to their characteristics (Table 1). In brief, consumers in Category 1 had a higher income, and it was assumed that they were inelastic to price changes. Consumers in Category 2 had a low income and might have changed their energy consumption patterns, given financial incentives and social interactions. Category 3 lies between Categories 1 and 2. Finally, Category 4 represents consumers with an interest in new technologies, e.g., retrofitting of air-conditioning systems and installing solar panels.
Electricity consumption changes, given the developed heuristics of all agents involved in each simulation, for each iteration of the agent-based model. Nevertheless, it is essential to clarify that the focus of this work is not to relate the iterations to specific durations of time directly. Throughout the discussions in the case study, no direct relations with absolute durations of time will be defined. However, for planning purposes, each iteration can and should be defined as a specific period of time, such as an hour, a day, or any other seasonal load cycle.
Finally, in addition to Reference [9], we present a causal loop diagram (CLD) of the ECM. As can be seen in Figure 1, the main variable and focus of the analysis in the model is energy consumption. Starting from the upper left corner, a balancing loop on the investment in energy efficiency is presented. The variable “Interaction C1-C4” shows that a consumer in Category 1 is affected by a consumer in Category 4. The same logic is applied to C3-C4 and C4-C4 and all other variables related to customer interactions on the diagram. When these interactions take place, they increase the investment level of the affected agents. A higher investment level increases the probability of investments in energy efficiency taking place, and the event of investments in energy efficiency, in turn, decreases the investment level, reducing the likelihood that such an event would happen again soon. The investment level can also change for every iteration, according to the customer satisfaction level. Finally, investment in energy efficiency directly decreases energy consumption, but also increases customer satisfaction levels for consumers in Category 4.
Interactions C2-C1 and C4-C1 lead to an increase in energy consumptions in Categories 2 and 4 because Category 1 influences them and causes them to be less efficient. When there is a C3-C2 interaction, consumers in Category 3 are encouraged to be more efficient since Category 2 usually has lower energy consumption. The same applies to interactions C3-C3 and C4-C3, but only if the consumer in Category 3 consumes less then the consumer affected in Category 3 or 4. With a direct relation to energy consumption, there is also a fixed energy consumption self-loop (Factor 1a).
Since electricity is considered to be purchased, in terms of its relative price ($/kWh), an increase in “Energy consumption” leads to a rise in “Expenditure with energy”. Furthermore, “Expenditure with energy” and “Customer satisfaction level” are inversely proportional. Hence, when interactions with the power utility occur in the agent-based model, it represents a demand-side management program that decreases the customer’s energy consumption and increases the customer satisfaction level. Demand-side management programs that lead to an increase in demand, e.g., valley filling [28], were not considered in the model.
Last but not least, energy tariffs also play an essential role in the model. It is influenced (an increase in its base value) by the concept of ‘energy flags’, i.e., a three-level modifier that can either increase significantly, increase slightly, or not interfere with the “Energy tariff”. This concept is currently being used in Brazil and aims to provide a direct incentive for customers depending on the current generation costs. Furthermore, energy tariff increases cause decreases in energy consumption and is directly related to the consumption level for consumers in Category 2 and indirectly related, via the satisfaction level, for consumers in Categories 3 and 4. Consumers in Category 1 are not sensitive to tariff changes, as described in Table 1.
As mentioned in Reference [9], several assumptions were necessary to develop this agent-based model. These assumptions include the division of the consumers into four categories, their interaction patterns, and how financial incentives influence their energy consumption. While such assumptions are very context-specific and can be challenged with empirical studies, they contribute to the understanding of how complex behavior emerges from simple heuristics. In this work, we analyze how such complex emergent behaviors, derived from the heuristics model, impact the distribution grids in which these customers are connected.

3.2. Power and Energy Analysis
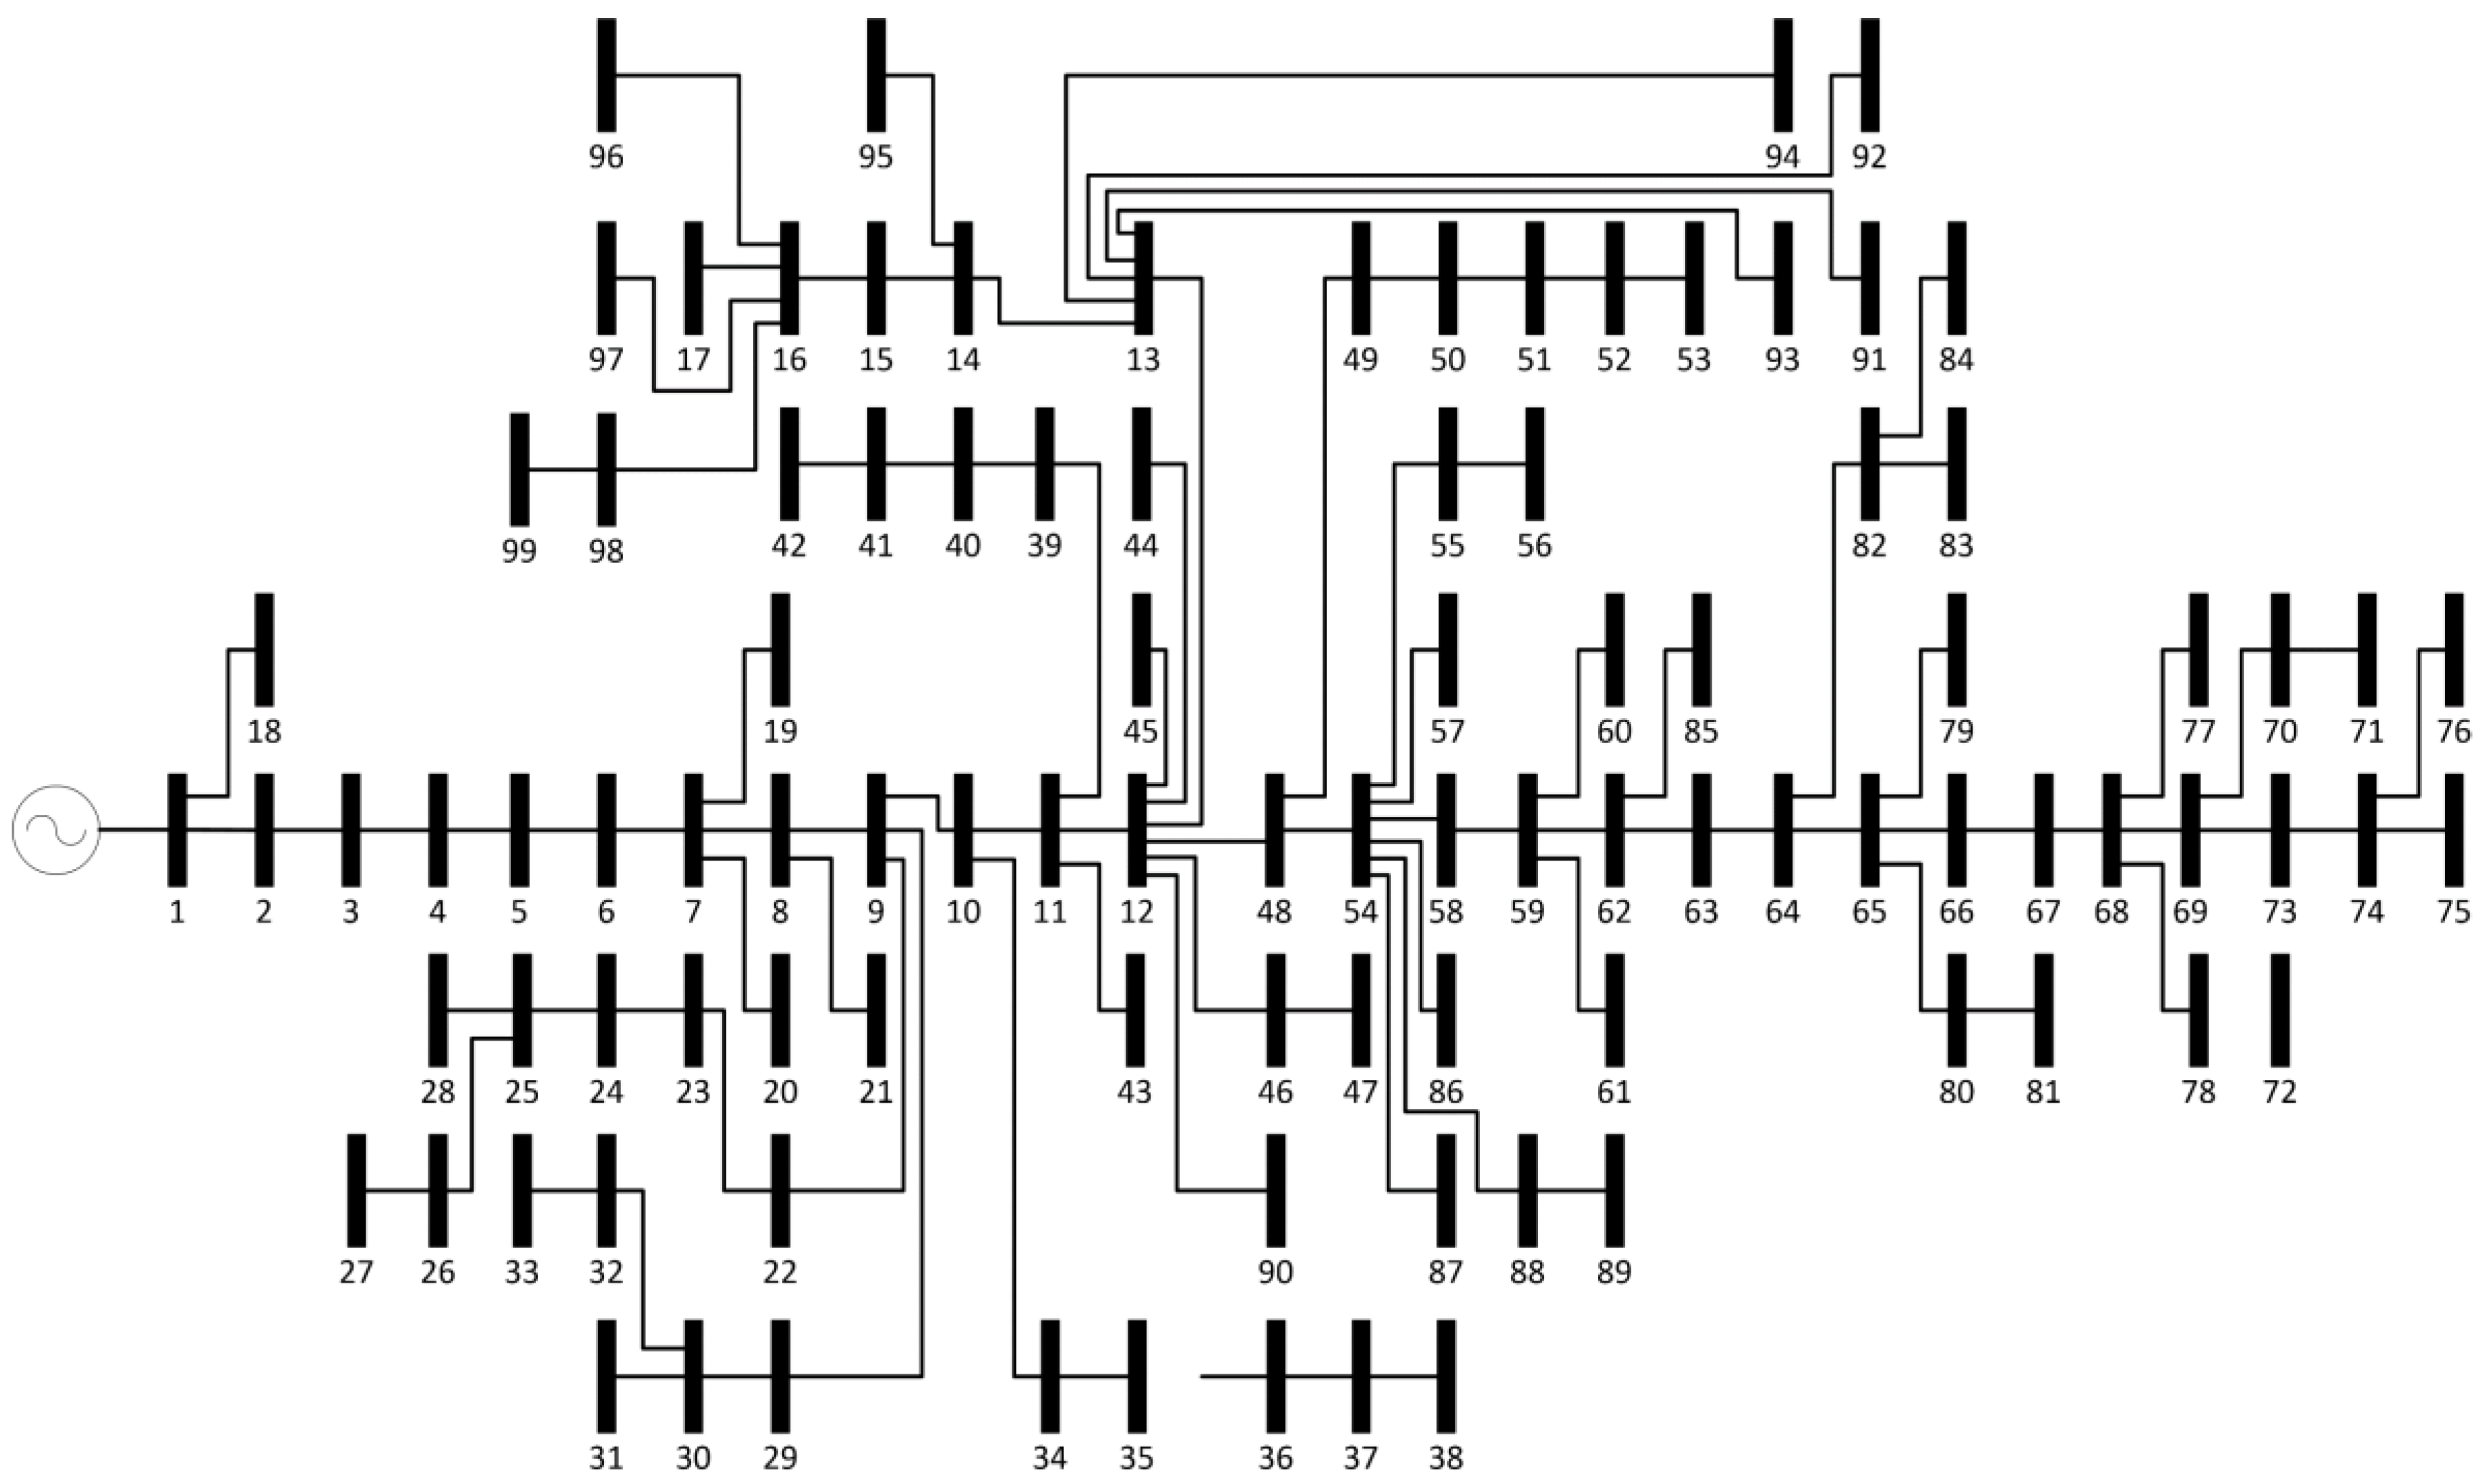
As was previously mentioned, the second part of our methodology deals with the grid-related power analysis using MATLAB. The first step is to load all grid data (e.g., cables, lines, limits, and transformers) and additional customer information (e.g., active and reactive load shape, and allocation of customers on the feeder). Given the scenario to be analyzed in terms of agent distribution among the consumption classes modeled in the ECM, consumers are randomly allocated to the distribution grid. Then, it is possible to evaluate electricity consumption levels for the scenario. Results related to monthly energy consumption, as simulated on the ECM, are presented, along with the other outputs of the model. The next step power flow analysis is undertaken considering the consumer’s distribution and their load curve, not only for the original scenario, but also for the estimated energy levels, i.e., the estimations provided by the agent-based model. The results can then be displayed in terms of power flow, voltage levels, and losses, among others. Finally, the last step is to analyze and display the final results, including network analysis on the interactions among the agents.

4. Case Study

To demonstrate the application of the methodology, a case study is proposed to analyze how emergent complex behaviors originate from different sets of consumers. It also illustrates the unfeasibility of directly mapping emergent behavior from a single heuristic, and that complexity should be dealt with proper methods and tools. Further, the impact of such different emergent patterns on a real-world power grid will be evaluated, aiming to understand the implications of how consumers behave in the planning of distribution systems. Specifically, this paper analyses the scenarios described in Table 2.
The ECM was executed 300 times to prevent random values from biasing the results. All the parameters and specifics of the simulation, as well as the source code for the ECM, are available online (ECM available at https://github.com/lcsiebert/ecm). Furthermore, all the discussion will revolve around how power, energy, and the remaining variables of the model evolve along the 1000 iterations.

4.1. Distribution Feeder and Customer Load Curve Data

The case study presented in this paper uses feeder data adapted from a real feeder of a Brazilian distribution company, as previously described in References [29] and [30]. While feeder data were processed to obtain a suitable scenario for the system tests, they represented conditions consistent with Brazilian distributions grids: Several customers connected to the same transformer. The feeder is purely radial, overhead, and urban and uses a medium voltage level of 13 kV. It has no distributed generation sources, voltage regulators, or capacitor banks. The values of resistance and reactance of each section of the feeder are presented in the Appendix C of Reference [29]. The feeder had 99 buses, one of generation (substation), and remaining load buses (distribution transformers). In this work, only the 78 transformers, where 7299 low-voltage customers were connected, were considered. The remaining buses were either assigned to street lighting or medium voltage commercial customers and were not considered with the purpose of avoiding distortions and allowed us to focus exclusively on the emergent properties of the energy consumption on residential feeders according to the ECM. Figure 2 presents the single line diagram of the distribution feeder. Its current limit is 325.3 A on bus 1.
As for the feeder data, customer daily load curves were also previously used and presented in References [29] and [30]. These load curves had a 1 h sample rate, were divided into working days, Saturday, and Sunday/holidays, and were obtained from a smart metering pilot project with 7044 residential low-voltage consumers. In this work, we used the working day’s load curves, stratified into five patterns according to their monthly energy consumption. These five patterns (load curves) were attributed to the 7299 individual low-voltage customers of the feeder, according to the distribution proposed scenario of analysis, in the following manner (in the cases that more than one patter can be attributed to a category, the selection of the pattern was randomized.):
  • Category 1: Patterns 4 (between 500 and 1000 kWh/month) or 5 (above 1000 kWh/month);
  • Category 2: Pattern 1 (below 80 kWh/month);
  • Category 3: Patterns 2 (between 80 and 220 kWh/month) or 3 (between 220 and 500 kWh/month); and
  • Category 4: Patterns 2 (between 80 and 220 kWh/month) or 4 (between 500 and 100 kWh/month);
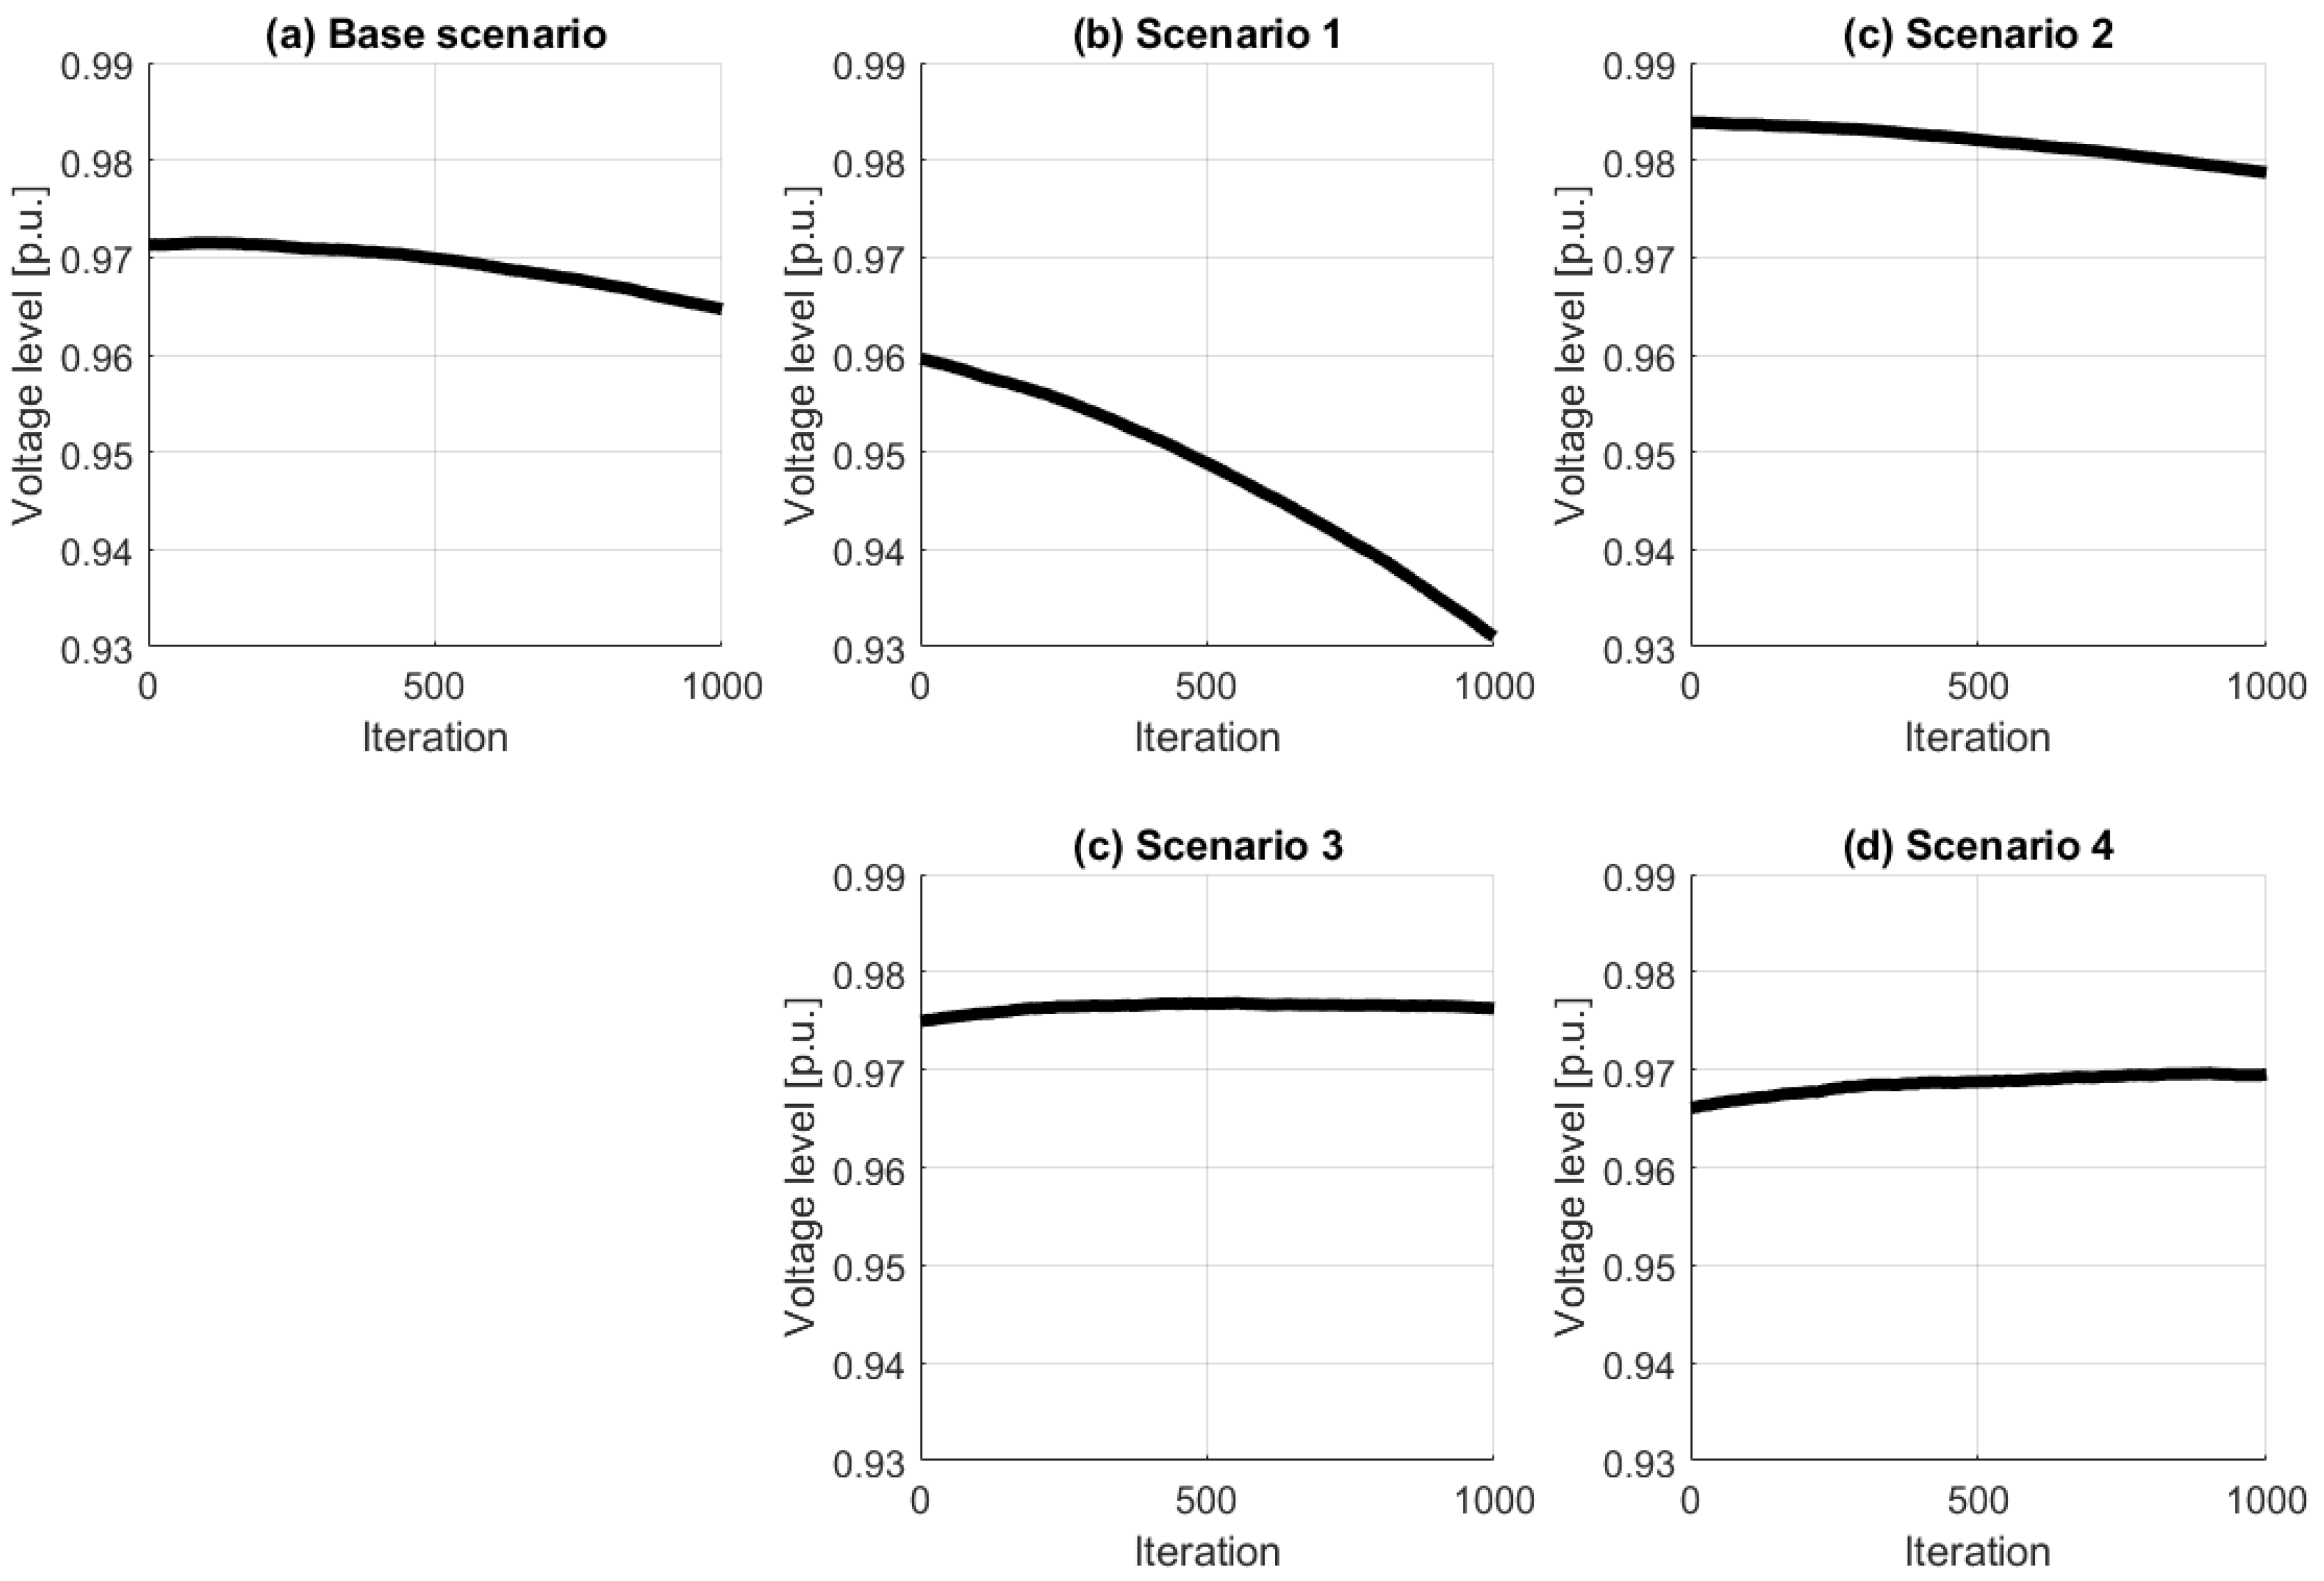
The load curves were adjusted to match the initial consumption level (as performed in References [29,30]) defined by the model, and the specific position of each customer in the feeder was assigned randomly. These load curves, therefore, come from real data from a Brazilian distribution company, through the treatment of an extensive database. Due to the unavailability of reactive load curve time series from this same database, the reactive load curve was estimated from the power factors presented in References [29,31].

4.2. Results

This section describes the main results of the case study, focusing on the grid impact in terms of current, power, and voltage levels. All analyses were performed concerning the iterations of the model, which relates to time. However, we decided to make no assumptions regarding absolute durations of time and to discuss the results with respect to the model iterations. Further analysis concerning real-world scenarios must be undertaken for an explicit assumption of durations of time for planning purposes, which is not in the scope of this work. Here, we focus on understanding how the different heuristics modeled led to emergent properties on the simulations and the systemic impacts of the model. However, since each iteration could and should have been defined as a specific period of time in practical applications, towards the end of the current section we will present a possible interpretation of the specific durations for each iteration, considering the Brazilian power and energy landscape will be discussed.
Figure 3 presents the evolution of the load flowing from the substation to the grid during the hour of maximum loading. For this, load flows were calculated for each hour for every 10 iterations of the results of the ECM. The initial values relate to the composition of consumer categories and their initial consumption value (Table 2), ranging from an aggregated value of ~3 MW in scenario 2 until ~7.5 MW in scenario 1. Both in absolute as well as in percentual values, we can observe that the slope of the evolution of the power flow was very diverse, from a very positive load growing in scenario 1 until a reasonably negative slope in scenario 4.
Scenarios 1 (Figure 3b) and 2 (Figure 3c) showed an increase in the power flow levels throughout the iterations. For scenario 1, the initial power flow was considerably higher than the base scenario, due to the presence of more consumers in category 1, who had higher initial consumptions. The slope of the curve was steeper in this scenario and was also due to consumers from category 1, whose modeled behavior was not affected by increasing energy prices, and did not take into consideration investments and social interactions as much as other categories. As consumers in category 2 had a significantly lower initial consumption, the initial power flow for scenario 2 was proportionally lower. Due to the social interaction scheme of consumers in category 2, their higher elasticity to tariff increase, and the fewer investments made, the slope of the curve was significantly lower scenario 1.
Scenarios 3 (Figure 3d) and 4 (Figure 3e) showed an initial decrease in the power flow levels. In scenario 3, an initial drop could be perceived in the first 300 iterations. After that, the levels remained relatively constant, even increasing slightly. We found a steeper decline in scenario 4. One of the most important reasons for that is the number of investments made by consumers in category 4.
The minimum voltage value throughout the feeder for each evaluated iteration in a per-unit scale (the nominal base voltage of the feeder is 13 kV) is presented in Figure 4. If we consider a voltage limit of 0.95 p.u., it would have trespassed only in scenario 1 (in the last iteration, 68.7% of the buses).
For all the scenarios, a recurring pattern was evident, regardless of the tendency of the evolution to be of increase or decrease. This pattern consisted of a small initial tendency to have a lower slope and a final tendency (roughly speaking, after iteration 900) in the opposite direction if compared to the average behavior across all the iterations. In other words, the ECM heuristics led to an emerging bias towards reducing energy consumption on the final iterations, and in the last iterations, to increase consumption, when compared to their baseline. This behavior may correlate to different parameters of the model, such as satisfaction and investment levels, and interactions among consumers and with the utility.
Table 2 presents selected statistics on power analysis. The first element is the coefficient of determination (R2) between the power flow shown in Figure 3 compared to a constrained linear regression of the same data. We found higher R2 values in scenarios 1 and 2 since consumers in Categories 1 and 2 interact less with consumers in other categories, do not interact within their category, and consumers in Category 2 make fewer investments in energy efficiency. In scenario 4 the emergent results have a more substantial nonlinear component. In contrast, scenario 3 presented the most negative value of R2 (meaning that the linear regression fits the output of the model worse than a horizontal line on the mean values). Therefore, a strong non-linearity was presumably found in scenarios 3 and 4, leading to the understanding that social interactions and investments play a significant role in leading a system to non-linearity and more complex behaviors.
Moving on to the indicators of power quality, the minimum voltage level, considered to be 0.95 p.u. for this analysis has only trespassed on scenario one. The current values trespassed the current limit (325.3 A) in all scenarios, but scenario 2 (Table 3). Nevertheless, this current limit was defined from the original load of the dataset. Given that the loads calculated by the ECM replaced the original loads on the feeder, these values should not be regarded as fixed operational limits, but only as a comparison basis among the scenarios.
As mentioned earlier, all the discussions in this section intentionally did not mention any specific real-world time duration for each iteration, aiming to not distract the reader from the emergent behaviors. However, if we consider a yearly growth rate of 1.1%, as observed in the Brazilian residential sector from 2016 to 2017 (EPE), 2018b), we could estimate, for the base case, that the average duration of one iteration was ~6.759 days. In other words, since the average electricity consumption for the case grew 0.0205% per iteration, the 1000 iterations of the simulation would represent ~18.52 years. If we consider scenario 1, with an average growth rate of 0.0508%/iteration, one iteration will represent ~16.59 days, and for scenario two, with an average increase rate of 0.0277%/iteration, one iteration would represent ~9.12 days. For scenarios three and four scenarios such assumptions are not possible, since there was an overall tendency to decrease electricity consumption.

5. Conclusions

This paper analyzed the emergence of complex behavior on power systems by analyzing how the behavior of different residential consumers can affect distribution grids. The results showed how minor changes in modeling human behavior lead to considerable differences and non-linearity in the grid power flow and voltage levels.
Understanding consumer behavior is of great importance to the planning and operation of electrical grids. Many software packages and methodologies for electrical grid analysis focus mainly on modeling and detailing the physical behavior of all the grid components. However, not much has been discussed on modeling and detailing consumer behavior and how this behavior may change over time. Many analyses rely on the assumption of linear demand growth, which is indeed a straightforward analysis that easily allows for the extrapolation of results and makes projections for power systems planning, but is often strongly detached from real expected situations. Considering the complexity of such behaviors and interactions may significantly support power system analysis.
The results of this work can lead to new research opportunities to improve planning actions [30,32] for increasingly complex power systems. The results support the statement that the planning of power systems can significantly benefit from a broader perspective that considers distribution grids as a socio-technical system. Consumers should be considered as agents driven not only by financial incentives but also driven by concepts such as values, beliefs, and social norms.

Author Contributions

L.C.S. and A.R.A. conceived and designed the experiments; L.C.S. performed the experiments; L.C.S., G.L.-T., A.R.A., N.L.-d.-A., and N.G.P. analyzed the case studies; L.C.S., A.R.A., and G.L.-T. developed the methodology; and L.C.S., A.R.A., G.L.-T., N.L.-d.-A., and N.G.P. analyzed the results of the methodology and wrote the paper. All authors have read and agreed to the published version of the manuscript.

Funding

This research received no external funding.

Acknowledgments

The authors would like to thank the National Council for Scientific and Technological Development (CNPq), Coordination for the Improvement of Higher Education Personnel (CAPES), and Brazilian Electricity Regulatory Agency Research and Development (ANEEL R&D) for supporting this project.

Conflicts of Interest

The authors declare no conflict of interest.

References

  1. Zio, E. Challenges in the Vulnerability and Risk Analysis of Critical Infrastructures. Reliab. Eng. Syst. Saf. 2016, 152, 137–150. [Google Scholar] [CrossRef]
  2. Howell, S.; Rezgui, Y.; Hippolyte, J.; Jayan, B.; Li, H. Towards the next Generation of Smart Grids: Semantic and Holonic Multi- Agent Management of Distributed Energy Resources. Renew. Sustain. Energy Rev. 2017, 77, 193–214. [Google Scholar] [CrossRef]
  3. Baxter, G.; Sommerville, I. Socio-Technical Systems: From Design Methods to Systems Engineering. Interact. Comput. 2011, 23, 4–17. [Google Scholar] [CrossRef] [Green Version]
  4. Luo, L. Power System Vulnerability and Performance: Application from Complexity Science and Complex Network. Ph.D. Thesis, Scuola di Dottorato, Politecnico di Torino, Italy, 2014. [Google Scholar]
  5. Bompard, E.; Connors, S.; Fulli, G.; Han, B.; Masera, M.; Mengolini, A.; Nuttal, W.J.; Nuttall, W.J. Smart Energy Grids and Complexity Science; JRC Scientific and Policy Reports; European Comission, Joint Research Centre: Petten, The Netherlands, 2012. [Google Scholar] [CrossRef]
  6. Yu, X.; Xue, Y. Smart Grids: A Cyber-Physical Systems Perspective. Proc. IEEE 2016, 104, 1058–1070. [Google Scholar] [CrossRef]
  7. Rylatt, R.; Snape, J.; Allen, P.; Ardestani, B. Exploring Smart Grid Possibilities: A Complex Systems Modelling Approach. Smart Grid 2015, 1, 1–15. [Google Scholar]
  8. Simon, H.A. A Behavioral Model of Rational Choice. Q. J. Econ. 1955, 69, 99–118. [Google Scholar] [CrossRef]
  9. Siebert, L.C.; Sbicca, A.; Aoki, A.R.; Lambert-Torres, G. A Behavioral Economics Approach to Residential Electricity Consumption. Energies 2017, 10, 768. [Google Scholar] [CrossRef] [Green Version]
  10. Van Der Werff, E.; Thogersen, J.; Bruine De Bruin, W. Changing Household Energy Usage: The Downsides of Incentives and How to Overcome Them. IEEE Power Energy Mag. 2018, 16, 42–48. [Google Scholar] [CrossRef]
  11. Parag, Y.; Sovacool, B.K. Electricity Market Design for the Prosumer Era. Nat. Energy 2016, 1, 16032. [Google Scholar] [CrossRef]
  12. Steg, L.; Shwom, R.; Dietz, T. What Drives Energy Consumers? Engaging People in a Sustainable Energy Transition. IEEE Power Energy 2018, 16, 20–28. [Google Scholar] [CrossRef]
  13. Schwartz, S.H. A Proposal for Measuring Value Orientations Across Nations; Questionnaire Development Package of the European Social Survey; European Social Survey: London, UK, 2003; pp. 259–319. [Google Scholar]
  14. Bouman, T.; Steg, L.; Kiers, H.A.L. Measuring Values in Environmental Research: A Test of an Environmental Portrait Value Questionnaire. Front. Psychol. 2018, 9, 564. [Google Scholar] [CrossRef] [PubMed]
  15. Lobasenko, V. Consumer Behavior Towards Innovative Products: Which Methodologies for Which Values? Ph.D. Thesis, Communauté Universite Grenoble Alpes, Saint-Martin-d’Hères, France, 2017. [Google Scholar]
  16. Frederiks, E.R.; Stenner, K.; Hobman, E.V. Household Energy Use: Applying Behavioural Economics to Understand Consumer Decision-Making and Behaviour. Renew. Sustain. Energy Rev. 2015, 41, 1385–1394. [Google Scholar] [CrossRef] [Green Version]
  17. Pollitt, M.G.; Shaorshadze, I. The Role of Behavioural Economics in Energy and Climate Policy. In Handbook on Energy and Climate Change; Edward Elgar Publishing: Northampton, MA, USA, 2011. [Google Scholar]
  18. Yang, Y.; Solgaard, H.S.; Ren, J. Does Positive Framing Matter? An Investigation of How Framing Affects Consumers’ Willingness to Buy Green Electricity in Denmark. Energy Res. Soc. Sci. 2018, 46, 40–47. [Google Scholar] [CrossRef]
  19. Ayres, I.; Raseman, S.; Shih, A. Evidence from Two Large Field Experiments That Peer Comparison Feedback Can Reduce Residential Energy Usage. J. Law Econ. Organ. 2009, 29, 992–1022. [Google Scholar] [CrossRef]
  20. Wang, F.; Liu, L.; Yu, Y.; Li, G.; Li, J.; Shafie-Khah, M.; Catalão, J.P.S. Impact Analysis of Customized Feedback Interventions on Residential Electricity Load Consumption Behavior for Demand Response. Energies 2018, 11, 770. [Google Scholar] [CrossRef] [Green Version]
  21. Frederiks, E.R.; Stenner, K.; Hobman, E.V. The Socio-Demographic and Psychological Predictors of Residential Energy Consumption: A Comprehensive Review. Energies 2015, 8, 573–609. [Google Scholar] [CrossRef] [Green Version]
  22. Lampropoulos, I.; Vanalme, G.M.A.; Kling, W.L. A Methodology for Modeling the Behavior of Electricity Prosumers within the Smart Grid. In Proceedings of the IEEE PES Innovative Smart Grid Technologies Conference Europe, ISGT Europe, Gothenberg, Sweden, 11–13 October 2010. [Google Scholar] [CrossRef] [Green Version]
  23. Sütterlin, B.; Brunner, T.A.; Siegrist, M. Who Puts the Most Energy into Energy Conservation? A Segmentation of Energy Consumers Based on Energy-Related Behavioral Characteristics. Energy Policy 2011, 39, 8137–8152. [Google Scholar] [CrossRef]
  24. Lavrijssen, S.; Parra, A.C. Radical Prosumer Innovations in the Electricity Sector and the Impact on Prosumer Regulation. Sustainability 2017, 9, 1207. [Google Scholar] [CrossRef] [Green Version]
  25. Tiefenbeck, V. Bring Behaviour into the Digital Transformation. Nat. Energy 2017, 2, 17085. [Google Scholar] [CrossRef]
  26. Vizioli, T.R. Análise Do Comportamento Dos Consumidores No Âmbito Dos Ambientes de Contratação Livre e Regulada Do Mercado Brasileiro de Energia Elétrica; University of Brasília: Brasilia, Brazil, 2017. [Google Scholar]
  27. Schot, J.; Kanger, L.; Verbong, G. The Roles of Users in Shaping Transitions to New Energy Systems. Nat. Energy 2016, 1. [Google Scholar] [CrossRef] [Green Version]
  28. Gellings, C.W. The Concept of Demand-Side Management for Electric Utilities. Proc. IEEE 1985, 73, 1468–1470. [Google Scholar] [CrossRef]
  29. Siebert, L.C. Sistema de Otimização de Resposta à Demanda Para Redes Elétricas Inteligentes. Ph.D. Thesis, Federal University of Paraná, Curitiba, Brazil, 2013. [Google Scholar]
  30. Siebert, L.C.; Aoki, A.R.; Fernandes, T.S.P.; Lambert-Torres, G. Customer Targeting Optimization System for Price-Based Demand Response Programs. Int. Trans. Electr. Energy Syst. 2018, 29, e2709. [Google Scholar]
  31. Yamakawa, E.K. Sistema de Controle Nebuloso Para Bancos de Capacitores Automáticos Aplicados Em Alimentadores de Distribuição de Energia Elétrica. Ph.D. Thesis, Federal University of Paraná, Curitiba, Brazil, 2007. [Google Scholar]
  32. Georgilakis, P.S.; Hatziargyriou, N.D. A Review of Power Distribution Planning in the Modern Power Systems Era: Models, Methods and Future Research. Electr. Power Syst. Res. 2015, 121, 89–100. [Google Scholar] [CrossRef]
Figure 1. Causal loop diagram.
Energies 13 04837 g001
Figure 2. Single line diagram [29].
Energies 13 04837 g002
Figure 3. Power flowing from the substation at the time of maximal loading for the (a) base scenario; (b) scenario 1; (c) scenario 2; (d) scenario 3; and (e) scenario 4.
Energies 13 04837 g003
Figure 4. Minimum voltage level on the feeder for the (a) base scenario; (b) scenario 1; (c) scenario 2; (d) scenario 3; and (e) scenario 4.
Energies 13 04837 g004
Table 1. Categories of consumers [9].
CategoryMain CharacteristicsInitial Consumption
1: High incomeNot sensible to tariff changes
Invests in energy efficiency when possible
Occasionally change habits due to social interaction
High (500–1000 kWh/month)
2: Low incomeStrongly sensible to tariff changes
Does not invest in energy efficiency
Change habits due to social interaction
Low (10–100 kWh/month)
3: Middle classSensible to tariff changes
May invest in energy efficiency
Sometimes change habits due to social interaction
Average (100–500 kWh/month)
4: Early adopters (technology)Sensible to tariff changes
Invests often in energy efficiency
Sometimes change habits due to social interaction
Average–High (100–1000 kWh/month)
Table 2. Simulation scenarios.
ScenarioDivision of Consumers
BaseAll categories: 25% (equally divided)
1Category 1: 62.50 %
Categories 2, 3, and 4: 12.50 % (each)
2Categories 1, 3, and 4: 12.50 % (each)
Category 2: 62.50 %
3Categories 1, 2, and 4: 12.50 % (each)
Category 3: 62.50 %
4Categories 1, 2, and 3: 12.50 % (each)
Category 4: 62.50 %
Table 3. Simulation scenarios.
Base CaseScenario 1Scenario 2Scenario 3Scenario 4
Coefficient of determination (R2) between power flow and constrained linear regression0.8110.9640.930−0.8050.651
Minimum voltage level [p.u.]0.9650.9310.9790.9750.966
Maximum value of current [A]499,650957,159308,208360,702484,484

