Article

Numerical Studies on the Performance of the PCM Mesh-Finned Heat Sink Base on Thermal-Flow Multiphysics Coupling Simulation

1
Guangxi Key Laboratory of Power System Optimization and Energy Technology, Guangxi University, Nanning 530004, China
2
College of Electrical and Information, Hunan University, Changsha 410205, China
*
Author to whom correspondence should be addressed.
Energies 2020, 13(18), 4658; https://doi.org/10.3390/en13184658
Submission received: 20 July 2020 / Revised: 30 August 2020 / Accepted: 1 September 2020 / Published: 8 September 2020
(This article belongs to the Special Issue Model Coupling and Energy Systems)

Abstract

:
Operating temperature is an important parameter of thyristors to ensure the stable operation of power electronic devices. Thermal management technology is of great significance for improving the reliability of thyristors. In this study, the performance of a phase change material (PCM) mesh-finned heat sink is investigated for the thermal management of thyristors. A multi-physical coupling model of the PCM mesh-finned heat sink is established to analyze the effects of different power losses, air velocities, heights of fins, and thickness of PCM on the thermal performance of the PCM heat sink. The influence of thermal and flow fields on PCM is considered in this model. Furthermore, the heat sink design is optimized to improve the thermal performance based on the calculation results of thermal network parameters. The results show that the power losses, the air velocity, the height of fins, and the thickness of PCM significantly affect the protection ability of the PCM heat sink. After optimizing the heat sink, the PCM heat sink provides 80 s protection time and 100 s recovery time. The PCM mesh-finned heat sink demonstrated good potential for the thermal management of thyristors.

1. Introduction

The stability of the thyristor is the decisive element for the reliability of power electronic equipment, and the operating temperature is a key factor affecting the reliability of the thyristor. Under high power conditions, high current and internal resistance will generate a large quantity of power loss and heat, which is dissipated through the heat sink. High temperature and temperature impact will lead to failures of switching elements; Yeh indicates that 55% of the failures of electronic devices are caused by temperature [1]. Traditionally, liquid convection and forced air cooling methods are applied to the thermal management of power devices. However, traditional thermal management technology is difficult to solve the problem of temperature impact. Therefore, efficient thermal management technology is urgently needed for thyristors.
In recent years, phase change materials (PCMs) have shown great potential in thermal management because of their high latent heat and constant phase transition temperature. Building thermal management based on PCM improves the temperature distribution of the building and saves energy [2,3]. The heat recovery capability of PCM improves the efficiency of the heat pump system [4] and solar thermal applications [5,6,7,8]. Passive thermal management systems using PCM provides an effective solution for lithium battery overheating. Passive thermal management systems using PCM provides an effective solution for lithium battery overheating [9,10,11]. The PCM-based thermal management system provides efficient operating conditions for electronic equipment [12], improves cooling performance [13], and reduces energy consumption [14]. However, few scholars have studied the PCM thermal management system for thyristors. The thermal management using phase change materials (PCMs) shows high efficiency and simplicity compared with traditional liquid convection and forced air cooling methods. When the temperature reaches the melting point of PCM, PCM starts melting and absorbs a large quantity of heat [15]. Since the latent heat of PCM is released during the solidification process, the thermal management of PCM has great advantages for intermittent act devices [16]. However, the low thermal conductivity of PCMs leads to long phase transition time. The response time of most phase change material heat sink is 10–100 min, making it difficult to duel with short time temperature shocks. Besides this, the thermal management performance of PCM varied under different input power levels [17], and it is necessary to investigate the effects of the power levels in the PCM heat sinks design.
In recent years, the application of PCM heat sink for high-power devices has been extensively investigated [18,19,20]. Wang investigated the effect of copper fiber on the heat conduction enhancement of the heat sink [21]; it proved that the improvement of heat transfer by composite PCM is more evident under larger high-power. Shao proposed a power module using PCM enhanced with the metal framework to provide short circuit protection for Insulated Gate Bipolar Transistor(IGBT) [22]. It demonstrated that PCM absorbed a large amount of heat in a short time, preventing the junction temperature of IGBT from rising. However, the PCM heat sink is rarely used in real applications due to the low thermal conductivity. Due to the low thermal conductivity of the PCM, the heat in the PCM is unable to be released, leading to the failure of thermal management. Many scholars have studied the methods to improve the thermal conductivity of the PCM [23,24,25,26,27]. Most studies were focused on the effect of heat conduction enhancement, and it was found that nanoparticles can increase thermal conductivity [28,29,30,31]. However, nanoparticles also increase the viscosity of the PCM [32], which affects the time required for the PCM to complete the melting and solidification processes. Besides this, heat transfer enhancement of the PCM heat sinks can also be done by using fins as the thermal conductivity enhancer. Mahmoud investigated the performance of the PCM heat sink with different fins [33,34], and it was concluded that increasing the number of fins changes the heat distribution of PCM and improves the efficiency of the PCM heat sink. However, the flow of PCMs and the changes in thermal network parameters were not considered. Literature reviews in this field show that PCM heat sink has great application potential for the thermal management of thyristors. However, in order to ensure the reliability of thermal management, the PCM heat sink needs to be optimized to reduce its thermal response time and recovery time.
To provide efficient thermal management for thyristors, the performance thermal management system combining PCM with forced-air cooling is investigated in this paper. Mesh fin structure and high thermal conductivity liquid metal PCM are used in the thermal management system to reduce thermal response time and recovery time. By using the COMSOL finite element simulation software (COMSOL Inc., Stockholm, Sweden), a coupling model including the thermal and the flow field is established to study the effects of different input power levels, air velocities, heights of fins, and thicknesses of PCM on the performance of the PCM heat sink. Furthermore, the thermal network parameters calculated by MATLAB (MathWorks.Inc, Natick, MA, USA) are used to optimize the design of the heat sink.
This paper is organized as follows. Section 2 describes the simulated model and the thermal network model. Section 3 describes the control equation of the flow-thermal coupling model. Section 4 shows the influence of air velocity, the height of fins, the thickness of PCM, and the thermal network parameters with the PCM heat sink. Conclusions are drawn in Section 5.

2. The Simulation and Thermal Network Model

2.1. PCM Type Selection

A selection of PCM and the specific parameters are listed in Table 1. The latent heat of paraffin and lauric acid is greater than that of liquid metals, but their thermal conductivity is much lower than that of liquid metal. Low thermal conductivity of paraffin and lauric acid will increase the response time of the heat sink, which is unacceptable for the thyristor.
Customized liquid metal LM60-150 is a composite material with high thermal conductivity and high density. Its high density allows it to provide more latent heat in the same volume. According to the datasheet of ETT510N16P60 [35], when the temperature of the thyristor higher than 80 °C, the maximum allowable current will be reduced, which means PCM should provide temperature protection when the thyristor temperature reaches 80 °C. Therefore, LM80 was selected as PCM in this design.

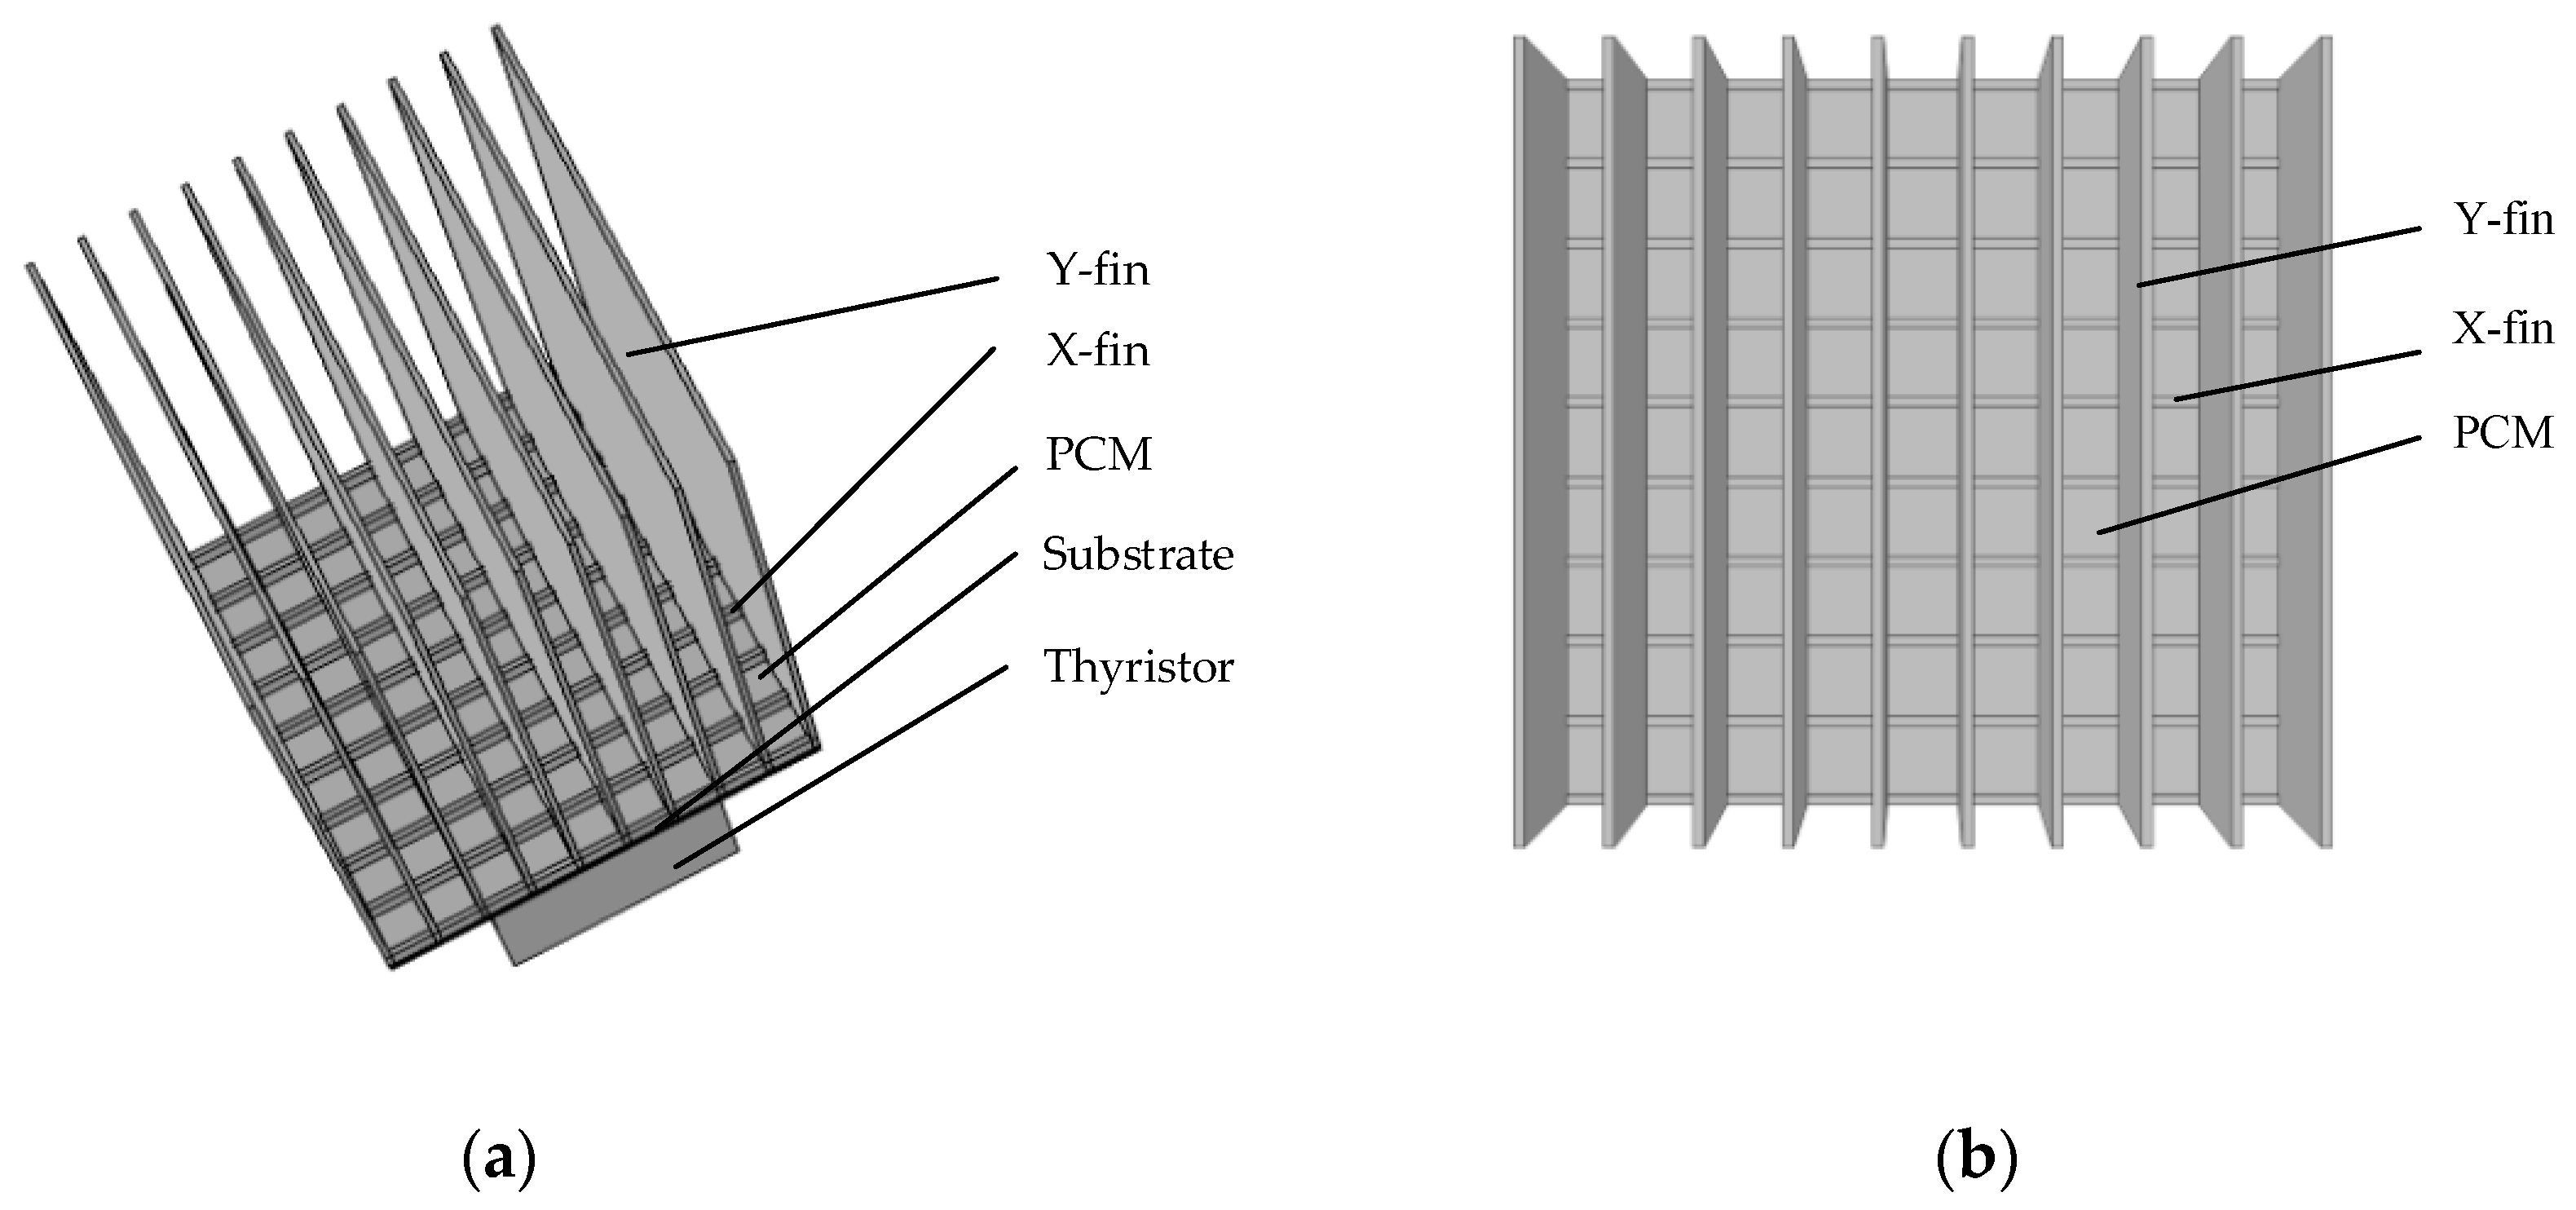
2.2. The Simulated Geometric Model

The research object is a mesh-finned PCM heat sink with low melting point metal. The model is established by using COMSOL finite element simulation software. The model is shown in Figure 1. Figure 1a shows the specific structure of the heat sink. The model is divided into five areas: X-fin, Y-fin, PCM, substrate, and thyristor from the top to the bottom. Figure 1b shows the top view of the model. X fin and Y fin are arranged crosswise to form 81 PCM grids. Table 2 illustrates the specific parameters of the model.
In order to improve the computational efficiency of the model, the following assumptions are made:
(1)
Since the density of metal changes slightly with the temperature, the density of solid and liquid PCM is regarded as constant. Only the equivalent density of the PCM with the changing temperature during the phase transition process is calculated.
(2)
The thyristor is replaced by the copper block and the heat can be calculated using the following Equation:
Q = P l o s s V
where Ploss is the power loss of thyristor; V is the volume of the copper block.
(3)
Since the thermal-flow coupling simulation based on the 3D model is too complicated, the whole heat sink is replaced by a cell of the mesh-finned heat sink when the effect of the molten material flowing is taken into consideration.
(4)
The switching loss of thyristor is ignored. Only the conduction loss of thyristor is calculated.
The tetrahedron cells are used as mesh for the simulation model. The refined mesh is applied for the smaller geometric dimensions, and the coarsening mesh is applied for the other regions with larger geometric dimensions to simplify calculations. The mesh grid number of the model ranges between 208, 246 and 270, 091, depending on the heights of fins and thicknesses of PCM. Each simulation was carried out in a transient mode, with a time step size of 0.5 s. In order to ensure the convergence of the simulation, the maximum number of iterations is set to 20 and the tolerance factor is set to 10−3.

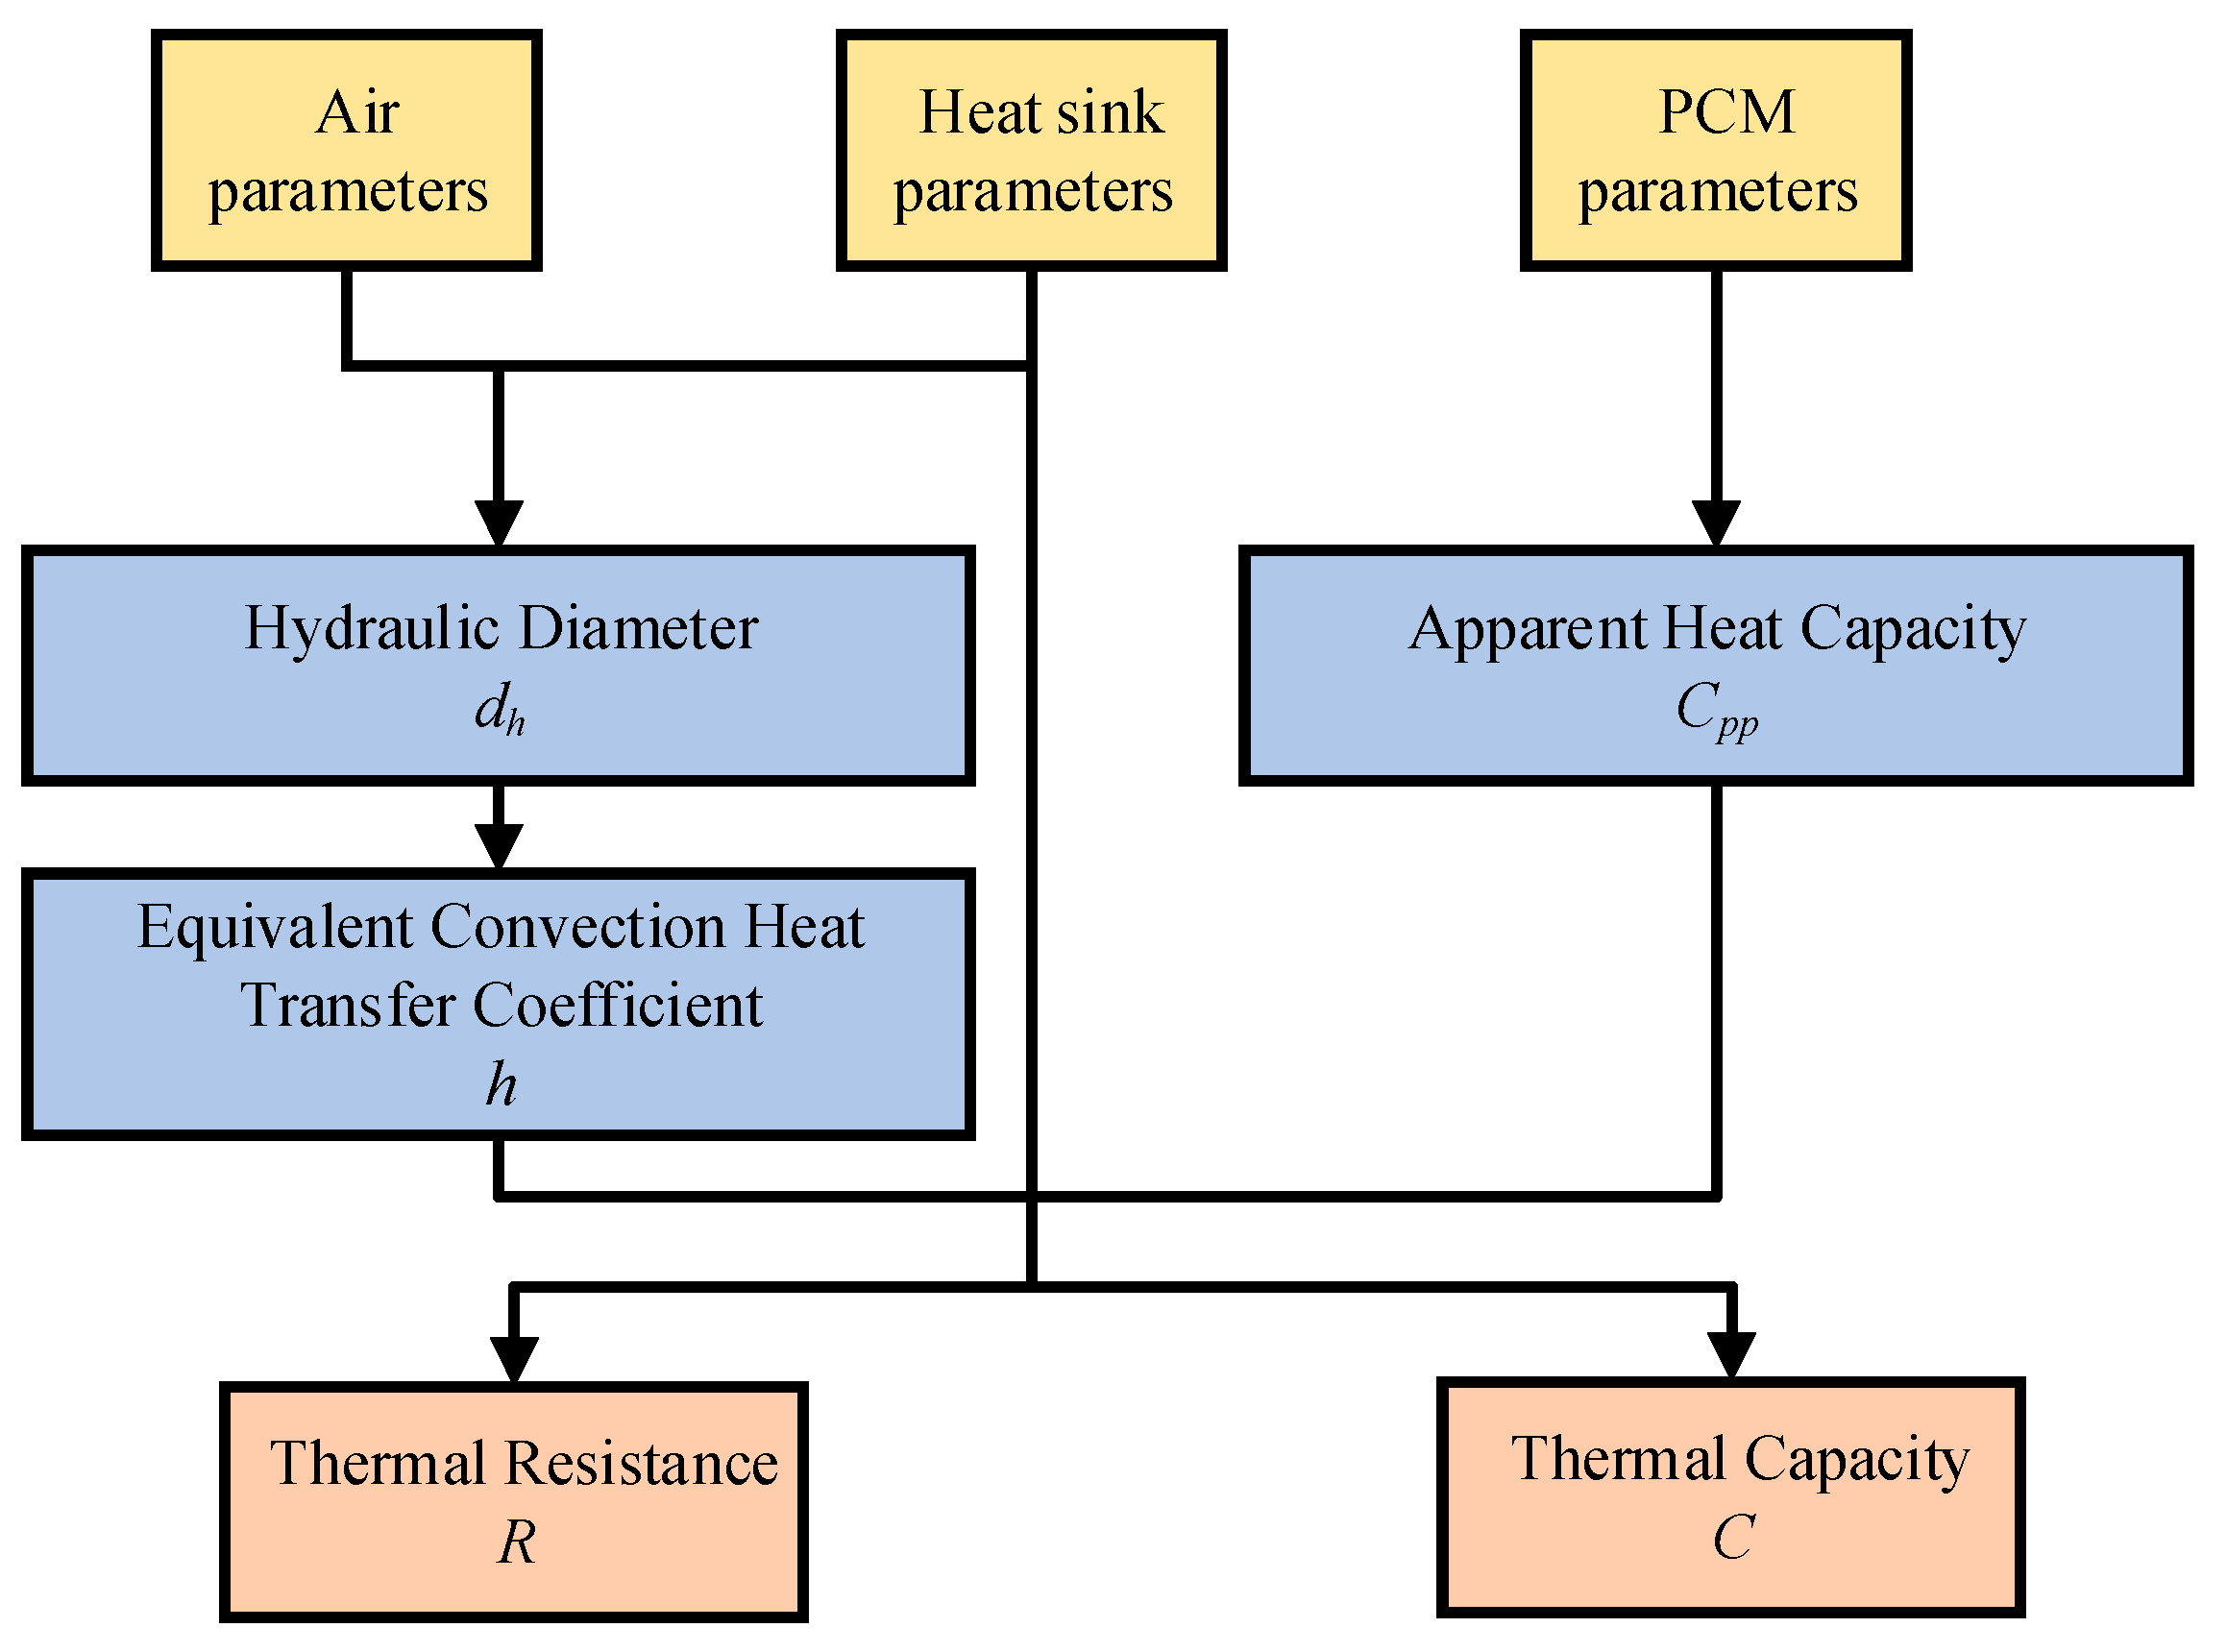
2.3. The Equivalent Convection Heat Transfer Coefficient

In order to study the effects of air velocity on the heat sink, the calculation of the equivalent convection heat transfer coefficient is needed. The convection heat transfer coefficient can be calculated by the following Equation:
d h = 2 s · c s + c
h = N u m · λ A I R d h
where dh is the hydraulic diameter of one channel; s is the width of the fin spacing; c is the height of the fin; Num is the average Nusselt number; λAIR is the thermal conductivity of air.

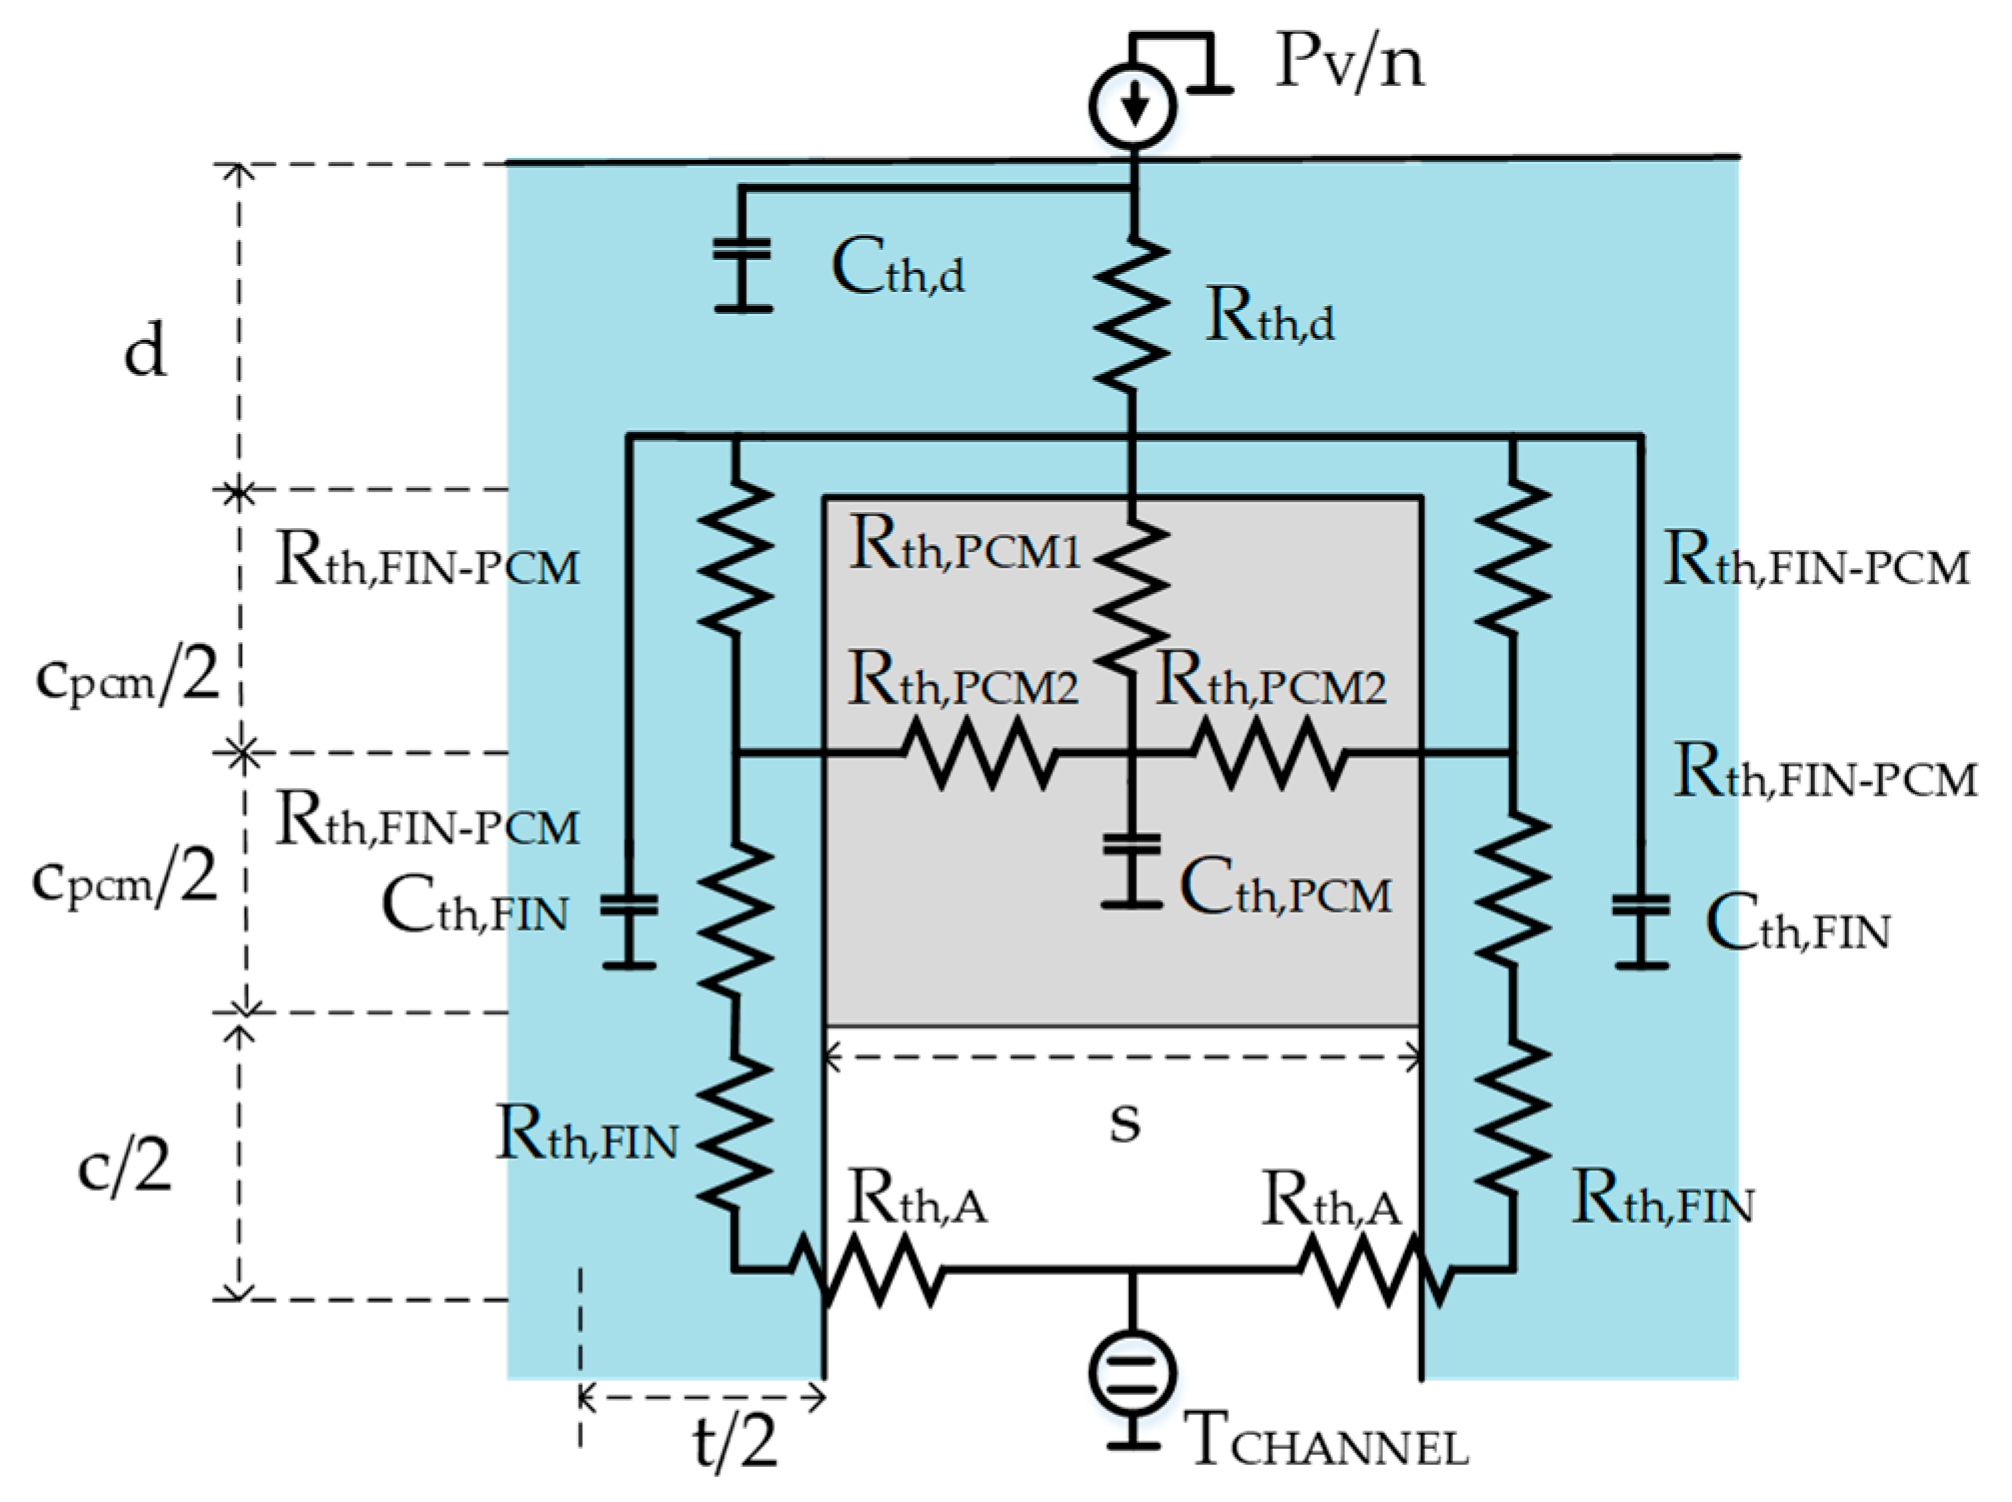
2.4. Thermal Network Parameters of the Heat Sink

The thermal network for one channel of the heat sink configuration is given in Figure 2.
The thermal network parameters can be calculated by Equations (4)–(14). Detailed discussions and mathematical proofs are shown in Ref. [36,37,38].
R t h , d = n · d t · L · s · λ H S
C t h , d = 1 n A H S · ρ H S · C H S
Rth,d is the thermal resistance of the substrate, which describes the resistance of heat through the substrate; Cth,d is the thermal capacity of the substrate. D is the thickness of the substrate; t is the thickness of the fins; s is the width of the channel; L is the length of the channel; n is the number of channels; λHS is the thermal conductivity of heat sink (copper).
R t h , P C M 1 = c P C M s · L · λ P C M
R t h , P C M 2 = s c P C M · L · λ P C M
C t h , P C M = s · c P C M · L · ρ P C M · C a p p
A rectangular volume of PCM can be equivalent to a circuit composed of three thermal resistors (Rth,pcm, Rth,pcm2) amd a single thermal capacitor (Cth,PCM). Since the width of the channel is much smaller than the height of the fin, the thermal resistance between the PCM and the air is much greater than the thermal resistance between the fin and the air, and can be ignored. CPCM is the height of the channel filled with PCM; λPCM is the thermal conductivity of PCM; ρPCM is the density of the PCM. The Capp is the apparent heat capacity [39]. The Capp can be defined as:
C a p p = { C p , T T m e l t C p + Δ H Δ T , T m e l t < T < T m e l t + Δ T C p , T > T m e l t + Δ T
where the Tmelt is the melting point of PCM; Cp is the heat capacity of PCM; ΔT is phase transition interval; ΔH is the change in enthalpy of PCM.
R t h , F I N P C M = c P C M t · L · λ H S
Since the thermal conductivity of PCM is much smaller than that of metal, heat is more easily transferred from the substrate to the fins and then to the PCM and ambient. Rth,FIN−PCM is used to describe the thermal resistance of heat through this path.
R t h , F I N = c P C M t · L · λ H S
C t h , F I N = 1 2 · t · L · s · ρ H S · C H S
Rth,FIN is the thermal resistance of the fin, which describes the resistance of heat through the fin. Cth,FIN is the thermal capacity of the fin.
R t h , A = 1 h · L · c
R t h , S - a = 1 n ( R t h , d + 1 2 ( R t h , F I N + R t h , A ) ) + 0.5 ρ A I R · c p , A I R · V
Rth,A is the contact thermal resistance between the fin and air. Rth,S−a is the total thermal resistance of the heat sink. h is the convect heat transfer coefficient; ρAIR is the density of air; cp,AIR is the specific heat capacity of the air; V is volume flow.
The calculation flow chart of the ampacity is shown in Figure 3.

3. Control Equations

3.1. Control Equations

In the flow-thermal coupling model, the temperature of the heat sink is calculated using the thermal field governing Equation. The flow of the PCM is obtained by the stratospheric flow control Equation. The heat source used in the heat transfer control Equation comes from calculations of the power loss of thyristor.
(1) The control Equation of the solid heat transfer physics applied to the heat sink and thyristors is:
ρ C p d T d t + · q = Q
q = k T
where ρ is the density of the material; Cp is the solid constant pressure heat capacity; q is the local flux density; k is the thermal conductivity; Q is the heat source in solid materials.
The control Equation of the fluid heat transfer physics applied to the liquid metal model is:
ρ C p d T d t + · q + ρ C p u · T = Q
where μ is the speed of the fluid.
The control Equation of the phase change physics applied to the PCM model is:
ρ = θ 1 ρ 1 + θ 2 ρ 2
C p = 1 ρ ( θ 1 ρ 1 C p , 1 + θ 2 ρ 2 C p , 2 ) + L 1 2 T ( 1 2 θ 1 ρ 1 · θ 2 ρ 2 ( θ 1 ρ 1 + θ 2 ρ 2 ) )
k = θ 1 k 1 + θ 2 k 2
θ 1 + θ 2 = 1
where θ1 and θ2 are the volume fraction of the solid phase and the liquid phase, respectively; ρ1 and ρ2 are the density of the solid phase and the liquid phase, respectively; Cp,1 and Cp,2 are the constant pressure heat capacity of the solid phase and the liquid phase, respectively; k1 and k2 are the thermal conductivity of the solid phase and the liquid phase, respectively; L1→2 is the latent heat of phase change.
(2) The control Equation of the laminar flow physics applied to the PCM is
ρ u t + ρ ( u · ) u = [ ρ I + μ ( u + ( u ) T ) ] + F + ρ g
ρ ( u ) = 0
where ρ is the density of PCM; u is a velocity vector of fluid; I is a unit matrix; μ is the power; T is the temperature of PCM; F is volume force; g is the gravitational acceleration.

3.2. The Power Loss of Thyristor

The power losses of the thyristor are divided into four parts: conduction loss, switching loss, leakage loss, and control loss. For standard rectification applications, the power loss caused by the forward current accounts for the largest proportion. In this study, the conduction loss is regarded as the total losses of the thyristor. The conduction loss can be calculated by the following Equation:
P l o s s = V T O I T A V + r T I T A V 2 F 2
where VTO is the threshold voltage; ITAV is the on-state average current; rT is the slope resistance; F is the conduction coefficient.

3.3. The Boundary Conditions and Grid Division of Simulation

(1)
For solid and liquid heat transfer boundary conditions, the solid and liquid heat transfer physics are used in all fields. The air boundary is set at a constant temperature of 30 °C.
(2)
Airflow heat transfer can be simplified by using the convective heat flux. The convective heat flux can be expressed as:
q = h · ( T e x t T )
where q is heat flux; h is the heat transfer coefficient; Text is the external temperature; and, T is the temperature of the air.
(3)
For fluid field boundary conditions, fluid field physics is used in the field of PCM. In this case, “open boundary” is connected to the boundary of the PCM. The assuming Equation can be expressed as:
[ p I + μ ( u + ( u ) T ) ] n = f 0 n
where p is the pressure of the surface; n is a unit direction vector of the boundary; f0 is the normal stress.

4. Results and Discussion

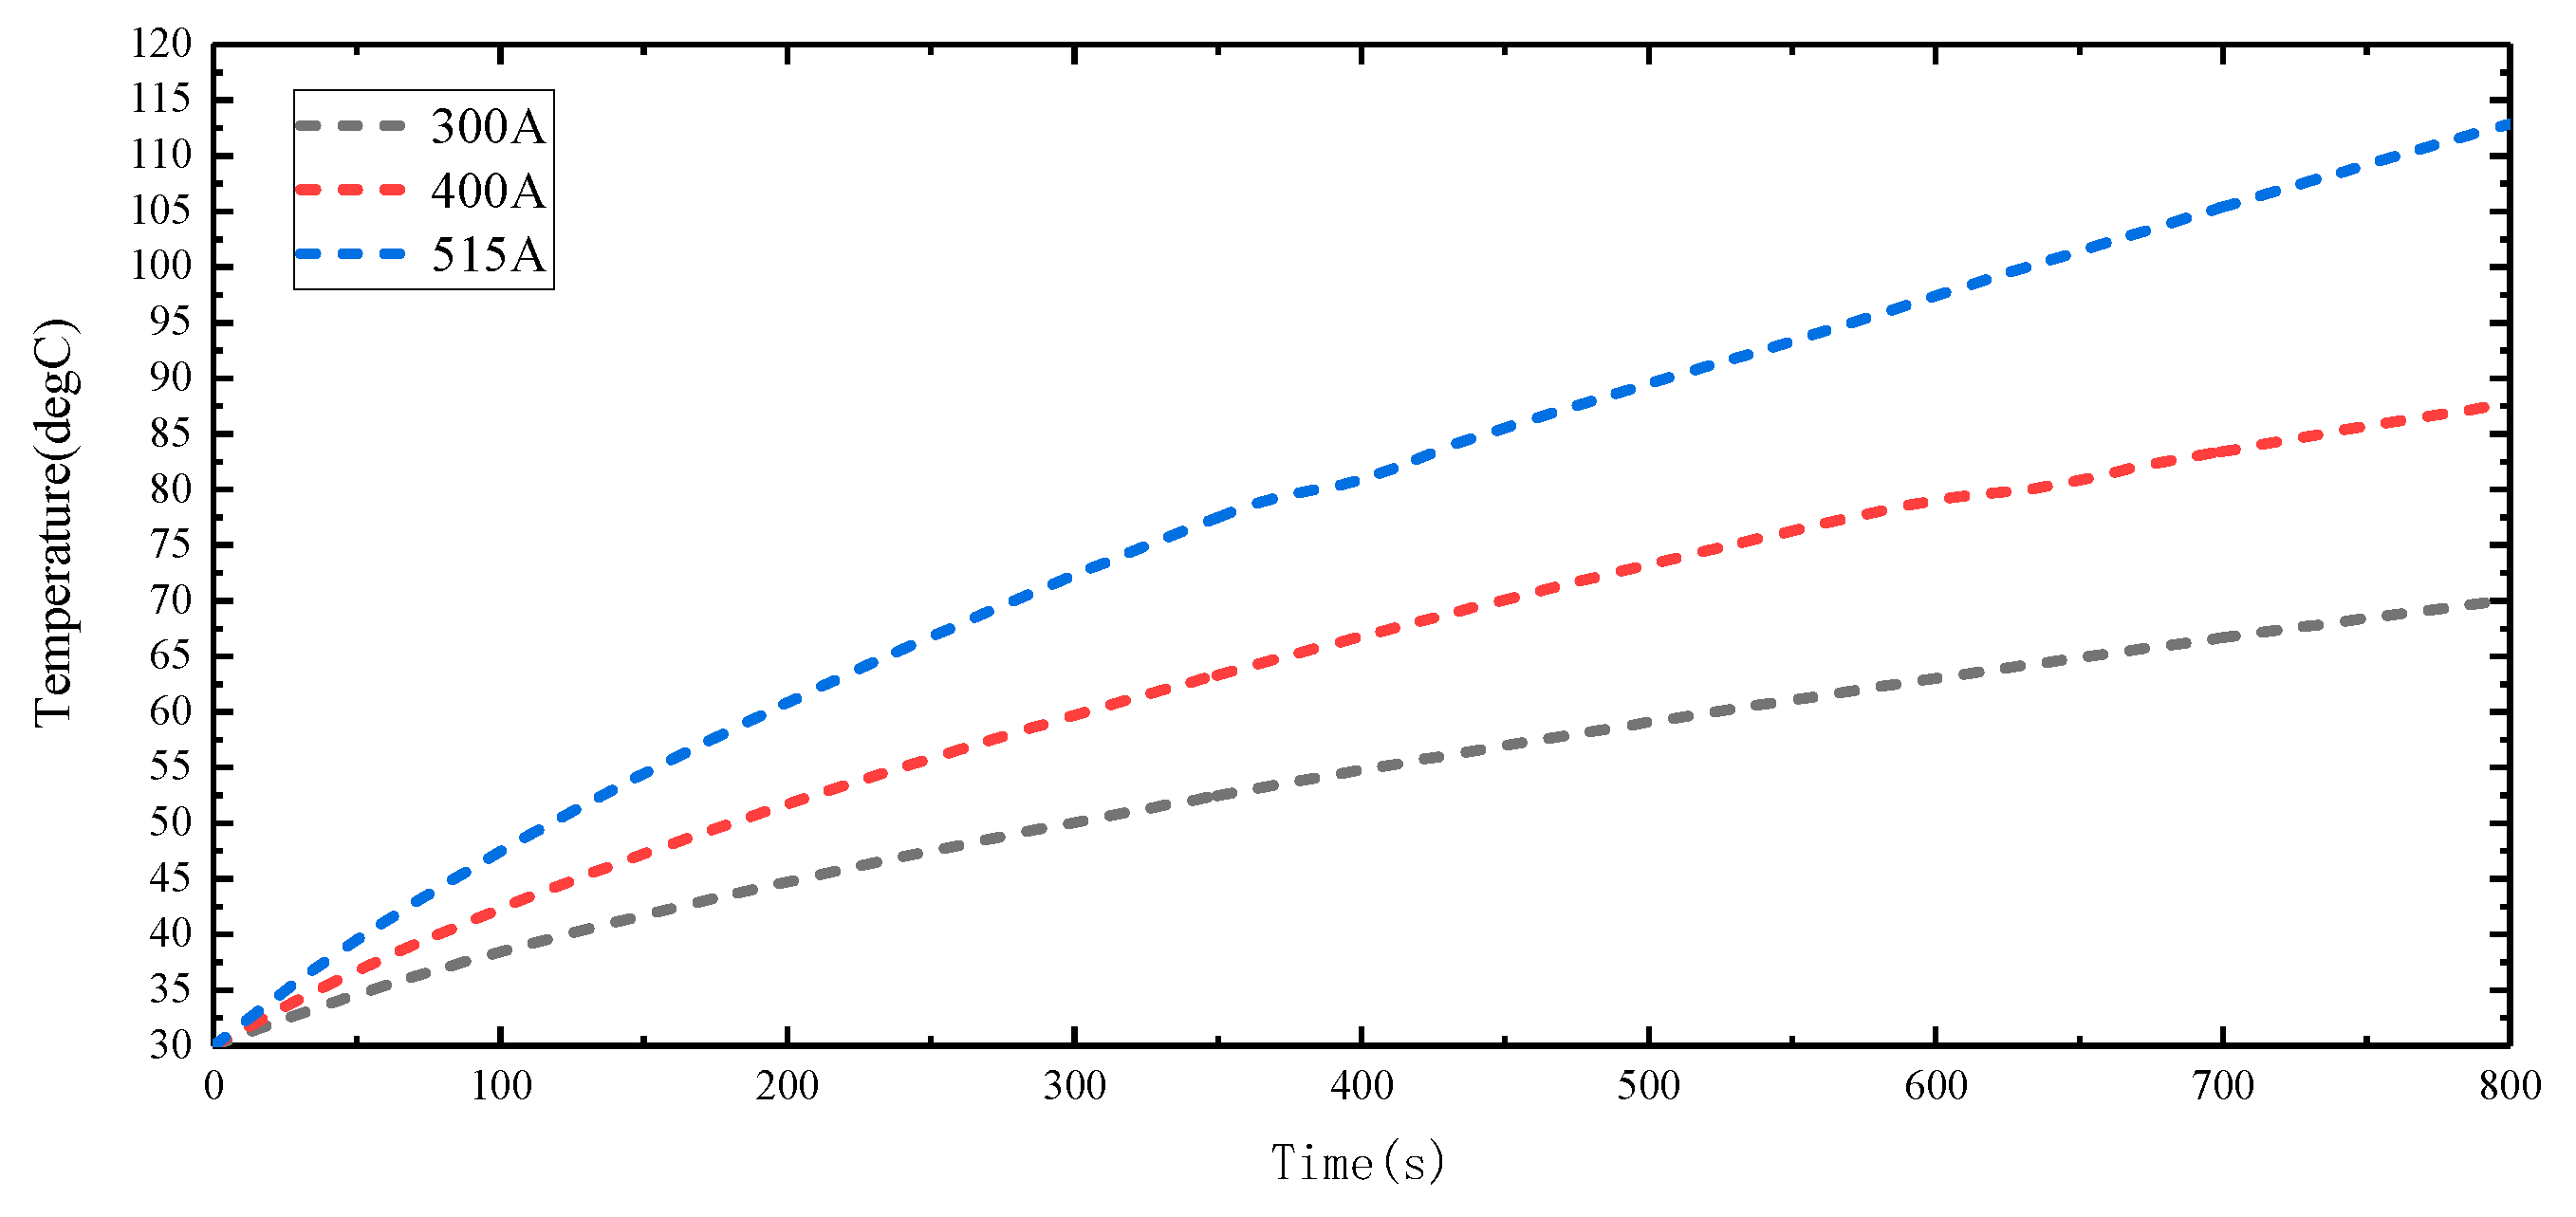
4.1. Effects of Power Loss

In order to study the thermal performance of the heat sink under different power levels, different power losses were applied to the thyristor model. In this case, a 1600 V/510 A Thyristor-Modul, ETT510N16P60 (Infineon Technologies AG, Munich, Germany) from Infineon, was taken as an example. According to Equation (24) and the datasheet of ETT510N16P60, the power losses are 323 W, 468 W, and 657 W respectively, when the maximum forward average currents are 300 A, 400 A, and 515 A. Assuming that the velocity of air is 0.1 m/s, the thermal conductivity of copper is 400 W/mK. The effects of different power losses on the thyristor temperature and the temperature field distribution were studied under these conditions.
Figure 4 shows the temperature distribution of the PCM heat sink under three different maximum forward average currents at 400 s. The temperature distribution was improved by the mesh-finned structure. The center temperatures of the thyristor are 54.78 °C, 66.80 °C, and 80.92 °C, respectively. Figure 5 shows the temperature changes of the thyristor under three different maximum forward average currents. When the power loss is set to a low value, the heat sink does not provide temperature protection. At 300 A, the beneficial effect of the PCM is nearly absent, since the temperature of the thyristor is lower than the melting point. When the maximum forward average current is set to a high value, the temperature reaches the melting point of PCM. The PCM starts melting and the temperature rise of the thyristor decreases. At 400 A, the heat sink protects for 40 s. At 515 A, the heat sink protects for 20 s. With the increase of power loss of thyristor, the protection time provided by the heat sink reduces. Therefore, the effect of the PCM heat sink in constraining the thyristor temperature rise is proven.
The power loss significantly affects the temperature protection time of the heat sink. It should be noted that the PCM will not melt when the maximum forward average current is lower than 300 A. Hence, the power loss of thyristor should be taken into consideration in designing PCM heat sinks for thyristors. Besides this, the time of temperature protection should be much longer than the time of failure removing.

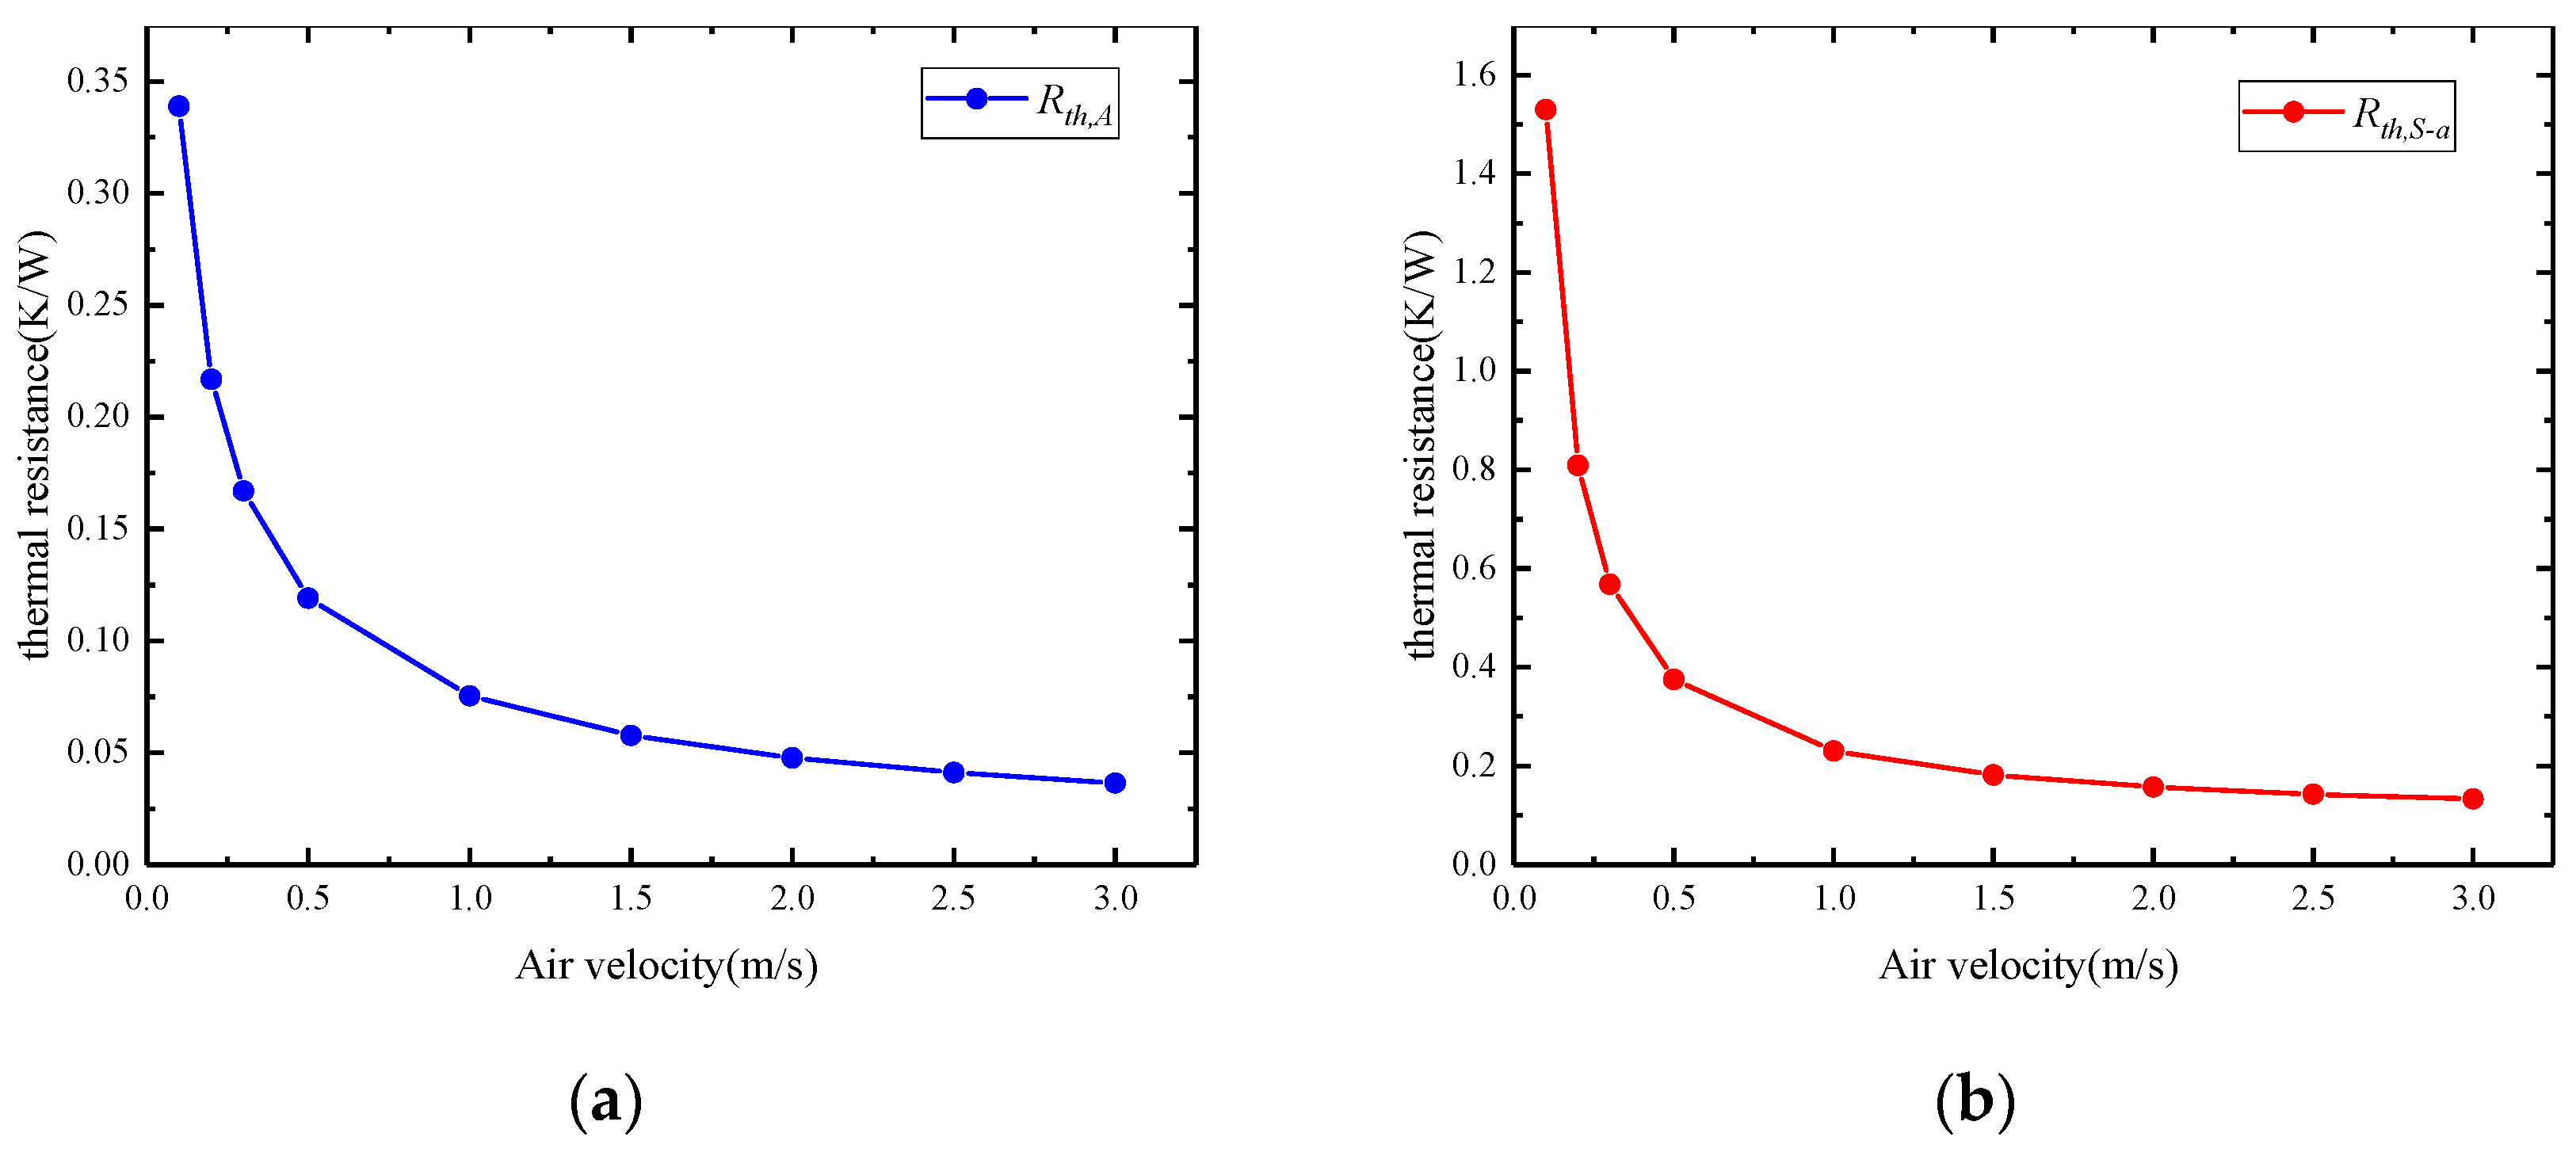
4.2. Effects of Air Velocity

It is assumed that the maximum forward average currents of the thyristor are 515 A and 0 A, and the initial temperatures of this model are 30 °C and 100 °C, respectively. The effects of air velocity on the PCM heat sink were studied. In this case, the air velocities are set to 0.1 m/s, 0.5 m/s, 1 m/s, and 3 m/s. According to Equations (2) and (3), the equivalent convective heat transfer coefficients are 5.03 W/mK, 14.3 W/mK, 22.6 W/mK, and 46.7 W/mK.
Figure 6a shows the time-temperature curves for four different air velocities under the full load of the thyristor. When the air velocities are set to 0.1 m/s, 0.5 m/s, and 1 m/s, the protection times provided by the PCM heat sink are 28 s, 85 s, and 120 s, respectively. As the air velocity increases, the time required for the PCM to melt increases gradually. The heat absorbed by the PCM is determined by the mass quality, latent heat, and the time of melting. Effective protection requires a short melting time. When the air velocity is 0.1 m/s, the heat sink has the best thermal performance during the melting process. It should be noted that, if the air velocity is 3 m/s, the temperature of the heat sink can not reach the melting point of the PCM and the protection of the heat sink will not work. The main reason is that the temperature of the thyristor is reduced by forced air convection and the temperature of the thyristor is too low to activate the melting of PCM. Therefore, high airflow is not conducive to the thermal management of the thyristor.
Figure 6b shows time-temperature curves for four different air velocities under no-load of the thyristor. When the fault of the circuit is eliminated, the temperature of the thyristor is reduced to the ambient temperature, and the latent heat of PCM is released for the next protection. It can be seen that as the air velocity increases, the recovery time of the PCM decreases. When the air velocities are set to 0.1 m/s, 0.5 m/s, and 1 m/s, the recovery times are 100 s, 56 s, and 48 s, respectively. The protection times provided by the PCM heat sink are increased by 204% and 329%, and the recovery time is reduced by 44% and 52%, respectively. When the air velocity is 3 m/s, the recovery time can be reduced to 20 s.
Under the condition of natural convection, the heat sink has the best performance of protection. However, the heat absorption capacity of PCM is difficult to restore. To take advantage of PCMs’ latent heat periodically, tradeoffs between the melting time and the recovery time of the PCM need to be made. It is necessary to optimize the velocity of air. When the thyristor works under the full load condition, a lower velocity of air should be selected to provide effective protection; when the thyristor is removed from the circuit, a higher velocity of air should be selected to restore the protection capability of the PCM.

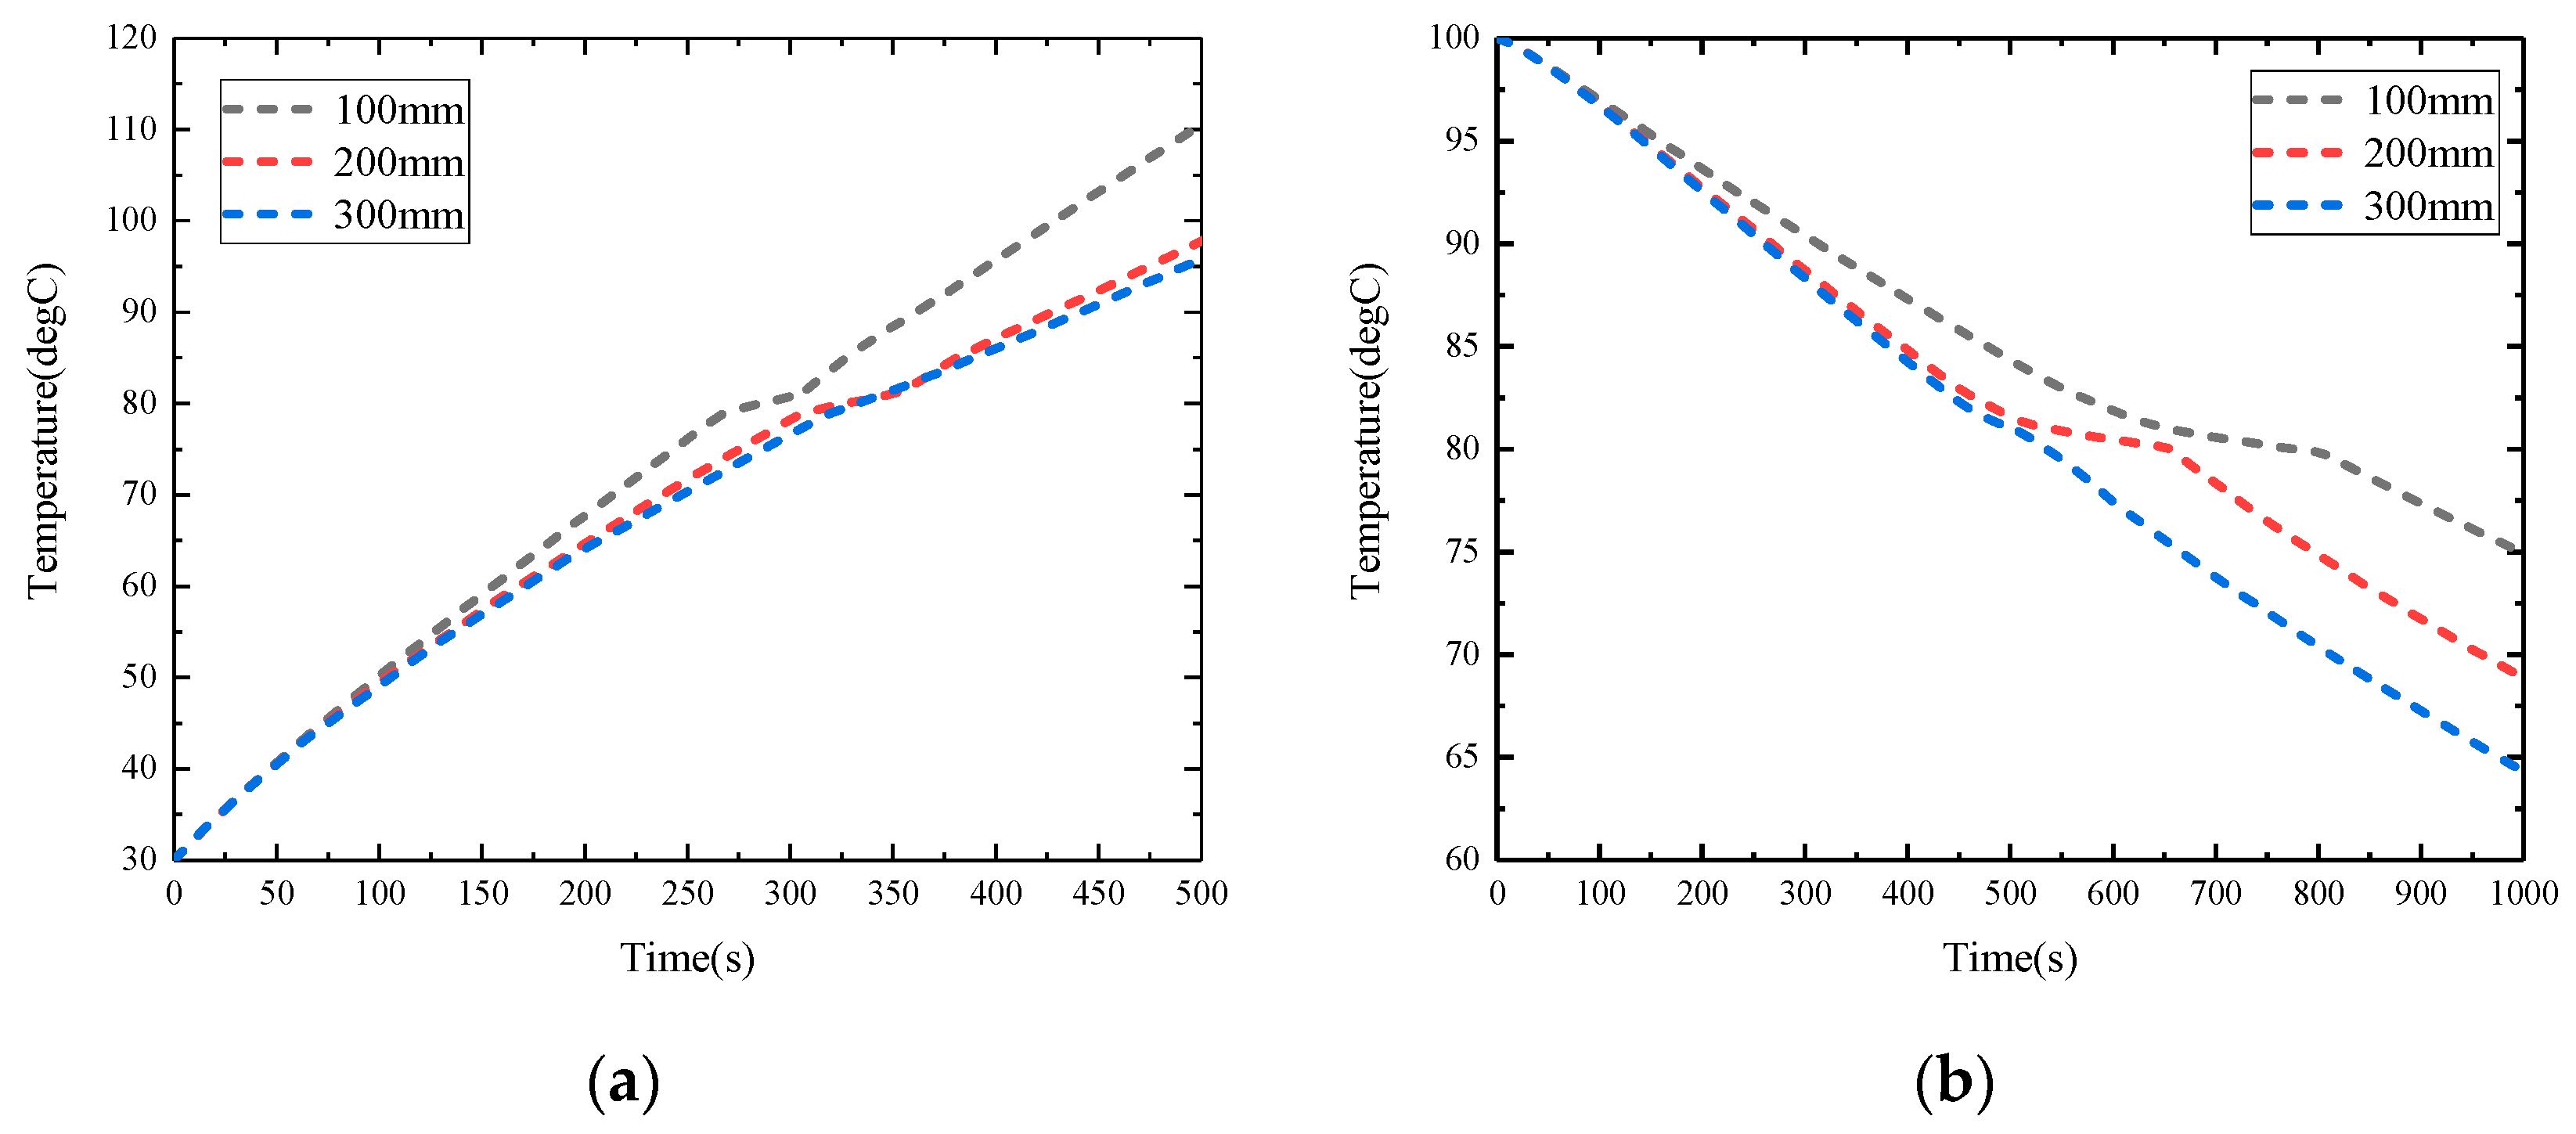
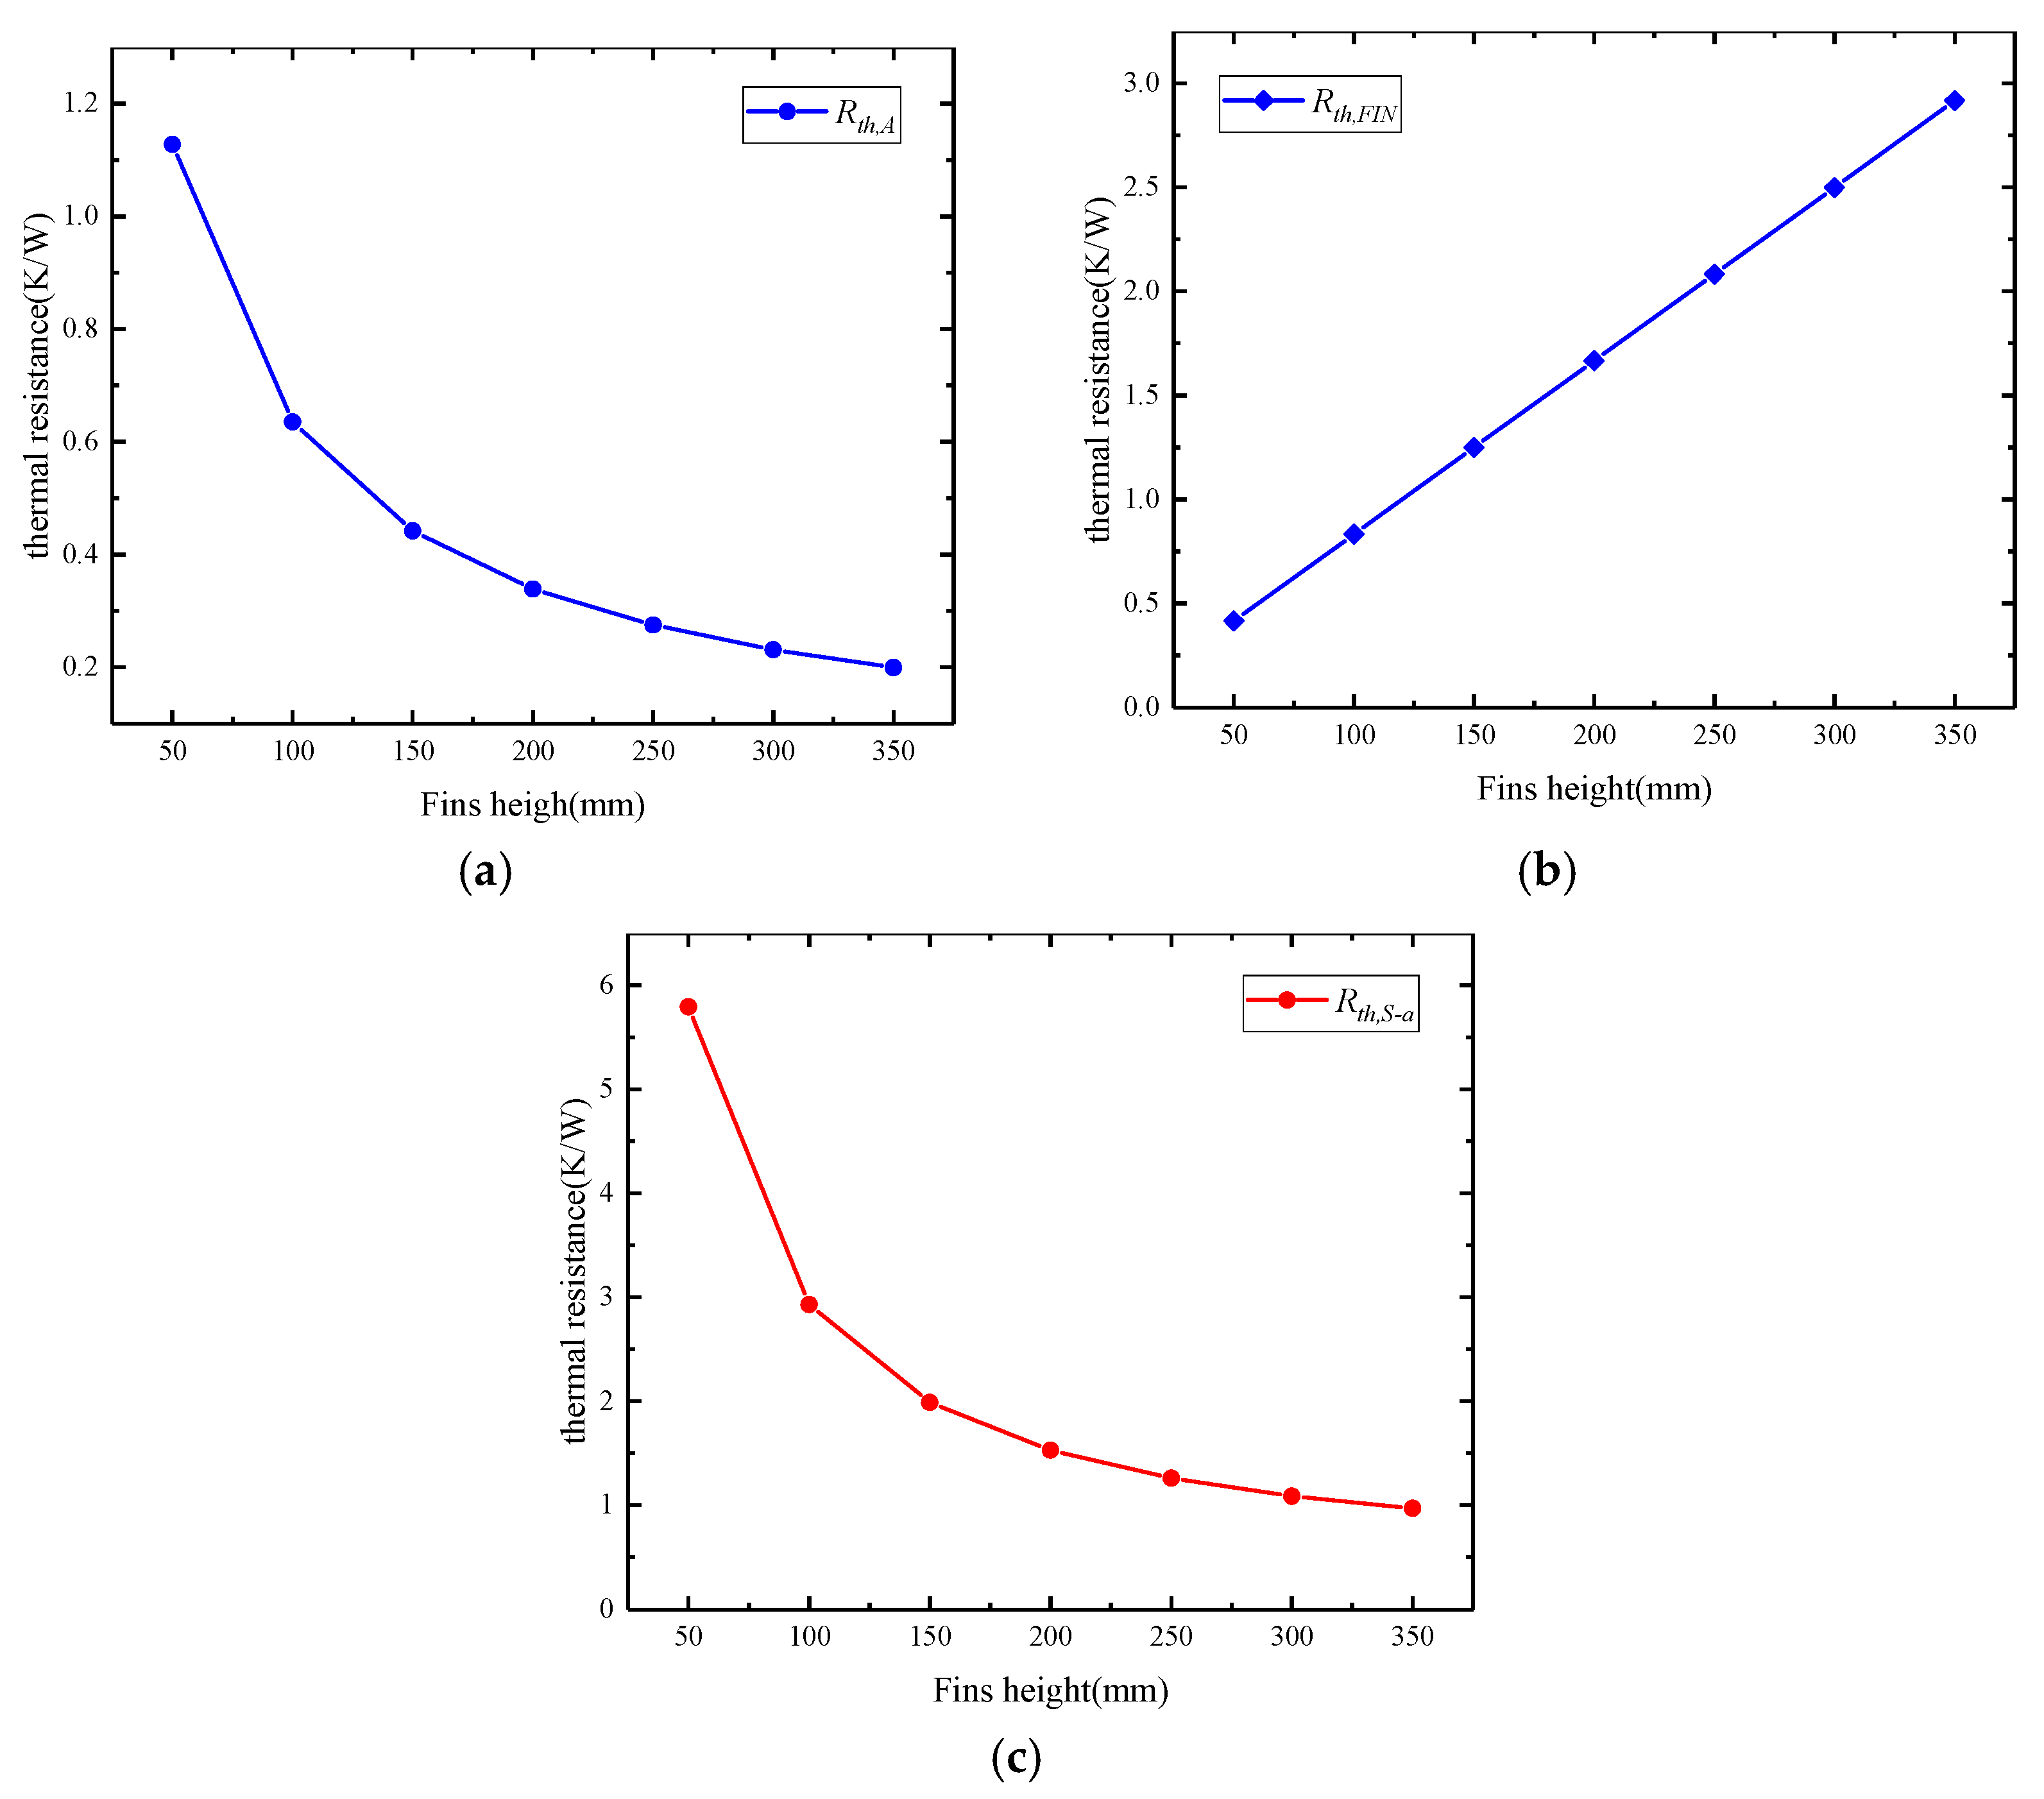
4.3. Effects of the Height of Fins

It is assumed that the initial temperatures of this model are 30 °C and 100 °C when the thyristor working in full load and no-load conditions, respectively, and the air velocity is 0.1 m/s. This model takes a value every 100 mm from the height of fins 100 mm–300 mm to study the effect with different heights of fins on the thyristor temperature.
Figure 7a shows the time-temperature curves for different heights of fins under the condition of full load on the thyristor. It can be observed that the melting time of PCM is reduced, and the rising rate of the overall temperature is reduced. This is because more heat can be transferred into the air from the increased heat exchange area. As the height of the fin reaches 300 mm, the effect of PCM is hard to be seen from the curve due to the short melting time and low rate of temperature rise.
Figure 7b shows the time-temperature curves for different heights of fins under the no-load of the thyristor. As the height of the fin increases, thyristor temperature and the recovery time of PCM are reduced due to the increase in the heat transfer area.
The height of fins has a great influence on the temperature of the thyristor. With the increase of the height of fins, the heat exchange area of the heat sink increases, thereby the efficiency of heat transfer to the air is improved. However, while increasing the thermal performance of the system, it increases the volume of the heat sink as well. In addition, the cost of the heat sink is increased. Hence, when designing the mesh-finned heat sink, the height of the fins should be optimized to reduce the cost.

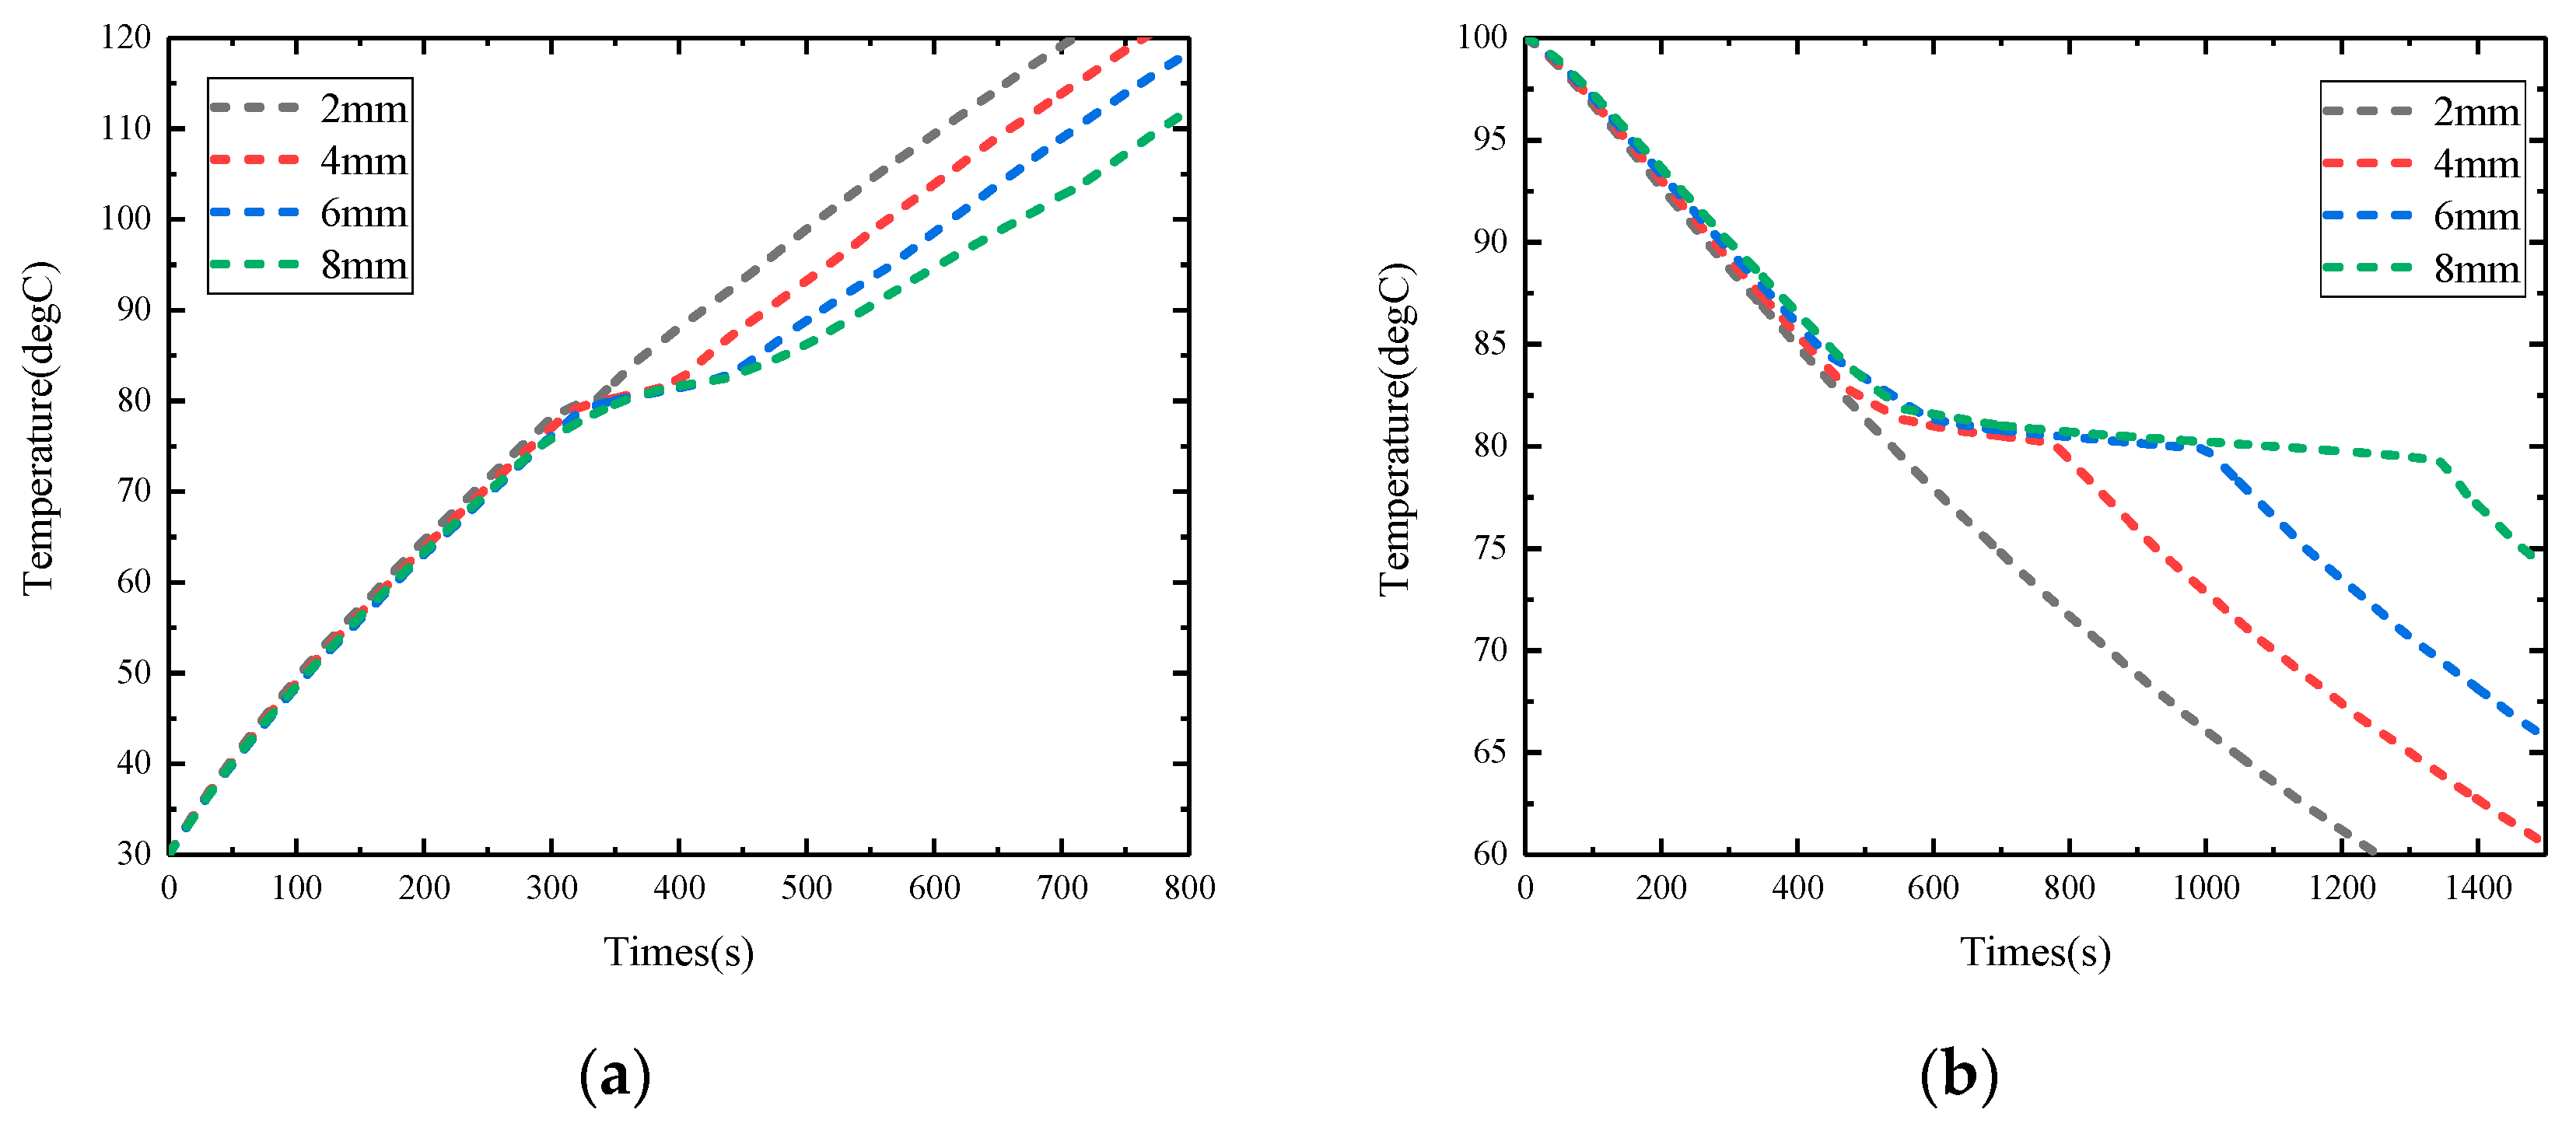
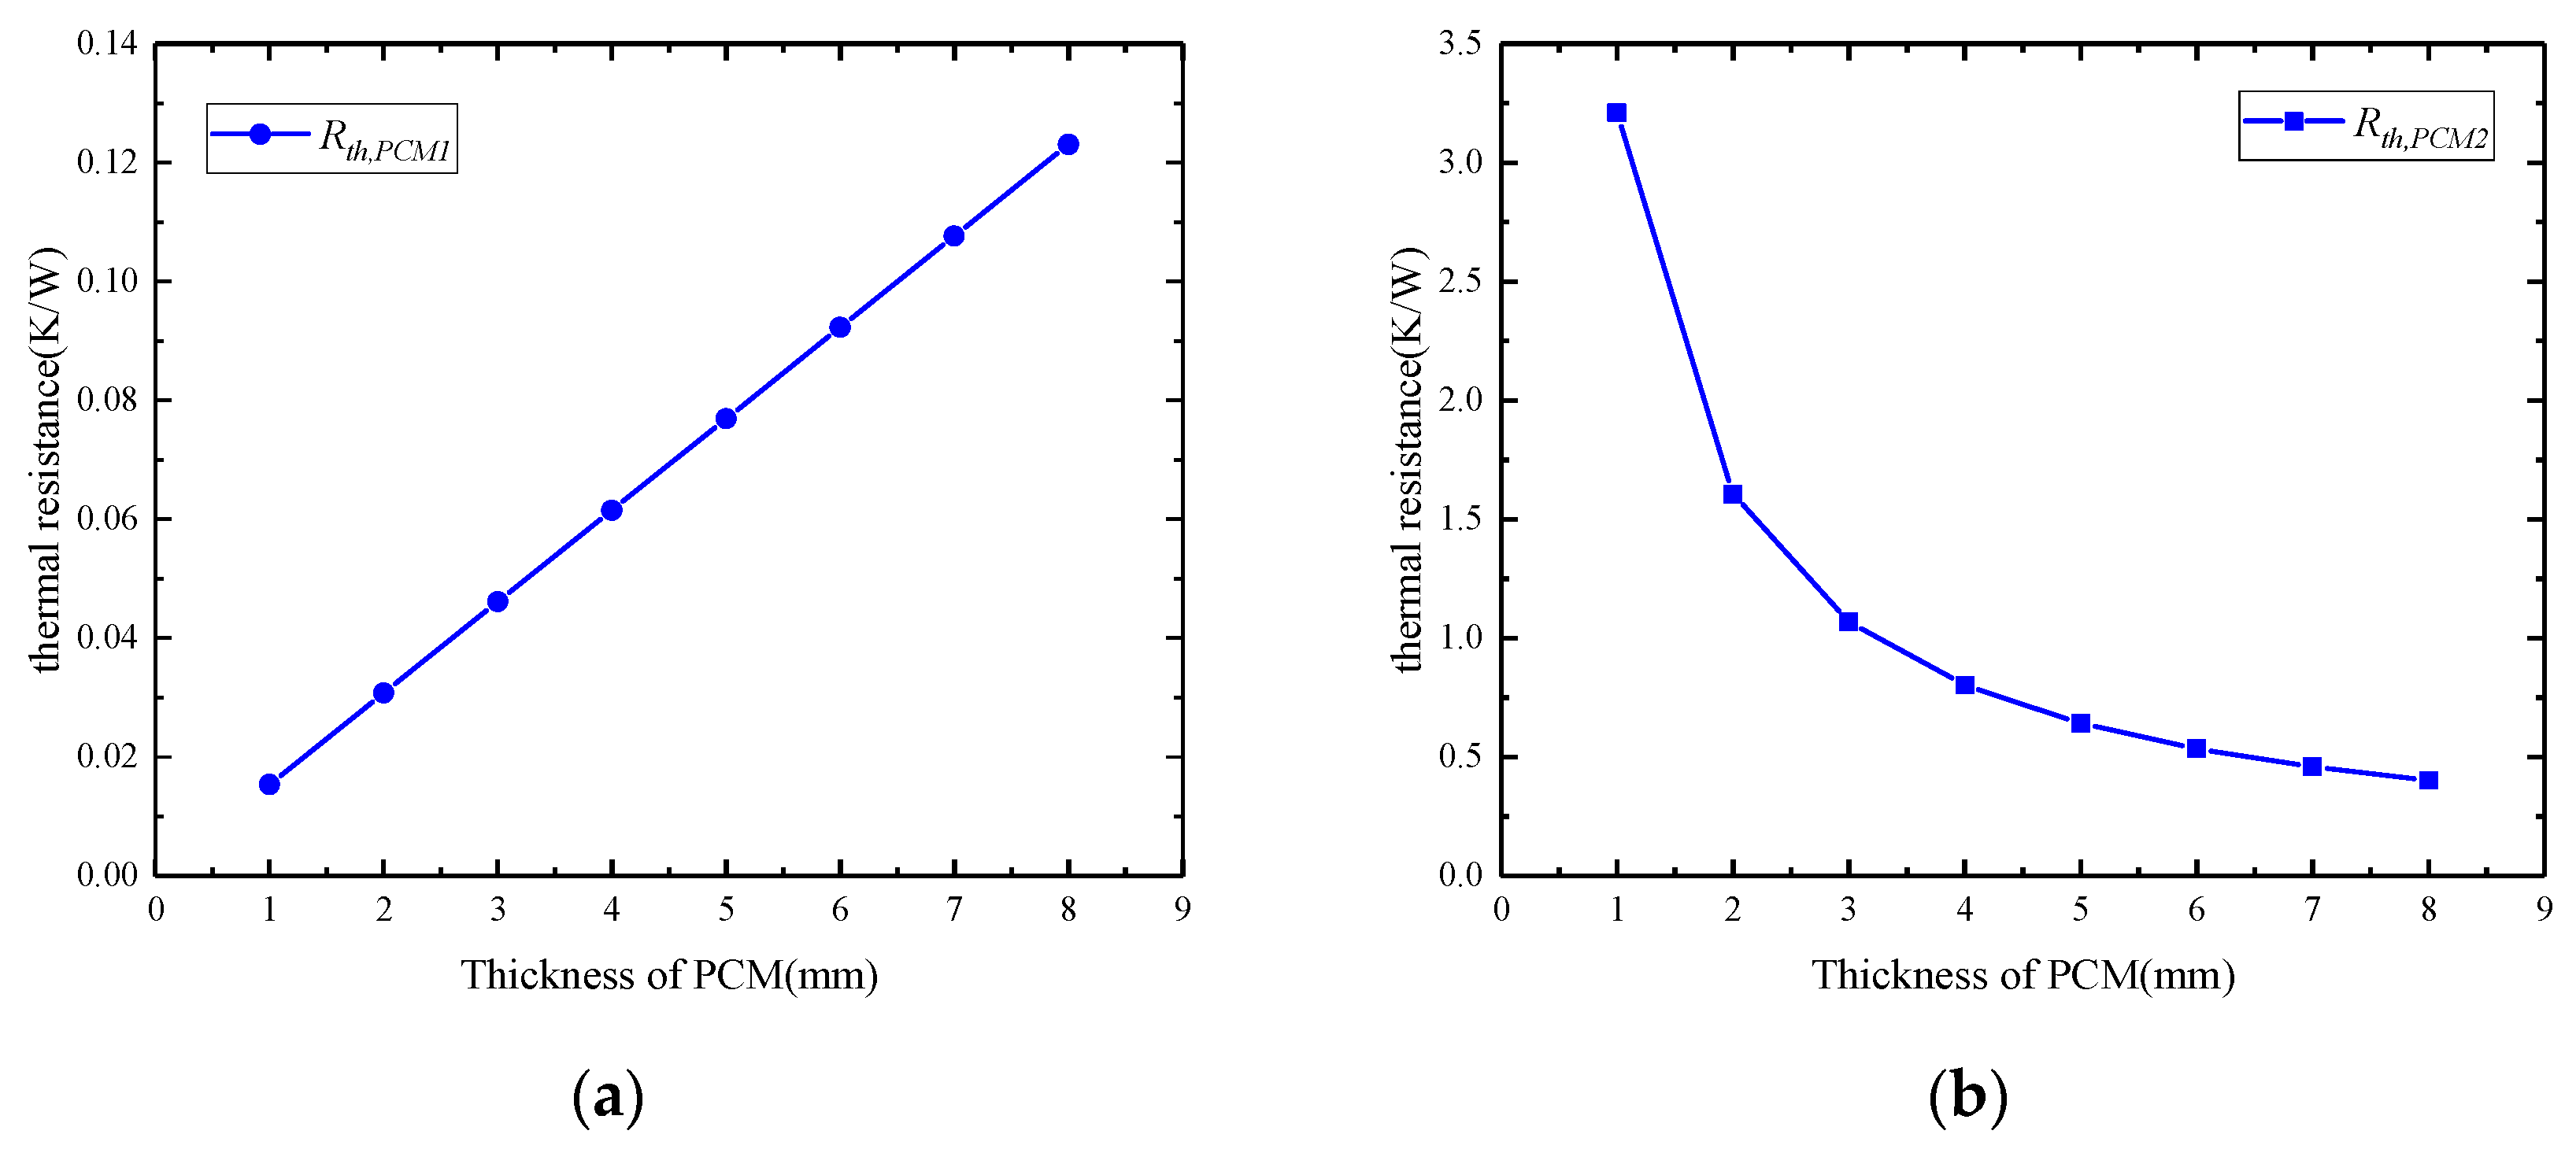
4.4. Effects of the Thickness of PCM

Assume that the air velocity is 0.1 m/s, the height of fins is 200 mm, and the thyristor is working in full load and no-load conditions, respectively. In this case, the thickness of PCM is set to 2 mm, 4 mm, 6 mm, and 8 mm. The effects of the thickness of PCM were studied under these conditions.
Figure 8a shows the time-temperature curves for different thicknesses of PCM under the condition of full load on the thyristor. We can notice that the melting time increased with the increase of the thickness of PCM. The reason is the increase in PCM quality thermal resistance. It should be noted that the melting times of 6 mm and 8 mm are similar. It helps to improve the thermal performance of the heat sink. Figure 8b shows time-temperature curves under the condition of no-load on the thyristor. It can be seen that the solidification time increased with the increase of the thickness of PCM. There is almost no change in the rate of temperature drop outside the phase transition process. This can be attributed to the fact that the increase in mass increases the total latent heat of the PCM.
The phase transition process is shown in Figure 9. The red area shows that the PCM is in the liquid state and the blue area shows that the PCM is in the solid phase. As shown in Figure 9a, when the heat is transferred from the substrate to the bottom PCM, the bottom PCM begins to melt. There is a melting boundary between liquid PCM and solid PCM. At 400 s (Figure 9b), the melting boundary gradually moves upward. However, due to the high thermal resistance of the PCM, the heat of thyristor is difficult to transfer to the PCM, which is farther from the substrate. Therefore, the PCM far away from the substrate is still in the solid phase. At 450 s (Figure 9c), the melted PCM appears adjacent to the fins, and the heat starts to transfer from fins to the solid area of PCM, bypassing the high resistance PCM. At 500 s (Figure 9d), most of the PCM is melted due to the enhanced thermal conductivity of the mesh fins. Mesh fins offset the high thermal resistance caused by the increased thickness of PCM. Therefore, the effect of mesh fins in enhancing thermal conductivity is proven.

4.5. Variation of Thermal Network Parameters

The thermal resistance and capacity are important parameters that determine the thermal performance of the system. These parameters of the thermal network can be used to optimize the design of the heat sink. It is assumed that the ambient temperature is 30 °C, and the number of metal grids is 81. The thermal network parameters are studied as the height of fins and air velocity changed.
According to Equations (4)–(14), as the air velocity changes, only two thermal network parameters are changed. Figure 10a shows the changes in thermal resistance between the fin of the heat sink and the channel of air. It can be seen that the thermal resistance Rth,A decreases as the air velocity increases. The change in the total thermal resistance of the heat sink is shown in Figure 10b. When the air velocity is lower than 1 m/s, the effect on thermal resistance is significant. However, if the air velocity is higher than 1m/s, the effect on Rth,A will be weakened. Therefore, in order to optimize the size of the heat sink and reduce the energy losses due to the forced air convection, the air velocity should be set below 1 m/s.
According to Equations (4)–(14), the variation of thermal network parameters with the height of fins are shown in Figure 11. Three parameters are changed. Figure 11a shows changes in thermal resistance between the fins of the heat sink and the channel of air with different height of fins. As the height of the fins increases, the thermal resistance decreases. As the area of the fins exposed to the air increases, heat is more easily transferred from the fins to the air. This is the main reason why PCM solidification gets intensified. Figure 11b shows changes in thermal resistance of fin. It can be seen that the thermal resistance of fin has a positive linear change, which is due to the linear increase of fin structure. As the height of the fins increases, the distance required for heat transfer from the substrate to the top of the fins increases. As a result, the fins conduction thermal resistance Rth, FIN is increased. The increased thermal resistance makes it difficult for heat to be transferred to the air, thereby increasing the temperature of the heat sink and intensifying the melting of the PCM, which explains the phenomenon in Figure 7a. Figure 11c shows changes in the total thermal resistance of the heat sink. Combining the changes of the thermal resistances Rth,A and Rth,FIN, the total thermal resistance of the heat sink decreases with the increase of height of fins gradually. When the height of the fins is higher than 200 mm, the effect of the PCM on thermal resistance gets weakened. Therefore, the height of the fins should be set below 200 mm to optimize the size of the PCM heat sink.
According to Equations (4)–(13), as the thickness of PCM changes, four thermal network parameters are changed. It is easy to know from Equation (8) and Equation (9) that Rth,FIN−PCM and Cth,PCM increase linearly with the increase of thickness of PCM. The changes of Rth,PCM1 and Rth,PCM2 are shown in Figure 12. In Figure 12a, it can be seen that Rth,PCM1 linear increase due to the high thermal resistance of PCM. Heat absorption will be hindered by the high thermal resistance of PCM. As the thickness of the PCM increases, the vertical distance between the PCM and the substrate increases. Therefore, the heat of thyristor is difficult to transfer from the PCM close to the substrate to the PCM far away from the substrate, which manifests as an increase in thermal resistance Rth,PCM1. Figure 12b shows changes in the thermal resistance between the fin and the PCM. It can be seen that Rth,PCM2 is inversely proportional to the thickness of PCM. As the thickness of the PCM increases, the contact area between the PCM and the fins increases, so that heat is more easily transferred from the fins to the PCM, which manifests as a decrease in thermal resistance Rth,PCM2. This is the main mechanism of the heat conduction enhancement of mesh fins. However, if the thickness of PCM is higher than 4 mm, the effect of mesh fins will be weakened.
When the air velocity is 1 m/s, the height of the fins is 200 mm, and the thickness of PCM is 4 mm, the protection time and recovery time are 80 s and 100 s, respectively. The thermal network parameters are listed in Table 3.

5. Conclusions

In this paper, a low-melting metal mesh-finned heat sink was investigated for the thermal management of thyristors. A heat transfer field and fluid field multi-physical coupling model was established to analyze the effects of different power losses, air velocities, heights of fins, and thickness of PCM on the thermal performance of PCM heat sink. Besides this, the thermal network parameters were calculated to optimize the thermal performance of the PCM heat sink. The following conclusions were obtained:
  • The result shows that the PCM heat sink provides temperature protection for high-power thyristors when the power loss is high (Ploss > 323 W in this study). Furthermore, the protection time decreases as the power increases.
  • The flowing air reduces the recovery time of the PCM. Meanwhile, the forced air convection prolongs the melting time required by PCM, which weakens the protective effect of the PCM heat sink. When the air velocities rise from 0.1 m/s to 0.5 m/s and 1 m/s, the protection times provided by the PCM heat sink is increased by 204% and 329%, and the recovery time is reduced by 44% and 52%, respectively.
  • As the height of the fins increases, the time required for PCM to solidify and melt decreases. When the height of the fin is higher than 200 mm, the effect of the PCM on the temperature of the thyristor gets weakened. Therefore, when designing a PCM heat sink, the height of the fins should not be higher than 200 mm.
  • Mesh fins provide a path of low thermal resistance to enhance the transfer of heat bypassing the high-resistance PCM. When the PCM thickness reaches 8 mm, the protection time provided by the heat sink is similar to that of 6 mm, but the recovery time is greatly extended. Therefore, setting the thickness of the PCM below 6 mm is a better choice.
  • Through the quantitative analysis of the thermal network, the design of the PCM heat sink is optimized to reduce the thermal response time and recovery time. After optimizing the designed PCM heat sink, the it provides 80 s protection time and 100 s recovery time for thermal management of thyristors.

Author Contributions

Conceptualization, J.L. and S.Y. (Shangxin Yu); methodology, S.Y. (Shangxin Yu); validation, J.L., S.Y. (Shangxin Yu), and S.Y. (Shichang Yang).; formal analysis, S.Y. (Shangxin Yu); investigation, J.L.; resources, Y.Z.; data curation, S.Y. (Shichang Yang); writing—original draft preparation, S.Y. (Shangxin Yu); writing—review and editing, X.F.; visualization, B.G.; supervision, J.L.; project administration, J.L. All authors have read and agreed to the published version of the manuscript.

Funding

This work was supported in part by the National Natural Science Foundation of China (61473272; 51867003), and in part by the Natural Science Foundation of Guangxi (2018JJB160064; 2018JJA160176), the Guangxi Bagui Young Scholars Special Funding, the Boshike Award Scheme for Young Innovative Talents, Guangxi Key Laboratory of Power System Optimization and Energy Technology Project (AE3020001829), and the Basic Ability Improvement Project for Young and Middle-aged Teachers in Universities of Guangxi (20190067; 20190046).

Conflicts of Interest

The authors declare no conflict of interest.

References

  1. Yeh, L.T. Review of heat transfer technologies in electronic equipment. J. Electron. Packag. 1995, 117, 333–339. [Google Scholar] [CrossRef]
  2. Porto, T.R.N.; Delgado, J.; Guimarães, A.S.; Magalhães, H.L.F.; Moreira, G.; Correia, B.R.B.; De Andrade, T.F.; De Lima, A.G.B. Phase change material melting process in a thermal energy storage system for applications in buildings. Energies 2020, 13, 3254. [Google Scholar] [CrossRef]
  3. Di Bari, R.; Horn, R.; Nienborg, B.; Klinker, F.; Kieseritzky, E.; Pawelz, F. The environmental potential of phase change materials in building applications. A multiple case investigation based on life cycle assessment and building simulation. Energies 2020, 13, 3045. [Google Scholar] [CrossRef]
  4. Liu, Z.; Lou, F.; Qi, X.; Shen, Y. Enhancing heating performance of low-temperature air source heat pumps using compressor casing thermal storage. Energies 2020, 13, 3269. [Google Scholar] [CrossRef]
  5. Saha, S.K.; Das, R.B. Exergetic and performance analyses of two-layered packed bed latent heat thermal energy storage system. Int. J. Energy Res. 2020, 44, 2208–2225. [Google Scholar] [CrossRef]
  6. Salih, S.M.; Jalil, J.M.; Najim, S.E. Experimental and numerical analysis of double-pass solar air heater utilizing multiple capsules PCM. Renew. Energy 2019, 143, 1053–1066. [Google Scholar] [CrossRef]
  7. Riahi, S.; Jovet, Y.; Saman, W.Y.; Belusko, M.; Bruno, F. Sensible and latent heat energy storage systems for concentrated solar power plants, exergy efficiency comparison. Sol. Energy 2019, 180, 104–115. [Google Scholar] [CrossRef]
  8. Fayaz, H.; Rahim, N.; Hasanuzzaman, M.; Nasrin, R.; Rivai, A. Numerical and experimental investigation of the effect of operating conditions on performance of PVT and PVT-PCM. Renew. Energy 2019, 143, 827–841. [Google Scholar] [CrossRef]
  9. Ling, Z.; Wang, F.; Fang, X.; Gao, X.; Zhang, Z. A hybrid thermal management system for lithium ion batteries combining phase change materials with forced-air cooling. Appl. Energy 2015, 148, 403–409. [Google Scholar] [CrossRef] [Green Version]
  10. A Khateeb, S.; Farid, M.; Selman, J.; Al-Hallaj, S. Design and simulation of a lithium-ion battery with a phase change material thermal management system for an electric scooter. J. Power Sources 2004, 128, 292–307. [Google Scholar] [CrossRef]
  11. Al-Hallaj, S.; Selman, J. Thermal modeling of secondary lithium batteries for electric vehicle/hybrid electric vehicle applications. J. Power Sources 2002, 110, 341–348. [Google Scholar] [CrossRef]
  12. Tan, F.; Tso, C. Cooling of mobile electronic devices using phase change materials. Appl. Therm. Eng. 2004, 24, 159–169. [Google Scholar] [CrossRef]
  13. Yoo, D.W.; Joshi, Y.K. Energy efficient thermal management of electronic components using solid-liquid phase change materials. IEEE Trans. Device Mater. Reliab. 2004, 4, 641–649. [Google Scholar] [CrossRef]
  14. Kandasamy, R.; Wang, X.-Q.; Mujumdar, A.S. Transient cooling of electronics using phase change material (PCM)-based heat sinks. Appl. Therm. Eng. 2008, 28, 1047–1057. [Google Scholar] [CrossRef]
  15. Yang, X.-H.; Tan, S.-C.; Ding, Y.-J.; Wang, L.; Liu, J.; Zhou, Y.-X. Experimental and numerical investigation of low melting point metal based PCM heat sink with internal fins. Int. Commun. Heat Mass Transf. 2017, 87, 118–124. [Google Scholar] [CrossRef]
  16. Baby, R.; Balaji, C. Thermal performance of a PCM heat sink under different heat loads: An experimental study. Int. J. Therm. Sci. 2014, 79, 240–249. [Google Scholar] [CrossRef]
  17. Kandasamy, R.; Wang, X.-Q.; Mujumdar, A.S. Application of phase change materials in thermal management of electronics. Appl. Therm. Eng. 2007, 27, 2822–2832. [Google Scholar] [CrossRef]
  18. Yang, X.-H.; Tan, S.-C.; He, Z.-Z.; Zhou, Y.-X.; Liu, J. Evaluation and optimization of low melting point metal PCM heat sink against ultra-high thermal shock. Appl. Therm. Eng. 2017, 119, 34–41. [Google Scholar] [CrossRef]
  19. Ergün, A.; Eyinç, H. Performance assessment of novel photovoltaic thermal system using nanoparticle in phase change material. Int. J. Numer. Methods Heat Fluid Flow 2019, 29, 1490–1505. [Google Scholar] [CrossRef]
  20. Chang, T.-C.; Lee, S.; Fuh, Y.-K.; Peng, Y.-C.; Lin, Z.-Y. PCM based heat sinks of paraffin/nanoplatelet graphite composite for thermal management of IGBT. Appl. Therm. Eng. 2017, 112, 1129–1136. [Google Scholar] [CrossRef]
  21. Wang, H.; Wang, F.; Tang, Y.; Tang, Y.; Yu, B.; Yuan, W. Experimental investigation on the thermal performance of a heat sink filled with porous metal fiber sintered felt/paraffin composite phase change material. Appl. Energy 2016, 176, 221–232. [Google Scholar] [CrossRef]
  22. Shao, W.; Ran, L.; Jiang, H.; Kastha, D.; Bajpai, P.; Wu, R.; Mawby, P.A.; Zeng, Z. Power module with large short-term current capability by using phase change material. J. Eng. 2019, 2019, 3225–3229. [Google Scholar] [CrossRef]
  23. Zou, D.; Ma, X.; Liu, X.; Zheng, P.; Hu, Y. Thermal performance enhancement of composite phase change materials (PCM) using graphene and carbon nanotubes as additives for the potential application in lithium-ion power battery. Int. J. Heat Mass Transf. 2018, 120, 33–41. [Google Scholar] [CrossRef]
  24. Renteria, J.D.; Nika, D.L.; Balandin, A.A. Graphene thermal properties: Applications in thermal management and energy storage. Appl. Sci. 2014, 4, 525–547. [Google Scholar] [CrossRef] [Green Version]
  25. Zhu, Z.-Q.; Huang, Y.-K.; Hu, N.; Zeng, Y.; Fan, L.-W. Transient performance of a PCM-based heat sink with a partially filled metal foam: Effects of the filling height ratio. Appl. Therm. Eng. 2018, 128, 966–972. [Google Scholar] [CrossRef]
  26. Fan, L.-W.; Zhu, Z.-Q.; Zeng, Y.; Xiao, Y.-Q.; Liu, X.-L.; Wu, Y.-Y.; Ding, Q.; Yu, Z.-T.; Cen, K. Transient performance of a PCM-based heat sink with high aspect-ratio carbon nanofillers. Appl. Therm. Eng. 2015, 75, 532–540. [Google Scholar] [CrossRef]
  27. Ghalambaz, M.; Mehryan, S.-A.-M.; Tahmasebi, A.; Hajjar, A. Non-Newtonian phase-change heat transfer of nano-enhanced octadecane with mesoporous silica particles in a tilted enclosure using a deformed mesh technique. Appl. Mathmat. Model. 2020, 85, 318–337. [Google Scholar] [CrossRef]
  28. Wu, S.Y.; Wang, H.; Xiao, S.; Zhu, D.S. An investigation of melting/freezing characteristics of nanoparticle-enhanced phase change materials. J. Therm. Anal. Calorim. 2012, 110, 1127–1131. [Google Scholar] [CrossRef]
  29. Fan, L.-W.; Fang, X.; Wang, X.; Zeng, Y.; Xiao, Y.-Q.; Yu, Z.-T.; Xu, X.; Hu, Y.-C.; Cen, K. Effects of various carbon nanofillers on the thermal conductivity and energy storage properties of paraffin-based nanocomposite phase change materials. Appl. Energy 2013, 110, 163–172. [Google Scholar] [CrossRef]
  30. Zarma, I.; Emam, M.; Ookawara, S.; Ahmed, M. Thermal management of concentrator photovoltaic systems using nano-enhanced phase change materials-based heat sink. Int. J. Energy Res. 2020, 44, 7713–7733. [Google Scholar] [CrossRef]
  31. Amin, M.; Putra, N.; Kosasih, E.A.; Prawiro, E.; Luanto, R.A.; Mahlia, T. Thermal properties of beeswax/graphene phase change material as energy storage for building applications. Appl. Therm. Eng. 2017, 112, 273–280. [Google Scholar] [CrossRef]
  32. Yu, W.; Xie, H.; Chen, L.; Li, Y. Investigation of thermal conductivity and viscosity of ethylene glycol based ZnO nanofluid. Thermochim. Acta 2009, 491, 92–96. [Google Scholar] [CrossRef]
  33. Mahmoud, S.; Tang, A.; Toh, C.; Al-Dadah, R.; Soo, S.L. Experimental investigation of inserts configurations and PCM type on the thermal performance of PCM based heat sinks. Appl. Energy 2013, 112, 1349–1356. [Google Scholar] [CrossRef]
  34. Krishnan, S.; Garimella, S.; Kang, S. A novel hybrid heat sink using phase change materials for transient thermal management of electronics. IEEE Trans. Compon. Packag. Technol. 2005, 28, 281–289. [Google Scholar] [CrossRef] [Green Version]
  35. Infineon Technologies. IGBT Modules. Available online: https://www.infineon.com/cms/en/product/power/diodes-thyristors/thyristor-diode-modules/ett510n16p60/ (accessed on 21 August 2020).
  36. Stupar, A.; Drofenik, U.; Kolar, J.W. Optimization of phase change material heat sinks for low duty cycle high peak load power supplies. IEEE Trans. Compon. Packag. Manuf. Technol. 2011, 2, 102–115. [Google Scholar] [CrossRef]
  37. Drofenik, U.; Laimer, G.; Kolar, J.W. Theoretical converter power density limits for forced convection cooling. In Proceedings of the International Conference, Power Electronics, Intelligent Motion, Power Quality, Zurich, Switzerland, 7–9 June 2005; pp. 608–619. [Google Scholar]
  38. Drofenik, U.; Laimer, G.; Kolar, J. Pump characteristic based optimization of a direct water cooling system for a 10-kW/500-kHz vienna rectifier. IEEE Trans. Power Electron. 2005, 20, 704–714. [Google Scholar] [CrossRef]
  39. Alawadhi, E.M.; Amon, C.H. PCM thermal control unit for portable electronic devices: Experimental and numerical studies. IEEE Trans. Compon. Packag. Technol. 2003, 26, 116–125. [Google Scholar] [CrossRef]
Figure 1. Schematic diagram of the PCM heat sink with mesh-finned structure (a) The structure of the model; (b) the top view of the model.
Energies 13 04658 g001
Figure 2. The thermal network showing the heat flow through one channel of the PCM heat sink.
Energies 13 04658 g002
Figure 3. The flow chart of calculated thermal network parameters.
Energies 13 04658 g003
Figure 4. The temperature distribution of PCM heat sink under three different maximum forward average currents at 400 s. (a) The temperature distribution of the PCM heat sink at 300 A; (b) The temperature distribution of the PCM heat sink at 400 A; (c) The temperature distribution of the PCM heat sink at 515 A.
Energies 13 04658 g004
Figure 5. The temperature changes of the center of the thyristor under three maximum forward average current.
Energies 13 04658 g005
Figure 6. The time-temperature curves for four air velocities. (a) The time-temperature curves under full load conditions; (b) The time-temperature curves under no-load conditions.
Energies 13 04658 g006
Figure 7. The time-temperature curves for three different fins. (a) The time-temperature curves under full load conditions; (b) The time-temperature curves under no-load conditions.
Energies 13 04658 g007
Figure 8. The time-temperature curves for four different thicknesses of PCM. (a) The time-temperature curves under full load conditions; (b) The time-temperature curves under no-load conditions.
Energies 13 04658 g008
Figure 9. Plan view of melt front with time for the thickness of 8mm. (a) 350 s; (b) 400 s; (c) 450 s; (d) 500 s.
Energies 13 04658 g009
Figure 10. The changes in thermal resistance with different air velocity. (a) Comparison of the Rth,A with different air velocity; (b) Comparison of the Rth,S−a with different air velocity.
Energies 13 04658 g010
Figure 11. The changes in thermal resistance with different height of fins. (a) Comparison of the Rth,A with different height of fins; (b) Comparison of the Rth,FIN with different height of fins; (c) Comparison of the Rth,S−a with different height of fins.
Energies 13 04658 g011
Figure 12. The changes in thermal resistance with different thicknesses of PCM. (a) Comparison of the Rth,PCM1 with different thicknesses of PCM; (b) Comparison of the Rth,PCM2 with different thicknesses of PCM.
Energies 13 04658 g012
Table 1. The specific parameters of phase change material (PCM).
PCMMelting Temperature (°C)Latent Heat (kJ/kg)Density (kg/m3)Thermal Conductivity (W/m·k)
Paraffin46–48173.49000.12
Lauric acid43.5–48.2187.219400.16
LM6060103.2625026
LM8080115.4630031
LM150150118.6652030
Table 2. The specific parameters of the heat sink.
StructureLong (mm)Wide (mm)High (mm)
Y-fin1502200
X-fin150210
Substrate1501502
Thyristor1508052
Table 3. The thermal network parameters of the heat sink.
Rth,A (K/W)Rth,FIN (K/W)Rth,d (K/W)Rth,S−a (K/W)Rth,FIN−PCM (K/W)
0.07551.66670.00220.23020.0333
Cth,d (J/K)Cth,FIN (J/K)Rth,PCM1 (K/W)Rth,PCM2 (K/W)Cth,PCM (J/K)
18.14417.47200.061500.802427.0400

