Article

Life Cycle Assessment of Synthetic Natural Gas Production from Different CO2 Sources: A Cradle-to-Gate Study

1
Department of Energy, Systems, Territory and Construction Engineering (DESTeC), University of Pisa, 56122 Pisa, Italy
2
Fraunhofer Institute for Environmental, Safety, and Energy Technology, UMSICHT, 46047 Oberhausen, Germany
3
Business Administration and Production Management, University of Duisburg-Essen, 47057 Duisburg, Germany
*
Authors to whom correspondence should be addressed.
Energies 2020, 13(17), 4579; https://doi.org/10.3390/en13174579
Submission received: 30 June 2020 / Revised: 13 August 2020 / Accepted: 25 August 2020 / Published: 3 September 2020

Abstract

:
Fuel production from hydrogen and carbon dioxide is considered an attractive solution as long-term storage of electric energy and as temporary storage of carbon dioxide. A large variety of CO2 sources are suitable for Carbon Capture Utilization (CCU), and the process energy intensity depends on the separation technology and, ultimately, on the CO2 concentration in the flue gas. Since the carbon capture process emits more CO2 than the expected demand for CO2 utilization, the most sustainable CO2 sources must be selected. This work aimed at modeling a Power-to-Gas (PtG) plant and assessing the most suitable carbon sources from a Life Cycle Assessment (LCA) perspective. The PtG plant was supplied by electricity from a 2030 scenario for Italian electricity generation. The plant impacts were assessed using data from the ecoinvent database version 3.5, for different CO2 sources (e.g., air, cement, iron, and steel plants). A detailed discussion on how to handle multi-functionality was also carried out. The results showed that capturing CO2 from hydrogen production plants and integrated pulp and paper mills led to the lowest impacts concerning all investigated indicators. The choice of how to handle multi-functional activities had a crucial impact on the assessment.

1. Introduction

The increasing penetration of renewable energy in the energy mix demands new technologies for energy storage. For long-term storage (weekly to seasonal), Power-to-Gas (PtG) is regarded as one of the most promising technologies for its potential of storing large amounts of energy into an easily transportable chemical vector [1]. Besides its potential as energy storage, PtG is inserted in the framework of Carbon Capture and Utilization (CCU), which is “a family of technologies that convert otherwise industrially emitted or airborne CO2 into fuels, chemicals, and materials” [2]. In order to verify the sustainability of the proposed solution, it is crucial to assess PtG impacts on broad boundaries, under several impact categories and different inputs and system architectures (e.g., electricity generation mix, carbon separation technology). Despite the abundant availability of CO2, what remains untapped is the actual benefits of a large scale development of CCU, due to the variety of CO2 emitters and CCU conversion plants.
For some chemicals (namely, methanol and formic acid), CCU has been reported to be technologically feasible, economically viable under higher chemical market prices than the current ones, and reducing CO2 emissions in combination with renewable energy sources [3]. In line with this result, Matzen et al. [4,5] reported the sustainability of the production of renewable methanol, ammonia, and Dimethyl Ether (DME) from renewable hydrogen produced by wind energy. Van der Giesen et al. [6] quantified the impact of producing synthetic hydrocarbon fuels from CO2 using Fischer–Tropsch (FT) process using three different CO2 sources and three electricity sources in a cradle-to-grave approach, concluding that only two scenarios would emit fewer Greenhouse Gases (GHGs) than the conventional fuel production.
In contrast, research about Synthetic Natural Gas (SNG) has provided controversial results. On the one hand, Hoppe et al. [7] concluded that SNG production could save GHG emissions if compared to Natural Gas (NG), limiting their study to the Global Warming Impact (GWI). On the other, Stenberg et al. argued that the PtG pathways implied higher GWI and Fossil Depletion (FD) impacts than conventional NG even in a 2050 electricity mix [8]; when inserted in the framework of storage technologies, PtG implies higher GWI and FD impacts than power-to-heat and power-to-mobility technologies, even if influenced by the CO2 supply [9]. Hoppe et al. [10] analyzed the production of methane and other basic or derived polymers using some potential CO2 sources (air, raw biogas, cement plants, lignite-fired power plant, and municipal solid waste incineration) in a German scenario. Reiter and Lindorfer [11] evaluated different potential CO2 sources for PtG in Austria, identifying biogas upgrading facilities and bioethanol plants as the best-suited sources for CCU utilization, even if the highest point emissions were registered from iron and steel plants and fossil fuel combustion. In a broader perspective, in terms of impact categories, Zhang et al. [12] compared different Power-to-Hydrogen (PtH) and PtG technologies using the current Swiss energy mix and for a few carbon sources.
Due to the relative novelty of the topic and to the variety of factors to be considered, the literature lacks a comprehensive study determining whether the large scale implementation of CCU technologies would decrease the overall environmental impacts, under which conditions (e.g., energy mix and CO2 source) and to what extent [13]. Besides, most of the researchers have focused on some impact indicators (usually GWI and FD), while a full Life Cycle Assessment (LCA) on different impact indicators is recommended to ensure a comprehensive environmental assessment [14] and detect potential burden-shifting [15].
In the wake of these studies, this paper aimed at assessing PtG impacts from an LCA perspective for a broad range of CO2 sources and for a 2030 electricity generation mix (the Italian 2030 electricity mix was chosen for this case study). Both CO2 point sources (natural gas combined cycle power plants, refineries, and steam crackers, coal power plants, integrated pulp and paper mills, market pulp mills, iron and steel plants, cement plants, integrated gasification combined cycle power plants, ammonia/ethylene oxide/gas processing plants, hydrogen plants) and Direct Air Capture (DAC) were included in the study. The average energy demand for carbon capture technologies was considered, from von der Assen et al. [16]. They identified and ranked several carbon sources that could serve as CO2 utilization in Europe based on the marginal CO2 emissions. The PtG plant was simulated in the Aspen Plus environment, considering thermo-catalytic methanation in a fixed-bed reactor [17]. Besides comparing the investigated CO2 sources, a contribution analysis was carried out to assess the most crucial process on all indicators. The calculations were performed according to different methodologies (100-0 allocation, mass allocation, economic allocation) to quantify the impact of the multi-functionality handling on the results.

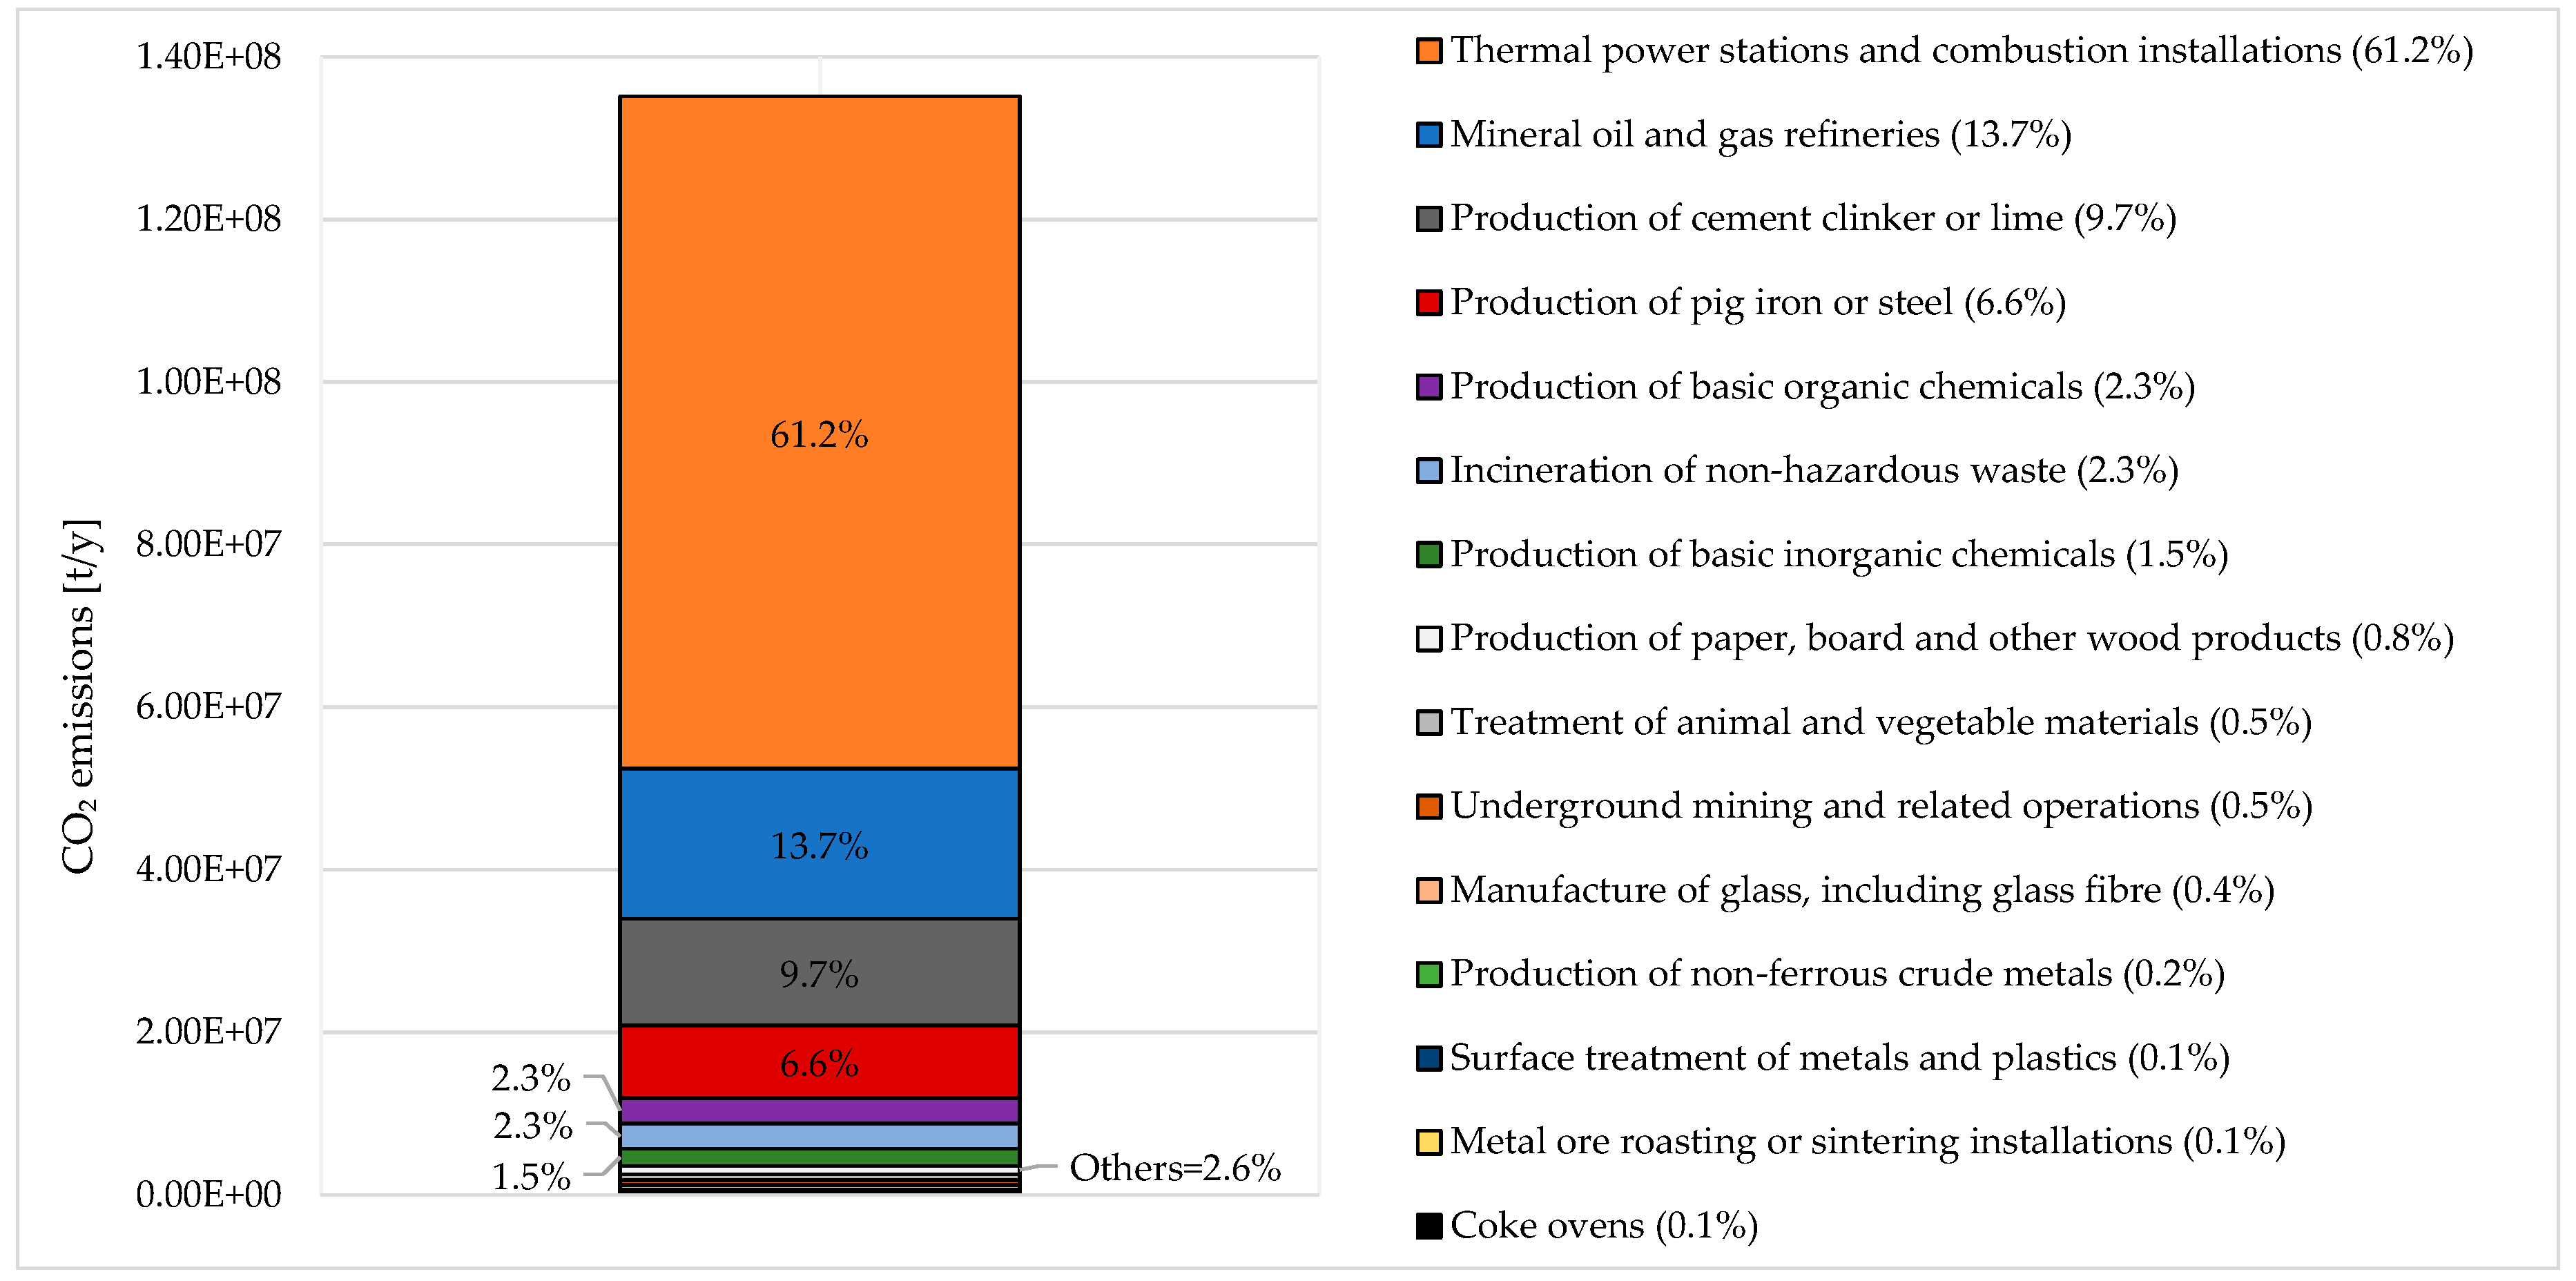
Carbon Dioxide Potential Sources and Italian Scenario

In 2018, the global anthropogenic CO2 emission exceeded 36 billion tons [18], with the European Union contributing to 3.9 billion tons [19]. The sector breakdown shows that the primary source of GHG emissions is electricity and heat production (31%), transportation (15%), forestry (6%), and manufacturing (12%). Energy production of all types accounts for 72% of all emissions, while industrial processes for 6% [20]. The climate change mitigation potential of CCU depends on the chosen CO2 source [21]. In general, more concentrated CO2 sources, such as industrial point sources, require less energy for the capture process than more diluted sources, such as air. Other parameters, such as the capture rate, defined as the amount of CO2 captured divided by the amount of CO2 generated at the source [22], and the CO2 purity are affected by the source (see Table 1).
Regarding the Italian situation, the European Environmental Agency in 2017 counted 188 facilities emitting in a total of 135.159 million tons CO2 [24]. The main emitting sector is the energy sector (mineral oil and gas refineries, thermal power stations and other combustion installations, and coke ovens), accounting for 74.9% of the total emissions (see Figure 1). The mineral industry, production and processing of metals, chemical industry, and waste management represent 10.6%, 6.9%, 3.9%, and 2.3% of the total emission share, respectively. Minor contributions come from the paper and wood processing industry and from the animal and vegetable products for food and drink production.
Looking at data, there is a large availability of industrial sources emitting GHG into the atmosphere. In order to meet the 2030 targets of the European Union, prescribing at least 40% cuts in GHG emissions from 1990 levels with the aim to reach climate neutrality by 2050, it is of paramount importance to assess whether CCU can be an effective climate change mitigation strategy. In this case, CCU could tackle several unsolved issues: industry decarbonization (not only for power production but also in all other sectors), long term energy storage into chemical vectors, sector coupling.

2. Materials and Methods

In this work, an attributional LCA was applied, according to the ISO 14040 [25] and ISO 14044 [26] guidelines. SimaPro version 8.5.2.0 was used as software with the cut-off ecoinvent version 3.5 [27,28] database coupled with literature data, as described below. The International Reference Life Cycle Data System (ILCD) midpoint method [29] was applied in coherence with the European Commission Joint Research Center recommendations.

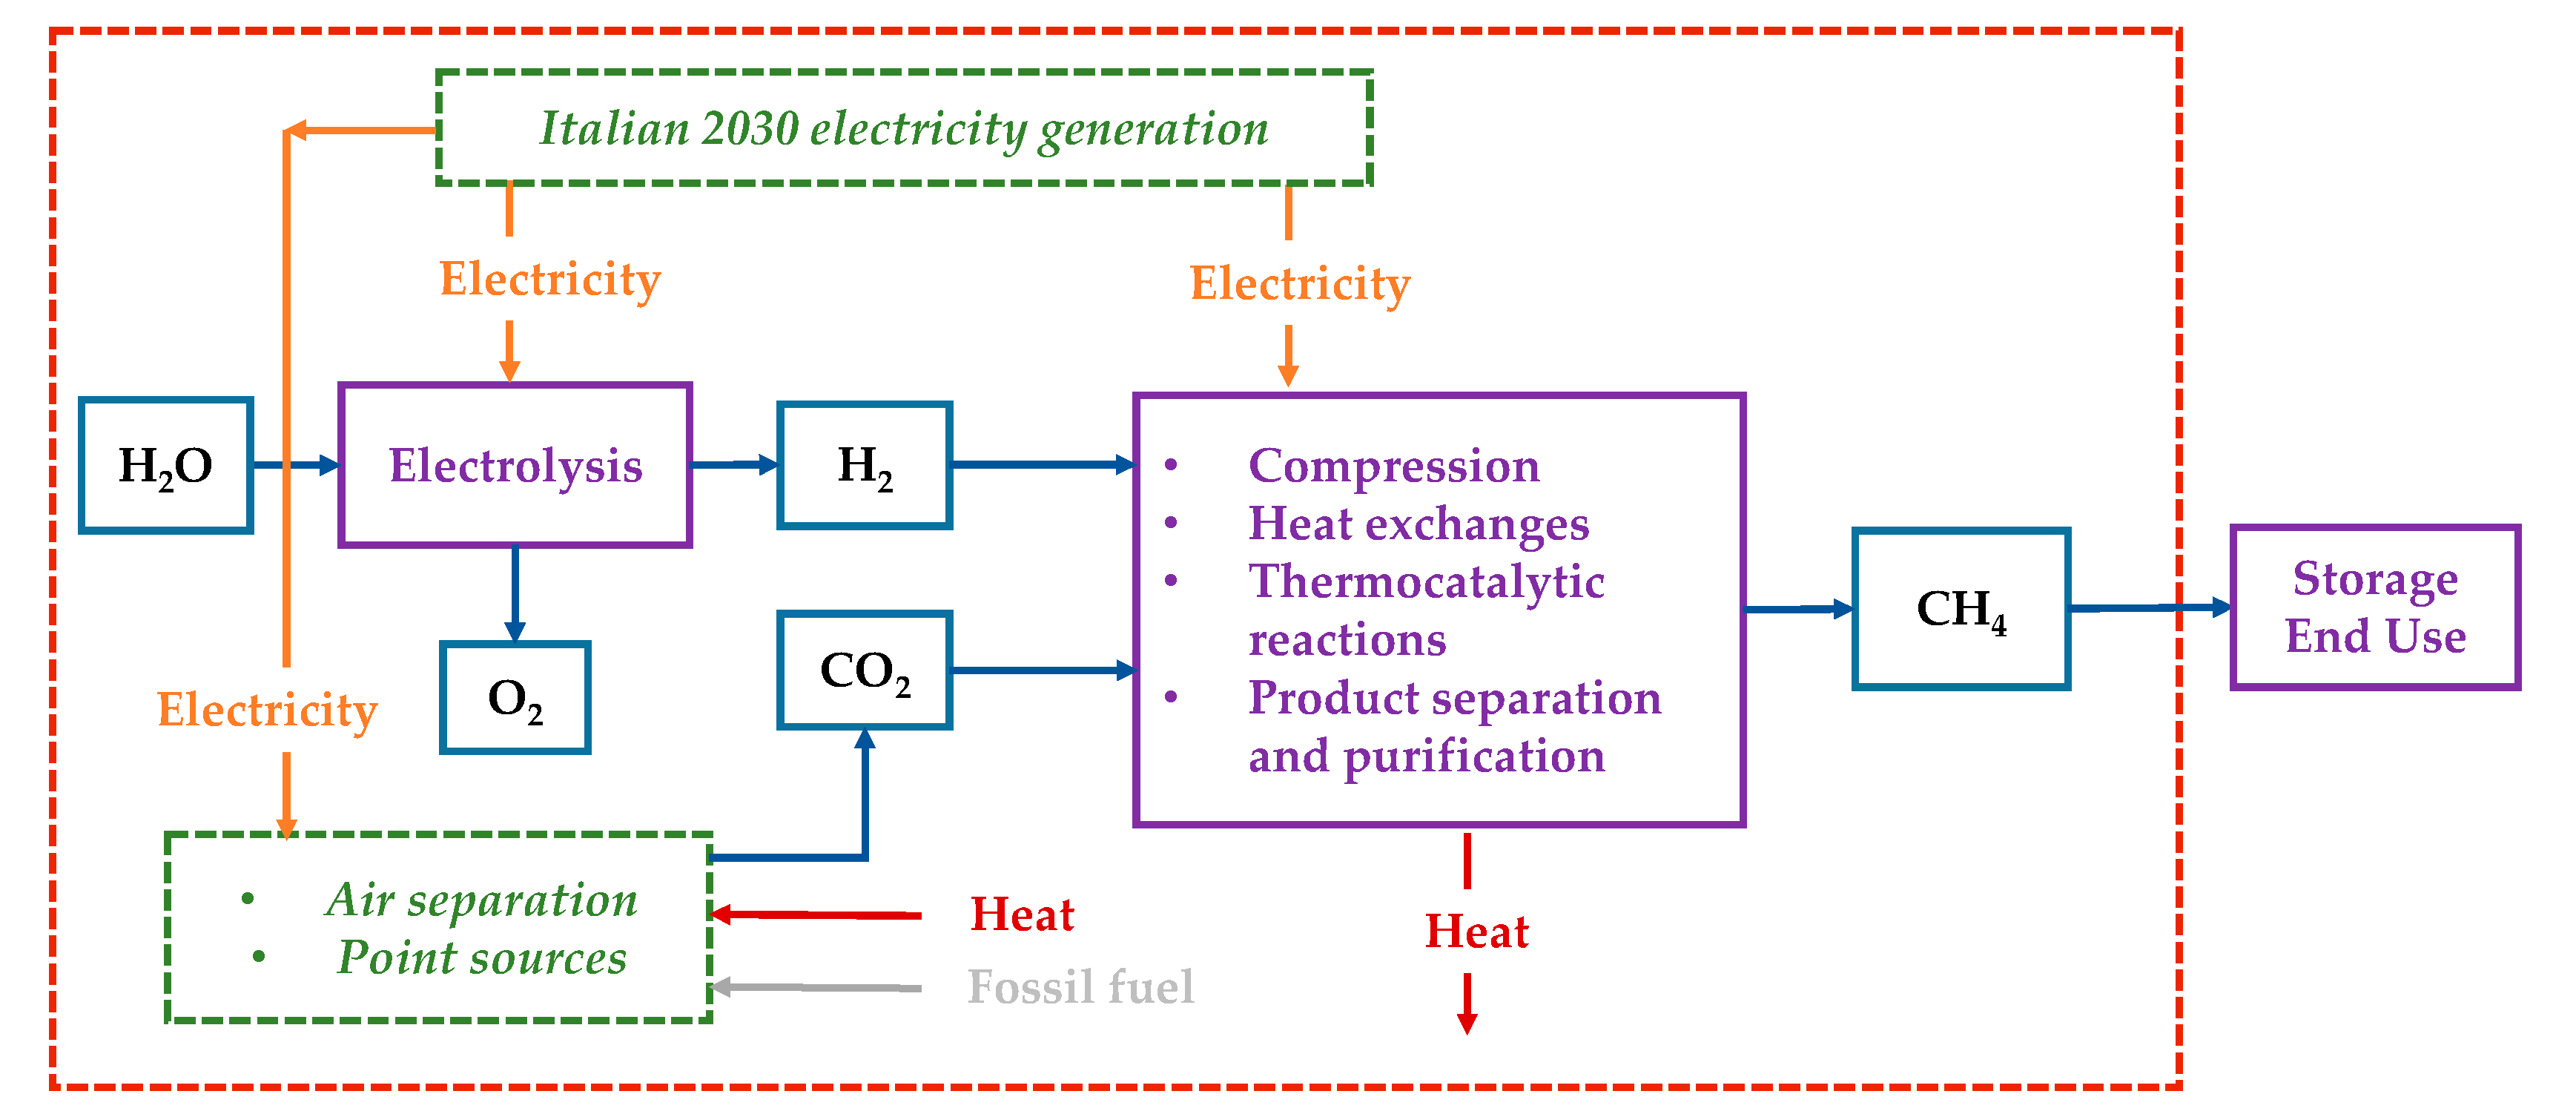
2.1. Assumptions and Study Boundaries

The system boundary included the steps for SNG production from water extraction and capturing CO2 from a point source (or air) to the production of SNG itself, as visualized in Figure 2. All conversion processes (electrolyzer, CCU plant, methanator, and compression steps) were covered. The infrastructure was excluded from the analysis for lack of data; indeed, for a given functional unit, the required infrastructure was the same, and it did not affect the absolute difference among the considered CO2 sources. The SNG end-use scenario was out of the scope of the present work as we assumed the same impacts of using SNG and conventional NG.

2.2. Data Sources

The data used in the present study included both data from the cut-off ecoinvent database version 3.5 and data from the literature as well as assumptions based on engineering practice for electricity generation, electrolysis, and carbon dioxide sources.
The methanation plant was developed in Aspen Plus® environment [30]. Methanation was carried out in a fixed-bed reactor at 300 °C and 60 bar to achieve high purity SNG.
SNG production required electricity to power the electrolyzer, the feed gases compressors, and the carbon capture plant. In the present study, the Italian generation mix in the 2030 scenario was modeled for the electricity supply [31,32]. The Italian electric generation forecast to 2030 was given with aggregated data per source, without any detail on the unique technology installed capacity [31]. So, we assumed that the technology share (e.g., conventional natural gas power plant) within each source (e.g., gas) in 2030 would be kept the same as the 2018 shares. The electricity generation from solar energy was further subdivided into rooftop plants (41% of the total capacity) and ground-mounted panels (59%), assuming a rooftop maximum installed power of 200 kW [33]. The resulting detailed 2030 Italian energy mix is shown in Table 2.
The electric consumption of the electrolysis was assumed to be 4.5 kWh/Nm3, a typical value for both Alkaline (AEL) and Proton Exchange Membrane (PEMEL) electrolyzers [34].
CO2 emissions data were taken from von der Assen et al. [16], which provided average energy demands of individual facilities in Europe, including average consumptions for DAC (see Table 3). The electricity was modeled, as expressed in Table 2, while heat, natural gas, and coal were taken from the ecoinvent database, as detailed in Table S1.

2.3. Handling Multi-Functionality

Most CO2 emitting activities and CCU technologies are multi-functional [35,36]. By definition, “a multi-functional process causes a multi-functionality problem in LCA whenever environmental impacts have to be partitioned among multiple functions” [37,38]. The approach to deal with multi-functionality (MU) is not yet univocal [39]. When a subdivision is not applicable to solve MU, system expansion or allocation must be implemented [26,29]. There are two multi-functionalities to be discussed: one related to the capture process and the other related to the utilization process. The main industry produces one main product (e.g., steel production) and emits a certain amount of CO2 in the flue gases. The industry (including the capture process) is multi-functional when the emitted CO2 is considered a co-product [40,41]. Instead, the process can be considered mono-functional under the following conditions:
  • with DAC since the only product is the captured CO2 itself;
  • CO2 is considered a waste and not a co-product [40].
  • This latter approach allows the comparison among different CO2 sources. It was adopted in the present work since CO2 is nowadays still considered a waste rather than a co-product.
  • The electrolysis process instead is multi-functional since it produces hydrogen and oxygen. In the present work, three approaches were implemented:
  • 100-0 allocation (base-case scenario): all the electrolysis process burdens were attributed to hydrogen. For this reason, this was the most precautionary case, and it was assumed as a base-case scenario.
  • Mass allocation: in the electrolysis process, 7.94 kg O2/kg H2 was produced. Therefore, 89% of the burdens were attributed to oxygen and only 11% to hydrogen.
  • Economic allocation: in the absence of reliable forecasts of chemical market prices for 2030, the oxygen and hydrogen market prices were estimated based on the average Producer Price Index (PPI) variation between December 2009 and December 2019 [42] (Table 4). The price of a chemical in a year could be calculated from its PPI, knowing its price and PPI in a reference year (see Equation (1)). Since chemical prices fluctuate greatly, we chose an average price between the years 2009 and 2019. The economic allocation was applied considering 1.21 $/kg H2 and 0.25 $/kg O2. Some considerations based on different oxygen/hydrogen price ratio would be drawn, even if results sensitivity analysis on the market prices was out of the paper scope.
    Price chem , new = Price chem , ref · PPI chem , new PPI chem , ref

3. Results and Discussion

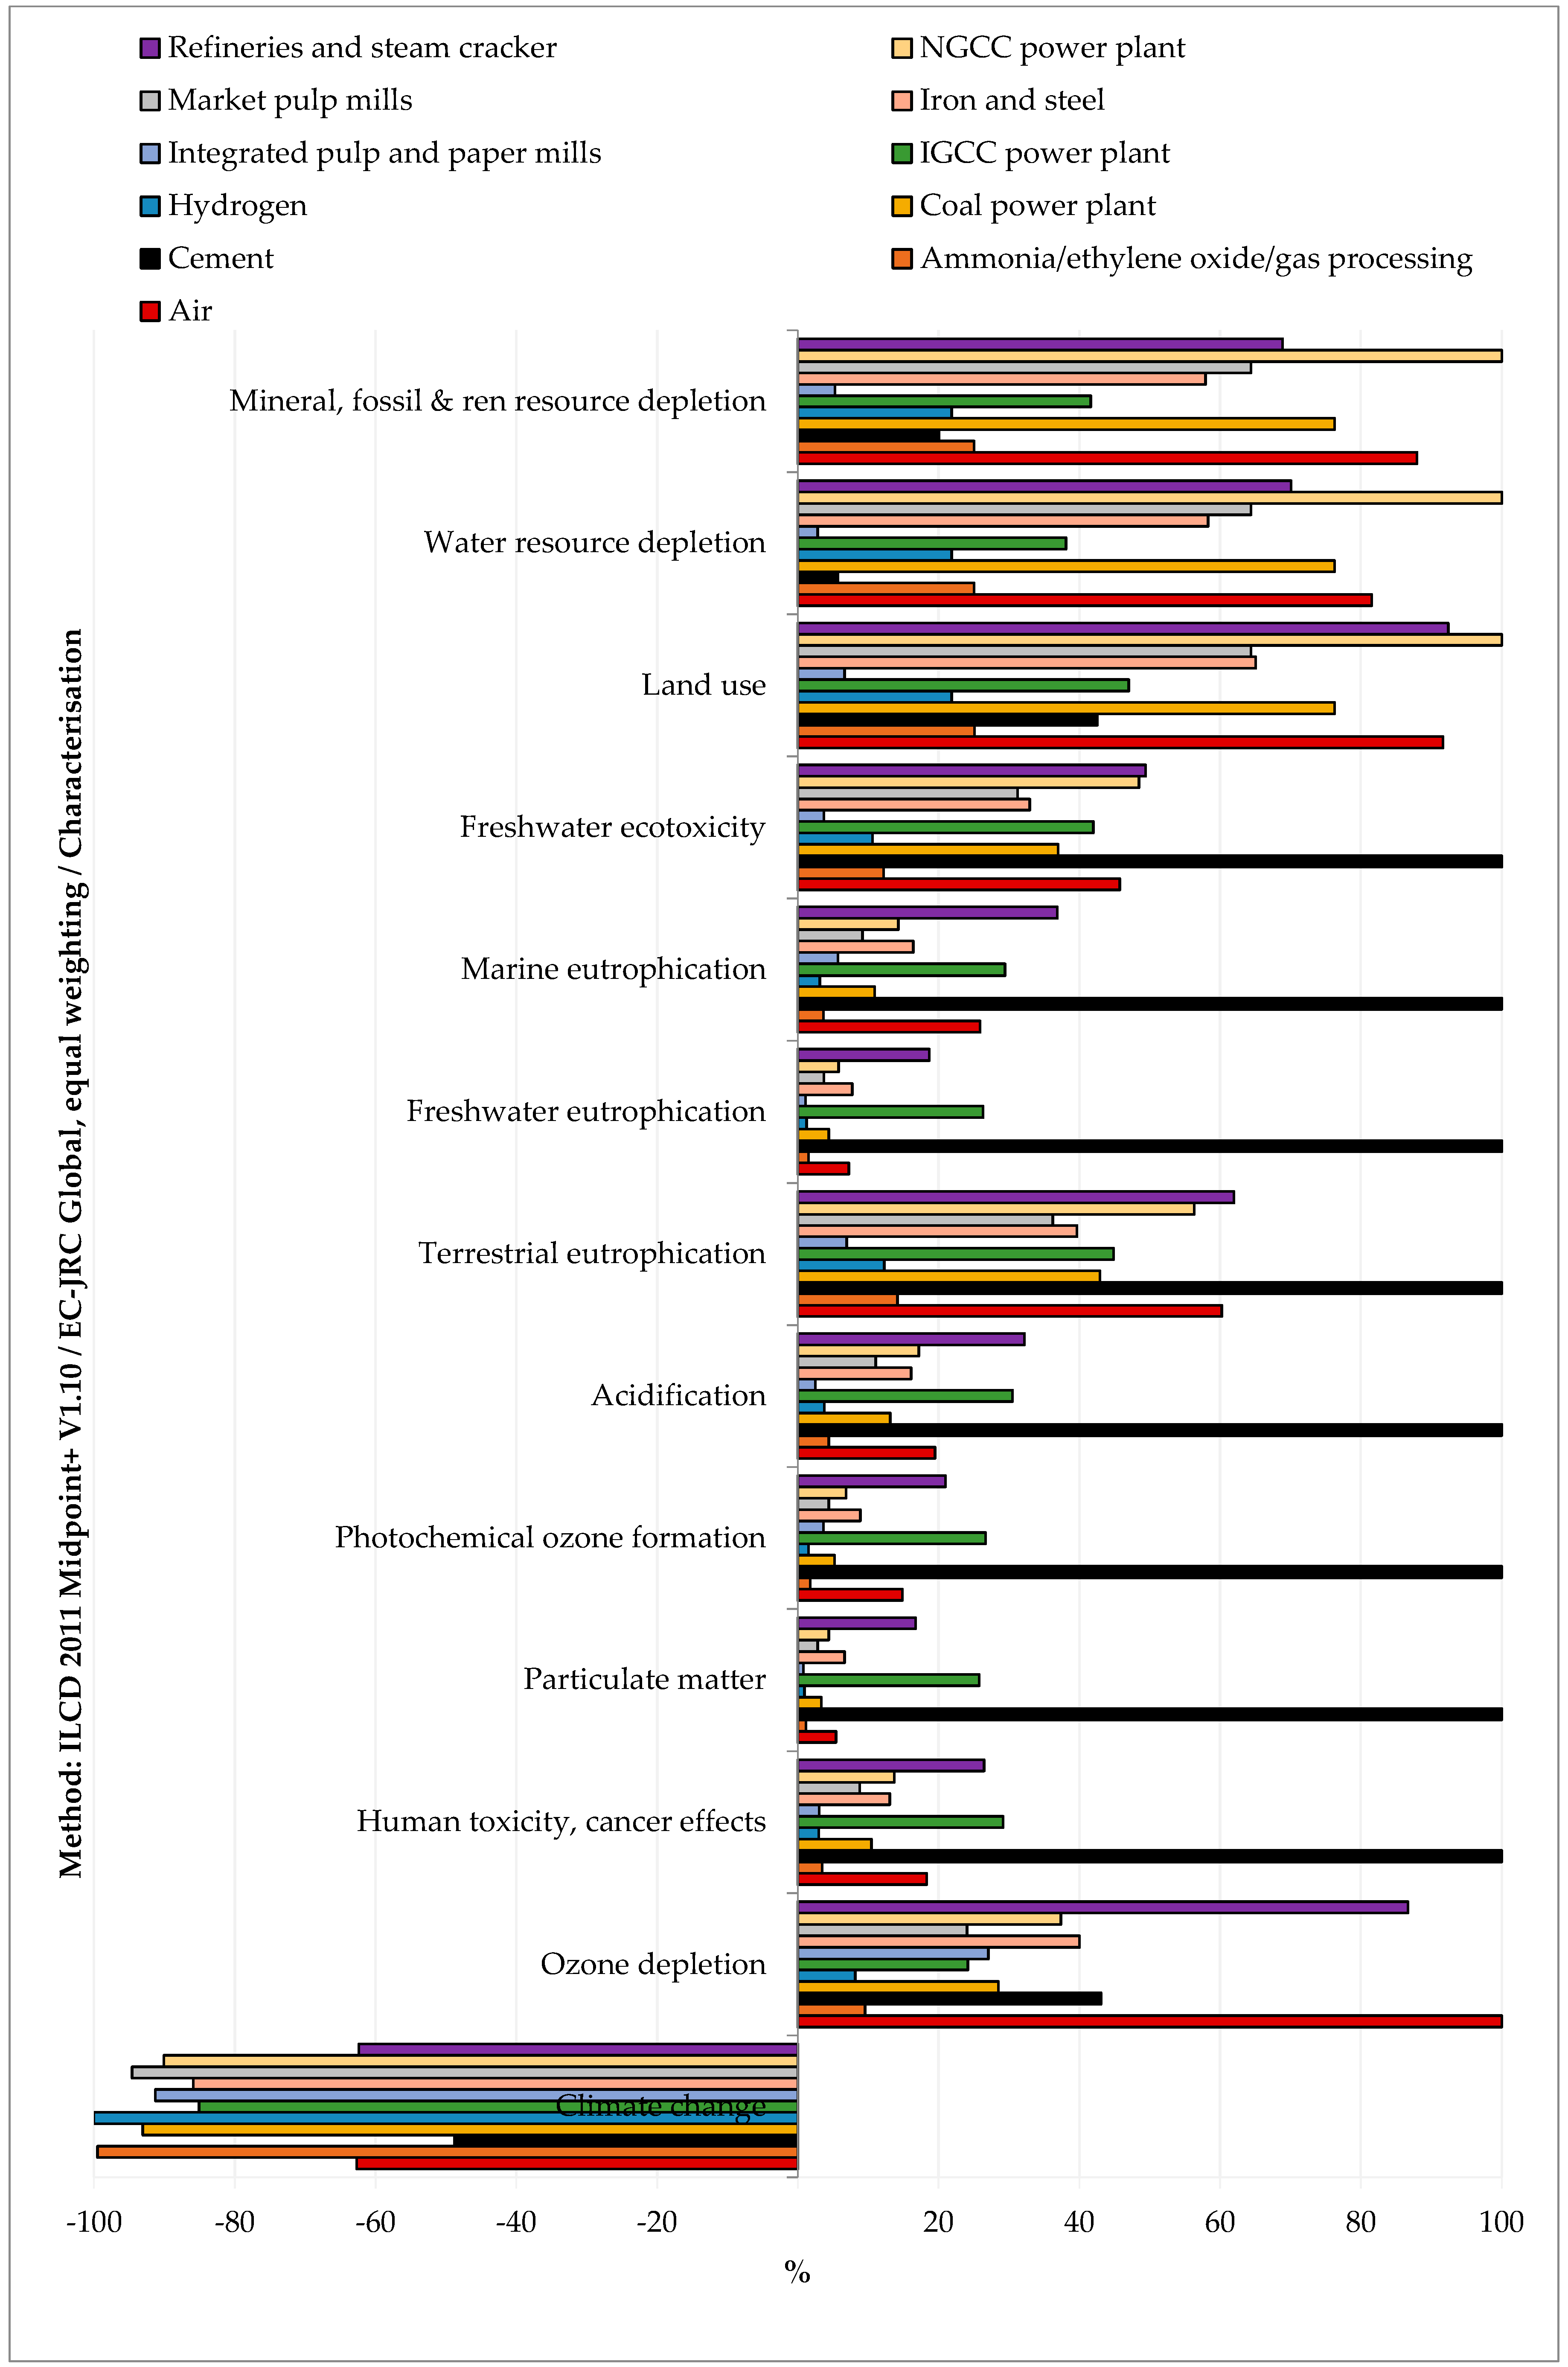
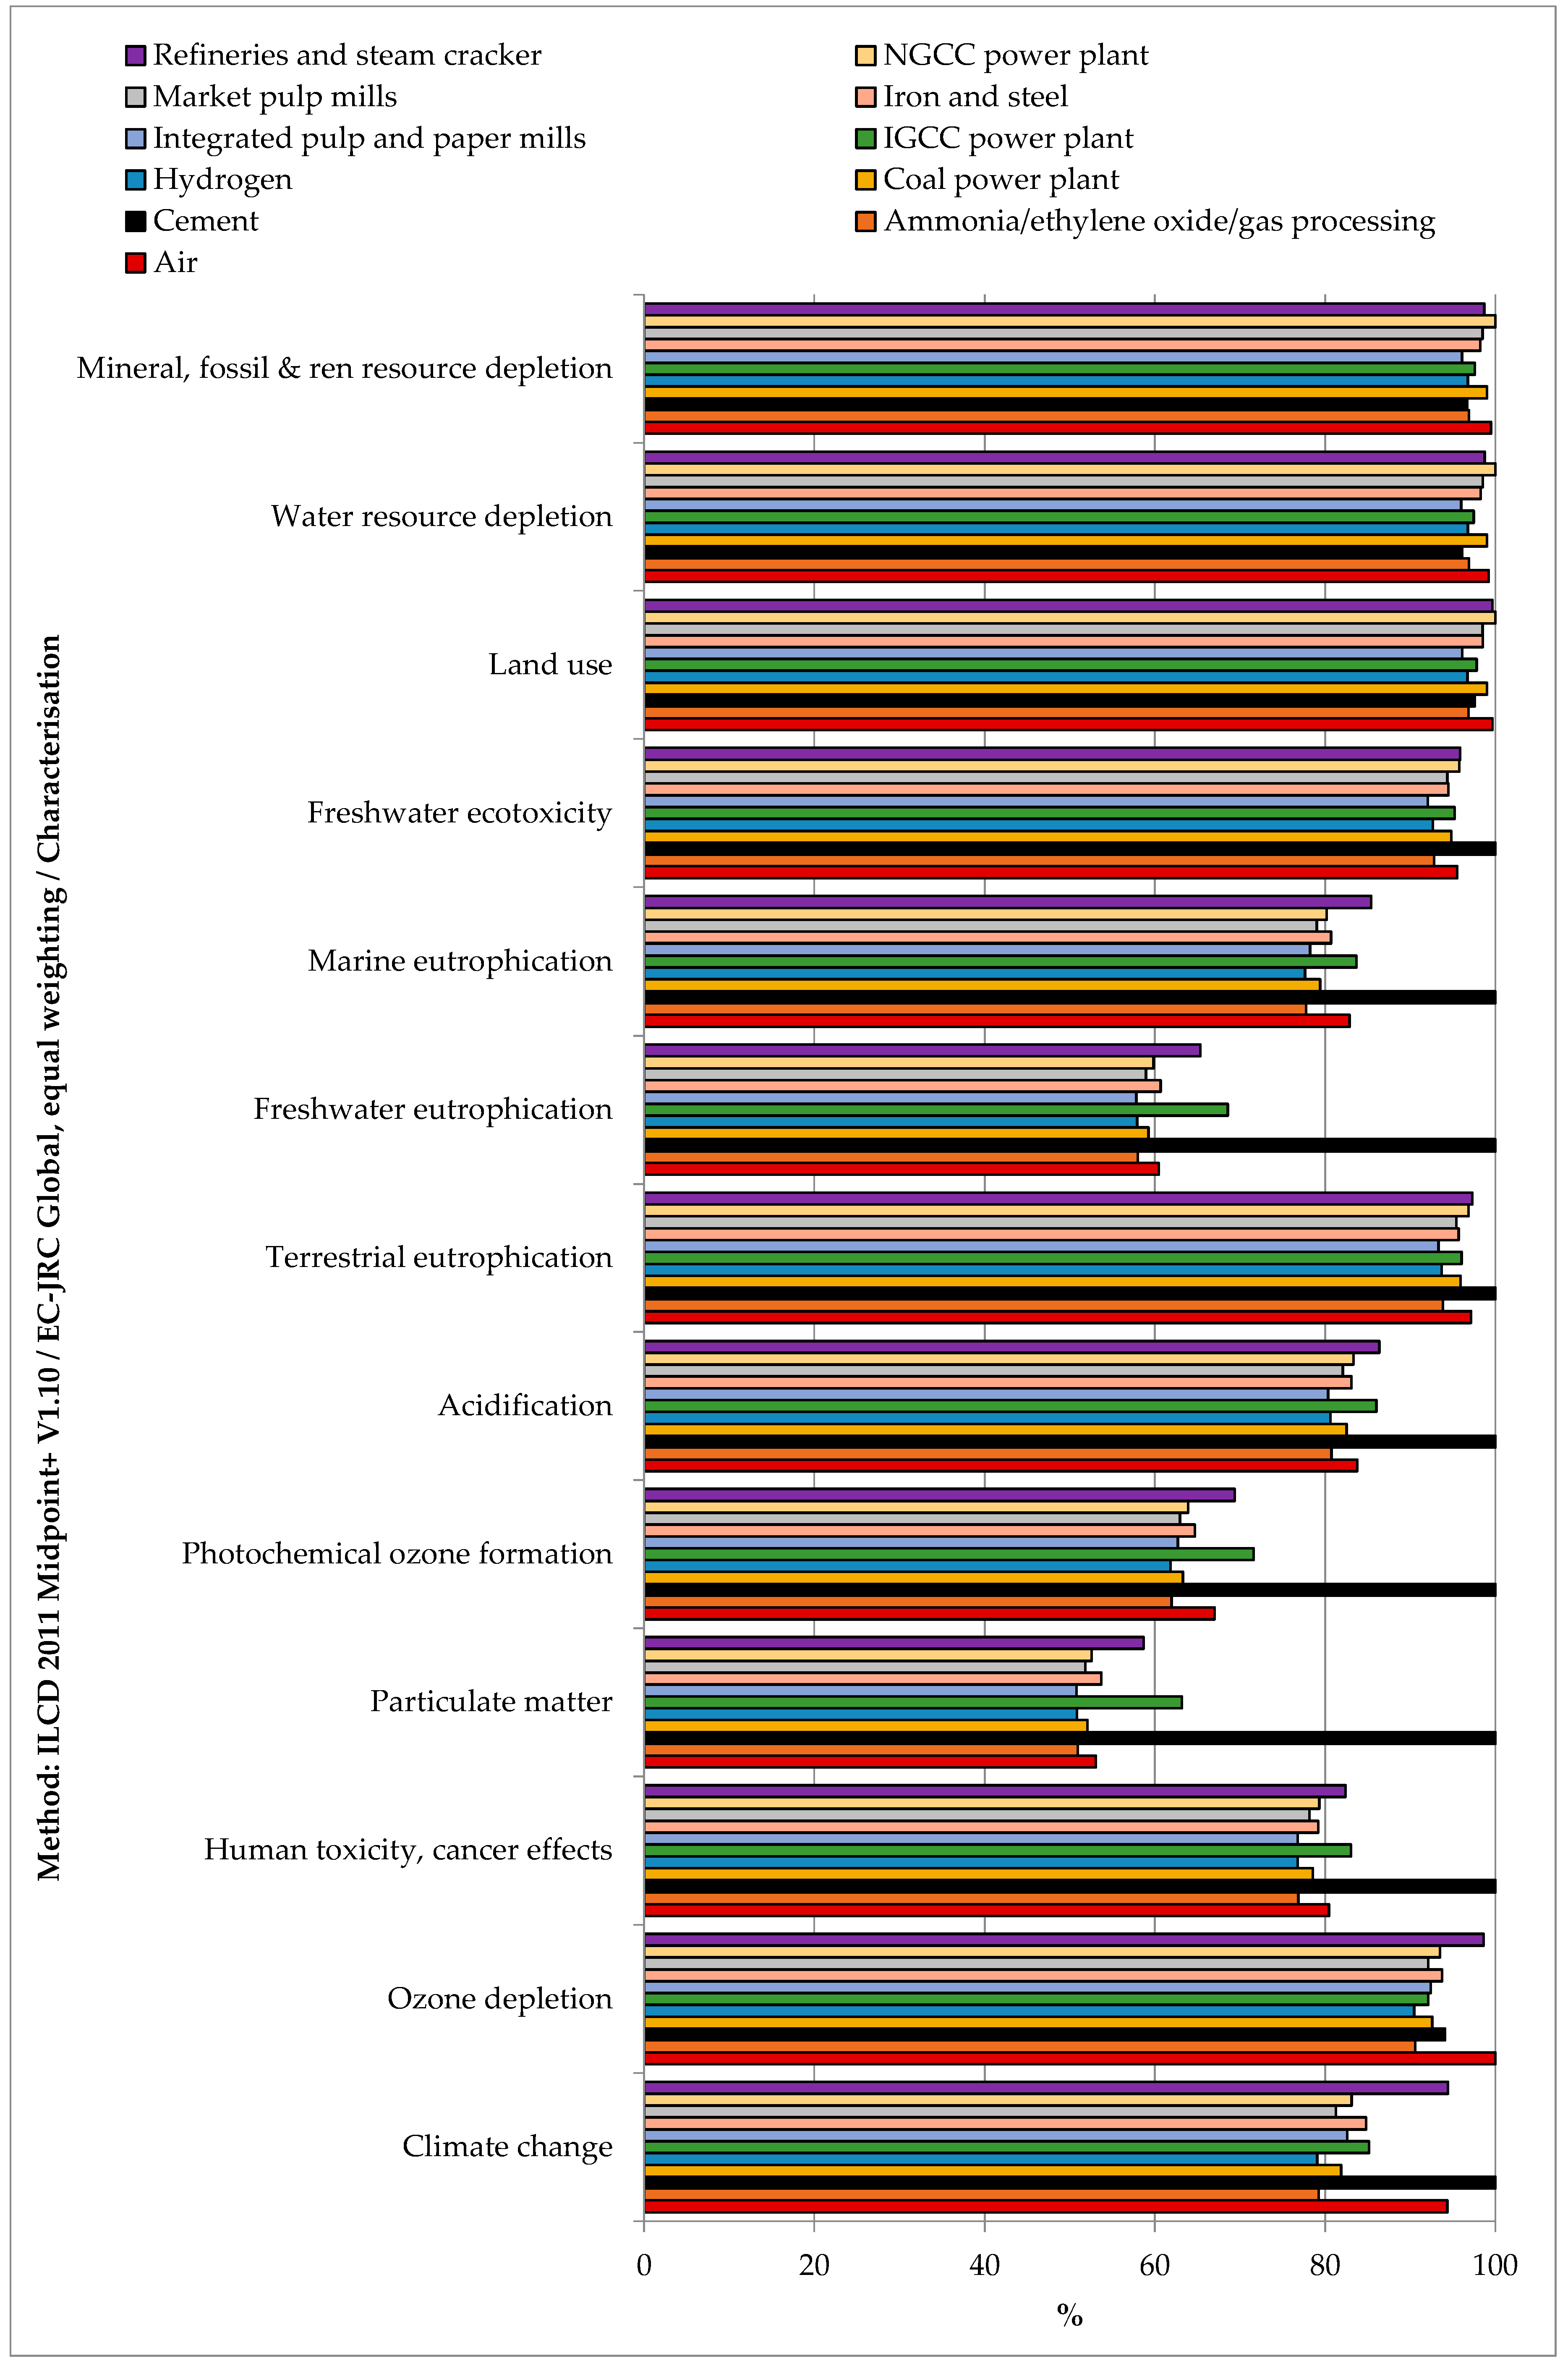
3.1. Impacts of CO2 Separation from Various Industrial Sources

Within the stated boundaries and assumptions, the impact assessment showed that CO2 separation from all the considered sources reduced the environmental impacts only for the climate change indicator (see Figure 3 and Table S2 SI). This result means that the separation duties emitted less CO2-eq. than what was captured. This finding was valid for all the considered CO2 sources. All the other considered indicators were positive, which means that the impacts related to the capture process were higher than in the case of status quo operation without CO2 capture.
As far as the comparison among the CO2 source is concerned, capturing CO2 from cement plants had the highest impacts on climate change, human toxicity (cancer and non-cancer effects), particulate matter, photochemical ozone formation, acidification, terrestrial eutrophication, freshwater eutrophication, marine eutrophication, and freshwater ecotoxicity. These impacts were mainly due to heat production from coal (global warming, particulate matter, acidification, terrestrial eutrophication, marine eutrophication), spoil from hard coal mining in surface landfill (human toxicity, freshwater eutrophication, freshwater ecotoxicity), and coking process (photochemical ozone formation). Capturing CO2 from the air had the highest impact on ozone depletion due to the processing and transport of natural gas over long distances. Capturing CO2 from refineries and steam crackers had the highest impacts on ionizing radiation due to torch incineration of low-level radioactive waste. Capturing CO2 from Natural Gas Combined Cycle (NGCC) power plants had the highest impacts on land use, water resource depletion, and mineral, fossil, and renewable resource depletion. This finding was, respectively, ascribable to electricity production from open ground PV modules, electricity production from hydro reservoirs in Alpine regions, and zinc-lead mine operation. On the other hand, capturing CO2 from hydrogen production plants and integrated pulp and paper mills resulted in a more environmentally friendly solution for all considered indicators.

3.2. Base-Case Results

The considered base-case referred to a scenario where SNG was considered as the only product. This approach implied that burdens in the electrolysis process were attributed to hydrogen production, while oxygen was discharged into the atmosphere. Moreover, the heat coming from the methanation reactor was wasted and did not represent an additional co-product. As we have discussed in Section 3.3, this scenario was the most conservative.

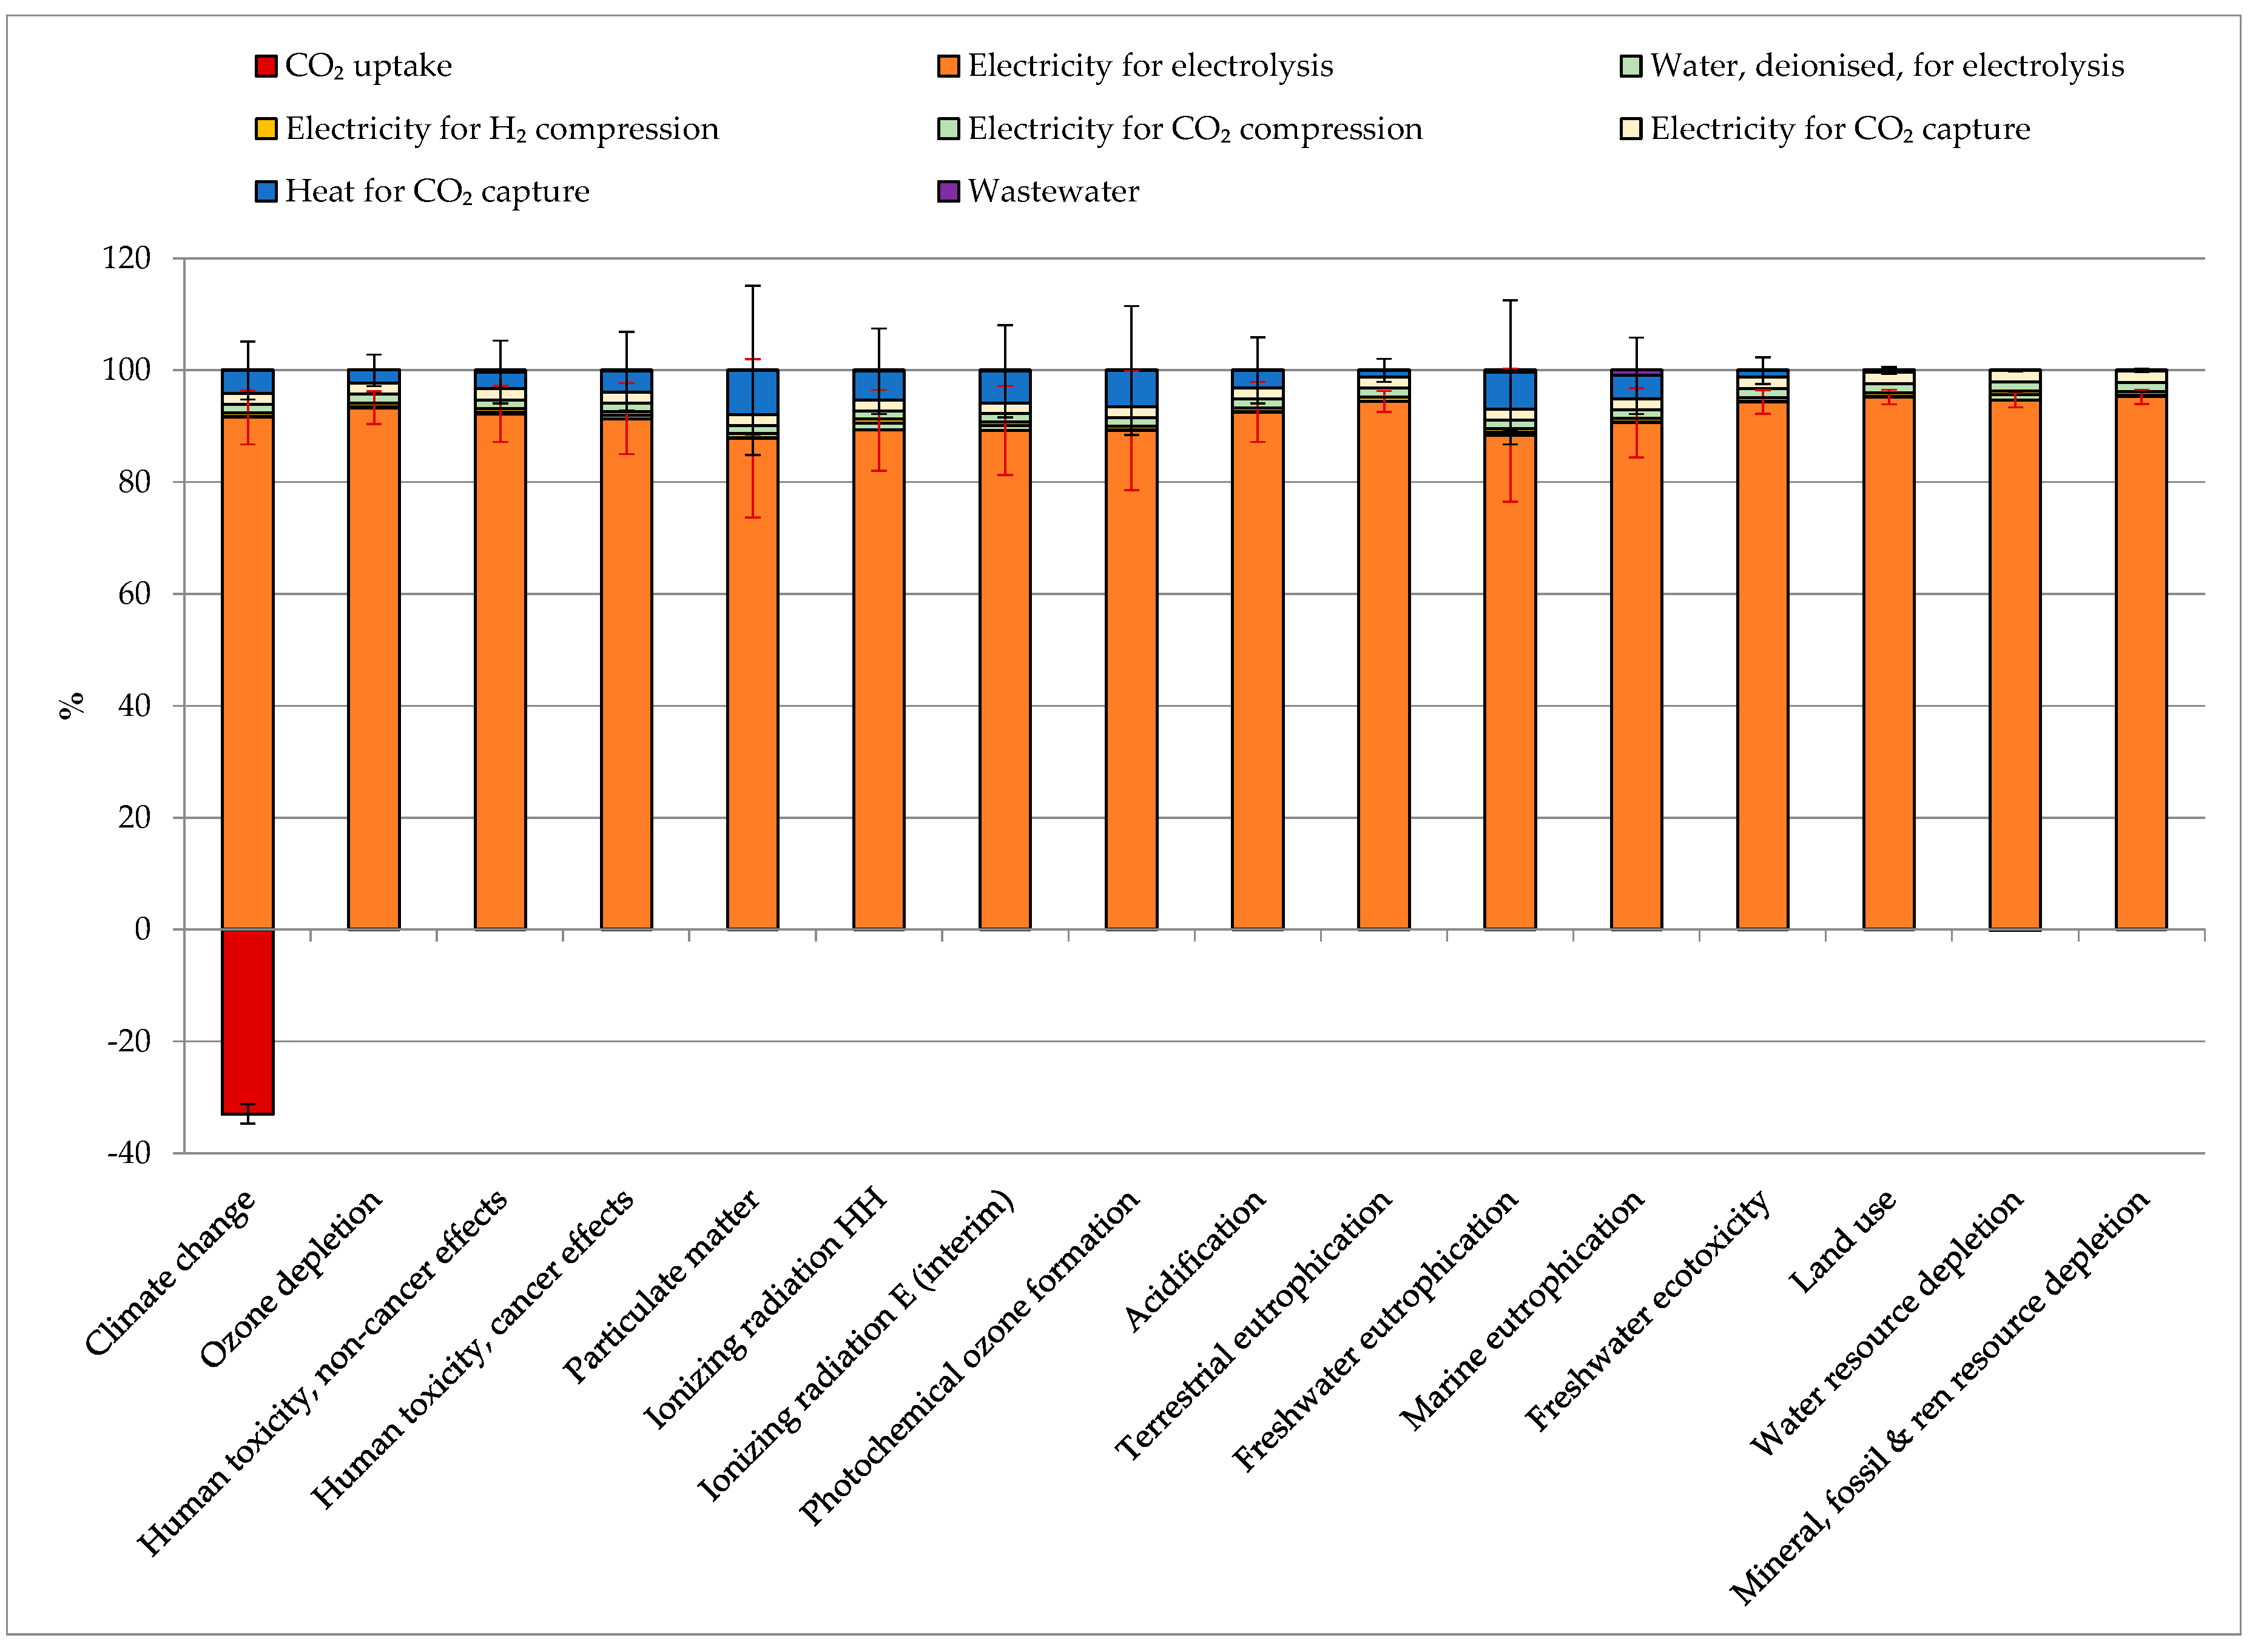
3.2.1. Contribution Analysis

The contribution analysis quantified the impacts (and, therefore, the contribution) of different processes over all the considered indicators. Figure 4 reports the average impacts for the production of 1 kg of SNG from different CO2 sources, with the error bars representing the values among which the impact fluctuated depending on the chosen CO2 source. The electricity required for the electrolysis caused an average of 87–96% of the total impacts over all the considered indicators. The second-largest impacting process on most of the indicators was the heat for CO2 capturing (4–9%), except for terrestrial eutrophication, freshwater ecotoxicity, land use, water resource depletion, and mineral, fossil, and renewable resource depletion, which were secondly mainly influenced by the electricity for CO2 capture. The impact of heat for CO2 capturing was strictly related to the heat source (from natural gas, from steam as an energy carrier and coal coke). Therefore, its impact greatly varied between 0 (no impact, in the case of NGCC power plants, coal power plants, market pulp mills, and hydrogen plants, where no extra heat was required for capture) and up to 50% in the case of the cement plants where most of the heat production came from coal. The electricity for CO2 capture and compression and H2 compression represented, on average, 2.0%, 1.6%, and 0.7% of the impacts on all indicators. Deionized water production and wastewater treatment contributed less than 1%. The CO2 uptake (−2.69 kg CO2/kg SNG) constituted between −30% and −35% of the total share of the global warming impact. Further details can be found in Table S3 SI.

3.2.2. Comparison among the CO2 Sources

Differently than the separation step (Figure 3), under the stated assumptions, the production of 1 kg SNG led to impacts with a positive sign in all indicators, which means that, for instance, the production of the synthetic fuel emitted more CO2 than the CO2 amount absorbed from the atmosphere. For the rest, the impact assessment for the production of 1 kg of SNG from different CO2 sources mainly reflected the qualitative results and considerations reported in Section 3.1, both for the comparison among sources and for the process contribution analysis. Producing SNG by capturing CO2 from hydrogen production plants and integrated pulp and paper mills resulted in the technology with fewer impacts concerning all considered indicators. On the contrary, producing SNG with CO2 from cement plants had the highest impacts on climate change, human toxicity (cancer and non-cancer effects), particulate matter, photochemical ozone formation, acidification, terrestrial eutrophication, freshwater eutrophication, marine eutrophication, and freshwater ecotoxicity. Synthetizing SNG with CO2 from the air had the highest impact on ozone depletion. Synthetizing SNG with CO2 from refineries and steam crackers had the highest impacts on ionizing radiation. Synthetizing SNG with CO2 from NGCC power plant had the highest impacts on land use, water resource depletion, and mineral, fossil, and renewable resource depletion. All the other CO2 sources implied intermediate impacts between the plants mentioned above. The relative results are shown in Figure 5, and the absolute values of the impacts are reported in Table S4 SI.

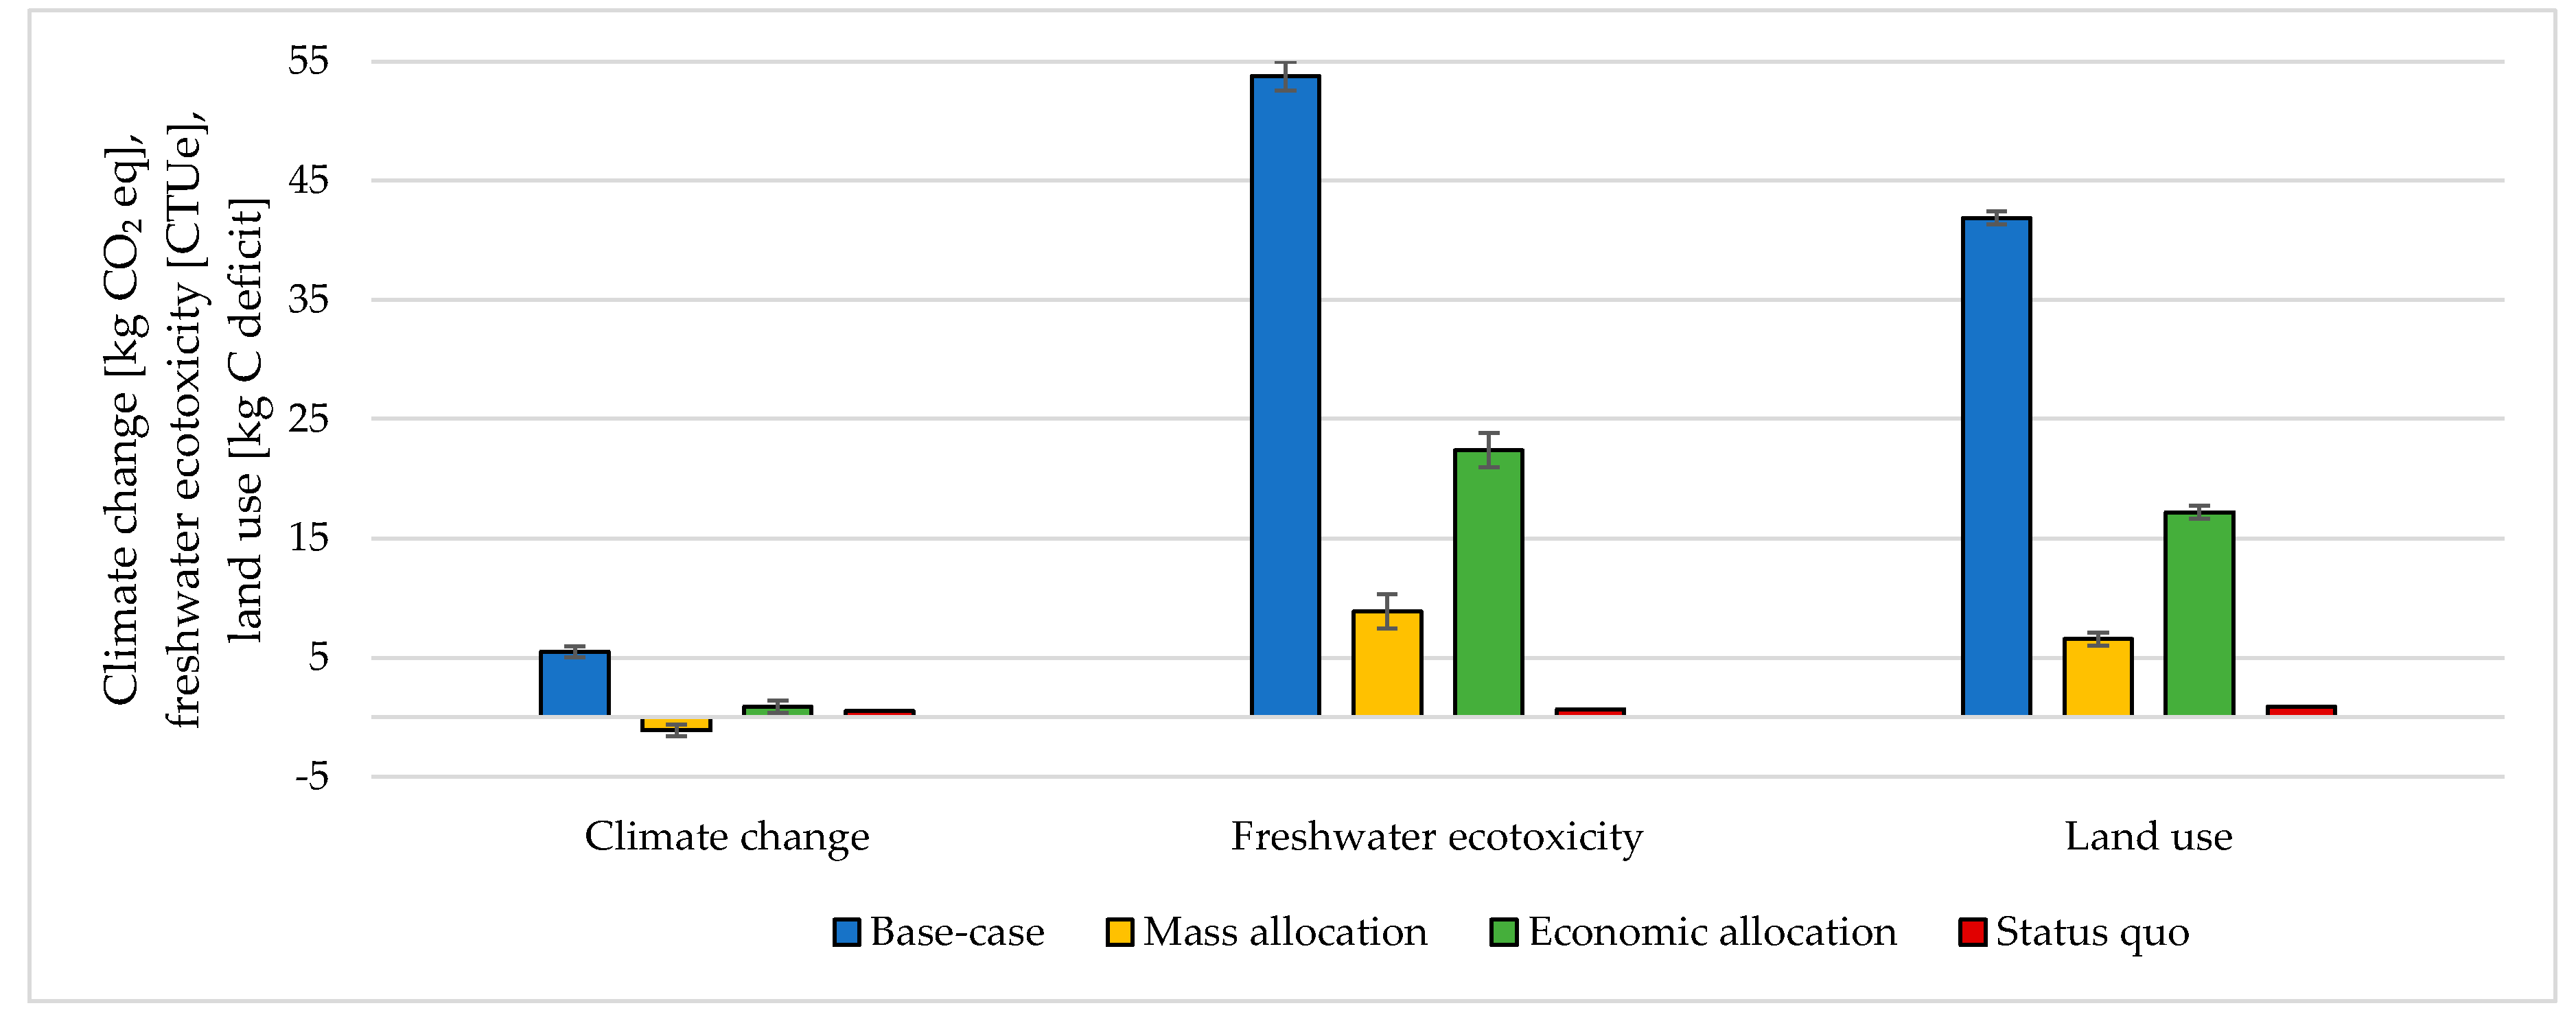
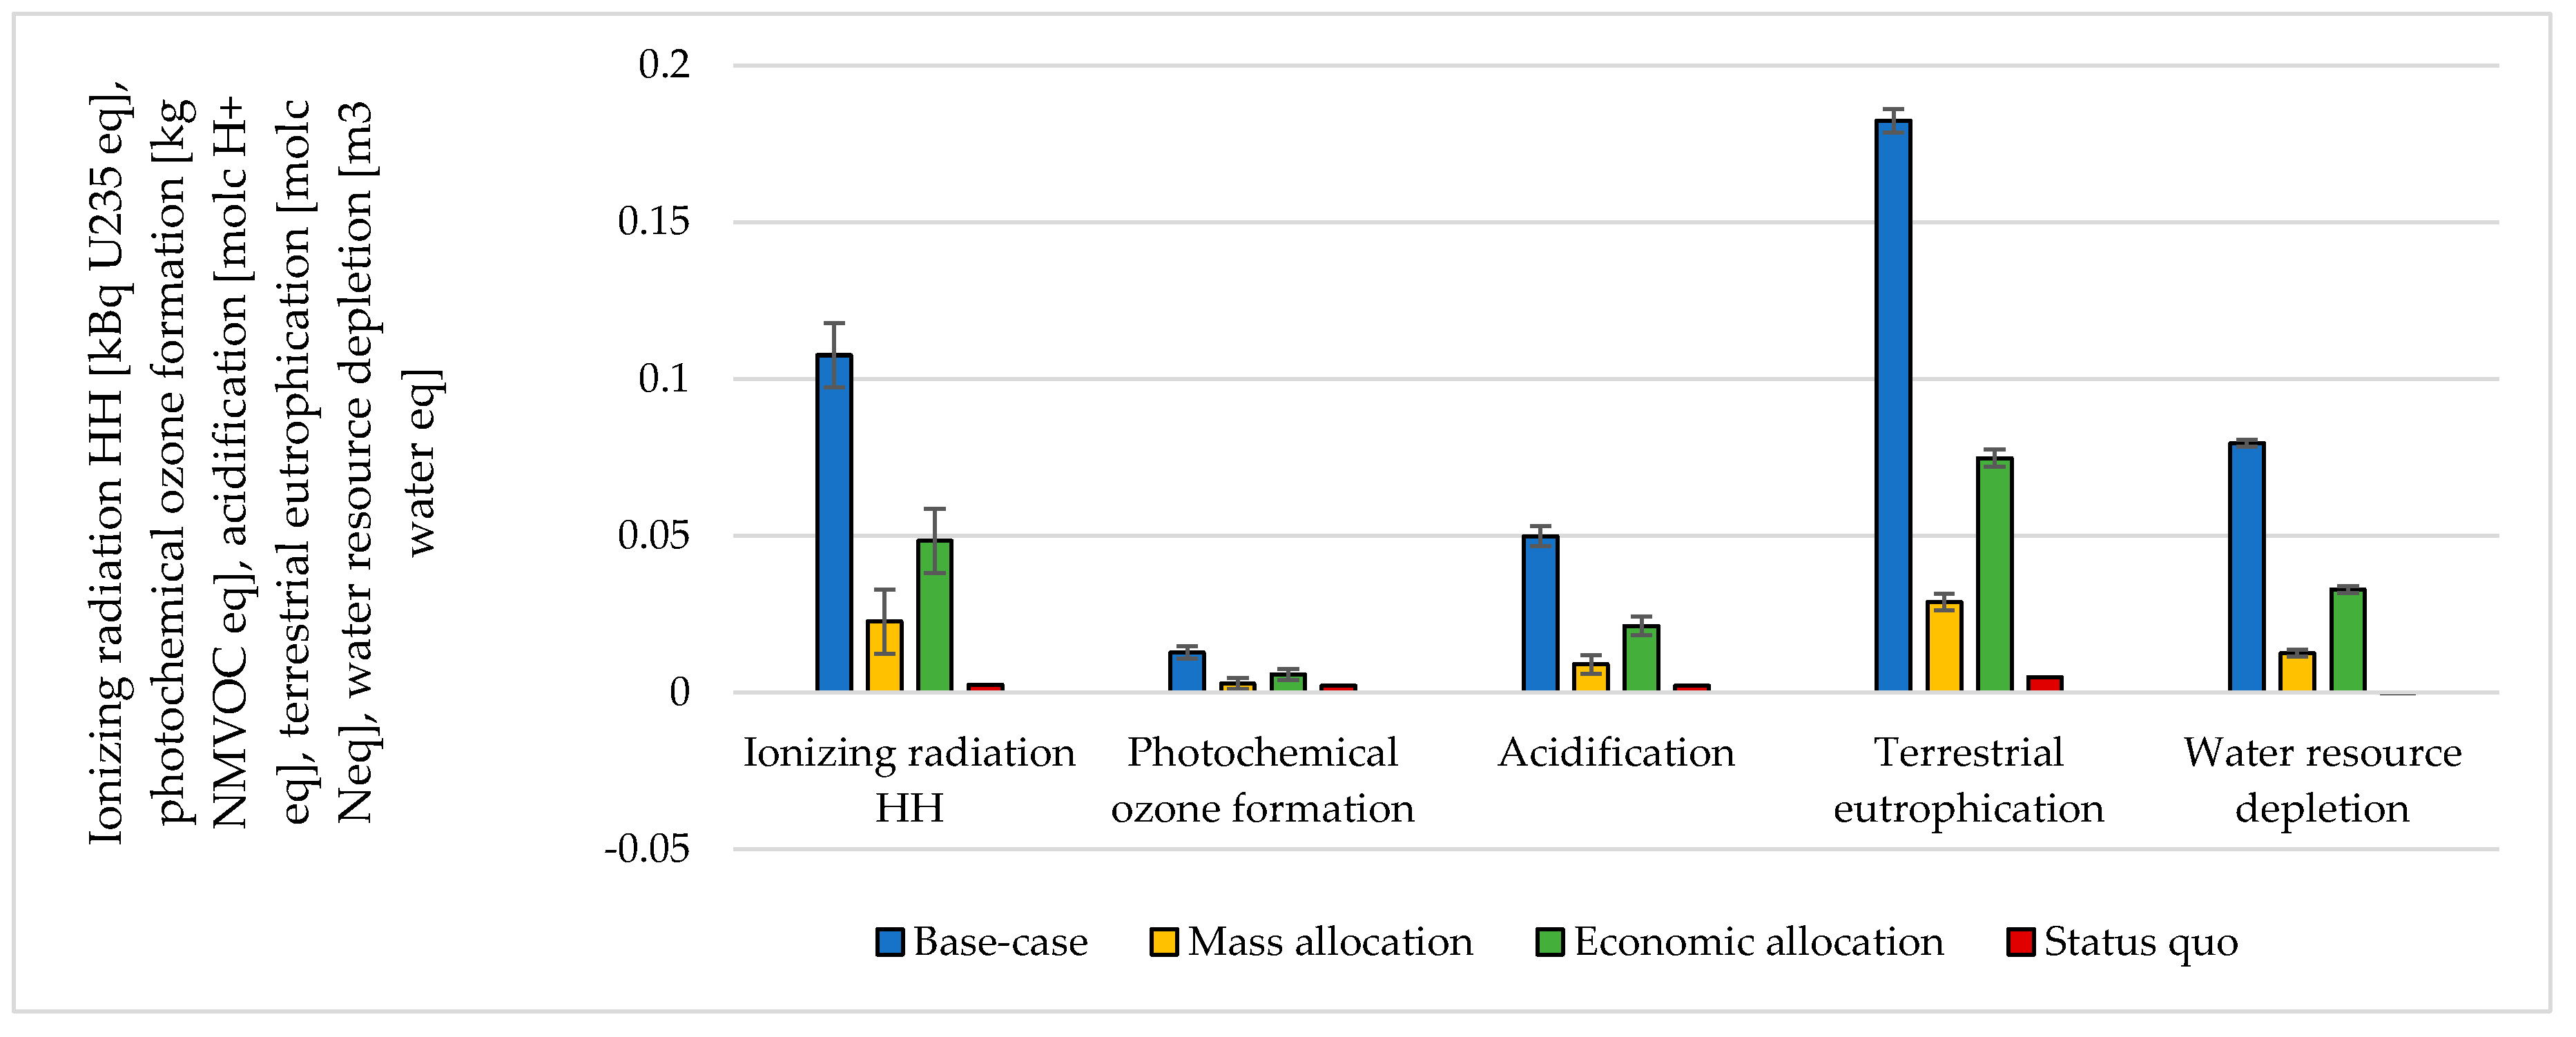
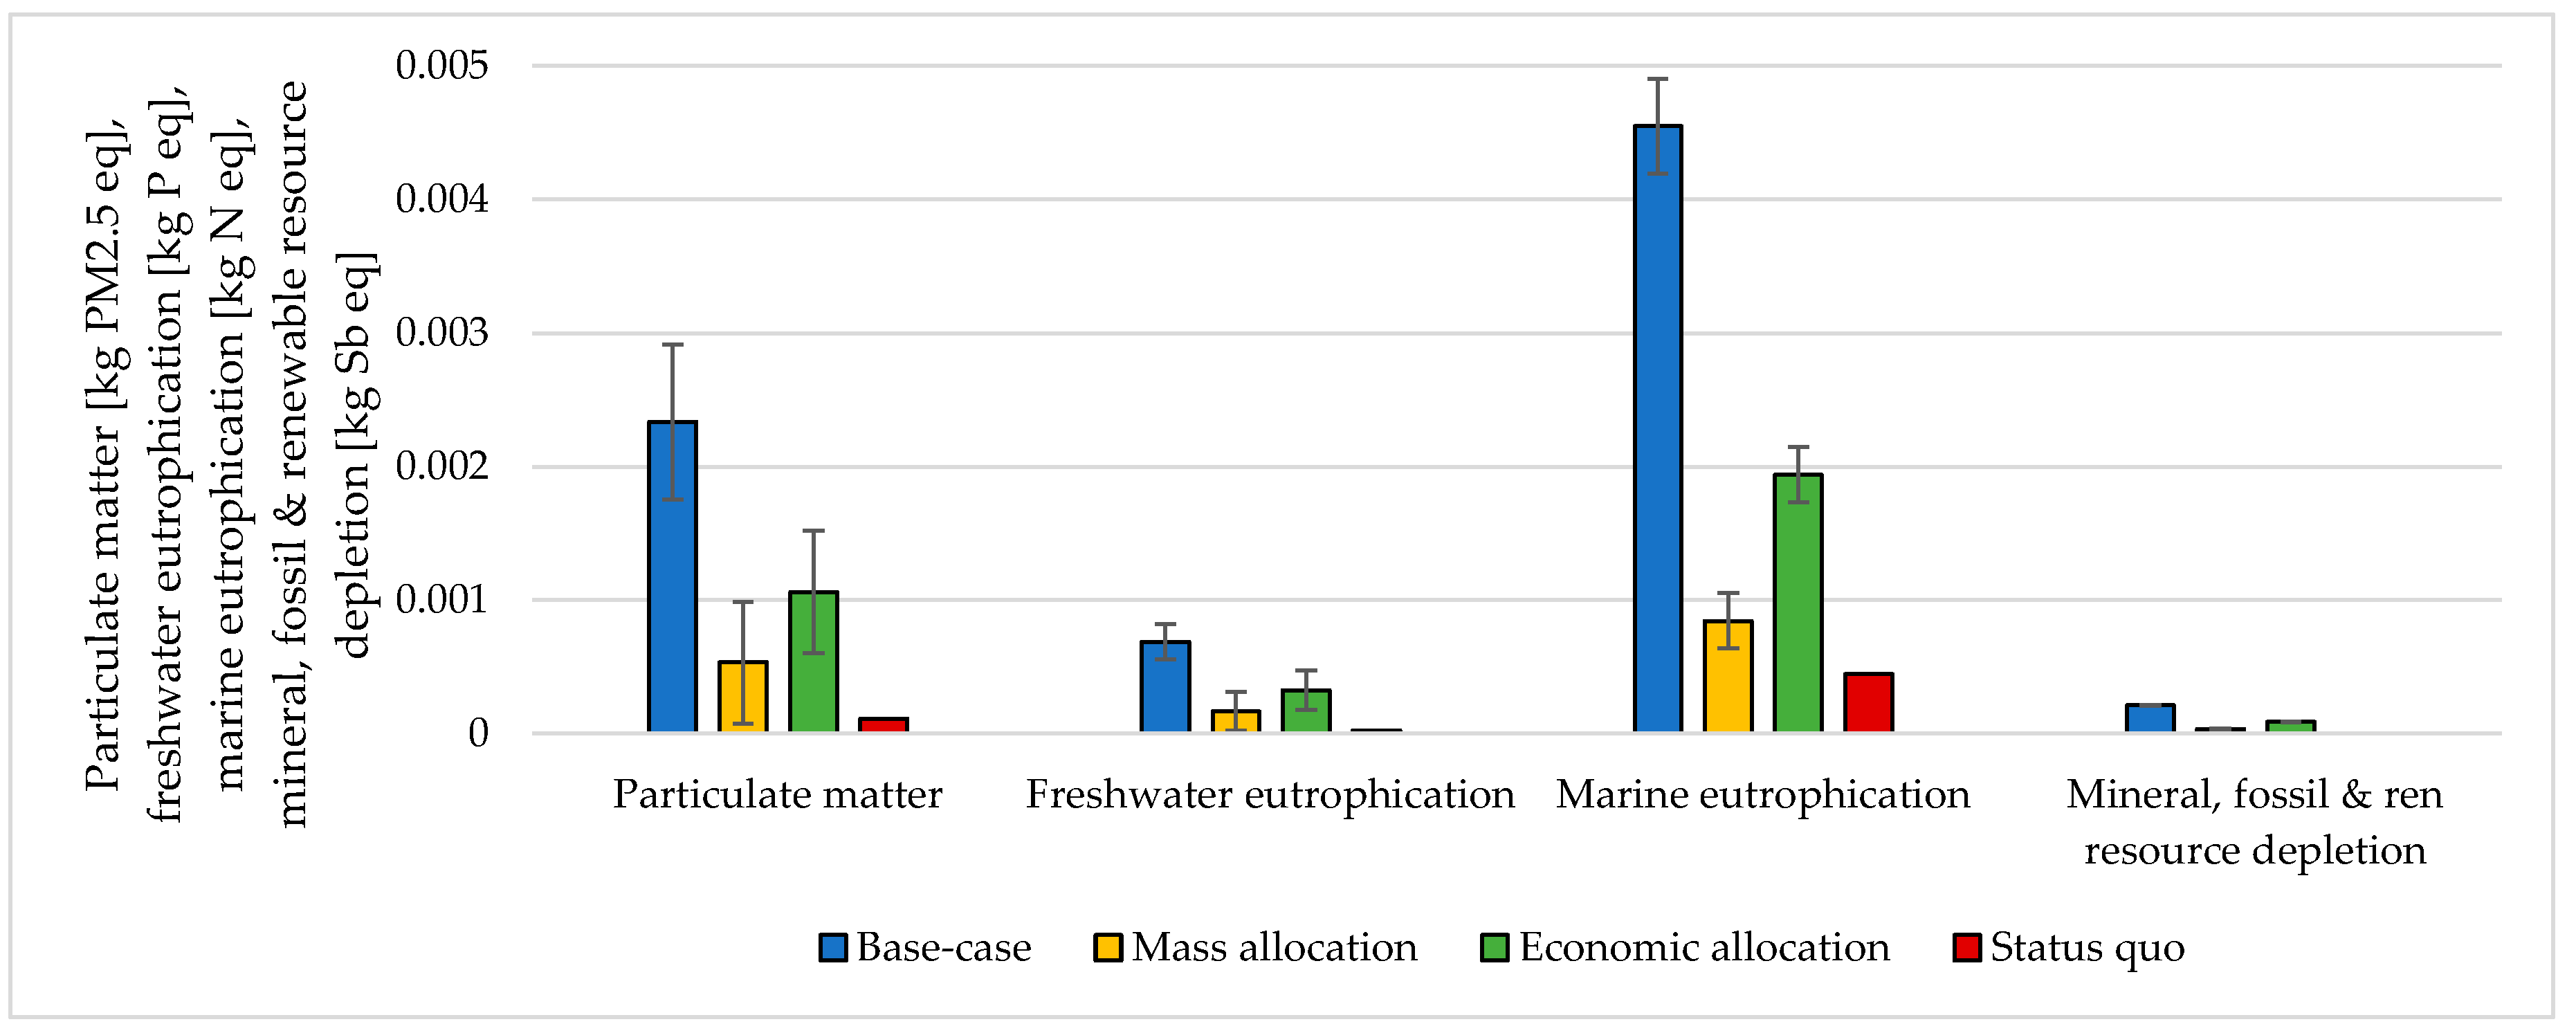
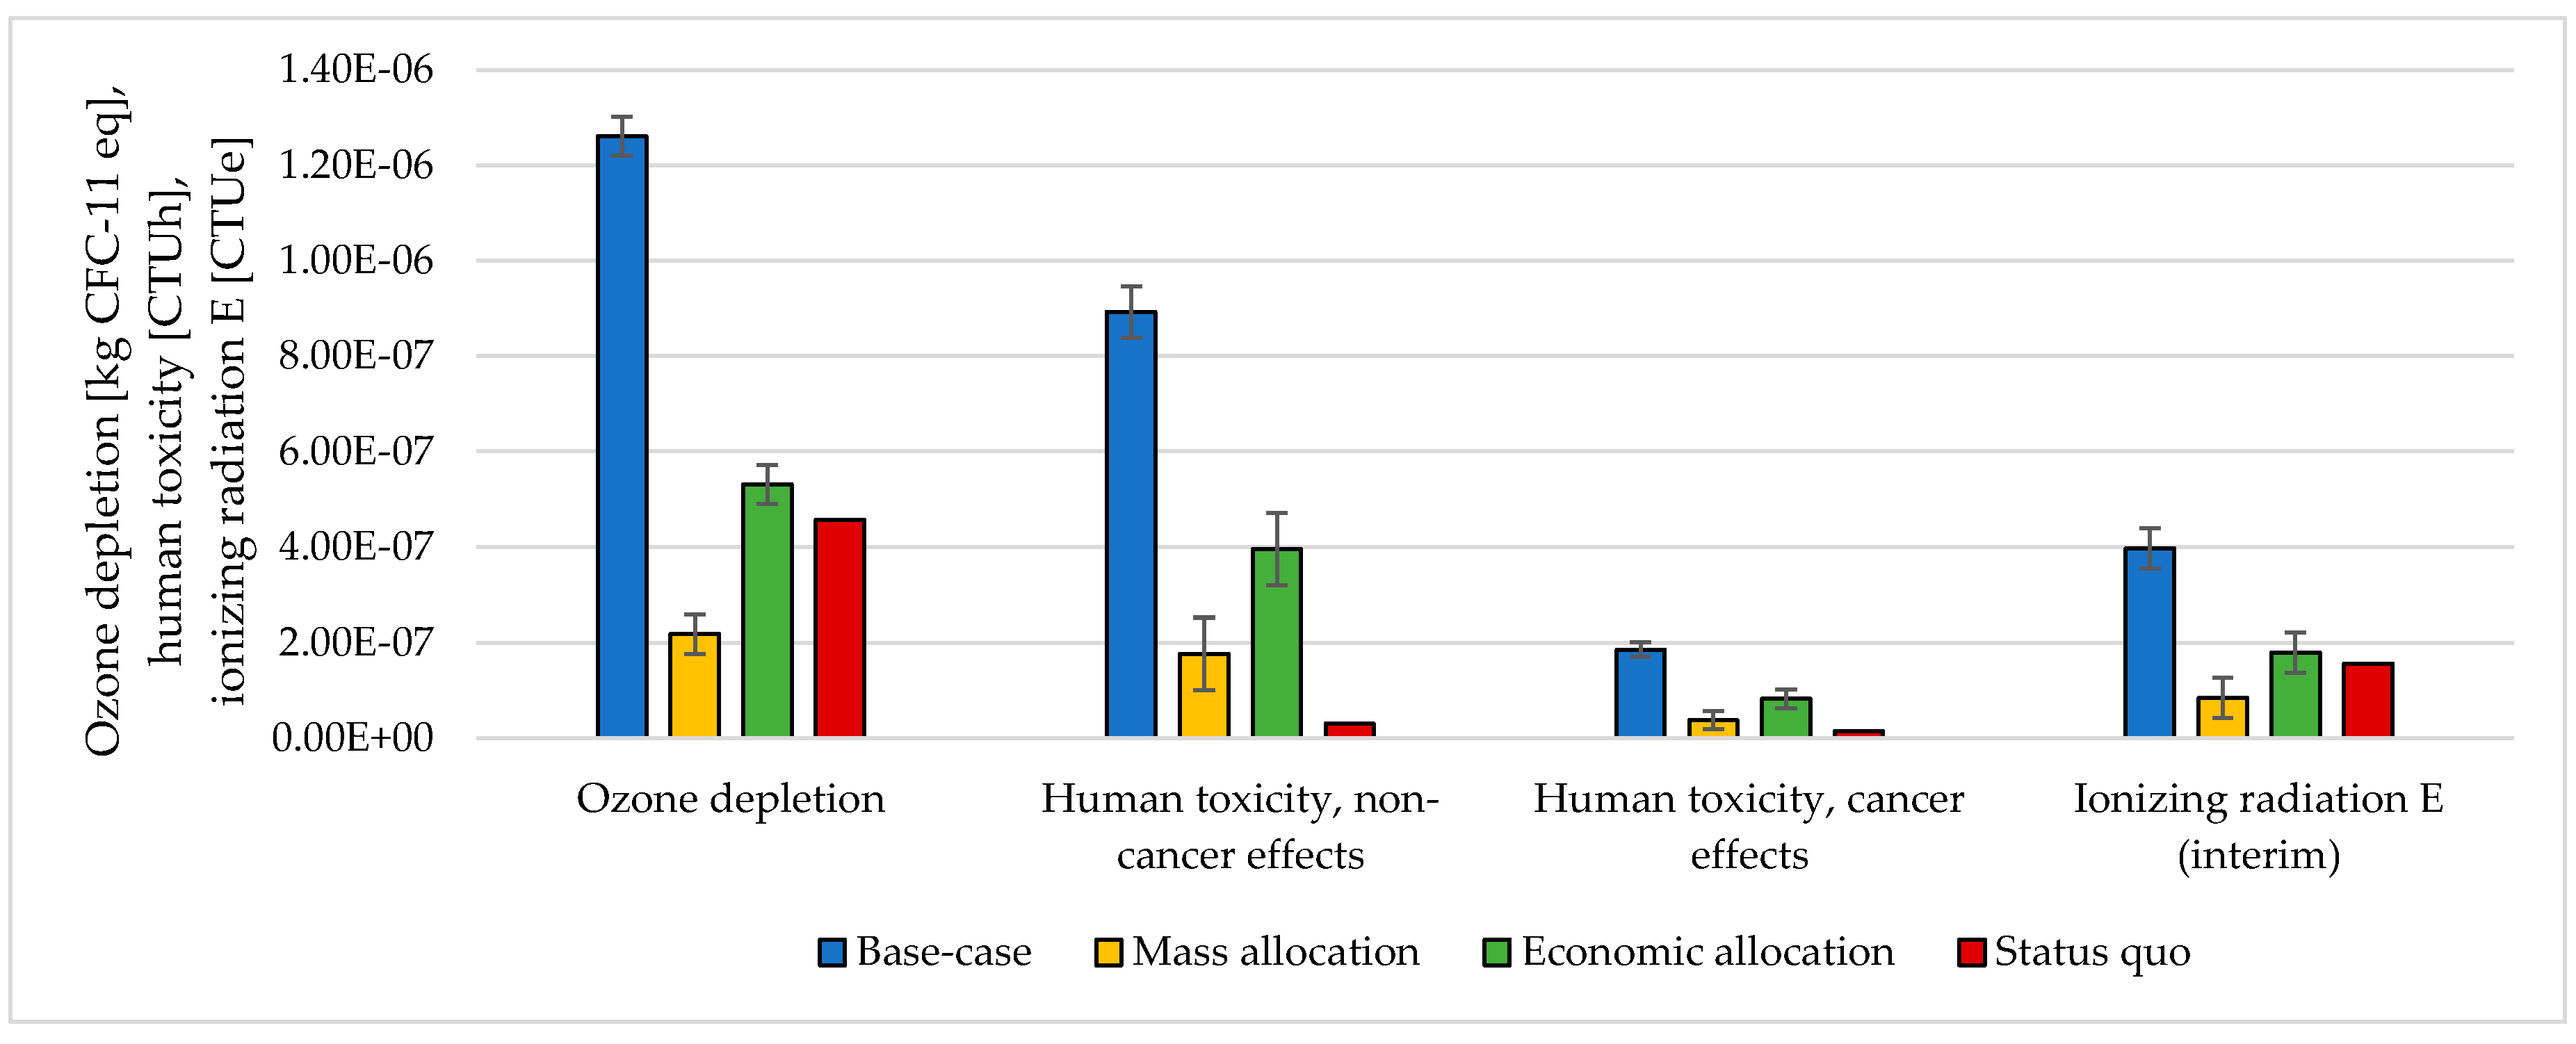
3.3. Handling Multi-Functionality in the Electrolysis Process

The choice of considering the oxygen produced by the electrolyzer as a co-product and the following methodology to handle the multi-functionality affected the results. The impacts were calculated according to different methodological choices (Figure 6, Figure 7, Figure 8 and Figure 9 and Table S5 SI). The indicators were averaged over various CO2 sources, and the variation between the minimum and maximum was illustrated by error bars. The status quo was represented by natural gas production and distribution of NG in high-pressure pipelines. The status quo reported no error bars because there was no variability related to the CO2 source choice. In the base-case, all the burdens were allocated to hydrogen production. The base-case reported the highest impacts on all the considered impact categories. Applying mass allocation led to the lowest impacts. This was due to the mass ratio between hydrogen and oxygen produced by the electrolyzer (8 kg of O2 per kg of H2), for which 89% of the burdens were attributed to oxygen. Only this methodology led to a negative climate change impact (−1.12 kg CO2 eq/kg SNG). The economic allocation reported the impacts between the base-case and the mass allocation because, with the prices stated in Section 2.3 (hydrogen price was 5 times higher than oxygen price), 62% of the total burdens were allocated to oxygen. It had to be noted that if we applied economic allocation with oxygen and hydrogen prices of the same order of magnitude, the results overlapped with the mass allocation case. We could observe that it would be necessary to have a market oxygen price higher than one-third of the hydrogen price to achieve a negative global warming impact. Finally, when comparing the results obtained with the three methodologies with the status quo, one could notice that the status quo implied lower impacts than the base-case and the economic allocation in all the considered indicators. It reported lower impacts than the mass allocation on all the considered indicators, except for climate change, ozone depletion, and ionizing radiation.

4. Conclusions and Outlook

In the present article, the impact assessment of producing synthetic natural gas from different point sources and DAC using the 2030 Italian energy mix was carried out. The methanation plant was modeled with Aspen software. Furthermore, different approaches were applied to deal with multi-functionality in the electrolysis process.
When considering the CO2 capture and production process, all assessed CO2 sources showed a benefit in the global warming impact (−0.81 kgCO2 eq/kg CO2 captured, on average) due to the CO2 uptake if compared to the case of industries with no CO2 capture. All the other impact categories were, instead, positive. On the other hand, within the stated boundaries and assumptions, the production of 1 kg of SNG implied impacts with a positive sign for all investigated indicators. Referring to SNG production, the major contribution to all the considered impact indicators was the electricity required for the water electrolysis. The contribution ranged between 87 and 96% of the total impact on all the indicators and CO2 sources. The heat provision represented the second most significant impact for the CO2 capture, which represented 0–9% of the total impact, with significant variance among the CO2 sources. Minor contributions were represented by the electricity for CO2 capture (2.0%), CO2 compression (1.6%), and H2 compression (0.7%). The CO2 uptake (−2.69 kg CO2 eq/kg SNG) represented 30–35% of the total share of the global warming impact.
For both the CO2 capture process and the SNG production, using CO2 from hydrogen production plants and from integrated pulp and paper mills led to the lowest impacts concerning all investigated indicators. On the other hand, capturing CO2 from cement plants had the highest impacts on most of the analyzed indicators (7 out of 16) due to heat production from coal, spoil from hard coal mining in the surface landfill, and coking process. Other CO2 sources were critical on a few indicators, and the process contribution analysis showed that ozone depletion, ionizing radiations, land use, resource depletion were mainly affected by the processing and transport of natural gas on long-distance, torch incineration of low-level radioactive waste, electricity production from open ground PV modules, electricity production from hydro reservoirs in Alpine regions, and zinc-lead mine operation, namely.
The choice of how to handle multi-functionality had a crucial impact on the assessment results. Mass allocation led to the lowest impacts due to the mass ratio between oxygen and hydrogen produced by the electrolysis. This was the only investigated case that reported negative values for the climate change indicator (−1.12 kg CO2 eq/kg). The economic allocation with the considered prices caused intermediate impacts between the base-case and the mass allocation case. It would be necessary to have a market oxygen price higher than one-third of the hydrogen price to achieve a negative global warming impact. The status quo of natural gas production with commercial technologies reported, in general, lower impacts than the base-case, the mass, and economic allocation. As suggested by the ISO 14040/44 and remarked by several authors, the allocation should be avoided when possible, in favor of less discretionary techniques. For this reason, the base-case scenario was made, associating all the environmental burdens to the hydrogen production, which gave the most precautionary results. On the other hand, it was also interesting to quantify the high variability of the results according to different methodologies, which can constitute a benchmark for some specific cases.
The main limitation of the study consists of adopting average data. When plant-specific data are available, an in-depth LCA needs to be conducted for a more comprehensive, reliable, and detailed assessment. In this case, the infrastructure should be also included in the study. Moreover, the prospective character should embrace all inputs, besides the already included energy mix. Looking at a broader perspective, many open questions remain on CCU. Future work should try to answer the question of whether SNG production is the most sustainable CCU option among all chemical vectors and whether CCU is the best option to reduce overall GHG emissions at all.

Supplementary Materials

The following are available online at https://www.mdpi.com/1996-1073/13/17/4579/s1, Table S1: Life Cycle Inventory input matrix, Table S2: Impact assessment of CO2 capture from various CO2 sources (functional unit 1 kg of CO2), Table S3: Contribution analysis for 1 kg SNG production, average among the CO2 sources, Table S4: Impact assessment for 1 kg SNG production from different CO2 sources, Table S5: Impact assessment of 1 kg SNG production with different MU approaches.

Author Contributions

Conceptualization, E.B., N.T., J.G., U.D. and M.A.; methodology, E.B. and N.T.; software, E.B.; validation, E.B. and N.T.; formal analysis, E.B.; investigation, E.B. and N.T.; resources, J.G., U.D. and M.A.; data curation, E.B. and N.T.; writing—original draft preparation, E.B.; writing—review and editing, E.B., N.T., J.G., U.D. and M.A.; visualization, E.B.; supervision, J.G., U.D. and M.A.; project administration, E.B., J.G., U.D. and M.A.; funding acquisition, J.G., U.D. and M.A. All authors have read and agreed to the published version of the manuscript.

Funding

This research received no external funding.

Conflicts of Interest

The authors declare no conflict of interest.

Nomenclature

AELAlkaline Electrolysis
CCCombined Cycle
CCUCarbon Capture Utilization
CSPConcentrated Solar Power
DACDirect Air Capture
DMEDimethyl Ether
EUEuropean Union
FDFossil Depletion
FTFischer–Tropsch
GHGGreenhouse Gases
GWIGlobal Warming Impact
IGCCIntegrated Gasification Combined Cycle
ILCDInternational Reference Life Cycle Data System
LCALife Cycle Assessment
MUMulti-Functionality
NGNatural Gas
NGCCNatural Gas Combined Cycle
PEMELProton Exchange Membrane Electrolysis
PPIProducer Price Index
PtHPower to Hydrogen
PtGPower to Gas
RESRenewable Energy Sources
SNGSynthetic Natural Gas

References

  1. Lewandowska-Bernat, A.; Desideri, U. Opportunities of power-to-gas technology. Energy Procedia 2017, 105, 4569–4574. [Google Scholar] [CrossRef]
  2. Bujnicki, J.; Dykstra, P.; Fortunato, E.; Heuer, R.-D.; Keskitalo, C.; Nurse, P. Novel Carbon Capture and Utilisation Technologies; Publication Office European Union: Luxembourg, 2018. [Google Scholar] [CrossRef]
  3. Pérez-Fortes, M.; Tzimas, E. Techno-Economic and Environmental Evaluation of CO2 Utilisation for Fuel Production; Synthesis of methanol and formic acid; EUR 27629 EN; JRC Science Hub: ZG Petten, The Netherlands, 2016. [Google Scholar] [CrossRef]
  4. Matzen, M.; Demirel, Y. Methanol and dimethyl ether from renewable hydrogen and carbon dioxide: Alternative fuels production and life-cycle assessment. J. Clean. Prod. 2016, 139, 1068–1077. [Google Scholar] [CrossRef] [Green Version]
  5. Matzen, M.; Alhajji, M.; Demirel, Y. Technoeconomics and sustainability of renewable methanol and ammonia productions using wind power-based hydrogen. J. Adv. Chem. Eng. 2015, 5. [Google Scholar] [CrossRef] [Green Version]
  6. Van Der Giesen, C.; Kleijn, R.; Kramer, G.J. Energy and climate impacts of producing synthetic hydrocarbon fuels from CO2. Environ. Sci. Technol. 2014, 48, 7111–7121. [Google Scholar] [CrossRef]
  7. Hoppe, W.; Bringezu, S.; Thonemann, N. Comparison of global warming potential between conventionally produced and CO2-based natural gas used in transport versus chemical production. J. Clean. Prod. 2016, 121, 231–237. [Google Scholar] [CrossRef]
  8. Sternberg, A.; Bardow, A. Life cycle assessment of power-to-gas: Syngas vs methane. ACS Sustain. Chem. Eng. 2016, 4, 4156–4165. [Google Scholar] [CrossRef]
  9. Sternberg, A.; Bardow, A. Power-to-What?-Environmental assessment of energy storage systems. Energy Environ. Sci. 2015, 8, 389–400. [Google Scholar] [CrossRef]
  10. Hoppe, W.; Thonemann, N.; Bringezu, S. Life cycle assessment of carbon dioxide–based production of methane and methanol and derived polymers. J. Ind. Ecol. 2018, 22, 327–340. [Google Scholar] [CrossRef]
  11. Reiter, G.; Lindorfer, J. Evaluating CO2 sources for power-to-gas applications—A case study for Austria. J. CO2 Util. 2015, 10, 40–49. [Google Scholar] [CrossRef]
  12. Zhang, X.; Bauer, C.; Mutel, C.L.; Volkart, K. Life cycle assessment of power-to-gas: Approaches, system variations and their environmental implications. Appl. Energy 2017, 190, 326–338. [Google Scholar] [CrossRef]
  13. Meylan, F.D.; Moreau, V.; Erkman, S. CO2 utilization in the perspective of industrial ecology, an overview. J. CO2 Util. 2015, 12, 101–108. [Google Scholar] [CrossRef]
  14. Cuéllar-Franca, R.M.; Azapagic, A. Carbon capture, storage and utilisation technologies: A critical analysis and comparison of their life cycle environmental impacts. J. CO2 Util. 2015, 9, 82–102. [Google Scholar] [CrossRef]
  15. Thonemann, N. Environmental impacts of CO2-based chemical production: A systematic literature review and meta-analysis. Appl. Energy 2020, 263, 114599. [Google Scholar] [CrossRef]
  16. Von der Assen, N.; Müller, L.J.; Steingrube, A.; Voll, P.; Bardow, A. Selecting CO2 sources for CO2 utilization by environmental-merit-order curves. Environ. Sci. Technol. 2016, 50, 1093–1101. [Google Scholar] [CrossRef]
  17. Bargiacchi, E.; Antonelli, M.; Desideri, U. A comparative assessment of Power-to-Fuel production pathways. Energy 2019, 183, 1253–1265. [Google Scholar] [CrossRef]
  18. Ritchie, H.; Roser, M. CO2 and Greenhouse Gas Emissions; Our World In Data Organization: England/Wales, UK, 2017; Available online: https://outwolrdindata.org/co2-and-other-greenhouse-gas-emissions (accessed on 27 July 2020).
  19. European Union. Greenhouse gas emission statistics-emission inventories. Eurostat 2018, 63, 175–180. [Google Scholar]
  20. Center for Climate and Energy Solution. Global Emissions 2019. Available online: https://www.c2es.org/content/international-emissions/ (accessed on 27 July 2020).
  21. Kätelhön, A.; Meys, R.; Deutz, S.; Suh, S.; Bardow, A. Climate change mitigation potential of carbon capture and utilization in the chemical industry. Proc. Natl. Acad. Sci. USA 2019, 166, 11187–11194. [Google Scholar] [CrossRef] [Green Version]
  22. Normann, F.; Gararsdóttir, S.Ó.; Skagestad, R.; Mathisen, A.; Johnsson, F. Partial capture of carbon dioxide from industrial sources—A discussion on cost optimization and the CO2 capture rate. Energy Procedia 2017, 114, 113–121. [Google Scholar] [CrossRef]
  23. Naims, H. Economics of carbon dioxide capture and utilization—A supply and demand perspective. Environ. Sci. Pollut. Res. 2016. [Google Scholar] [CrossRef] [Green Version]
  24. European Environment Agency. European Pollutant Release and Tranfer Register 2017. Available online: https://prtr.eea.europa.eu/#/pollutantreleases (accessed on 27 July 2020).
  25. International Organization for Standardization. ISO 14040 Environmental Management-Life Cycle Assessment-Principles and Framework; International Organization for Standardization: Vernier, Geneva, Switzerland, 1997; ICS 13.020.10. [Google Scholar]
  26. International Organization for Standardization. ISO 14044 Environmental Management-Life Cycle Assessme-Requirements and Guidelines; International Organization for Standardization: Vernier, Geneva, Switzerland, 2006; ICS 13.020.10. [Google Scholar] [CrossRef]
  27. Swiss Centre for Life Cycle Inventories. Ecoinvent Data Version 3.5. Available online: https://www.ecoinvent.org/ (accessed on 3 February 2020).
  28. Wedema, B.P.; Bauer, C.; Hischier, R.; Mutel, C.; Nemecek, T.; Reinhard, J.; Vadenbo, C.O.; Wernet, G. Data Quality Guideline For The Ecoinvent Database Version 3; Ecoinvent Report 1 (v3); Swiss Cent Life Cycle Invent: St. Gallen, Switzerland, 2013; Volume 3. [Google Scholar]
  29. European Commission-Joint Research Centre-Institute for Environment and Sustainability. International Reference Life Cycle Data System (ILCD) Handbook: Specific Guide for Life Cycle Inventory Data Sets; EUR 24709 EN; Publications Office of the European Union: Luxembourg, 2010. [Google Scholar] [CrossRef]
  30. Aspentech. Aspen Plus. Available online: https://www.aspentech.com/en/products/engineering/aspen-plus (accessed on 30 April 2020).
  31. Italian Ministry of Economic Development. Proposta di Piano Nazionale Integrato per l’Energia e il Clima. 2018. Available online: https://www.mise.gov.it/images/stories/documenti/Proposta_di_Piano_Nazionale_Integrato_per_Energia_e_il_Clima_Italiano.pdf (accessed on 27 July 2020).
  32. Ministero dello Sviluppo Economico, Ministero dell’Ambiente e della Tutela del Territorio e del Mare. Strategia Energetica Nazionale (SEN) 2017, 308. Available online: https://www.mise.gov.it/images/stories/documenti/Testo-integrale-SEN-2017.pdf (accessed on 27 July 2020).
  33. Gestore dei Servizi Energetici GSE S.p.A. Direzione. Rapporto Statistico Solare Fotovoltaico 2018-Il Solare Fotovoltaico in Italia Stato di Sviluppo e Trend del Settore. 2018. Available online: https://www.gse.it/documenti_site/Documenti%20GSE/Rapporti%20statistici/Solare%20Fotovoltaico%20-%20Rapporto%20Statistico%202018.pdf (accessed on 27 July 2020).
  34. Bhandari, R.; Trudewind, C.A.; Zapp, P. Life cycle assessment of hydrogen production via electrolysis-A review. J. Clean. Prod. 2014, 85, 151–163. [Google Scholar] [CrossRef]
  35. Müller, L.J.; Kätelhön, A.; Bachmann, M.; Zimmermann, A. A guideline for life cycle assessment of carbon capture and utilization. Front. Energy Res. 2020, 8, 1–20. [Google Scholar] [CrossRef]
  36. Thonemann, N.; Maga, D.; Petermann, C. Handling of multi-functionality in life cycle assessments for steel mill gas based chemical production. Chemie Ingenieur Technik 2018, 90, 1576–1586. [Google Scholar] [CrossRef]
  37. Curran, M.A. Co-product and input allocation approaches for creating life cycle inventory data: A literature review. Int. J. Life Cycle Assess 2007, 12, 65–78. [Google Scholar]
  38. Jung, J.; Von Der Assen, N.; Bardow, A. Sensitivity coefficient-based uncertainty analysis for multi-functionality in LCA. Int. J. Life Cycle Assess 2014, 19, 661–676. [Google Scholar] [CrossRef]
  39. Pelletier, N.; Ardente, F.; Brandão, M.; De Camillis, C.; Pennington, D. Rationales for and limitations of preferred solutions for multi-functionality problems in LCA: Is increased consistency possible? Int. J. Life Cycle Assess 2015, 20, 74–86. [Google Scholar] [CrossRef] [Green Version]
  40. Von der Assen, N.; Jung, J.; Bardow, A. Life-Cycle assessment of carbon dioxide capture and utilization: Avoiding the pitfalls. Energy Environ. Sci. 2013. [Google Scholar] [CrossRef]
  41. Von der Assen, N.; Voll, P.; Peters, M.; Bardow, A. Life cycle assessment of CO2 capture and utilization: A tutorial review. Chem. Soc. Rev. 2014, 43, 7982–7994. [Google Scholar] [CrossRef]
  42. Texas A&M University Libraries. Research Guides-Bulk chemical Prices. Last. Available online: https://tamu.libguides.com/c.php?g=587308&p=4076262 (accessed on 30 April 2020).
  43. FRED Economic Data St.Louis Fed. Producer Price Index by Industry: Industrial Gas Manufacturing: Argon and Hydrogen. Available online: https://fred.stlouisfed.org/series/PCU325120325120C (accessed on 30 April 2020).
  44. Dillich, S.; Ramsden, T.; Melaina, M. Hydrogen production cost using low-cost natural gas. DOE Hydrog. Fuel Cells Progr. Rec. 2012, 3–8. Available online: https://www.hydrogen.energy.gov/pdfs/12024_h2_production_cost_natural_gas.pdf (accessed on 27 July 2020).
  45. FRED Economic Data St.Louis Fed. Producer Price Index by Industry: Industrial Gas Manufacturing: Oxygen. Available online: https://fred.stlouisfed.org/series/PCU325120325120A (accessed on 30 April 2020).
  46. Wikipedia. Prices of Chemical Elements. Available online: https://en.wikipedia.org/wiki/Prices_of_chemical_elements#cite_note-cryocoolers11-26 (accessed on 30 April 2020).
Figure 1. Aggregated CO2 releases from industrial activities in Italy (2017): sector breakdown. Adapted from [24].
Energies 13 04579 g001
Figure 2. Study boundaries.
Energies 13 04579 g002
Figure 3. Relative impacts of CO2 capture (functional unit 1 kg of CO2) from various CO2 sources.
Energies 13 04579 g003
Figure 4. Contribution analysis and impact assessment for the production of 1 kg SNG (Synthetic Natural Gas), average values among all the considered CO2 sources. The error bars represent the fluctuation depending on the chosen CO2 source.
Energies 13 04579 g004
Figure 5. Relative impact assessment for 1 kg SNG production from different CO2 sources.
Energies 13 04579 g005
Figure 6. Climate change, freshwater ecotoxicity, and land use assessment for 1 kg SNG production under different MU methodologies: base-case, mass allocation, economic allocation, and status quo.
Energies 13 04579 g006
Figure 7. Ionizing radiation, photochemical ozone formation, acidification, terrestrial eutrophication, and water depletion assessment for 1 kg SNG production under different MU methodologies: base-case, mass allocation, economic allocation, and status quo.
Energies 13 04579 g007
Figure 8. Particulate matter, freshwater eutrophication, marine eutrophication, and resource depletion assessment for 1 kg SNG production under different MU methodologies: base-case, mass allocation, economic allocation, and status quo.
Energies 13 04579 g008
Figure 9. Ozone depletion, human toxicity, and ionizing radiation assessment for 1 kg SNG production under different MU methodologies: base-case, mass allocation, economic allocation, and status quo.
Energies 13 04579 g009
Table 1. Potential CO2 from point sources, with capture rate and captured CO2 purity. IGCC = Integrated Gasification Combined Cycle; NGCC = Natural Gas Combined Cycle. Data from [23].
CO2 Emitting SourceCapture RateCO2 Purity
NGCC power plant85–100%≥99.9%
Refineries and steam crackers40–50%≥95%
Coal power plant85–100%≥99.9%
Integrated pulp and paper millsN.A.N.A.
Market pulp millsN.A.N.A.
Iron and steel50%≥95%
Cement85–100%≥95%
IGCC power plant85–100%≥99.9%
Ammonia85–100%≥95%
Ethylene oxide90–99%>98% with post-combustion; 85% with oxyfuel purposes
Gas processingN.A.N.A.
Hydrogen85–100%≥95%
Table 2. Italian 2030 energy mix for electricity production (TWh). CC = Combined Cycle; CSP = Concentated Solar Power; PV = Photovoltaics; RES = Renewable Energy Sources.
Installed TechnologyInstalled Capacity (TWh)Share (%)
Gas118.0038.5
Gas, CC36.0911.8
Gas, conventional9.693.2
Gas, CC, 400 MW44.6814.6
Gas, Conventional, 100 MW27.549.0
Coal00
Oil and others2.000.7
Oil, conventional0.430.1
Oil, cogeneration1.570.5
Geothermic7.102.3
Bioenergy15.705.1
Biogas, gas engine11.963.9
Wood chips3.741.2
Solar74.5024.3
PV, rooftop30.159.8
PV, ground mounted43.0614.0
CSP1.270.4
Wind40.1013.1
Onshore, <1 MW10.703.5
Onshore, 1–3 MW24.177.9
Onshore, >3 MW3.271.1
Offshore1.960.6
Hydro49.3016.1
Hydro, Pumped storage1.430.5
Hydro, Reservoir30.6410.0
Hydro, Run-on17.235.6
Tot306.7100
Tot RES186.760.9
Table 3. Average specific energy consumption for CO2 capture from different CO2 sources in Europe. Data from [16].
Average Energy Demand (GJ/(t CO2))
Type of CO2 SourceCO2 ConcentrationElectricityHeatNatural GasCoal
Air400 ppm1.29 4.19
NGCC power plant3–4%1.60
Refineries and steam cracker3–13%0.913.16
Coal power plant12–15%1.22
Integrated pulp and paper mills7–20%0.04 1.57
Market pulp mills7–20%1.03
Iron and steel17–35%0.870.95
Cement14–33%0.09 3.35
IGCC power plant1/40%0.61 0.81
Ammonia/ethylene oxide/gas processing≈100%0.400.01
Hydrogen≈100%0.35
Table 4. PPI (Producer Price Index) and calculated average price for oxygen and hydrogen as bulk chemicals.
Chemical ReferenceDecember 2009December 2019Current (Average)Allocation Factors
HydrogenPPI index105
(2012) [43]
92.9 [43]89.3 [43] 37.9%
Price ($/kg)1.39
(2012) [44]
1.231.181.21
OxygenPPI index170
(2001) [45]
230.3 [45]311.0 [45] 62.1%
Price ($/kg)0.154
(2001) [46]
0.210.280.25

