Abstract
In order to combat climate change, many countries have promised to bolster Renewable Energy (RE) production following the Paris Agreement with some countries even setting a goal of 100% by 2025. The reasons are twofold: capitalizing on carbon emissions whilst concomitantly benefiting from reduced fossil fuel dependence and the fluctuations associated with imported fuel prices. However, numerous countries have not yet made preparations to increase RE production and integration. In many instances, this reluctance seems to be predominant in energy-rich countries, which typically provide heavy subsidies on electricity prices. With such subsidies, there is no incentive to invest in RE since the time taken to recoup such investments would be significant. We develop a model using a Neural Network (NN) regression algorithm to quantitatively illustrate this conjecture and also use it to predict the reduction in electricity price subsidies required to achieve a specified RE production target. The model was trained using 10 leading metrics from 53 countries. It is envisaged that policymakers and researchers can use this model to plan future RE targets to satisfy the Nationally Determined Contributions (NDC) and determine the required electricity subsidy reductions. The model can easily be modified to predict what changes in other country factors can be made to stimulate growth in RE production. We illustrate this approach with a sample use case.
1. Introduction
In recent times, many countries have set targets for Renewable Energy (RE) production and their Nationally Determined Contributions (NDCs). The need to reduce carbon emissions and their effect on climate change is a major driving force in the NDC value. Pledges were made under international agreements such as the Paris Agreement and Kyoto Protocol to reduce carbon emissions by targeting fossil fuel-based electricity generation and the transportation sector. Energy-importing Small Island Developing States (SIDS) may face major challenges with reducing fossil fuel dependence due to high transport costs and continual fluctuations in energy commodity prices.
The integration of RE is likely to lead to an environmentally friendly, sustainable, and stable energy production environment, more so as storage technologies become less expensive with improved energy and power densities. To invest in RE, countries must implement strategies to reduce their dependence on fossil fuels. This is more so as consumers are unlikely to invest in RE sources if electricity prices are low since the payback period can be quite long or not at all [1]. Compounding this situation, electricity is subsidized in many fossil fuel-rich countries, thus taking its price well below market value. Investment in RE tends to be low in these scenarios. Whereas [1] investigated and illustrated the correlation between electricity prices and RE production, we investigate this dependence on 12 additional features. The outputs of this Machine Learning (ML) model can be used by policymakers in energy-rich countries to determine what subsidies should be adjusted to achieve a specific RE production target. The model developed in this paper can also be used by researchers to investigate what other correlations exist that affect RE investment. A use case for one particular SIDS is provided.
2. Contributions and Related Work
The “20/20/20 Directive” plans to reduce greenhouse gas emissions by 20% and increase the share of renewable energy by 20% in the EU’s total energy consumption by the year 2020 [2]. As such, there is research on the correlation between RE and electricity prices particularly in European countries as they are driven by updated financial incentives and environmental policies. However, the focus is usually on implied causality between RE measures and observed electricity prices. For example, reference [3] used daily wind speed readings and sunshine intensity data in the Netherlands to estimate whether increased RE production capacity contributed to variability in daily electricity prices.
Reference [4] argued that, although electricity markets are increasingly becoming deregulated, a greater contribution of RE to overall production should lead to a mitigation of price variability. Lower price volatility benefits RE investors and consumers who would benefit from lower prices and risk. Reference [5] also performed an empirical exploration of Danish and German wind and solar examples to estimate the impact of renewable sources on electricity price levels and volatility.
Germany has experienced significant growth in RE electricity generation over the past 15 years. Reference [6] attributed this growth mainly to the guaranteed feed-in-tariff implemented in 1991. In this setting, the merit order effect has been studied extensively and observed in several other electricity markets. This effect can be described as the event where a large amount of installed RE capacity pushes higher marginal cost units out, thereby reducing electricity prices. The analysis performed in [6] investigated the merit order effect on spot market prices in Germany, thereby demonstrating that a relationship exists.
The authors of [7] developed an electricity spot market dispatch and investment model to analyze the increasing share of variable renewable energy sources on the electricity price. This paper analyzed the effects on both the average electricity price and price variance. It is noted that as RE shares grow, the market value of wind and PV (Photo-Voltaic) capacity decreases. The developed model reveals that as wind capacity is developed, price variance increases. The price variance is a result of wind curtailment activities. In Denmark, the frequency of peak prices has declined because of higher RE shares [7].
Ireland has access to a bountiful wind resource and, as such, has been incorporating more wind energy into its system. The government has indicated a target of 40% by 2020 [8]. To facilitate this, price based Demand Side Management (DSM) is considered. The authors of [9] observed a strong correlation between financial savings, wind energy demand, and conventional energy demand, with price based DSM consistently promoting installed RE sources.
The above studies were performed for countries possessing dynamic electricity prices. Reference [10] investigated the impact of various electricity pricing policies, such as flat and peak pricing, on RE investments. They found flat pricing to be more conducive to solar and wind energy investments by utility providers. On the other hand, peak pricing encouraged greater investments in solar energy technologies by distributed generators.
There is a line of research that examines the factors influencing a country’s level of investment into RE Research and Development (R&D). As an example, reference [11] found that R&D into wind energy is driven by electricity consumption. It was found that lower electricity prices caused higher R&D investments, while R&D subsidies had a negligible impact. The majority of studies performed on this subject were done in countries that already possess grid integrated RE sources. The converse is true where not much research has been done in countries that possess little to no integrated RE. Small fossil fuel-rich countries will be reluctant to develop RE capacity, and so, it is useful for these countries to have access to a tool that can predict the impact on increased RE penetration. The model developed in this paper can be used by any country irrespective of RE penetration levels.
In recent years, ML has played a significant role in the development of smart grids and RE systems, especially as RE sources are finding broader applications in the world both in distributed and centralized grids. However, the ratio of RE to world production of electricity is still insignificant. In 2017, RE accounted for only 10.1% of electric power [12]. One form of stimulating the RE sector is by use of ML tools. In this regard, prediction of wind and solar energy supply is currently a popular research topic for ML techniques.
The market share of solar energy production can be increased by improving short-term irradiance forecasting capabilities. The study performed in [13] analyzed the performance of four ML algorithms using spatially distributed irradiance sensors as inputs to achieve forecasting. The developed model can predict forecast horizons of 10s up to a few hours. The results obtained in this study showed that a Neural Network (NN) produced the best results amongst the four for shorter lead times and dense spatio-temporal input data. Another study performed in [14] used sky images to obtain velocity maps of clouds. These maps were then used to predict cloud movements over a network of sensors to forecast solar irradiance.
Reference [15] utilized a Deep Neural Network (DNN) algorithm to extrapolate wind speeds to high heights based on measured values at lower heights. The study facilitated more accurate wind energy assessments at the hub height where measured data at that height are unavailable. These modeling approaches significantly reduce the cost and complexity of acquiring measured data. The results of the DNN algorithm were also compared with that of a classical feed-forward artificial neural network using the Levenberg–Marquardt method for training. The study obtained a Mean Absolute Percent Error (MAPE) of 9.65% for wind speeds at a height of 120m. ML initiatives must be supported by reliable data sources to produce well-informed recommendations. These initiatives should also be available for use by both industrial and small companies.
3. Datasets
The electricity price data used in this study are from June 2018. Data from only 53 countries across 10 features are available, but these are adequate to illustrate the relationships in this paper. Data on RE investment and other features were obtained from [16]. This source holds rich datasets for production capacities per energy source. The data are provided as a percentage of the total production capacity for nuclear power, fossil fuels, water power, RE, and other sources. In this paper, energy from hydro-power is considered only partly as an RE. As such, hydro-power is not included in this analysis. However, in some countries, hydro-power is significant, and so, in those countries, there is a lower need to invest in RE. Those countries may not conform to this paper’s hypothesis. Table 1 provides the full list of features used.

Table 1.
Permutation feature importance scores.
4. Materials and Methods
4.1. Linear Regression Using Only Electricity Prices
Figure 1 plots the data points of RE contribution against electricity price for each country in the dataset. Prices are all converted to USD to normalize all rows. The study performed in [1] developed a Linear Regression (LR) model between electricity price data and RE capacity. This LR model is also drawn in Figure 1. The LR model visually shows a loose relationship between both factors.
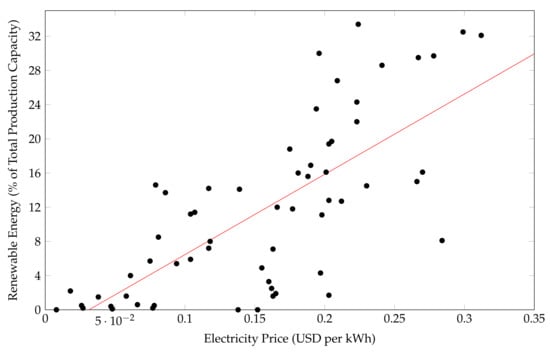
Figure 1.
Linear regression of renewable energy and electricity prices [1]. Reproduced from [1], IEEE: 2018.
There are three outliers to the relationship shown in Figure 1. Denmark and Germany possess high RE production values (53.6% and 49.9%, respectively). At these values, the conjecture does not hold as the initial RE investment costs are recovered. It follows that dependence on fossil fuels is reduced, and subsequently, electricity prices decline [1]. These two countries are still included in the training dataset. Bermuda has a high electricity price of $0.387 per kWh with zero RE production capacity. This is an example where RE production capacity data did not reflect observed investment. One shortcoming of this model is a low coefficient of determination of 0.53.
4.2. Machine Learning with Multiple Features
The LR plot developed by [1] confirms that there is a relationship between electricity prices and RE capacity. The following section investigates additional factors that may play a role in RE investment.
NNs are popular for modeling sophisticated problems, but can also be tailored to solve regression problems as a supervised learning method. NN regression allows researchers to model the impact of multiple independent variables on the dependent variable, thereby making it powerful for non-linear regression. AML allows custom architectures using the Net# language for NNs to be built or the use of template architectures. Note also that, at any point in the experiment, a custom Python code can be injected, whether to perform a data operation or draw visuals.
This paper develops an NN regression model utilizing 10 features to improve the accuracy of predicting RE investment. Although the research focus is primarily on the impact of electricity prices on RE, the influence of features such as population growth, Gross Domestic Product (GDP), quality of life, intelligence quotient, carbon dioxide emissions, and other metrics are investigated with the NN prediction model. The model was developed, trained, and deployed using Microsoft’s Azure Machine Learning (AML) Studio. Figure 2 shows a flowchart of the ML process implemented.
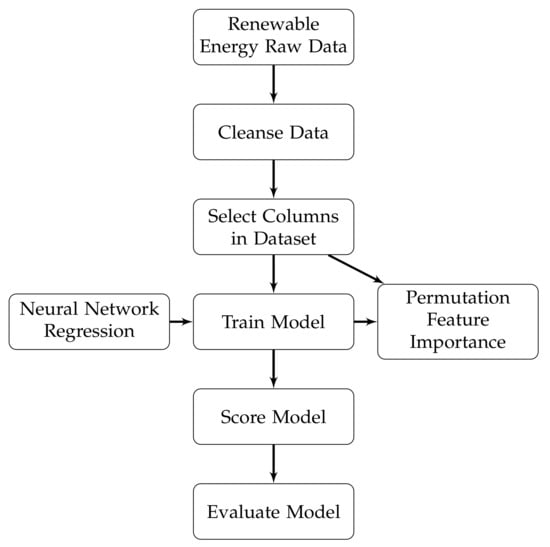
Figure 2.
Overview of the process used with Azure Machine Learning Studio.
Figure 2 shows that the raw data are first cleansed. This involves removing rows with missing values, removing duplicate rows, and editing metadata. Editing of metadata takes place in the form of data conversion of cells to the data type specified for that column. Afterwards, the columns of interest in model training are selected. The model is then trained using the selected data and an NN regression algorithm. The trained model generates a Permutation Feature Importance (PFI) table that ranks the importance of each feature to the predicted output. PFI is defined as a model-agnostic feature ranker that quantifies the contribution of features to the predictive performance of a model. This is done in terms of how much a chosen evaluation metric deviates after permuting the values of that feature [17]. The score model block then generates a set of predictions using the trained model. The evaluate model block receives these predictions and computes a set of evaluation metrics.
NN regression in AML requires a tagged dataset with a labeled column. This regression model is limited to predicting a numerical value. The NN regressor used had an initial node weight diameter of 0.1 and a learning rate of 0.005. A min-max data normalizer was applied, and the number of iterations was set to 100. The min-max normalizer linearly resizes every feature to the [0, 1] interval. This is carried out by shifting the dataset of each feature to the minimal value of 0, then dividing the dataset by the new maximum value of the dataset. The dataset was also set to be shuffled between training iterations. The regressor was configured as a fully-connected case. With this configuration, it had exactly one (1) hidden layer. The hidden layer is intermediary, connected fully to both the output and input layers. The number of nodes in the hidden layer was left at the default of 100. The learning rate was set to a value of 0.005 after a series of tests. Using a larger value results in an overfitted model, while using a lesser value requires more iterations to be run to train the model. The momentum value that specifies a weight to be applied during learning to nodes was set to 0.0.
5. Results
Table 1 provides the full list of features that were used and their respective importance scores obtained from the output of the PFI block. The PFI block accepts a trained model, test dataset, and evaluation metric to evaluate feature importance. The coefficient of determination was set as the evaluation metric for this study.
Interestingly enough, population growth per year holds the highest importance score. These results also support the hypothesis that electricity prices largely affect RE investment. Within this list of features, electricity price is arguably the easiest factor that can be adjusted. The high importance score of daily max temperature may be explained by investments in solar energy in those countries.
Table 2 provides various performance metrics of the trained model. As mentioned previously, these metrics are obtained from comparing predicted values to the actual values in the initial dataset. The error metrics computed are low, indicating a high accuracy. The coefficient of determination (often referred to as ) represents the predictive power of the trained mode. It is a value between zero and one, where one indicates a perfect fit. RE technologies seems to have experienced greater development in countries that rely more heavily on energy imports and implement large-scale programs supported by the state [12].
Table 2.
Evaluation results of neural network regression.
The Absolute Percentage Error (APE) for each country is computed and provided in Table 3 to examine how well each approach performed. This is the absolute value of the difference between actual and predicted RE investment divided by the actual RE investment value multiplied by 100. Note that for most countries, this error is very small for NN regression. The NN approach provides much higher accuracy than LR mainly because it takes into account 12 additional features. In fact, the error is less than 10% for the vast majority of countries.
Table 3.
Absolute percentage errors for each country.
6. Sample Use Case
This section provides a use case scenario for Trinidad and Tobago. The Government of the Republic of Trinidad and Tobago indicated an RE target of 10% by the year 2021. Reference [18] showed that the electricity price is $0.047 USD per kWh with 0.4% of energy derived from RE sources [16]. This use case represents a fossil fuel-rich country with very little to no RE penetration.
The NN model predicts that an RE capacity target of 10% can be achieved by increasing electricity prices from $0.047 US per kWh to $0.201 US per kWh, a drastic increase of 327%. This can be satisfied by increasing the electricity price by five cents per kWh in the following three years. This price hike is quite drastic (>100% in 2019) and may be politically challenging to implement. The additional revenue from increased electricity prices is expected to be used to increase efforts in renewables.
The non-subsidized electricity cost of other Caribbean islands is significantly higher, for example Barbados ($0.28), the Bahamas ($0.32), Jamaica ($0.32), St Lucia ($0.34), Antigua ($0.37), Dominica ($0.38), and Grenada ($0.43). These values are among the largest in the world. Conversely, in Trinidad and Tobago, prices are heavily subsidized by the government [19]. The non-subsidized electricity price in Trinidad and Tobago is estimated to be $0.12 per kWh. This implies that approximately 61% of the true cost is subsidized. Increasing the electricity price by 15.4 cents per kWh to 20.1 cents per kWh would entirely remove the electricity subsidy. Table 4 shows calculated rates for residential electricity pricing to achieve an RE target of 10% in Trinidad and Tobago, based on the 2018 rate schedule provided in [18] and the model output.
Table 4.
Electricity prices predicted to achieve an RE target of 10% in Trinidad and Tobago.
Table 4 shows the trajectory at which electricity price subsidies are recommended to be reduced to achieve an RE target of 10% in Trinidad and Tobago. The Caribbean countries mentioned previously are net energy importers, whereas Trinidad and Tobago is a net energy exporter. The country data reveals that net fossil fuel exporters possess the lowest electricity prices at the bottom quartile. Such exporters include Mexico ($0.081), the United Arab Emirates ($0.078), Nigeria ($0.077), Russia ($0.066), Malaysia ($0.061), Saudi Arabia ($0.048), Trinidad and Tobago ($0.047), Algeria ($0.038), Iran ($0.027), Qatar ($0.026), Egypt ($0.018), and Iraq ($0.008). Exceptions to this trend are very large countries in Asia such as China ($0.086), India ($0.079), Pakistan ($0.075), and Bangladesh ($0.058).
The majority of fossil fuel exporting countries subsidize their electricity production heavily [19,20]. One exception to this is Norway, a fossil fuel exporting country with high electricity prices ($0.16), but still possessing a low RE capacity (3.3%), especially when compared to its neighbors Sweden (30%) and Finland (23.5%).
7. Conclusions
This paper develops an ML model to predict RE investment based on several factors. It can be used to develop multiple scenarios to determine what changes, in this case reduction of subsidies, are to be made to reach a specified target. The developed ML model was compared against a previously proposed LR model, and its significant improvement of the accuracy was demonstrated in the form of the APE performance. At high levels of investment, the mature deployment of RE sources causes a reduction in electricity prices. This study particularly investigated the effect of electricity pricing on RE production. It is observed that as production levels increase, electricity prices are subsequently decreased. This is due to reduced dependence on fossil fuels. In such cases, the linear regression model presented in [1] begins to fail. NN regression was applied to address this weakness. The model produced in this study operates purely on data and does not take into account country policies. One shortcoming of this model is insufficient data to perform cross-validation across previous years. A solution would be to perform the cross-validation with new data from subsequent years.
Author Contributions
Conceptualization, G.H., P.H. and S.B.; methodology, G.H. and P.H.; software, G.H. and P.H.; validation, C.S., G.H., P.H., R.M. and S.B.; formal analysis, G.H. and P.H.; investigation, G.H. and P.H.; resources, G.H., P.H. and R.M.; data curation, G.H., P.H. and R.M.; writing–original draft preparation, G.H. and P.H.; writing–review and editing, C.S., R.M. and S.B.; visualization, G.H., P.H. and R.M.; supervision, C.S. and S.B. All authors have read and agreed to the published version of the manuscript.
Funding
This research received no external funding.
Conflicts of Interest
The authors declare no conflict of interest.
References
- Martinez, R.; Hosein, P. The Impact of Low Electricity Prices on Renewable Energy Production. In Proceedings of the 2018 International Conference and Utility Exhibition on Green Energy for Sustainable Development (ICUE), Phuket, Thailand, 24–26 October 2018; pp. 1–6. [Google Scholar]
- Council of the European Union. Council Adopts Climate-energy Legislative Package; Council of the European Union: Brussels, Belgium, 2009. [Google Scholar]
- Mulder, M.; Scholtens, B. The impact of renewable energy on electricity prices in the Netherlands. Renew. Energy 2013, 57, 94–100. [Google Scholar] [CrossRef]
- Johnson, E.; Oliver, M. Renewable energy and wholesale electricity price variability. In Proceedings of the IAEE Energy Forum; First Quarter; International Association for Energy Economics: Bergen, Norway, 2019. [Google Scholar] [CrossRef]
- Rintamaki, T.; Siddiqui, A.; Salo, A. Does renewable energy generation decrease the volatility of electricity prices? a comparative analysis of Denmark and Germany. Tech. Rep. 2014. [Google Scholar] [CrossRef]
- Sensfuß, F.; Ragwitz, M.; Genoese, M. The merit-order effect: A detailed analysis of the price effect of renewable electricity generation on spot market prices in Germany. Energy Policy 2008, 36, 3086–3094. [Google Scholar] [CrossRef]
- Möbius, T.; Müsgens, F. The effect of variable renewable energy sources on the volatility of wholesale electricity prices—A stylized full cost approach. In Proceedings of the 2015 12th International Conference on the European Energy Market (EEM), Lisbon, Portugal, 19–22 May 2015; pp. 1–5. [Google Scholar]
- Commission for Energy Regulation. Criteria for Gate 3 Renewable Generator Offers & Related Matters Proposed Direction to The System Operators. 2008. Available online: https://www.cru.ie/wp-content/uploads/2008/07/cer08260.pdf (accessed on 21 July 2020).
- Finn, P.; Fitzpatrick, C.; Leahy, M.; Relihan, L. Promotion of wind generated electricity using price responsive Demand Side Management: Price prediction analysis for imperfect energy storage. In Proceedings of the 2010 IEEE International Symposium on Sustainable Systems and Technology, Arlington, VA, USA, 17–19 May 2010; pp. 1–5. [Google Scholar]
- Kok, A.G.; Shang, K.; Yucel, S. Impact of Electricity Pricing Policies on Renewable Energy Investments and Carbon Emissions. Manag. Sci. 2018, 64, 131–148. [Google Scholar] [CrossRef]
- He, Z.X.; Xu, S.C.; Li, Q.B.; Zhao, B. Factors That Influence Renewable Energy Technological Innovation in China: A Dynamic Panel Approach. Sustainability 2018, 10, 124. [Google Scholar] [CrossRef]
- Mukhamediev, R.I.; Mustakayev, R.; Yakunin, K.; Kiseleva, S.; Gopejenko, V. Multi-Criteria Spatial Decision Making Support System for Renewable Energy Development in Kazakhstan. IEEE Access 2019, 7, 122275–122288. [Google Scholar] [CrossRef]
- Eschenbach, A.; Yepes, G.; Tenllado, C.; Gómez-Pérez, J.I.; Piñuel, L.; Zarzalejo, L.F.; Wilbert, S. Spatio-Temporal Resolution of Irradiance Samples in Machine Learning Approaches for Irradiance Forecasting. IEEE Access 2020, 8, 51518–51531. [Google Scholar] [CrossRef]
- Chow, C.W.; Belongie, S.; Kleissl, J. Cloud motion and stability estimation for intra-hour solar forecasting. Sol. Energy 2015, 115, 645–655. [Google Scholar] [CrossRef]
- Mohandes, M.A.; Rehman, S. Wind Speed Extrapolation Using Machine Learning Methods and LiDAR Measurements. IEEE Access 2018, 6, 77634–77642. [Google Scholar] [CrossRef]
- Worlddata: The World in Numbers. Available online: https://www.worlddata.info/ (accessed on 12 February 2020).
- ML Blog Team. Permutation Feature Importance. Available online: https://blogs.technet.microsoft.com/machinelearning/2015/04/14/permutation-feature-importance/ (accessed on 21 July 2020).
- Tariff Principles and Structures. 2018. Available online: http://www.ric.org.tt/price-review/ (accessed on 21 February 2020).
- Energy Subsidies. 2017. Available online: https://www.iea.org/topics/energy-subsidies/ (accessed on 21 July 2020).
- Sharma, C.; Bahadoorsingh, S.; Aiyejina, A. Integrating applicable sources of renewable energy in the Caribbean. In Proceedings of the 2011 IEEE Power and Energy Society General Meeting, Detroit, MI, USA, 24–28 July 2011; pp. 1–6. [Google Scholar]


© 2020 by the authors. Licensee MDPI, Basel, Switzerland. This article is an open access article distributed under the terms and conditions of the Creative Commons Attribution (CC BY) license (http://creativecommons.org/licenses/by/4.0/).