Abstract
Oil-based drilling fluid has many advantages, such as stable performance, strong anti-pollution ability, and strong inhibition, and it has been widely used in the world. However, at present, there is no unified evaluation standard for the effect of flushing fluid under this condition, and most of them are based on the flushing effect evaluation of water-based drilling fluid. However, there are few studies on wetting reversal phenomenon, reasonable dosage, and flushing time between oil-based drilling fluid and flushing fluid on the two-phase interface. Therefore, it is necessary to establish a comprehensive evaluation method for the effect of flushing fluid under oil-based drilling fluid, and explore the relationship between the amount of flushing fluid and flushing efficiency, so as to determine the reasonable range of flushing fluid consumption. In this paper, using the existing experimental instruments, a type A oil-based flushing fluid commonly used in oil fields was selected for the experiment, and on the basis of the high-temperature and high-pressure filtration meter, a flushing fluid evaluation device was developed. Based on the principle of equal shear rate, the flushing displacement and flushing time were determined, and then the flushing effect was evaluated. In order to comprehensively consider the influencing factors of the well wall flushing effect, five experimental factors, including different core, flushing displacement, flushing time, flushing fluid type, and surfactant concentration, were selected to formulate the flushing experiment scheme. The contrast method was used to test the cementation strength of core and cement slurry under different conditions, and the microscopic morphology of the interface was observed and analyzed to explore the reasons for the change of cementation strength between core and cement slurry due to the existence of oil-based drilling fluid. The conclusion obtained has very important practical significance to guide the field practice.
1. Introduction
With the deepening of exploration and development to deep oil and gas reservoirs and unconventional oil and gas reservoirs, the number of complex deep wells and shale gas wells is increasing year by year, and the requirements for drilling fluid performance are higher and higher [1,2]. Among them, oil-based drilling fluid has obvious advantages in drilling complex wells, especially in drilling high-temperature deep wells and water-sensitive formations due to its excellent inhibition and temperature resistance, which can more effectively protect water sensitive oil and gas reservoirs and improve oil and gas production [3,4]. As early as the 1960s, scholars attached great importance to oil-based drilling fluids [5]. In the 1970s, a series of high-temperature oil-based drilling fluids were developed and successfully applied to meet the needs of deep and ultra-deep drilling [6]. In the Hunt Energy cerfranch1–9 well in Texas, the oil-based drilling fluid was successfully used to drill to 9046 m [7]. Since then, oil-based drilling fluid has developed rapidly, and has gradually become an important means for drilling high-temperature deep wells, offshore drilling, high angle directional wells, horizontal wells, various complex well sections, and reservoir protection [8,9]. Oil-based drilling fluid has many advantages, such as strong anti-pollution ability, strong inhibition, stable performance, and adapting to complex formation such as high temperature and high pressure, but it also brings challenges for later operation. In the cementing stage, it is required to ensure good cementing quality of the first and second interfaces to achieve the ideal cementing quality, while the existence of oil-based drilling fluid will greatly affect the bonding strength between the wall and the cement slurry, and even will not be cemented [10,11]. Therefore, it is necessary to clean the oil-based drilling fluid on the well wall before injecting the mud, and change the wettability of the wall from oil wet to water wet [12,13,14,15], which is an important prerequisite to ensure the cementing quality, and this is also the problem of oil-based mud prepositive fluid to be solved emphatically. However, how to determine the flushing effect of the preflush on the borehole wall and the wettability of the wall after flushing before mud injection is a subject under study [16,17,18].
Flushing fluid is a part of cementing fluid, mainly composed of clean water, composite surfactant, regulator, etc. [19,20]. At present, surfactant chemical flushing fluid is widely used. The surface activity of surfactant, such as wetting, emulsification, permeability, and dispersion, is used to clean and wet the well wall and casing wall, so as to ensure the surface well quality by reducing the interfacial tension of the second cementing interface [21,22,23,24,25]. The principle of flushing fluid is to add a variety of polymers into the cementing flushing isolation fluid. According to its adsorption principle, the flushing tension of the cementing flushing isolation fluid in the flushing process is improved, so as to improve the flushing efficiency of the cementing isolation fluid, and the polymer can fully improve the cementing quality of the interface between the casing wall and the well wall. Cementitious materials have strong cementation ability, including liquid silicate and bicarbonate, which can enhance the cementing quality and improve the cementing quality of the first and second interfaces. Moreover, the water-soluble polymer, silica, and other materials have strong adsorption capacity and adhere to the surface layer of the rock through chemical adsorption, so that the cementing quality of the well wall and cement sheath is effectively enhanced [26,27,28]. In view of the existing problems, based on the principle of equal wall shear rate, a new type of isolation fluid flushing effect evaluation device was developed based on the existing high-temperature and high-pressure filtration instrument in the laboratory. The device can meet the following three requirements: (1) it can form relatively dense mud cake on the surface of the test sample with large pressure difference; (2) considering the high-temperature washing conditions in the well, it can carry out repeated tests with less workload; and (3) it can consider the influence of various factors, including formation type, flushing time, flushing displacement, and flushing fluid concentration. Finally, on the basis of the existing displacement efficiency calculation model, combined with downhole flushing time, flushing displacement, and temperature, a new displacement efficiency calculation model is established, and the optimal flushing time and displacement are obtained, and the flushing fluid consumption is finally determined.
2. Experimental Instruments and Evaluation Methods
2.1. Flushing Experiment
2.1.1. Experimental Method and Mathematical Model
The flushing effect evaluation of this project is based on the principle of equal shear rate [29,30,31,32]—that is, the shear rate is obtained according to the borehole size, operation parameters, and wellbore fluid performance that have been cemented on site. Then, using the shear rate, combined with the size of the self-developed experimental device and the fluid performance measured in the laboratory, the displacement required for this experiment can be obtained.
As shown in Figure 1, for the annulus with inner and outer radius distributions of R1 and R2, the r coordinate is established along the radial direction with the center line of the annular space as the origin. At the place away from the entrance and exit, the strip flow element with thickness of 2r, length of L, and width of π(R1+R2) is taken. Considering the steady flow of cement slurry, the momentum of flow microelement is conserved. The external force acting on it—that is, the resultant force of pressure at both ends π(R1+R2)2rΔP, whose direction is the same as the flow direction, is the driving force—that is, the flow resistance caused by shear stress τ on the upper and lower sides of the element 2Lτπ(R1+R2). The momentum balance equation is obtained as follows:
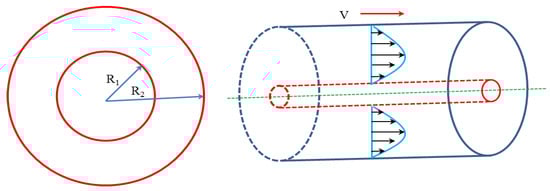
Figure 1.
Velocity distribution of wellbore annulus.
It can be easily obtained that the shear stress is in a straight line distribution in the annular space gap. The shear stress at the pipe wall is the largest, and the shear stress at the pipe axis is the minimum τw, which is zero:
If the mathematical model of fluid rheology is power-law model and the rheological parameters are determined, the velocity distribution of fluid can be deduced according to the flow dynamic balance equation [30]:
where n’ is the fluidity index and τy is the static shear force.
The shear rate can be obtained by deriving the above equation. In addition, Chen Jialiang [33] also deduced the velocity distribution equation.
Similarly, the shear rate can also be obtained by deriving the above equation. Chen Jialiang [33] also derived the annular shear rate distribution equation.
where V is current speed.
Assuming that the annular velocity is constant, considering the balance between pressure and shear stress, the expression of shear rate at the outer wall of annulus is obtained [33].
where δ is flow core distribution and k is consistency coefficient.
Taking the construction data of a well in the oil field as an example, the density of the third spud isolation fluid is 2.42 g/cm3, n = 0.543, k = 1.398 Pa·sn, the hole diameter of the third spud in is D = 0.3112 m, and the casing size is d = 0.2445 m. The displacement is 33 L/s and the flow rate is 1.134 m/s. The shear rate is 261.26 s−1, 261.28 s−1, 261.25 s−1, and 261.26 s−1. It shows that Chen Jialiang’s equation can be used for relevant calculation [33]. The inner diameter of flushing device barrel is 0.0536 m, and the outer diameter of simulated formation screen is 0.0305 m. Based on the principle of equal shear rate, the flow rate of the fluid in the flushing cylinder is 0.367 m/s and the displacement is 0.5333 L/s.
2.1.2. Design Principle of Experimental Device
There are many methods to evaluate the flushing effect of flushing fluid, but the rotary viscometer method or improved rotary viscometer method is still the main method for indoor flushing experiment, based on the principle of equal shear rate or replacing rotating stator with core for flushing experiment.
In this paper, based on the high-temperature and high-pressure filtration instrument, the water loss device is reformed and a new flushing fluid evaluation device is developed. The flow chart of the experimental device is shown in Figure 2.
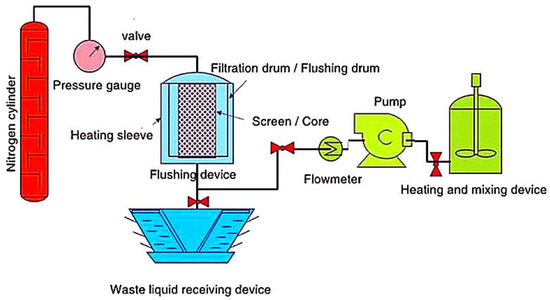
Figure 2.
Design flow chart of flushing device.
As shown in Figure 3, the instrument consists of two parts: mud cake forming device (Figure 3a–c,g) and flushing device (Figure 3d–f,h).
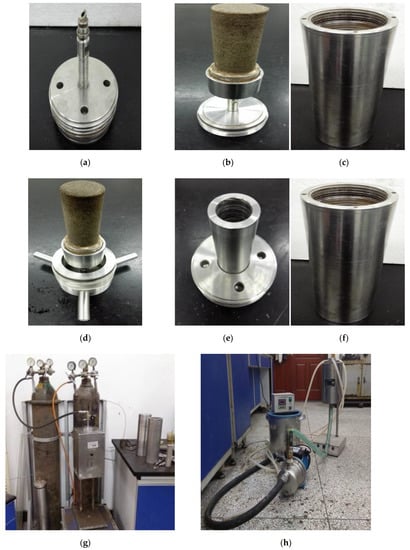
Figure 3.
Physical diagram of mud cake forming device and flushing device. mud cake forming device: (a) is device cover, (b) is device lower cover, (c) is device outer, (g) is high-temperature and high-pressure filter; flushing device: (d) is device cover, (e) is device lower cover, (f) is device outer, (h) is physical drawing of flushing device.
Operation steps of flushing experiment:
(1) Install the core on the mud cake forming device and pour oil-based drilling fluid as shown in Figure 3g. Fix the core on the base of the dehydration device, connect the nitrogen cylinder, and open the air inlet switch;
(2) Open the valve of the nitrogen cylinder, adjust the pressure value to 5 MPa, open the bottom switch, and stand for 30 min;
(3) After 30 min, close the lower and upper air inlet switches and close the nitrogen valve; remove the mud cake forming device and remove the core and weigh it as W1;
(4) Prepare a certain flushing fluid, pour it into the heating cylinder, heat it to 80 °C, and then put the core into the inner barrel of the flushing device. As shown in the Figure, the flushing device is placed on the dehydration base, the lower end is the liquid inlet and connected with the pump, and the upper end is the liquid outlet, which is connected to the heated flushing liquid cylinder through three pipes, and the pump is started to flush at a certain displacement;
(5) After washing for a period of time, stop the pump, remove the core, and weigh it as W2;
(6) Clean the rock sample in step (5) and weigh it as W3;
(7) Calculate the flushing efficiency of flushing fluid as follows:
2.2. Test on Determination of Interfacial Bond Strength
2.2.1. Experimental Sample
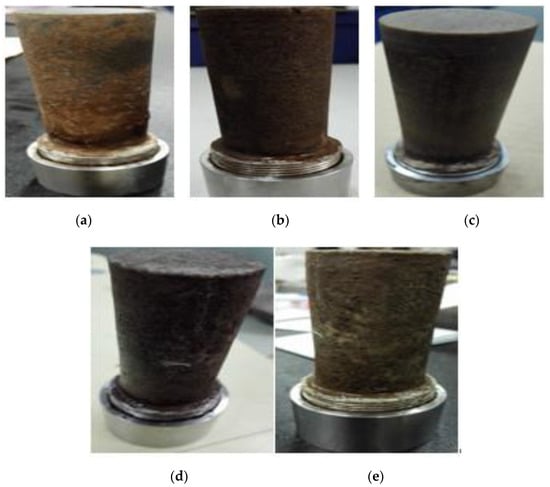
Five pairs of samples (as shown in Figure 4) are selected for flushing experiment. They are field sandstone (Figure 4a), ultra-low permeability core (0.01 mD) (Figure 4b), low permeability core (0.15 mD) (Figure 4c), medium permeability core A (10 mD) (Figure 4d), and medium permeability core B (150 mD) (Figure 4e). The morphology of some rock samples after washing is shown in Figure 5.
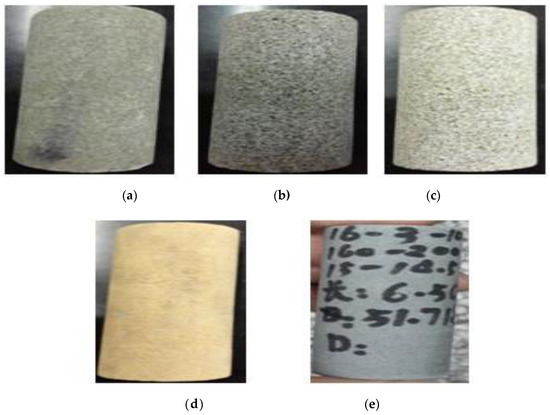
Figure 4.
Morphology of experimental core sample. (a) is field sandstone, (b) is ultra-low permeability core, (c) is low permeability core, (d) is medium permeability core A, (e) is medium permeability core B.
2.2.2. Experimental Methods
In this paper, the test methods of interfacial bonding strength are as follows: take out the core which has been washed out from the flushing device and place the core in the middle of the steel sleeve; according to the requirements, prepare the cement slurry, lead the prepared cement slurry into the annular space formed by the steel sleeve and the core, put it into the constant temperature water bath for curing, take it out after the curing time, and cool it to room temperature. A certain pressure is slowly applied to the upper end face of the core by the digital bending and compression testing machine, and then the artificial core is slowly pressed out from the cement sheath. When the interface between the artificial core and the cement stone falls off, the value displayed by the instrument is the size of the shear force. The bond strength of the interface is calculated as shown in Equation (8).
where σ is the interfacial bond strength, N/m3; F is the interfacial shear stress, Pa; S is the core side area, m2; r is the core radius, m; and h is the core height, m.
3. Discussion on Test Results
3.1. Evaluation of Flushing Experiment
According to the existing cementing literature reports [2,14], the main factors affecting the cementing displacement efficiency are displacement, displacement time, formation core properties, and flushing fluid system. Therefore, based on the investigation results and combined with the field cementing data, the type A flushing fluid system was selected to evaluate the flushing experiment of this project (A is a kind of flushing fluid equation for flushing evaluation).
As shown in Table 1 above, the type A flushing fluid system was selected for the experiment. Different flushing time, displacement, concentration of flushing fluid, and core type were used for flushing experiment, and the core flushing efficiency was calculated. As shown in Figure 6, the selected cores are 0.1 mD core (Φ 2.54 cm × 4.7 cm) (Figure 6a), 10 mD core (Φ 2.54 cm × 8.4 cm) (Figure 6b), and 150 mD core (Φ 2.54 cm × 4.7 cm) (Figure 6c).

Table 1.
Design of flushing experiment scheme.
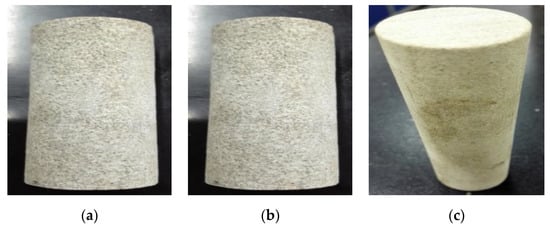
Figure 6.
Washing test sample diagram (a) is ultra-low permeability core 0.1 mD, (b) is medium permeability core A 10 mD, (c) is medium permeability core B 150 mD.
Evaluation of Flushing Effect of Type a Flushing Fluid
- (1)
- The concentration of flushing solution is 10%
Using the above flushing fluid evaluation device, sandstone cores with permeability of 0.1 mD, 10 mD, and 150 mD are flushed with type a flushing fluid with concentration of 10% under different displacement and time conditions. The flushing efficiency under different conditions can be calculated by Equation (7), as shown in Table 2 below.
Table 2.
Results of flushing efficiency under different flushing displacement and time.
According to the flushing time and displacement in Table 1, the amount of flushing fluid can be obtained, and the relationship between the amount of flushing fluid and the flushing efficiency can be obtained, as shown in Figure 7.
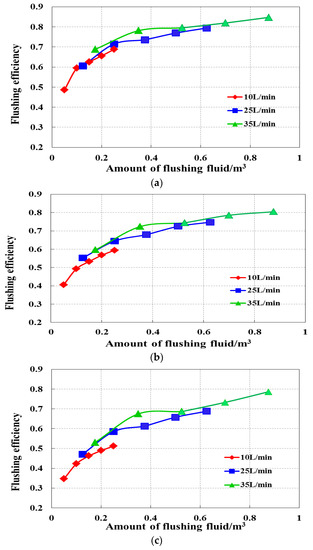
Figure 7.
Variation of flushing fluid consumption and flushing efficiency of different cores under the condition of 10% flushing concentration (a) is ultra-low permeability core 0.1 mD, (b) is medium permeability core A 10 mD, (c) is medium permeability core B 150 mD.
Figure 7 shows the relationship between the amount of flushing fluid and the flushing efficiency of cores with different permeability when the concentration of type A flushing fluid is 10%. It can be seen from the Figure that with the increase of permeability, the flushing efficiency gradually decreases under the conditions of 10 L/min, 25 L/min, and 35 L/min. When the core permeability is 0.1 mD, the flushing efficiency can reach 90% when the amount of flushing fluid reaches 0.9 m3 (Figure 7a), which means that it can be washed clean. However, for cores with high permeability of 10 mD or even 150 mD, a greater amount of flushing fluid is needed to clean the cores (Figure 7b,c).
According to the data in Table 2, the relationship between flushing time and flushing efficiency under different cores can be obtained, as shown in Figure 8.
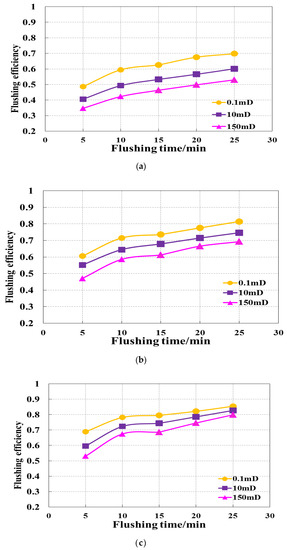
Figure 8.
Variation of flushing time and flushing efficiency of different cores under the condition of 10% flushing concentration. (a) is flushing displacement 10 L/min, (b) is flushing displacement 25 L/min, (c) is flushing displacement 35 L/min.
Figure 8 shows the evaluation of flushing results of different cores at the same discharge rate under the condition of 10% A-type flushing fluid concentration. It can be seen from the Figure that under the same displacement, for cores with different permeability, the flushing effect becomes worse with the increase of permeability. Under the condition of osmotic pressure, the core with high permeability forms thick and dense mud cake on the core surface, while the core with low permeability forms thin mud cake on the core surface. In addition, the flushing effect under the condition of 35 L/min (Figure 8c) is obviously better than that of 25 L/min (Figure 8b) and 10 L/min (Figure 8a). When the core permeability is 0.1 mD and 10 mD and the flushing time is about 25 min, the flushing efficiency is 90%.
- (2)
- The concentration of flushing solution is 20%
Using the above flushing fluid evaluation device, sandstone cores with permeability of 0.1 mD, 10 mD, and 150 mD are flushed with type a flushing fluid with concentration of 20% under different displacement and time conditions. The flushing efficiency under different conditions can be calculated by Equation (7), as shown in Table 3 below.
Table 3.
Flushing efficiency results under different flushing displacement and time.
According to the flushing time and displacement in Table 3, the amount of flushing fluid can be obtained, and the relationship between the amount of flushing fluid and the flushing efficiency can be obtained, as shown in Figure 9.
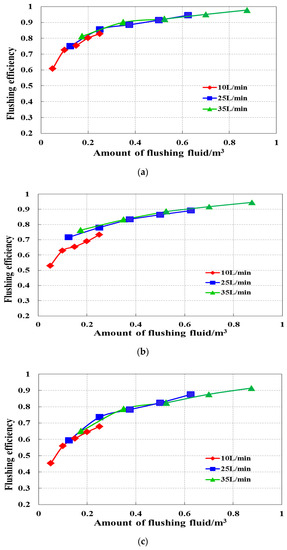
Figure 9.
Variation of flushing fluid consumption and flushing efficiency of different cores under the condition of 20% flushing concentration. (a) is ultra-low permeability core 0.1 mD, (b) is medium permeability core A 10 mD, (c) is medium permeability core B 150 mD.
Figure 9 shows the relationship between the amount of flushing fluid and flushing effect under different core conditions when the concentration of flushing fluid is 20%. It can be seen from the Figure that when the core permeability is 0.1 mD, 10 mD, and 150 mD, the flushing efficiency is 90% when the flushing fluid dosage is 0.38 m3 (Figure 9a), 0.5 m3 (Figure 9b), and 0.78 m3 (Figure 9c), respectively. Good flushing effect can be obtained, and the flushing effect is better than that of the washing fluid with concentration of 10%.
Figure 10 shows the relationship between flushing time and flushing effect when the concentration of type A flushing solution is 20%. It can be seen from the Figure that, under the same displacement, with the increase of core permeability, the worse the flushing efficiency. When the displacement of flushing fluid is 10 L/min, the flushing efficiency of the three types of cores does not reach 90% (Figure 10a); when the displacement of flushing fluid is 25 L/min, the flushing efficiency of 0.1 mD, 10 mD, and 150 mD cores reaches 90% under the conditions of 15 min, 20 min, and 25 min, respectively (Figure 10b); when the displacement of flushing fluid is 35 L/min, the flushing efficiency of 0.1 mD, 10 mD, and 150 mD cores reaches to 90% under the condition of flushing for 10 min, 15 min, and 20 min, respectively, to 90% (Figure 10c). Therefore, for different cores, increasing the displacement of flushing fluid can appropriately increase the flushing effect.
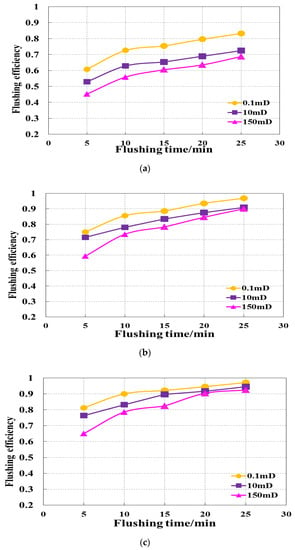
Figure 10.
Variation of flushing time and flushing efficiency of different cores under the condition of 20% flushing concentration. (a) is flushing displacement 10 L/min, (b) is flushing displacement 25 L/min, (c) is flushing displacement 35 L/min.
- (3)
- The concentration of flushing solution is 30%
Using the above flushing fluid evaluation device, sandstone cores with permeability of 0.1 mD, 10 mD, and 150 mD are respectively flushed with type A flushing fluid with concentration of 30% under different displacement and time conditions. The flushing efficiency under different conditions can be calculated by Equation (7), as shown in Table 4.
Table 4.
Results of flushing efficiency under different flushing displacement and time.
According to the flushing time and displacement in Table 4, the amount of flushing fluid can be obtained, and the relationship between the amount of flushing fluid and the flushing efficiency can be obtained, as shown in Figure 11.
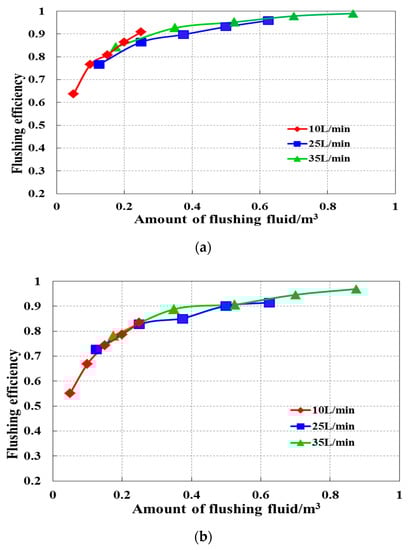
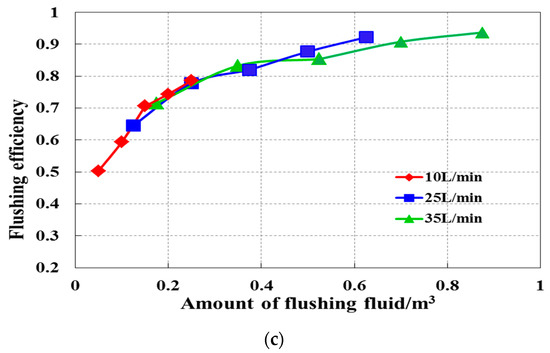
Figure 11.
The relationship between the amount of flushing fluid and flushing efficiency under the condition of 30% flushing fluid concentration. (a) is ultra-low permeability core 0.1 mD, (b) is medium permeability core A 10 mD, (c)is medium permeability core B 150 mD.
It can be seen from Figure 11 that when the core permeability is 0.1 mD, 10 mD, and 150 mD, the flushing efficiency is 90% when the flushing fluid consumption is 0.2 m3 (Figure 11a), 0.36 m3 (Figure 11b), and 0.6 m3 (Figure 11c), respectively. The flushing effect is better than that of 20% solution.
According to the data in Table 4 above, the relationship between flushing time and flushing efficiency under different cores can be obtained, as shown in Figure 12.
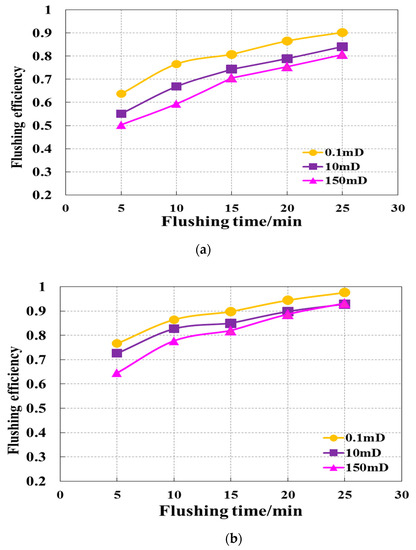
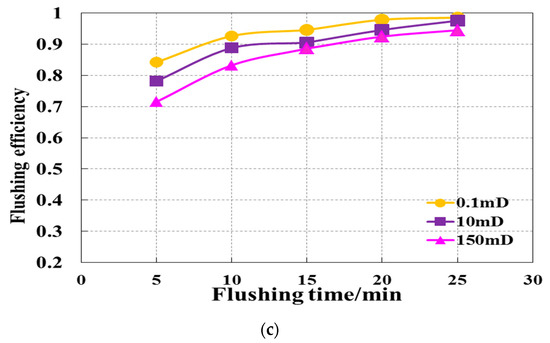
Figure 12.
Change chart of flushing time and flushing efficiency of different cores with 30% flushing concentration. (a) is flushing displacement 10 L/min, (b) is flushing displacement 25 L/min, (c) is flushing displacement 35 L/min.
It can be seen from the Figure 12 that, under the same displacement, with the increase of core permeability, the worse the flushing efficiency. When the displacement of flushing fluid is 10 L/min, the permeability is 0.1 mD and 10 mD, and the flushing time is 25 min, the flushing efficiency reaches 90% (Figure 12a); when the displacement of flushing fluid is 25 L/min, the flushing efficiency of 0.1 mD flushing time is 15 min, and 10 mD and 150 mD core flushing time is 20 min, the flushing efficiency reaches 90% (Figure 12b); when the displacement of flushing fluid is 35 L/min, the flushing efficiency of 0.1 mD and 10 mD flushing time is 10 min, and 150 mD core is 15 min, the flushing efficiency is 90% (Figure 12c). When the concentration of flushing fluid is 30%, good results can be achieved for cores with different permeability under certain flushing time.
3.2. Bond Strength Test Results
The compressive testing machine is used to load test the curing test sample. The following sample Figure 13(1–5) are as follows: in situ sandstone, ultra-low permeability core (0.1 mD), low permeability core (0.15 mD), medium permeability core A (10 mD), and medium permeability core B (150 mD)) to determine the interfacial bonding strength. The following Figure 14 shows the sample diagram of clean core and washed core after curing in 80°C water bath box for 48 h.
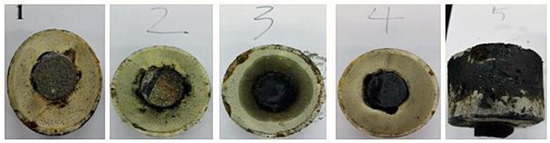
Figure 13.
Maintenance figure of blank core sample (48 h × 80 °C).
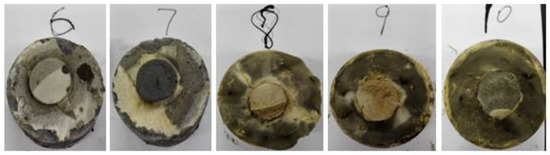
Figure 14.
Maintenance figure of core sample after flushing (48 h × 80 °C).
Table 5 shows the comparison test data of the interface cementation strength between clean core and core after flushing. It can be seen from the Table that although the interfacial bonding strength of clean core is not high, the interfacial bonding strength of clean core is higher than that of washed core; and the greater the permeability of core, the smaller the interfacial bonding strength of core. The main reason is that during the setting process of cement slurry, the water of cement slurry continuously permeates into the rock core under the condition of osmotic pressure. Under the condition of the same osmotic pressure, the greater the permeability of the core, the greater the water infiltration into the core. The infiltration of water has a certain hydration effect on the core, which reduces the strength of the interface with cement slurry and the bonding strength of the interface. In addition, from the ultra-low permeability core to the medium permeability core, the solid particles in the drilling fluid will be continuously compacted on the rock surface in the process of mud cake formation under the condition of pressure difference, so the core with larger porosity and permeability will have greater thickness of mud cake attached to its surface, which will lead to it becoming more difficult to wash in the washing process. Therefore, the permeability of rock is an important factor affecting the second interface cementing—that is, the lower the permeability, the greater the cementing strength; and the greater the permeability, the smaller the cementing strength.
Table 5.
Cementing strength of lower interface of oil-based drilling fluid.
3.3. Micro-Morphology Analysis of Interface Cementation
The microscopic morphology of the interface between core and cement paste was analyzed by depth stereomicroscope under different conditions. It can be more intuitive to observe the cementation of the interface between core and cement stone and provide certain guidance for further analysis of the interface bonding. One of the instruments used in this experiment is the depth stereomicroscope: select a certain core and cement paste cementation sample and core, and observe the sample with depth stereomicroscope, as shown in Figure 15.
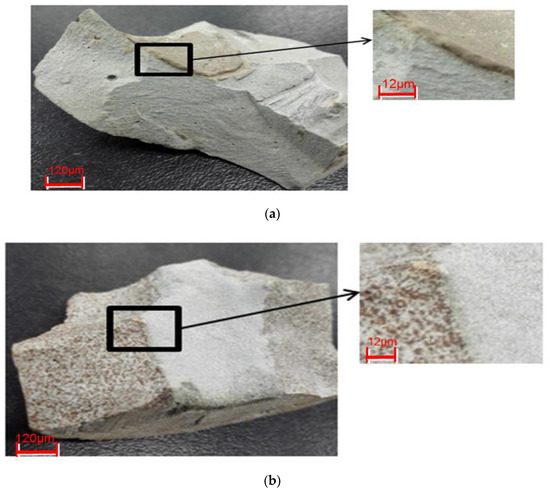
Figure 15.
Microscopic morphology of interface between core and cement stone under different conditions. (a) is schematic diagram of observation position of adhering drilling fluid core and cement stone sample, (b) is schematic diagram of observation position of blank core and cement stone sample.
From the macroscopic observation in Figure 15, it can be seen from the macroscopic observation that during the cementation process, the cement stone is cemented with the mud cake on the core surface, which makes the mud cake adhere to the cement stone (Figure 15a); when the clean core is cemented with the cement stone, the cement stone and the core are directly cemented (Figure 15b). Therefore, the bond strength between the undrained core and the cement stone is lower than that between the clean core and the cement stone.
In view of the interface cementation under the above two conditions, the micro-morphology under the two conditions was analyzed with the help of depth stereomicroscope, as shown in Figure 16.
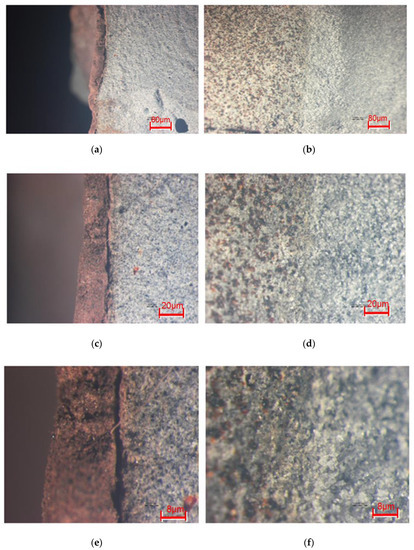
Figure 16.
Microscopic cementation figure of cement stone with undrained core and clean core. (a,c,e) are adhesion of drilling fluid core to cement stone; (b,d,f) are clean core to cement stone
It can be seen from the micrograph in Figure 16 that when the mud cake attached to the core is cured with the cement slurry at a certain pressure and temperature, the cement slurry gradually coagulates during the curing process, and the mud cake contacting with the cement slurry also gradually solidifies; then, during the condensation process of the two substances, their volume will shrink, and the cement slurry will be cured (Figure 16a,c,e). The formation of fractures makes the cementation interface difficult to bear the effect of certain shear stress, which makes the interface cementation strength less when mud cake is attached to the core surface and cement slurry. In addition, when cementation occurs between the core and the cement slurry, firstly, because the core surface has a certain roughness, the cement slurry is closely attached to the surface of the rock sample. Although the volume shrinkage of the cement slurry will occur during the setting process, the volume shrinkage spacing is smaller than the roughness of the core surface, so that the two can be connected together, as shown in the right of the above Figure. Therefore, the clean core and cement paste are closely cemented, and the interface cementation strength is high (Figure 16b,d,f), while it is easy for the cementation interface between the clean core and the cement stone to form cracks in the cementation process, which leads to the decrease of the interface bonding strength.
4. Conclusions
In this paper, based on the high-temperature and high-pressure filtration instrument, a flushing fluid evaluation device is developed. Based on the principle of equal shear rate, the flushing displacement and flushing time are determined, and then the flushing effect is evaluated. In order to comprehensively consider the influencing factors of well wall flushing effect, five experimental factors, including different core, flushing displacement, flushing time, flushing fluid type, and surfactant concentration, are selected to formulate the flushing experiment scheme. The results show that:
1. The measured results of washing efficiency of the three groups of rock samples show that the improved new flushing effect evaluation device can meet the following three requirements: (1) it can form relatively dense mud cake on the surface of the experimental sample with large pressure difference; (2) considering the high-temperature washing conditions in the well, it can carry out repeated tests with less workload; and (3) it can consider the influence of various factors, including formation type, flushing time, flushing displacement, and flushing fluid concentration.
2. The measured results of flushing efficiency of three groups of rock samples show that: under the same flushing experimental conditions, the higher the core permeability, the denser the mud cake formation, the lower the flushing efficiency, the larger the flushing fluid displacement, and the longer the flushing time, the better the flushing effect. The increase of flushing displacement, the greater change of flushing efficiency—that is, the flushing displacement is the main factor affecting the flushing effect. Based on the results of flushing experiment, it is recommended to select the flushing displacement of 35 L/min; according to the principle of equal shear rate, the optimal flushing displacement is 36 L/s, and the optimal flushing time is 10 min, which is the most suitable.
3. Five groups of rock samples were used to determine the bond strength of different cores and cement paste. The results show that through the microscopic analysis of the interface between core and cement stone under different conditions, the volume shrinkage of cement slurry and drilling fluid results in fracture, which leads to poor interface cementation. However, the surface roughness of core is larger than the shrinkage volume spacing of cement slurry, which makes the interface cementation worse together, and the cementation strength is high. The cementation strength decreases with the increase of core permeability, which further indicates that the higher the core permeability, the more difficult it is to be washed clean.
Author Contributions
Investigation, X.L.; project administration, Y.X.; supervision, Y.X., B.W., Z.L., and Z.Z.; writing—review and editing, J.W. All authors have read and agreed to the published version of the manuscript.
Funding
This research was funded as a part of the Major Projects number 2019F-33 with support from China National Petroleum Corporation.
Acknowledgments
The author would like to thank the teachers and students in the School of Petroleum and Natural Gas Engineering of Southwest Petroleum University for their guidance and help in cooperation with PetroChina and Southwest Petroleum University, and for the work support of the leaders and colleagues of Xinjiang Oilfield Engineering Technology Research Institute.
Conflicts of Interest
The authors declare no conflict of interest.
References
- Paswan, B.K.; Mahto, V. Development of environment-friendly oil-in-water emulsion based drilling fluid for shale gas formation using sunflower oil. J. Pet. Sci. Eng. 2020, 107129. [Google Scholar] [CrossRef]
- Ariyanti, P.; Najwani, M.A.; Najwani, Y. Achieving Cementing Improvement in Horizontal Tight Gas Field Development. SPE 2015, 172937. [Google Scholar] [CrossRef]
- Atahan, H.N.; Carlos, C., Jr.; Chae, S. The morphology of entrained air voids in hardened cement paste generated with different anionic surfactants. Cem. Concr. Compos. 2008, 30, 566–575. [Google Scholar] [CrossRef]
- Katende, A.; Lu, Y.; Bunger, A.; Radonjic, M. Experimental Quantification Of The Effect Of Oil Based Drilling Fluid Contamination On Properties Of Wellbore Cement. J. Nat. Gas Sci. Eng. 2020, 79, 103328. [Google Scholar] [CrossRef]
- Pelipenko, S.; Frigaard, I.A. Mud removal and cement placement during primary cementing of an oil well. J. Eng. Math. 2004, 48, 1–16. [Google Scholar] [CrossRef]
- Salehi, R.; Mirzaei, P.A. A novel cement slurry designapplicable to horizontal well conditions. Pet. Coal 2009, 51, 270–276. [Google Scholar]
- Ooms, G.; Kampman-Reinhartz, B.E. Influence of Drillpipe Rotation and Eccentricity on Pressure Drop over Borehole with Newtonian Liquid during Drilling. SPE Drill. Completion 2000, 15, 249–253. [Google Scholar] [CrossRef]
- Ahmad, H.M.; Kamal, M.S.; Al-Harthi, M.A. High molecular weight copolymers as rheology modifer and fluid loss additive for water-based drilling fluids. J. Mol. Liq. 2018, 252, 133–143. [Google Scholar] [CrossRef]
- Gu, J.; Zhong, P.; Shao, C.; Bai, S.; Zhang, H.; Li, K. Effect of interface defects on shear strength and fluid channeling at cement–interlayer interface. J. Pet. Sci. Eng. 2012, 100, 117–122. [Google Scholar] [CrossRef]
- Gu, J.; Huang, J.; Hao, H. Influence of mud cake solidification agents on thickening time of oil well cement and its solution. Constr. Build. Mater. 2017, 153, 327–336. [Google Scholar] [CrossRef]
- Aughenbaugh, K.; Nair, S.D.; Cowan, K.; van Oort, E. Contamination of Deepwater Well Cementations by Synthetic-Based Drilling Fluids. SPE 2014, 170325. [Google Scholar] [CrossRef]
- Soares, L.W.O.; Braga, R.M.; Freitas, J.C.O.; Ventura, R.A.; Pereira, D.S.S.; Melo, D.M.A. The effect of rice husk ash as pozzolan in addition to cement Portland class G for oil well cementing. J. Pet. Sci. Eng. 2015, 131, 80–85. [Google Scholar] [CrossRef]
- Li, M.; Ou, H.; Li, Z.; Gu, T.; Liu, H.; Guo, X. Contamination of cement slurries with diesel-based drilling fluids in a shale gas well. J. Nat. Gas Sci. Eng. 2015, 27, 1312–1320. [Google Scholar] [CrossRef]
- He, S.; Wang, W.; Tang, M.; Hu, B.; Xue, W. Effects of fluid seepage on wellbore stability of horizontal wells drilled underbalanced. J. Nat. Gas Sci. Eng. 2014, 21, 338–347. [Google Scholar] [CrossRef]
- Ladva, H.K.J.; Craster, B.; Jones, T.G.J.; Goldsmith, G.; Scott, D. The Cement-to-Formation Interface in Zonal Isolation. SPE 2005, 20, 186–197. [Google Scholar] [CrossRef]
- Plank, J.; Tiemeyer, C.; Buelichen, D.; Echt, T. A Study of Cement/Mudcake/Formation Interfaces and Their Impact on the Sealing Quality of Oilwell Cement. In Proceedings of the IADC/SPE Asia Pacific Drilling Technology Conference, Bangkok, Thailand, 25–27 August 2014. [Google Scholar] [CrossRef]
- Baldino, S.; Osgouei, R.E.; Ozbayoglu, E.; Miska, S.Z.; May, R. Quemada model approach to oil or synthetic oil based drilling fluids rheological modelling. J. Pet. Sci. Eng. 2018, 163, 27–36. [Google Scholar] [CrossRef]
- Opedal, N.; Todorovic, J.; Torsaeter, M.; Vralstad, T.; Mushtaq, W. Experimental Study on the Cement-Formation Bonding. In Proceedings of the SPE International Symposium and Exhibition on Formation Damage Control, Lafayette, LA, USA, 26–28 February 2014. [Google Scholar] [CrossRef]
- Hao, H.Y.; Gu, J.; Huang, J.; Wang, Z.W.; Wang, Q.G.; Zou, Y.K. Comparative study on cementation of cement-mudcake interface with and without mud-cake solidification-agents application in oil & gas wells. J. Pet. Sci. Eng. 2016, 147, 143–153. [Google Scholar]
- Jha, P.K.; Mahto, V.; Saxena, V.K. Study the rheological and fltration properties of oil-in-water emulsion for its application in oil and gas well drilling. J. Pet. Eng. Technol. 2013, 25–30. [Google Scholar] [CrossRef]
- Jha, P.K.; Mahto, V.; Saxena, V.K. Emulison based drilling fluids: An overview. Int. J. Chem. Res. 2014, 6, 2306–2315. [Google Scholar]
- Jha, P.K.; Mahto, V.; Saxena, V.K. Developement of emulsion based drilling fluid System for fractured reservoirs. Int. J. Chem. Res. 2016, 6, 146–152. [Google Scholar]
- Kania, D.; Yunus, R.; Omar, R.; Abdul Rashid, S.; Mohamed Jan, B.; Arsanjani, N. Nonionic polyol esters as thinner and lubricity enhancer for synthetic-based drilling fluids. J. Mol. Liq. 2018, 266, 846–855. [Google Scholar] [CrossRef]
- Abduo, M.I.; Dahab, A.S.; Abuseda, H.; AbdulAziz, A.M.; Elhossieny, M.S. Comparative study of using Water-Based mud containing Multiwall Carbon Nanotubes versus Oil-Based mud in HPHT felds. Egypt J. Pet. 2016, 25, 459–464. [Google Scholar] [CrossRef]
- Shariar, A.; Nedhdi, M. Rheological properties of oil well cement slurries. Constr. Mater. 2012, 165, 25–44. [Google Scholar] [CrossRef]
- Li, J.; Walker, S. Sensitivity Analysis of Hole Cleaning Parameters in Directional Wells. SPE 1999, 6, 54498. [Google Scholar]
- Avila, R.; Pereira, E.; Miska, S.; Takach, N.; Saasen, A. Correlations and Analysis of Cuttings Transport with Aerated Fluids in Deviated Wells. SPE 2004, 23, 87180. [Google Scholar]
- Malloy, K.; Medley, G.; Stone, R. Air Drilling in the Presence of Hydrocarbons: A Time for Pause. SPE 2007, 108357. [Google Scholar] [CrossRef]
- Lu, S.; Foxenberg, W.E. Double-Emulsion Spacer Design for Highly Efficient Invert Emulsion Displacement. SPE 2012, 151604. [Google Scholar] [CrossRef]
- Darring, M.; Foxenberg, W.E.; Niehaus, R.B.; Stein, T.; Miller, D.M. Cased-Hole Cleaning: Do Annular Velocity, Annular Coverage, and Contact Time Equal Mud Removal? SPE 2007, 110589. [Google Scholar] [CrossRef]
- Maserati, G.; Daturi, E.; Del Gaudio, L.; Belloni, A.; Bolzoni, S.; Lazzari, W.; Leo, G. Nano-emulsions as Cement Spacer Improve the Cleaning of Casing Bore during Cementing Operations. SPE 2010, 133033. [Google Scholar] [CrossRef]
- Aranha, P.E.; Miranda, C.; Cardoso, W.; Campos, G.; Martins, A.; Gomes, F.C.; Carvalho, M. A Comprehensive Theoretical and Experimental Study on Fluid Displacement for Oilwell-Cementing Operations. SPE 2012, 27, 150276. [Google Scholar]
- Chen, J. Conduit flow formula of drilling mud set. J. Daqing Pet. Inst. China 1981, 14, 99–111. [Google Scholar]
© 2020 by the authors. Licensee MDPI, Basel, Switzerland. This article is an open access article distributed under the terms and conditions of the Creative Commons Attribution (CC BY) license (http://creativecommons.org/licenses/by/4.0/).