1. Introduction
Technologies to obtain renewable energy are increasingly contributing to the world’s energy portfolio. The growth on this share has become a priority in the energy policy agenda of the European Union (EU) [
1]. These policies mainly address two overall objectives: reduce greenhouse gas emissions (GHG) to meet the targets established at the Paris Conference of Parties 21 (CoP21), and decrease dependence on fossil fuels in EU member countries (EU27) [
2]. The European Commission (EC) revealed in their renewable energy progress report (April 2019) [
3] that 17.5% of the EU’s gross final energy consumption came from renewable sources in 2017. Based on current growth trends, the EU will over-achieve the overall Member States National Renewable Energy Action Plans (NREAPs) objectives in 2020.
The Directive 2009/28/EC [
4] on the promotion of the use of energy from renewable sources (RED I) has been a key driver for meeting energy targets by 2020. With the entry into force of the Directive (EU) 2018/2001 on the promotion of the use of energy from renewable sources (RED II) [
5], an extended framework has been established towards the target of at least 32% renewable energy in the gross final EU energy consumption by 2030.
Distribution of the renewable gross final energy consumption in EU28 from the last consolidated data (2017) saw bioenergy as the main contributor [
6]: 58.6% bioenergy (biomass, biofuels, biogas and renewable municipal waste), 14.7% hydrothermal, 14.6% wind, 6.2% solar, 5.1% ambient heat (heat pumps), 0.7% geothermal and 0.02% tide, wave and ocean. The final usage of this energy among sectors (summarised in
Figure 1) reveals that more efforts are needed to deploy further fossil fuels, especially in the heating and transport sectors. Bioenergy also aligns with the climate neutral energy system: it allowed for the saving of around 7% of the EU28 GHG emissions (303 Megatonne of equivalent CO
2, MtCO
2eq), which represents around the total annual emissions of Spain [
5]. However, bioenergy is currently more relevant in the heating and transport sector, contributing less substantially to the electricity production.
Italy produces almost 10% of EU electricity, less only than Germany and France (and, formerly, the UK). Its use of renewable sources is currently higher than the EU average (40.2% against 32.9% in 2018). Italy consumed 323.7 TWh of electrical energy in 2018 (including 2.3 TWh that were needed to transport the energy) [
8]. Of these, 279.8 TWh were produced in Italy, while 43.9 TWh were imported from foreign countries. Italy used to be energetically independent, but since the beginning of the 1980s, the demand started exceeding the production. The difference between the two has remained roughly constant in the last twenty years. The provenience of the produced renewable energy in 2017 is summarised in
Figure 2: hydroelectric is the most exploited source of renewable energy, while biogas is the major contributor to bioenergy. In terms of installed power, Italian solid biomass plants could generate 1725 MW
el as of 2018 [
9].
With regard to heat production, in 2018 Italy generated 124 TWh from renewable sources, which was 19.2% of the total [
9]. Of these, about 112 TWh were generated in situ (i.e., through private burners, solar panels, etc.), while the remaining 12 TWh were provided through centralised systems, such as district heating (DH) grids. Solid biomass is the main contributor to the renewable thermal energy generation: it contributed for 81 TWh, mainly due to its use for domestic heating.
Biomass is a growing contributor in the bioenergy sector. The non-profit organisation BioEnergy Europe [
10] (formerly known as the European Biomass Association (AEBIOM)) released statistics in which biomass was shown to be capable of potentially covering the entire energy need (heat, cool, power and transport) of all EU28 for a period of 43 days in 2018, in contrast with the 18 days in 2000. However, fossil and nuclear energy were still, according to the same BioEnergy statistic, Europe’s primary sources of energy covering 293 days in 2018, and renewables (excluding bioenergy) covering the remainder of 29 days. The increase in the bioenergy production has been boosted by new and improved energy conversion technologies. Biomass can be converted into energy (in the form of heat, electricity, or both) through different pathways determined by the specific operating conditions that result in different decomposition reactions (see
Section 3). According to Zappa et al. [
11], large scale mobilisation of the EU’s biomass resources is a key factor to achieve a completely renewable energy system by 2050.
Biomass is also significant in Italy’s renewable energy share. The gross production of energy from biomass and waste sources steadily increased until 2016, when it reached 19.378 TWh, against a total of 10.832 TWh in 2011. These numbers have shown a constant trend in the last three years with a total produced energy of 19,235 GWh in 2018. Moreover, the volume of biofuel demanded in Italy is expected to peak in 2025 at 2.8 million tons of oil equivalent [
12], and then remain constant until 2040. Despite these positive aspects, Italy may and should enhance its bioenergy production, taking advantage of its abundance of biomass sources. On the one hand, this would notably help in decarbonising its energy sector; on the other hand, it would make the Italy less dependent on foreign countries to satisfy its energetic demand. Given the size and diversity of the Italian environment, the most adequate solutions should be identified and put into action locally, thanks to short-range biomass supply chains.
In this context, the main aim of this work is to define and analyse the current state of the art in thermochemical energy conversion technologies using solid biomass as feedstock in the Italian North-West area (i.e., regions of Liguria, Lombardy, Piedmont and Aosta Valley). North-West Italy is one of the most advanced European regions in terms of industry, commerce, tourism and transport. It is historically strongly inter-connected: the triangle formed by the cities of Milan, Turin and Genoa led the economic boom in the post-WW2 period. All four regions share a border with France or Switzerland. The four regions currently produce 30% of the Italian electrical energy [
13]. The area has wide availability of solid biomass on its territory, in the form of both forests and agricultural residues. However, as the following sections will show, the full energetic potential of solid biomass is far from being appropriately valorised. Through this review, data only available in Italian and scattered in various specific sources are gathered and shown in an international context, making them succinctly available for the scientific and industrial communities.
The work is divided into the following sections:
Section 2 describes the current availability and potentiality of biomass in the area of interest.
Section 3 summarises the thermochemical technologies for the energetic valorisation of solid biomass, including possible uses of the by-products in a circular economy framework.
Section 4 presents an overview of the energy and bioenergy situation in each studied region and describes the most representative plants, addressing the future directions in light of the Italian energy plan. As a result, a dynamic databank to identify the most representative power plants running in the cited regions has been created and it has permitted us to monitor and establish the state of development of thermochemical technologies while providing important insights to guarantee their further increase accomplishing environmental, economic and social terms.
2. Biomass Availability in North-West Italy
Biomass is defined as ‘the biodegradable fraction of products, waste and residues from agriculture (including vegetal and animal substances), forestry and related industries, as well as the biodegradable fraction of industrial and municipal waste’ [
14]. The main feedstock used for energy recovery comes from the forest sector, which is estimated to cover 70% of the overall biomass supply for energy. The area of European forests is continuously increasing, contrary to the worldwide trend. This makes European forest biomass a sustainable source. Agricultural biomass and biomass from waste represent a smaller portion and together comprise 30% of the supply [
7].
Biomass is considered a “neutral” source in terms of emissions (zero g
CO2/kWh). This is not completely true since sizing, transporting, and processing (drying, pelletising…) require relevant amounts of energy, as well as the construction and running of plants for energy exploitation. To provide quantitative information on the extent of specific GHG emissions deriving from the energy use of biomass, the RED II Directive states the values of avoided CO
2 thanks to the use of wood biomass, compared to the same amount of fossil fuel energy. According to this directive, the average percentage of emissions avoided in electricity production is 89%, which corresponds to 70 g
CO2/kWh
el (about one fifth of the emissions of natural gas). Similarly, the emissions avoided during heat production are 93%, which correspond to about 20 g
CO2/kWh
th (about a tenth compared to boilers and natural gas). More interestingly, cogeneration plants (considering an electric efficiency of 15% and thermal efficiency of 65%) decrease by 91% the total emissions with respect to the same plant fed with natural gas [
15].
As previously stated, biomass, in the form of virgin wood, industrial waste forestry and/or agriculture waste, is transformed into energy through the production of heat, electricity or both simultaneously (“cogeneration” or “combined heat and power” (CHP), in many cases aimed at DH). Solid biomass is usually fed as wood chips when used as fuel for power plants, while it is most often employed in pellet form for domestic heating. For the latter use, 19.738 Tg of solid biomass were employed in Italy in 2017. In the four Northwest Italy regions, the value were: 1.775 Tg in Liguria, 0.532 Tg in Lombardy, 0.366 Tg in Piedmont and 0.105 Tg in Aosta Valley [
16].
To enhance the sustainability of the process, biomass should be as low-quality and harvested near the plant as possible. Achieving both premises may not be always feasible as is highly dependent on the plant location, but the benefits are obvious. While the properties and conversion technologies for forest and agricultural biomass may be comparable, their quantity and distribution are different. However, their abundance may provide a reliable source of bioenergy on the whole territory of Northwest Italy.
In Italy, the coverage of forests and woods corresponds to 110∙× 10
3 km
2, over a third (36.5%) of the national territory [
17]. The forest surface notably increased in the second half of the 20th century: it used to be less than 17% after the end of World War II. This value is above the world average (31%), close to the European average (40%, very high due to the Scandinavian countries), and equal to or greater than those of Spain, France and Germany. In terms of global annual withdrawals, the most recent value is 0.71 m
3/ha (2017), very low compared to the European average of 2.39 m
3/ha [
17]. According to the last Report on the status of forests [
16], currently in Italy the 0.43% of existing wood is collected per year, which is much lower than the yearly increase. Moreover, only 18% of the forest surface is subjected to some sort of planning or management. These facts indicate forests as an under-exploited resource. Assuming that this potential quantity was used in cogeneration plants and assuming a work capacity of 4000 h/y and adequate efficiencies, a potential power of 1900 MW
el could be obtained, with an additional electrical production of 7.5 TWh and thermal production of 30 TWh [
15]. If the replaced fuel were natural gas, a decrease in the emissions of nearly 8 million t/y of CO
2 could be achieved.
Looking at North-West Italy, its four regions have extensive forest surface on their territory, especially in internal areas. However, the forest distribution strongly varies from one another, as summarised in
Table 1. Liguria is the region with the highest percentage of its territory covered by forests, not only among Northwest regions, but in Italy as well. Piedmont and Aosta Valley have values that are similar to the national average; for Piedmont, the forest coverage is hindered by industrialised areas, while for Aosta Valley it is hindered by the abundance of high, forest-poor mountains. Finally, Lombardy’s forest abundance is lower than the national average, mainly because it is the region with the largest flat surface, nowadays strongly industrialised. However, lower percentages indicate that the forest coverage is merely unevenly distributed, not that it is negligible: it may still provide a reliable source of biomass for specific areas. Conversely, forest-poor areas would better rely on other biomass sources, to minimise the transport impact.
The advantages of properly handling forests are not limited to the generation of renewable energy. Developing a sustainable approach to forest management may bring new life and create new workplaces in rural areas that saw a strong population reduction in the last decades. Moreover, forests with old trees do not capture significant amounts of CO
2 and may result in accidents, as dead trees fall and burn easily. The four regions feature indeed a noteworthy deadwood density [
18]: 8.6 t/ha for Liguria (the highest value in Italy), 7.1 t/ha for Piedmont, 5.7 t/ha for Lombardy and 4.6 t/ha for Aosta Valley. These four values are higher than the Italian average (3.9 t/ha), pointing out that their woods are, on average, old and lacking management, especially for Liguria.
Agricultural and wood residues represent another common example of low-quality biomass: in 2018 [
19], Italian agricultural activities (including farming of animals) produced 332.3 Tg of waste, while the wood industry produced an even higher amount, 1286.1 Tg. While this amount is likely not entirely solid biomass, it is fair to assume that it represents a significant portion of it, and that there is much potential for its energetic valorisation. These residues are often sent to landfills, incinerated or abandoned on the field, with negative effects on the environment [
20] and without taking advantage of their energetic potential.
Agricultural waste (including residues from animal farming) is produced in this amount in the Northwest regions: 68,360 Mg in Lombardy, 9650 Mg in Piedmont, 174 Mg in Aosta Valley and 170 Mg in Liguria. Conversely, the amount of residues from the wood industry was the following: 553,204 Mg in Lombardy, 38,402 Mg in Piedmont, 2182 Mg in Liguria and 697 Mg in Aosta Valley. Another interesting report by Isprambiente (2011) [
21] estimated that the gross availability per year of some biomass residues was the following: 15.120 Tg of herbaceous residues, 3.585 Tg of pruning residues, 1.563 Tg of residual wood. The higher order of magnitude compared to the previous numbers may mean that these residues are disposed of by their producers, who thus do not have to declare them as waste. According to Food and Agriculture Organization of the United Nations (FAOSTAT) estimates, 1.497 Tg of crop residues were burned on-site in Italy in 2017, quantity based only on maize, rice and wheat residues.
From the discussed values, it is very clear that an efficient management of forest and agricultural residues could increase their still under-exploited energetic potential. Also, the adaptation of existing technologies and the development of new ones could help in the increase of exploitation of biomass helping to achieve the environmental energy targets in terms of renewable sources.
3. Thermo-Chemical Conversion Technologies
Biomass is characterised by a complex structure, being composed of a network of cellulose, hemicellulose and lignin molecules. Its composition may notably vary depending on the plant, but it always has a high amount of carbon, oxygen and hydrogen. To exploit its energetic potential, its structure needs to be broken into simpler molecules. This can happen due to the action of microorganisms or heat; the processes that exploit the former are called biological, while those that exploit the latter are called thermochemical [
22,
23,
24]. Biological processes (especially anaerobic fermentation) are mostly suitable when biomass has a high water content, as it happens for sewage sludge or urban residues. Conversely, thermochemical processes work best with relatively dry biomass, and have the advantage of being able to convert the whole biomass structure, including lignin. Thermochemical processes are mainly categorised based on the amount of oxygen fed to the process compared to the amount required for stoichiometric oxidation of the biomass.
Direct combustion is the oldest energy production process and, by far, the most common biomass-to-power generation method commercially available. For industrial and centralised domestic heat and power generation, elements like stoker burners, grate boilers or dense fluidised bed combustors are widely available, producing from a few kilowatts to up to 100 MW [
25].
Gasification processes convert biomass under reducing conditions with a limited amount of gasifying agents. The main product is the producer gas, a mixture of hydrogen, carbon monoxide, carbon dioxide and other light hydrocarbons. This gas is combustible and can be used to generate heat or applied in engines or turbines for electricity production. Commercial gasifiers present several configurations such as updraft, downdraft, fluidised beds (circulating, bubble or dual) or entrained flow depending on the converted feedstock and the applied conditions. Smaller plant sizes in respect to the former combustors are found [
26]. Successful and large biomass gasification units commercially implemented can be found when co-firing with fossil fuels. Moreover, more than 1000 units of combined heat and power (CHP) plants were in operation in Central Europe in 2019 with energy productions from 50 kW to 5 MW each.
Other thermochemical processes are not directly aimed at the generation of energy. The main one is pyrolysis [
27,
28]; it takes place in the absence of oxygen and decomposes the biomass through the action of heat. Pyrolysis produces three products: one gaseous, one liquid and one solid. The gaseous and liquid products are suitable for energy generation. Conversely, the solid product (known as biochar) has a plethora of possible applications [
29], which fall outside the scope of this review. The process can be tuned to minimise (fast pyrolysis) or maximise (slow pyrolysis) the yield of biochar [
30]. Fast pyrolysis can be seen as a way to increase the density of the biomass so it can then be transported in a more efficient way. Hydrothermal carbonisation [
31] and torrefaction [
32] serve an analogous purpose, generating solid materials with enhanced properties that can be easily employed as fuels. Finally, hydrothermal liquefaction is also aimed at enhancing the properties of biomass as a fuel, but its main output is a bio-oil (bio-crude) [
33,
34]. This process may be aided by other solvents or catalysts [
35,
36]. As the name suggests, hydrothermal processes take place in an aqueous environment, in sub- or super-critical conditions [
37]. Hence, these processes remove the need to dry the biomass. All these processes are outside the scope of our review since they do not directly generate energy. Moreover, it is difficult to obtain a complete list of the operating prototypes, outside of published data. Readers may find more information in the previously cited reviews.
District heating (DH) plays an important role in the energy context. In it, heat, in the form of hot or superheated water, is produced and water reaches the individual buildings and heats them via large underground pipe networks. DH permits increasing the overall efficiency of plants. Since 1972, DH in Italy has maintained an upward trend, achieving a total installed capacity of 8727 MW
th in 2019, covering the 2.3% of the total national heating request. DH plants fed with renewable sources are in constant increasing trend and, among them, bioenergy (mostly biomass) is the most used feedstock with a total production of 623 MW
th [
38]. The thermal output of each of these plants ranges from 1 MW to 20–25 MW, 35% of them working in cogeneration [
17].
A precise control of the operating conditions in all the described technologies is a critical aspect to achieve improved power efficiencies and to minimise pollutant emissions, including particulate matter (PM), nitrogen oxide (NOx) and hydrocarbons. Other challenges include the presence of undesirable species such as alkali compounds in biomass ash that can cause slagging and fouling problems [
20]. For the case of gasifiers, their lower temperatures often result in the formation of undesired tar [
39], which leads to severe operational problems. Compared to combustion, gasification is a less mature technology and some aspects still need to be optimised: the gas cleaning phase can be complex due to the presence of the tar, and it requires a feedstock with homogeneous properties. Moreover, according to Patuzzi and colleagues [
40], the Italian legislative framework is still vague and uneven, and may thus discourage investors. However, gasification also has notable advantages compared to direct combustion [
41,
42]:
Gasification can be significantly more efficient than combustion, especially if the plant performs CHP;
Since gasification employs a limited amount of air, the volume of gas that needs to be cleaned is much lower than that of combustion, requiring smaller units with lower losses and less reactants; the cleaning also happens at lower temperatures;
If the producer gas has been properly treated, its combustion can be very clean and requires significantly less excess air than for burning the biomass;
It is considered the most efficient way to obtain hydrogen from biomass.
Due to these positive features, gasification is already largely applied at the commercial scale. In the Alpine region of South Tyrol in North-East Italy, for example, 46 gasification plant were operative as of the end of 2017 [
43].
Finally, the convenience of a power plant in terms of investment costs can be as crucial as its energy performance. Large plants are characterised by high initial investments (equipment, installation, security elements, …). Also, logistics and transport have a significant influence on the total costs considering the distance of the plant to the source of biomass and adequate pre-treatments to reduce feedstock volumes. Small and medium sized plants might need less initial capital as plants are usually designed for specific communities or commercial needs. However, their economical sustainability might rely in the valorisation of the process sub-products, as for example the ashes or the carbonaceous residues (i.e., char) to obtain extra benefits. This strategy would make the technology more convenient not only economically but also environmentally, and would foster circular economy models and strategies.
On the Use of Subproducts in a Circular Economy View
Like most industrial processes, biomass thermochemical plants also generate undesired products. These products were traditionally seen merely as something to dispose of, mainly in landfills for the solid ones. Research has however proved that they may have further uses, bringing a double advantage. From the environmental point of view, valorising by-products follows the principles of the circular economy, in which virtually nothing should be a waste, and everything can be further employed. Economically, disposing of waste represent a cost for plant owners, and decreases the overall economic sustainability. If these by-products are given a scope, plant owners may not only avoid the disposal cost, but also gain money from selling them, enhancing the economy of the process.
In the case of combustion, the only notable by-product is the inert ash, while everything else is oxidised and becomes gaseous. Because the ash is inert and stable, it may be employed in fields where such properties are required. As the next Section will describe, selling the residual ash to the steel or building industry already is an existing practice in Italy, aiding in the profitability of combustion plants. However, this may stop being convenient if the offer exceeds the demand, which happened to a plant in Vercelli (as detailed in the next Section). In this case, it may be advisable to move towards more specific applications, based on the chemical composition of the ash.
While biomass ash is very often rich in SiO
2, it also contains many other compounds, depending on the starting biomass. In their recent review, Sharma et al. [
44] emphasised that biomass ash can be valorised to produce different added-value products: it can enhance the properties of construction materials or replace mineral oxides to produces glasses and glass-ceramics, including to obtain optical or dielectric materials. Silva and colleagues [
45] reviewed the application of biomass ash as soil fertiliser, emphasising that the current EU legislative framework may hinder this possibility. Other authors showed that ash may act as an adsorbent of pollutants from gaseous or liquid streams, also pointing out that the profitability is higher when the ash is employed near the production site [
20,
46,
47].
Gasification mainly produces two by-products: one condensable (tar) and one solid (char). Tar is a mixture of heavy hydrocarbons (of which some are toxic) and is detrimental to the process because it can clog or corrode devices. It has no further use, but it can be cracked within the process itself to maximise the gas yield and increase the energy efficiency.
The solid by-product, char, has long been considered a waste without any further value. To this day, Italian plant owners dispose of it at a cost; in South Tyrol, the 46 operative gasifiers produce about 1300 Mg per year of char, and plant owners must pay a total of 200,000 € for its disposal [
48]. On the one hand, gasification char is similar to pyrolysis biochar: they are rich in carbon and porous. Both have been deemed to be similar to activated carbon, although the comparison may be more adequate for gasification char [
49]: the operative conditions of gasification are similar to those of activation processes, especially for dual-stage gasifiers. On the other hand, gasification is not aimed at the production of char, and thus its operating conditions cannot be optimised as a function of the char’s properties and yield. A high carbon content may be a symptom of a poor gas yield. Moreover, its content of aromatic compounds and heavy metals tends be higher, making it unsuitable for soil amendment [
50].
In a 2017 review, You and others [
51] summarised the properties and applications of gasification char. They grouped the possible uses as: catalyst for tar removal, adsorbent of CO
2 and pollutants from gases and liquids, fuel or co-fuel, material for electrochemical applications, additive for anaerobic digestion, catalyst for biodiesel production. The most interesting applications are arguably those within the gasification process itself, as they eliminate costs for transport of the char and for the purchase of specific materials. Recently, many researchers devoted their efforts to this topic: Ravenni et al. [
52], Buentello-Montoya et al. [
53] and Cordioli et al. [
54] proved that char is suitable for reforming and cracking the gasification tar; Marchelli et al. [
43] and Benedetti et al. [
55] showed that it is able to adsorb H
2S and CO
2; Hernández et al. [
56] and Piazzi et al. [
48] assessed the benefits of recirculating it to the gasifier or burning it in a separate unit, respectively.
Ultimately, there may not be a one-size-fits-all solution, because the hardly-predictable properties of the char strongly influences its suitability for different applications. The high number of proven applications are however encouraging for its valorisation in a circular economy fashion, proving that it should not be seen as a waste anymore. This may foster the economic viability of the gasification process, provided that the legislation is properly adapted.
4. Power Plants Fed by Solid Biomass in North-West Italy
4.1. Strategy
The present study has considered four Italian regions (Liguria, Lombardy, Piedmont and Aosta Valley) located in the north-west territorial area. A total of 28,167 plants have been analysed and categorised according to their typology and output: thermo-electric power plants for electricity production, thermal plants for heat production, cogeneration plants for combined heat and electricity production and DH installations for local heating purposes. The only feedstock considered has been solid biomass, excluding other sources of bioenergy such as municipal waste, biogas or bioliquids.
Figure 3 and
Figure 4 show a map of the studied regions and the exact location of the plants for electricity production (
Figure 3) and DH (
Figure 4).
As an overall view,
Table 2 and
Table 3 gather a summary with the number of plants per region, according to their typology and their power outputs.
Several national official sources have been consulted: GSE (Gestore Servizi Energetici), TERNA (Trasmissione Elettrica Rete Nazionale), FIPER (Federazione Italiana Produttori di Energia da Fonti Rinnovabili), ITABIA (Italian Biomass Association), AIEL (Associazione Italiana Energie Agroforestali) and APER (Associazione Produttori di Energia da Fonti Rinnovabili). In addition, specific information has been requested to the analysed individual plants and consortiums of producers, as for example TICASS (Tecnologie Innovative per il Controllo Ambientale e lo Sviluppo Sostenibile).
general information: location, public/private management;
technical information: type and main characteristics of the technology, properties and origin of feedstock and final use of the produced outputs;
energy data: annual consumption of feedstock, main electrical/thermal outputs;
environmental data: identification and quantification of sub-products, emissions to the atmosphere;
The collected data for each region of study will be organised, analysed and discussed in the following sub-sections.
For readers who may not be familiar with the Italian administrative system, a simplified resume is provided here. The Italian territory is divided in 20 regions, of which 5 have a higher degree of autonomy. Each region (aside for Aosta Valley) is further divided into provinces (or analogous entities), depending on the territory and population distribution. The provinces that contain large cities (such as Milan, Turin and Genoa) are actually called “città metropolitane” (i.e., metropolitan cities), but for the sake of straightforwardness, in this review they are called provinces as well. There are 107 provinces (or analogous entities) on the Italian territory. Aside for some exceptions, they are named after the city that acts as the administrative centre. The most important city of each region acts both as the administrative centre of the region and of the province that contains it. Finally, each province is divided into several “comuni” (i.e., municipalities). As of 2020, Italy comprises 7903 municipalities. Rome is both the largest and most populated municipality of Italy, while Milan is the second most-populated municipality in Italy and the most important in North-West Italy.
4.2. Liguria
4.2.1. Generalities
Liguria is the third smallest region in Italy and the fourth most densely populated. It comprises four provinces: Genova (GE, which is also the administrative centre of the region), Imperia (IM), La Spezia (SP) and Savona (SV). It stretches along the Ligurian Sea from East to West for about 350 km and its territory is never more than 30–40 km away from the sea. Being crossed by the Alps and Apennines Mountains, its surface is 65% mountainous and 35% hilly, with virtually no plains. The mountains are rather steep and this has hindered the development of human settlements in the interior zones: most of its inhabitants live in the coast, where the population density may reach values of 1000 people/km2. Liguria also has the highest percentage of its territory covered by woods (more than 73%, while the national average is 36.5%). The Ligurian economy is mainly associated with commerce (the port of Genoa is the largest in the Mediterranean Sea) and tourism.
In 2018, Liguria produced 5.373 TWh of electrical energy [
13]. The net amount of energy sold to other regions was 0.547 TWh. Conversely, a net amount of 1.550 TWh was bought from foreign countries. Thus, the overall amount of energy employed in the regions was 6.138 TWh (not including the energy loss and the energy employed for transport): Liguria produces less energy than what it employs. For many years, Liguria used to produce more energy than its demand, but this changed in 2015 due to a large decrease in the non-renewable produced amount. The demand is distributed to the agricultural, industrial, tertiary, and domestic sectors with shares of 1, 25, 47 and 28%, respectively. The provenience of the electrical energy produced in Liguria is summarised in
Figure 5. From the graphs, it is apparent that biomass is the least employed renewable source; this is especially true for the energy obtained from solid biomass, which represents the 1‰ of the renewable energy produced in the region, despite its abundance on the territory. In 2018, the net efficient power from biomass was 23.9 MW
el. While the renewable share is lower than the Italian average, the trend is positive: the installed power from renewable energy increased by 117% from 2010 to 2016 [
58], with solar energy seeing the largest increase.
In Liguria, the agricultural sector is hindered by the mountainous territory, and only a few high-quality products are cultivated. Hence, the thermochemical valorisation of agricultural residues probably does not have the potential to make a remarkable difference. Nonetheless, it could be promoted as a better way to handle the waste of some businesses. The opposite can be said about forest biomass, which is abundant and underexploited. The surface of the region covered by forests is growing, due to the abandonment of rural areas; it increased by about 2270 ha/y in the decade 2003–2013 [
59]. In the years 2005–2012, the amount of harvested trees per year corresponded to only 0.3% of the wood surface and 6.36% of the yearly forest increase.
Compared to the Alpine regions, the trees in Liguria are more densely distributed but feature a lower volume, due to lower abundance of conifers [
59]. In 2013, the wood volume was 145.8 m
3/ha. Due to the lack of forest management, the Ligurian trees are also rather old: 89% of them can be defined as adult or old. Another consequence of this is the high amount of deadwood (i.e., dead trees and foliage). 18.3 m
3/ha of deadwood were reported in 2013, against the national average of 8.7 m
3/ha. Remarkably, this number is mainly caused by the presence of a large number of standing dead trees (13.8 m
3/ha against a national average of 5.3 m
3/ha).
The advantages of the proper management and valorisation of forests have already been explained; nonetheless, they may not be easy to put into practice here. This is partly because 86% of the Ligurian woods are not public-owned, and their owners may not be interested in working on them. Moreover, the steepness of mountains and valleys can hinder the management of some forests and the transportation of wood. Indeed, 61% of the woods is in zones in which the steepness exceeds 40%. Other difficulties cited by the last Regional energetic plan [
60] include the small scale of most companies, the lack of adequate technologies and the difficult in coordinating public and private entities.
Bioenergy production has undergone a slight decrease in recent years. According to a 2018 Legambiente report [
58], 100 municipalities (out of 234) produce bioenergy on their territory (regardless of electrical or thermal). Of these, 89 employ solid biomass, 10 employ biogas, and 2 employ biofuels. Most of the plants are small-scale: Ventimiglia (IM) was reported as the only municipality to produce more than 1 MW
el. Of the ten largest producers, only two (Dego (SV) and Imperia (IM)) produce both electricity and heat, which may suggest that the potential of many of the plants is underexploited. Given the small scale of the plants, it is also difficult to find details about them and information is not always coherent.
4.2.2. Electricity Production
The last GSE bulletin (updated to 30 June 2019) [
61] lists only one plant that employs solid biomass to produce electrical energy in Liguria. It is located in Ventimiglia (IM) and it produces 3.3 MW
el. We also searched for other plants through other means with no success; we think it is safe to assume that no other relevant electricity-producing solid biomass plant exists in Liguria.
4.2.3. Heat Production
In 2018, Liguria produced 6028 TJ of thermal energy from biomass [
9]. With regard to heat plants, the 2011–2013 Report on Forests in Liguria [
59] mentions 14 public-funded operating plants that exploit woody biomass, with two more built but not yet operating. Nowadays, heat production from biomass is widespread in Liguria, especially at very small scales. According to the GSE atlas [
57], 1493 units produce heat from biomass in Liguria. The atlas does not allow to filter depending on the type of biomass, but it is fair to assume that most of these employ woody biomass. Indeed, apart from one, all of them are owned by privates, and only four of them have a capacity that exceeds 100 kW. The four larger units are located in Rocchetta Nervina (IM, 1 MW), Carcare (SV, 900 kW), Albenga (SV, 860 kW) and Millesimo (SV, 105 kW); all four of them are fed with woody biomass. The 1493 plants provide a total installed capacity of 28 MW, with an average value of only 18.75 kW. In 2018, Liguria produced 6028 TJ of thermal energy from biomass [
9].
4.2.4. District Heating
According to the last regional energetic plan [
60], Liguria had four DH plants that employed wood chips as the fuel in 2014. Their locations and power were the following: Rossiglione (GE, 1.3 MW), Masone (GE, 1 MW), Carcare (SV, 900 kW) and Campo Ligure (GE, 700 kW). In a 2017 GSE report [
62] Liguria ranked seventh among the Italian regions in terms of volume heated through DH. However, according to the same report and the last GSE bulletin (updated to July 2019), only three Ligurian municipalities have DH, apparently implying that some of the previously cited plants were shut down or reconverted. The three municipalities are Genova (GE), Rossiglione (GE) and Cairo Montenotte (SV), with Rossiglione remaining the only one to be fed with biomass.
4.2.5. Final considerations
To sum up, the thermal conversion of woody biomass in Liguria is represented by a few positive examples but should be enhanced in terms of the amount of energy produced and quality of the technology. The opportunities are manifold: the territory has a large amount of unexploited biomass, which could be valorised in the framework of short and sustainable supply chains. At the same time, this could generate job opportunities in rural areas and help repopulate villages while generating energy and heat for them.
4.3. Lombardy
4.3.1. Generalities
Lombardy, with an area of 23.844 km2 and about 10 million inhabitants, is the most populous, richest, and most productive region in Italy. It is composed twelve provinces: Milan (MI, which is also the administrative centre of the region), Bergamo (BG), Brescia (BS), Como (CO), Cremona (CR), Lecco (LC), Lodi (LO), Mantua (MN), Monza-Brianza (MB), Pavia (PV), Sondrio (SO), and Varese (VA). Milan’s metropolitan area is the largest in Italy and the third most populated functional urban area in the EU. The orography of Lombardy is characterised by the presence of three distinct belts: a northern mountainous belt constituted by the Alpine relief, a central piedmont area of mostly pebbly soils of alluvial origin, and the Lombard section of the Padan Plain in the southernmost part of the region. The climate of the region is mainly humid subtropical especially in the plains, and oceanic in the Alpine foothills.
Lombardy produced 46.021 TWh of electrical energy [
13] in 2018. In the same year, Lombardy bought 20.806 TWh from foreign countries and 3.224 TWh from other Italian regions. Overall, the net amount of electrical energy consumed in the regions was 67.429 TWh (not including the energy loss and the energy employed for transport). The energy is employed in the agricultural, industrial, tertiary and domestic sectors with shares of 1, 49, 33 and 17% respectively. The provenience of the electrical energy produced in Liguria is summarised in
Figure 6. Biomass (especially in the form of biogas) represents the second most employed renewable source, despite its previously commented under-exploitation. The efficient net installed power from biomass is 871.7 MW.
4.3.2. Electricity Production
55 thermoelectric plants are registered in GSE, with a total nominal power production of 89,467 kW. 15 plants produce an output higher than 1 MW whereas 40 produce power below that value.
Among the large sized plants, the main source of power in the region is the Biomass Power Plant Olevano di Lomellina powered with virgin wood biomass and located in the Municipality of Olevano di Lomellina (PV). The plant covers a surface area of over 6 hectares, 2/3 of which are destined to biomass storage and a high proportion (more than 85%) of the plant’s raw materials coming from a short supply chain.
It has an electrical capacity of about 20 MW
el and allows to satisfy the annual electricity needs of over 50,000 residential units with “zero impact”, preventing CO
2 emission of about 100,000 tons per year compared to a modern coal power plant [
63].
Fusine Energia Srl built the power plant in the municipality of Fusine (SO), with a power of approximately 6 MW. The plant uses 60,000 tons of wood biomass, locally sourced, and a technology based on a mobile grate, to produce 40 million kWh of electricity representing the annual needs of more than 13,000 families.
The biomass-to-energy plant in Sustinente (MN) (run by Gruppo Mauro Saviola) [
64] is fed by 18.3 t/h of waste biomass (158,000 t/y) to provide 29.5 MW
th and 5.5 MW
el total power. The system is composed by an adiabatic moving grate furnace, a water-tube boiler, a flue gas treatment system, a condensation system and a thermal cycle and steam turboset.
Other power plants run by Gruppo Mauro Saviola are Ecowatt, located in Castiraga Vidardo (LO), and two rice producers using rice waste as feedstock: Riso Scotti, in Pavia (PV), and Curti Riso, in Valle Lomellina (PV). In particular, Ecowatt [
65] uses a mix of wood and urban residues (5 t/h–43,800 t/y) to produce 19.5 MW
th and 5 MW
el. In it, a grate furnace and an integrated water pipe boiler compose the main part of the plant together with a turbo steam, a condensation system, and a thermal cycle. Rice waste is used for energy production in two plants: Riso Scotti [
66] uses rice husk mixed to wood chips (15 t/h–130,000 t/y) to produce 37 MW
th of thermal power and 6.4 MW
el of electrical power whereas Curti Riso [
67] is fed only with rice husk (6 t/h–52,500 t/y) and provides 20.8 MW
th and 4.5 MW
el of thermal and electrical power. Both plants work with a grate furnace and a water pipe boiler and the required smoke treatment systems.
Other important power plants providing electrical power are STS S.r.l. in Sedrina (BG), TSN S.r.l. in Sellero Novelle (BS), FRAVT S.r.l. in Collio (BS), all of them run by the company Engie Servizi [
68]. They produce 3 Mw
el each and work coupled with a DH system that will be explained in the next sub-section. Also, Travagliato (BS) (1 MW
el/5.6 MW
th) fed by dedicated fast growing crops [
69], Tirano (SO) (1.1. MW
el) [
70] and Cremona (1 MW
el) [
71], the last two coupled with DH and described in the next sub-section, can be highlighted.
Among the small-sized installations, the plant in Santa Margherita di Staffora (PV) can be highlighted which produces 320 kWel and 1.2 MWth through a gasifier fed with wood chips.
4.3.3. Heat Production
In 2018, Lombardy produced 24,049 TJ of thermal energy from biomass [
9]. According to the GSE atlas [
57], there are 18,616 units installed in the region (as already stated, the tool does not allow to filter the units based on the biomass type). There are only 9 units owned by public entities, while all the others are owned by privates. The total installed capacity is 272 MW, but the average value is only around 30 kW. Indeed, only 19 units can generate more than 0.5 MW. The largest units (more than 1 MW) have the following locations and powers:
Mornico al Serio (BG), Carugo (CO), Mariano Comense (CO) and Cermenate (CO), 1 MW each;
Carnate (MO) and Oltrona di San Mamette (CO), 1.996 MW each;
Cinisello Balsamo (MI), 2 MW
Nuvolera (BR), 3.996 MW
4.3.4. District Heating
A total of 38 DH plants are registered in GSE for a total supplied thermal energy of 3,487,470 MWh and an inserted thermal energy of 4,179,800 MWh.
The city of Brescia was one of the first in Italy to acquire, in 1971, a power plant and an urban DH network. In the mid-1980s, the DH plant was powered by methane, fuel oil and coal. Today, DH (a2a Calore & Servizi) is fed significantly by a waste-to-energy plant [
72]. It is a cogeneration plant for electricity and heat that uses as fuel biomass and municipal solid waste (except for recyclable residues) from the city of Brescia and its province. The Lamarmora plant guarantees approximately 30% of the heat needed to power the DH network along its 600 km that reaches 174,000 apartments and offices. A 65% is guaranteed by the waste-to-energy plant and the remaining 5% by the Ori Martin plant for heat recovery. The plant is able to burn 800,000 tons of biomass (1 combustor) and urban waste (2 combustors) per year, producing 570,000,000 electric kWh (power of 84.4 MW
el) and 527,000,000 thermal kWh (power of 160 MW
th), allowing a saving of 150 thousand toe (equivalent tons of oil) and avoiding carbon dioxide emissions of over 400,000 tons per year. Half of the total investment for the construction of the plant was dedicated to combustion gas treatment and environmental protection systems. Among others, a catalyst is installed to treat nitrogen oxides together with a high performance desulphuriser and bag filter. It is estimated that the combustion of these waste saves 94% of dust, 93% of sulfur oxide, 47% of nitrogen oxide and 43% of carbon dioxide compared to the production of the same energy with traditional systems.
Several DH plants in the region are run by Gruppo Mauro Saviola. The installation located in Sustinente (MN) is one of the largest plants producing a furnace thermal power of 10.3 MW
th and a thermal output of 8.4 MW
th for industrial processes [
73]. A mass flow of 2.1 t/h of wood dust (18,100 t/y) is fed to the burner working at 10 bar and 240–280 °C. An equivalent DH plant is located in Viadana (MN) with the same power productions [
74].
The society T.C.V.V.V. S.P.A. (Teleriscaldamento Cogenerazione Valtellina Valchiavenna Valcamonica) has 3 DH plants located in Tirano, Sondalo and Santa Caterina Valfurva [
75].
The plant in Tirano (SO) uses 3 biomass boilers with a unit power of 1 × 7.20 MWth and 2 × 6.00 MWth for a total of 19.20 MWth. If needed, power from diesel can provide up to an extra 6.00 MWth. The electrical production is obtained with an Organic Rankine Cycle (ORC) turbine coupled to the boiler which provides 1.1 MWel, as previously mentioned. The total annual biomass consumption is 29,822 t (with a heating value around 10 MJ/kg). The DH network has a length of nearly 40 km with 758 users substations connected and in operation for a total heated volume of 1,987,400 m3 and a connected power of 59.15 MW. Remarkably, it covers the 80% of the thermal need of the town.
Similarly, Sondalo (SO) has 2 biomass boilers with a unit power of 5.00 MWth each for a total of 10.00 MWth. If needed, power from diesel can provide up to an extra 5.00 MWth. The total annual biomass consumption is 9978 t (with a heating value around 10 MJ/kg). The DH network has a length of nearly 22.4 km with 384 users substations connected and in operation for a total heated volume of 805,700 m3 and a connected power of 24.28 MW.
The last of these three DH plants is in Santa Caterina Valfurva (SO). It has 2 biomass boilers with a unit power of 6.00 MW
th each for a total of 12.00 MW
th. If needed, power from diesel can provide up to an extra 6.00 MW
th. The total annual biomass consumption is 4005 t (with a heating value around 10 MJ/kg). The DH network has a length of nearly 7.3 km with 67 users substations connected and in operation for a total heated volume of 372,400 m
3 and a connected power of 11.64 MW [
70].
The DH in Cremona (installed in 2012 by Linea Green) provides 5.5 MW
th in the main backbone of the city’s existing DH network. The heat produced by the combustion of biomass is transferred by means of a diathermic oil circuit to an ORC module (Rankine cycle with organic fluid) capable of generating thermal and electrical energy (1.1 MW
el). The plant was designed to be also an educational place to show sustainable and successful technologies based on renewable resources. The plant in Lodi, also run by Linea Green, combines a boiler fueled by virgin wood chips and an ORC turbine, with organic process fluids to produce 0.999 MW
el and to provide 5 MW
th in the existing DH network [
76].
The company Cofely runs a DH plant in Marmentino (BS). The process feeds wood chips (1.7 t/h/14,800 t/y) to a boiler working at 47 bar and 480 °C. The plant is composed by a grate furnace with an integrated water tube boiler, a condensation and thermal system and a DH section. It produces 5 MW
th and 1 MW
el and 1 MW
th is directed to DH [
77].
For comparison and as an example,
Table 4 shows the total energy produced during 2015 in some of the analysed plants [
70].
4.3.5. Final considerations
Lombardy largely contributes to the national renewable energy system. Many big and small power plants fed by biomass are present in the region with high level of success. Almost all plants are composed by a combustor with a mobile grid and efficient gas treatment technologies. None of them indicates the use of the sub-products (char, ash).
4.4. Piedmont
4.4.1. Generalities
Piedmont is the second largest region in Italy and the seventh most populated. It comprises eight provinces: Turin (Italian: Torino (TO), which is also the administrative centre of the region), Alessandria (AL), Asti (AT), Biella (BI), Cuneo (CU), Novara (NO), Verbania-Cusio-Ossola (VB) and Vercelli (VC). It has not access to the sea and is the westernmost Italian region, bordering France. Its territory can roughly be divided into three concentric semicircles: a flat inner zone (26% of the surface), a hilly intermediate zone (31%) and a mountainous outer zone (43%). The plain area is part of Pianura Padana (literally Plain of the Po [river]), which is the largest plain in Italy and home to many industries and cultivations. The hilly area is exploited for agriculture as well. The mountains can be very steep: some of them exceed 4000 m and many exceed 3000 m. They are rich in forests. The economy is largely associated with industry: Turin is one of the main industrial centres of Italy and the goods exported by Piedmont are 10% of the Italian total, raking fourth after Lombardy, Veneto and Emilia-Romagna [
78]. Agriculture is largely present, with the main products varying in each zone. In the plain part of Vercelli and Novara the production of rice is one of the main in Europe, while the hills are renowned for their wine. Tourism is also widespread and based on diverse attractions.
According to the last Report on the environment of Piedmont [
79], the surface of forests in Piedmont in 2016 was 37.6% of the total surface. This increases to 38.5 if also wood cultivations are taken into account. Of the overall surface, 72.2% have private owners, while the rest is public property [
16]. The amount of deadwood is the second in Italy (7.1 t/ha), only lower than that of Liguria [
18]. It was estimated that the currently harvested wood is only half of the amount that can still be deemed as sustainable, and it is a quarter of the increase. The forest surface of Piedmont has been continuously increasing: it is estimated to have doubled since the end of World War II [
80]. Verbania-Cusio-Ossola, Biella and Cuneo are the provinces with the highest wood surface. Agriculture is also widespread and, as previously mentioned, the amount of generated agricultural residues seems promising for its energetic exploitation.
According to a 2018 Legambiente report [
81], 630 municipalities (out of 1181) generate bioenergy on their territory (regardless of electricity or heat). Of these, 568 employ solid biomass, 149 employ biogas and 30 employ biofuels. Compared to biogas, solid biomass produces more thermal energy but less electrical energy: solid biomass generates 111 MW
el and 195.1 MW
th, while biogas generates 195 MW
el and 28 MW
th. Finally, biofuels are only employed to generate electricity (50.4 MW
el). Concerning solid biomass, the largest producer is the Crova (VC) municipality, with 22.26 MW
el and 33 MW
th. The second and third largest producers, Crescentino (VC) and Airasca (TO), only produce electrical energy (15.32 and 14 MW
el).
Piedmont produced 29.733 TWh of electrical energy [
13] in 2018,. Nearly half of this (14.491 TWh) were produced in the Turin province, while Asti produced the lower amount (0.125 TWh). The net amount of energy sold to other Italian regions was 17.285 TWh, while the net amount bought from other countries was 13.990 TWh. Thus, the overall amount of energy employed in the region was 24.406 TWh (not including the energy loss and the energy employed for transport): Piedmont produces more energy than that it employs. Piedmont started to satisfy its internal demand in 2016 thanks to both an increase in the production and a slight decrease in the demand after 2008. This amount is employed in the agricultural, industrial, tertiary and domestic sectors with shares of 1, 48, 32 and 19%, respectively. The provenience of the energy generated in Piedmont is summarised in
Figure 7: hydroelectric is largely the principal source, followed by solar and biomass with similar shares.
Piedmont has seen a sharp increase in renewable energy production: the installed power grew from 2.9 to 4.7 GW from 2010 to 2016, with solar increasing the most (+1289%), followed by biomass (+317%) and wind (+41%), while hydroelectric slightly decreased (−5%) [
81]. The efficient net power obtained from biomass was 333.9 MW in 2018.
4.4.2. Electricity Production
The last GSE bulletin [
61] (updated to 30 June 2019) lists 55 active plants aimed at the production of electrical energy from solid biomass. Upon researching further, we found that two of these plants are likely not operative anymore and one is probably not existing, bringing the total to 52. Moreover, the Provincial energetic plant of Vercelli [
82] describes another rather large plant, which is not cited elsewhere. It is unclear whether it was omitted by GSE or the Vercelli energetic plan features outdated information. We have included details about it in the following paragraphs, but it is not considered in the calculation of the regional biomass power.
Information regarding the larger units is readily available, mainly due to the many documents relative to the authorisation and monitoring processes. Conversely, information regarding the smaller units (producing less than 0.5 MW
el) is not available, aside for their location. Most likely, they are placed inside small or medium factories, for which they provide the energy. The plants are listed in
Supplementary Material Table S3.
The 52 plants have a total power of 63.425 MWel, of which 56.287 are generated by the 16 largest ones (i.e., the ones with a nominal power of at least 0.99 MW). Four plants have a power between 0.5 and 0.88 MW, while the other 32 have a power that is lower than 0.25 MW. Some of them perform combined heat and power generation; the heat is in some cases used for industrial or agricultural purposes, while in others it is provided through DH. There are many positive examples of plants converting short-range and/or residual biomass, thus limiting the environmental impact in the transportation phase.
Regarding the conversion technology, we were able to identify only three plants performing the gasification of the biomass. They are located in Villanova Mondovì (CN, 0.996 MW
el), Borgosesia (VC, 0.875 MW
el) and Avigliana (TO, 0.2 MW
el). Two more gasifiers used to be active in Caluso and Lombriasco (TO), but they are not operative anymore. The plant of Borgosesia [
83] produces both electricity and heat (1.1 MW) and it can treat up to 8000 t/y of short-range wood. The overall investment for it was 5 M€. The Avigliana [
84] plant performs the pyrolysis and gasification of the biomass in two separate units; the former is performed by burning part of the producer gas. 247 kg/h of wood are fed to the device.
All the other 49 plants perform direct combustion of the biomass, including all those that produce more than 1 MWel. Below are reported some details about the most noteworthy plants, sorted by their nominal electric power:
The plant of Crescentino [
85,
86] (VC, 15.32 MW
el) is the largest of the region. It is part of a large plant aimed at bioethanol production from agricultural residues: only the residual lignin is burned for the direct production of electrical energy. Opened in 2012, the plant was later closed due to technical difficulties and recently reopened by the new owner, ENI.
The plant of Airasca [
87] (TO, 14 MW
el) burns wood chips to produce electricity and heat; the latter is provided to a near industry. Its main features are the biomass boiler and a turbine.
The plant of Crova [
82,
88] (VC, 7.78 MW
el) burns about 200 t/d of biomass, which is mainly rice husk obtained from nearby rice cultivations. Opened in 2001, it employs a moving grid burner and a turbine. Low-pressure steam is sent to a rice company for the parboilisation (pre-cooking) process. The residual ash is composed by 90% silica and is sold to the steel industry as an insulant material.
The plant of Vercelli [
82] (VC, 6.8 MW
el), which may be not active anymore, was opened in the 1980s and used to burn 35 Mton/y of rice husk. To sustain the profitability of the process, the 7 Mton/y of ash that were produced were mainly sold to steel industries. Due to the increase in the price of rice husk and decrease in the demand from the steel industry, the plant was reconverted to work with wood chips, being able to process about 80 ton/day.
The plant of Rivarolo Canavese [
89] (TO, 5.1 MW
el) employs 210 t/d of wood chips to produce electricity and provide heat for domestic use through DH.
The plant of Cossato [
90] (BI, 3.05 MW
el) is fed with short-range biomass (within 70 km), obtained from the management of woods and cultivated poplars. About 130 t/d of biomass are burned in a moving grid furnace and electricity is obtained through a five-stage turbine. While technically feasible, the plant is currently not equipped for DH. The heat is employed within the plant and to heat greenhouses.
The plant of Verzuolo [
91] (CU, 1.05 MW
el) covers the electricity and heat demand of a nearby paper industry. Most of the energy is produced through natural gas, but a small amount is obtained in a fluidised bed boiler fed with wood and bark residues, paper sludge and natural gas. The plant is allowed to burn 62,000 t/y of wood and bark residues and 30,000 t/y of paper sludge.
The plant of Busca [
92,
93] (CU, 0.999 MW
el) employs 40–45 t/d of short-range wood, which is burned to obtain 1 MW of electricity and 6 MW of heat, distributed through DH to 49 units.
The plant of Cavallermaggiore [
94] (CU, 0.999 MW
el) is fed with about 45 t/d of wood (mainly poplar wood) obtained from a maximum distance of 70 km. The plant produces 1 MW of electricity and 3.5 MW of heat, which is employed to dry the biomass and in nearby greenhouses.
The plant of Coniolo [
95] (AL, 0.999 MW
el) is part of a wood (poplar) industry. The residual wood is employed to generate electricity and heat.
The plant of Envie [
96] (CU, 0.999 MW
el) burns about 57 t/d of wood chips. The material is obtained from woods, pruning residues and wood industries from a maximum distance of 20 km. It is fed to a moving grid boiler. The plant produces both electricity and heat; the latter is employed to preheat the feed and for DH.
The plant of Ghemme [
97] (NO, 0.999 MW
el) is part of a liquor industry and is fed with biomass (partly or totally vine pruning). While the electricity is sold to the network, it is more than the energetic demand of the industry, so it virtually covers it. The heat is not recovered yet.
The plant of Predosa [
98] (AL, 0.999 MW
el) produces both electricity and heat; a DH grid has been planned but has not been built yet. It is fed with both virgin wood and wood waste. The biomass is burnt in a boiler.
The plant of Settimo Torinese [
99,
100] (TO, 0.999 MW
el) produces both electricity and heat; a DH grid has been planned but has not been built yet. It is fed with both virgin wood and wood waste. The biomass is burnt in a boiler. The plant is fed with wood chips, including wood from pruning. The electricity and heat are provided to a L’Oreal plant. Some of the heat is also employed for DH. It employs a moving grid furnace and a turbine.
The plant of Torrazza Piedmont [
101] (TO, 0.999 MW
el) produces both 999 kW of electricity and 4095 kW of heat, which is used for DH and to heat greenhouses. It employs a moving grid furnace.
The plant of Villanova Mondovì [
102] (CU, 0.996 MW
el) collects wood from nearby producers and converts it through a gasifier. The wood is fed in the form of wood chips after a drying phase. The plant also produces heat, which is provided through DH to nearby residential areas.
4.4.3. Heat Production
In 2018, Piedmont produced 26,624 TJ of thermal energy from biomass [
9]. According to the GSE atlas [
57], there are 7313 units installed in the region (as already stated, the tool does not allow to filter the units based on the biomass type). There are only 17 units owned by public entities, while all the others are owned by privates. The total installed capacity is 161.9 MW, but the average value is only 22.14 kW. Indeed, only nine units can generate more than 0.5 MW, and only 51 more than 0.1 MW. The nine larger units have the following locations and powers:
Omegna (VB), 3.998 MW;
Torre San Giorgio (CU), 3.980 MW;
Borgosesia (VC), 1.650 MW;
Piverone (TO), 1.394 MW;
Cervasca (CU), 1.204 MW;
Villar Dora (TO), 0.996 MW;
Boves (CU), 656 MW;
Bene Vagienna (CU), 600 MW;
Serravalle Scrivia (AL), 550 MW (public owned).
4.4.4. District Heating
DH is a common technology in Piedmont: 44 municipalities have a form of DH on their territories, with a total grid length of 963 km. In 2017, the installed capacity was 2659 MW [
62], the second highest after Lombardy. Of these, 1007 MW are generated in CHP plants, while 1652 MW are from purely thermal plants. The power is however mainly generated through natural gas: only 60 MW (the 3.6%) were obtained from biomass in 2017. Some of this comes from plants cited in the previous paragraphs.
The administrative centre of Piedmont, Turin, claims to have the largest DH network in Europe [
103]. Its grid has a length of 550 km and serves more than 600,000 people. According to the GSE atlas [
57], it has provided more than 1891 GWh of heat. Of the other existing grids, 20 of these are located in the province of Turin and 12 in the province of Cuneo. The list of the plants can be found in
Supplementary Material Table S2.
4.4.5. Final considerations
Similarly to Lombardy, Piedmont is a notable contributor to the Italian energy system, it is energetically independent and has many positive examples of plants converting solid biomass. Moreover, some biomass gasifiers operate on the territory.
4.5. Aosta Valley
4.5.1. Generalities
Aosta Valley is an autonomous region covering an area of 3.263 km2 and with a population of about 128,000 inhabitants. It is the smallest, least populous, and least densely populated region of Italy and the only one that is not sub-divided into provinces, but 74 only comuni.
Aosta Valley is a mountainous region with the peaks of Mont Blanc (highest peak in Italy, 4810 m), Monte Rosa, Gran Paradiso and the Matterhorn. The valleys are usually above 1600 m have a cold continental climate. The snow season is very long, up to 8 or 9 months in the highest zones. During the summer, mist occurs almost every day with the wettest areas in the western Alps. The region has extensive uninhabitable areas of mountains and glaciers, with a substantial part of the population living in the central valley. According to Istituto Nazionale di Statistica (ISTAT) database, 38.9 inhabitants per km
2 were registered in the region in 2008, whereas the average national figure was 198.8 [
8]. These cold climate conditions and low density of population have led to a high development of DH plants.
In 2018, Aosta Valley produced 3.571 TWh of electrical energy [
13]. The net amount of energy sold to other Italian regions was 2.662 TWh, while the net amount bought from other countries was 0.250 TWh. Thus, the overall amount of energy employed in the region was 0.965 TWh (not including the energy loss and the energy employed for transport). This makes Aosta Valley the Italian region that produces more energy compared to the amount it consumes. This is due to its small population and its large availability of hydroelectric energy. Energy is employed in the agricultural, industrial, tertiary and domestic sectors with shares of 1, 46, 35 and 18% respectively. The electrical energy produced in Aosta Valley (
Figure 8) shows the impressively high use of renewable resources in the area (99%), mostly provided by hydroelectric sources. The efficient net power generated from biomass was 2.9 MW.
4.5.2. Electricity Production
The largest electrical production plant is located in La Thuile. Its nominal power is 718 kW, produced in cogeneration in a DH plant. Three more plants are present in the territory: Pontei (199 kW), Cogne (49 kW) and Avise (1 kW). The total nominal power of electrical energy obtained from biomass is 967 kW.
4.5.3. Heat Production
In 2018, Aosta Valley produced 1450 TJ of thermal energy from biomass [
9]. According to the GSE atlas [
57], there are 535 units installed in the region (as already stated, the tool does not allow to filter the units based on the biomass type), only one owned by public entities. The total installed capacity is 8.9 MW, with an average value of around 20 kW. Only one unit can generate more than 0.5 MW, being the largest of the region. This private boiler fed with pellets is located in Gressoney-La-Trinite’ and provides 0.532 MW.
4.5.4. District Heating
A total of five DH plants are registered in GSE for a total supplied thermal energy of 94,387 MWh and an inserted thermal energy of 119,359 MWh.
One of the largest power plants fed by biomass in the region is in La Thuile (La Thuile Energy). The municipality has 785 inhabitants and it is located at a height of 1441 m. Its thermal production relies on 2 biomass boilers with a unit power of 4.50 MW
th and 4.65 MW
th for a total of 9.15 MW
th. If needed, power from diesel can provide up to an extra 8.00 MWth. The electrical production is done with an Organic Rankine Cycle (ORC) turbine coupled to the boiler which provides 0.7 MW
el, as previously indicated. The total annual biomass consumption is 13,034 t (with a heating value of 8 MJ/kg). The DH network has a length of 21 km with 71 user sub-stations connected and in operation for a total heated volume of 312,510 m
3 and a connected power of 23 MW [
104].
ENGIE, through the project company Telcha, designed and built a 21 km DH network in the city of Aosta, powered by a cogeneration plant that produces 46,000 MWh of thermal energy per year for 230 connected users. The system is integrated with an 18 MW
th heat pump and it is combined with cogeneration with a 7 MW
el gas engine [
105].
The thermal energy demand of the town of Morgex (2000 inhabitants) is widely satisfied with a biomass thermal plant which uses wood chips and virgin wood from Aosta Valley and part of Piedmont [
106]. The plant was installed in 2001 and expanded in 2005. It has a thermal capacity of 9.2 MW through a seasonal 4.4 MW generator and two 2.4 MW each in continuous operation. The DH network has a length of 10 km and provides service to all domestic users as well as schools, health clinics and commercial establishments. This corresponds to a total heated volume of 635,765 m
3 and a connected power of 22 MW [
104]. Interestingly, a 1.1 MW hydroelectric plant can produce energy equal to the needs of about 1700 families showing the high commitment of Morgex with renewable energies.
The city of Pré-Saint-Didier possesses the fourth largest plant in the region. It started its operation in 2008 and has two boilers with a total thermal output of 4.1 MW (1.6 and 2.5 MW each) [
107]. Both generators are in continuous operation and are fed with wood chips from the province of Cuneo with an annual consumption of 5664 t (heating value of 9 MJ/kg). An extra diesel-powered plant has a capacity of 2.5 MW.
The DH network extends for 14 km within the town and feeds 63 users divided into 38 residential civil users (60% of the total), 9 public buildings and 16 linked to the tourism sector. No productive activity is connected to this network. A heated volume of 261,000 m3 is achieved and a connected power of 11,6 MW.
Pollein is the only plant fed by two different types of biomass with a total consumption of 1116 t/y (heating value of 8 MJ/kg). In addition to the main generator that burns wood chips from the Canavese and Cuneo areas, there is a heat recovery unit for the co-generator installed at the nearby regional municipal waste landfill, which is fed with the produced biogas from the natural fermentation of waste.
Overall, the main plant has an installed capacity of 4.1 MW, divided into 2.5 MW for the boiler for annual continuous operation and 1.6 MW for that seasonally switched on. In addition to that, an emergency generator using methane can provide an extra power of 1.6 MW. Moreover, this plant provides power only to productive and tertiary activities. The network provides energy to 22 user substations as craft activities, a shopping centre, offices and a supermarket for a total heated volume of 325,000 m3 and a connected power of 8.35 MW along its 6.4 km.
All the described systems are equipped with wood-chip boilers with a mobile grid and combustion regulation through a Programmable Logic Controller (P.L.C.) to control oxygen and CO and perform continuous combustion analysis to automatically adjust the combustion air and fuel flow when required. Fumes are treated by cyclone and electrostatic filters equipped with plates electrically charged which attract the outgoing dust and discharge it into the ash extraction augers with special vibrators.
For comparison,
Table 5 shows the total energy produced during 2015 in some of the analysed plants [
107].
4.5.5. Final considerations
Due to its geographic location and climate, Aosta Valley largely contributes to the national renewable energy system. In general, DH has replaced a mix of technical solutions consisting of diesel boilers and small devices powered by biomass (mainly domestic stoves and boilers). All plants have combustors with a mobile grid and efficient gas treatment technologies. None of them indicate the use of the sub-products (char, ash).
4.6. Final Comments and Future Directions
The data discussed in the previous sections prove that biomass thermochemical conversion already is an established route to generate renewable energy in North-West Italy. At the same time, there seems to be vast room for the growth of the sector, both qualitatively and quantitatively.
Of the 112 electricity-generating plants that are included in this study, only 5 perform the gasification of the biomass, while all the others rely on combustion technologies. This likely means that gasification is still perceived as unsafe by investors, who prefer more classic plant configurations. As is pointed out in
Section 2, gasification presents noteworthy advantages compared to combustion, and it should be pushed by policymakers to pursue more efficient and clean plants.
There are some positive examples of plants employing residual biomass from the agricultural or wood industries to generate energy. Nonetheless, virgin wood is by far the most employed feedstock for energy generation. Future technological and political efforts should be put on fostering the thermochemical valorisation of residues, which are present in abundance especially in Lombardy and Piedmont. At the same time, plant owners should be able to sell by-products to enhance the economical sustainability of their processes. Some of them already do it, but sometimes the market shifts have impeded this. Given the variability in properties of biomass-derived ash and char, various applications may be proposed, also focusing on more specific options.
From a quantitative point of view, it appears clear that Northwest Italy possesses a vastly underexploited biomass potential. To make this clearer,
Table 6 provides some numerical comparisons between the four regions. For the sake of brevity, only the forest coverage was considered as a representation of biomass availability. This is obviously a simplification, but is enough to point out the extreme differences among the regions in terms of energy generated from solid biomass per forest surface.
The table highlights something that could already be inferred from the previous Sections: Lombardy and Piedmont are virtuous and above the Italian average for the electrical and thermal energy they generate from solid biomass compared to the availability on their territory. Liguria is very unremarkable for its very low exploitation of solid biomass for electricity, which we find to be quite preposterous for a region covered by woods by more than 73%. However, it performs better when heat generation is taken into account. Compared to Liguria, Aosta Valley makes a higher use of its resources for electricity production, and lower for heat production. For this region, we wish to emphasise again that thanks to its massive hydroelectric energy production it already is largely independent.
The previous considerations show that a higher energy generation from solid biomass may positively affect the sustainability and economic wealth of Northwest Italy for the coming years. In regard to this, the latest National Integrated Plan for Energy and Climate [
108], published by the competent Ministries of the Italian government in December 2019, contains some positive and negative considerations. The plan recognises the importance of exploiting biomass to help mitigating climate change. Moreover, it indicates that the level of forest exploitation will gradually shift from the current 30–33% to about 40–45% by 2030. The government also means to foster the exploitation of agricultural residues and short-range biomass. Nonetheless, and in spite of the enormous increase in the generation of solar and wind energy, the plan is not very ambitious for biomass. It is stated that the current biomass electricity production may remain the same by 2030, while the heat and bio-fuels production is expected to moderately increase. However, the focus is on biomass in general, and there is also an indication of the progressive abandonment of some bio-oils, which were deemed as unsustainable. It is hence possible that the production of electricity from solid biomass may moderately increase as well. Finally, the Ministries assert that the DH networks will be expanded by 900 km, reaching a total value of about 5000 km.
A final aspect that needs to be pointed out is that while searching for information on the plants, we also found several articles and petitions of citizens opposing the building of new plants or asking for the shutdown of existing ones. We do not want to comment on the legitimacy of their claims, as it is possible that some plants may have been, willingly or not, poorly managed, thus causing harmful emissions. It is, however, clear that biomass plants have a bad reputation among a certain portion of the population and misinformation about them has been created for years. As the scientific literature has stated multiple times, properly-working biomass plants can generate very clean emissions. It is clear that, for new installations, the population must be properly informed and engaged since the projecting phase.
5. Conclusions
The constraints posed by the total decarbonisation of the economy, necessary by 2050, impose a stage-by-stage path that allows for a progressive elimination of emissions in the atmosphere. The energy system will therefore have to necessarily go through a period of continuous transformations in the next thirty years. For this reason, flexible technological solutions will be required capable of adapting to the increasing energy needs in an energetically efficient way and also capable of increasing the use of renewable energies.
An efficient management of forest and agricultural residues could increase their energetic potential. Also, the transition from the current context to the future energy system needs more sustainable technologies capable of integrating large quantities of energy from renewable sources, with a new coherent approach that integrates and promotes synergies between thermal and electrical energy sectors. It is clear that new and improved combustors and the development at large scale of gasifiers for solid biomass would help in the achievement of the national and EU energy targets. Moreover, the high number of proven applications for the energy valorisation sub-products (char and ash) are encouraging for its valorisation in a circular economy fashion. This may foster the economic viability of the energy process, provided that the legislation is properly adapted.
District heating and cooling should also have an important role in such a scenario. However, the existing technologies should be designed to fully exploit their transformation potential. The development of a fourth generation of district heating at low temperature will allow us to balance generation with energy savings, thus responding to the challenge of supplying heat to increasingly efficient buildings by reducing losses in district heating networks. In addition, these fourth-generation networks might by integrated with intelligent energy systems strongly based on the use of digital processing, the so-called “smart energy system”.
With regard to the Northwest Italy regions, separate observations may be drawn. Liguria stands out as the most evident case of under-exploited potential: it has an enormous potential of wood on its territory, which could be sustainably exploited with various benefits for the regional energy balance, territory management and creation of work. Woods cover its territory for the 73% of its surface, but there is only one plant converting woody biomass into electricity. Aosta Valley is a small region that produces far more energy than its demand thanks to the abundance of hydroelectricity. The region may thus have not much interest in increasing its production. However, the creation of other small DH plants serving the various mountainous villages may enhance the sustainability of the region and foster workplaces in the forestry sector. Finally, Piedmont and Lombardy are in many aspects similar: they produce significant amounts of energy from solid biomass and have several plants on their territory. Nonetheless, their forest and waste biomass are far from being exploited as much as they could be. The construction of new plants and the upgrade of existing ones may bring noteworthy benefits to both of these regions. Given the largeness and diversity of these regions, different provinces may benefit from different solutions, depending on what the territory hosts.
A feature that all the regions share is the lack of gasifiers. We only identified three in Piedmont and two in Lombardy, while all other plants perform a direct combustion of the biomass. Combustion is more established as a technology and thus perceived as safer. However, as pointed out in
Section 2, gasification has notable advantages compared to direct combustion, and should be encouraged for new installations or revamp of existing ones.
To summarize, Northwest Italy could notably benefit from enhancing its biomass thermochemical conversion sector, both from a qualitative and qualitative point of view. This could be quite easily achievable by taking advantage of the largely unexploited biomass potential, both from the forest and agricultural sectors. However, the population must be properly informed and engaged, thus avoiding conflicts based on misinformation or lack of consent. In past years, citizens actively opposed the establishment of new plants based on the perceived risks for their health, and biomass plants seem to have a bad reputation among some Italians. In this framework, the Italian national plant for energy recognises the value of biomass for sustainable energy transition, but at the same time seems to lack ambition, in regard to its exploitation levels, by 2030. Thanks to the approach we established, in the future it may be possible to apply it once again, so as to analyse the sustainability of other macro-regions.


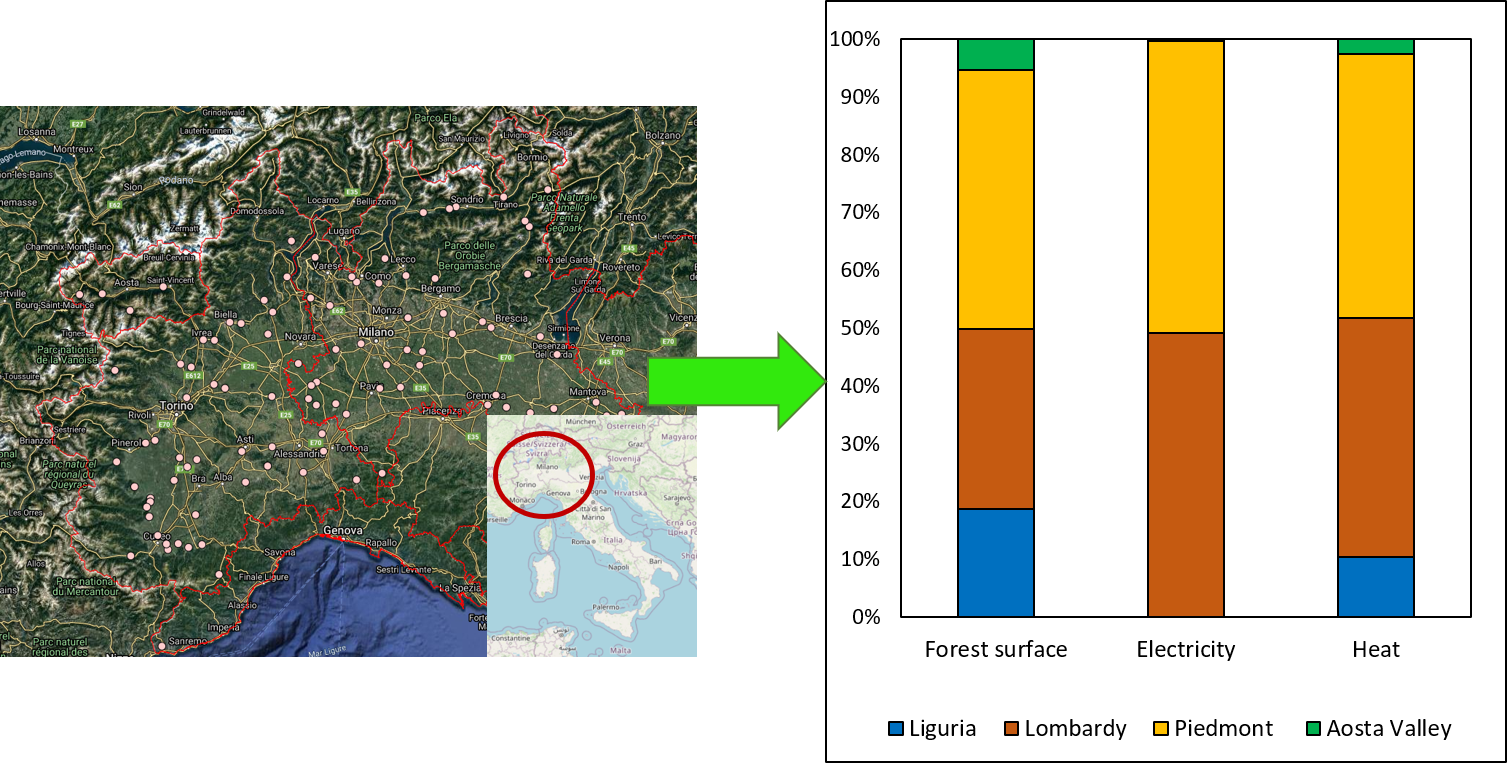
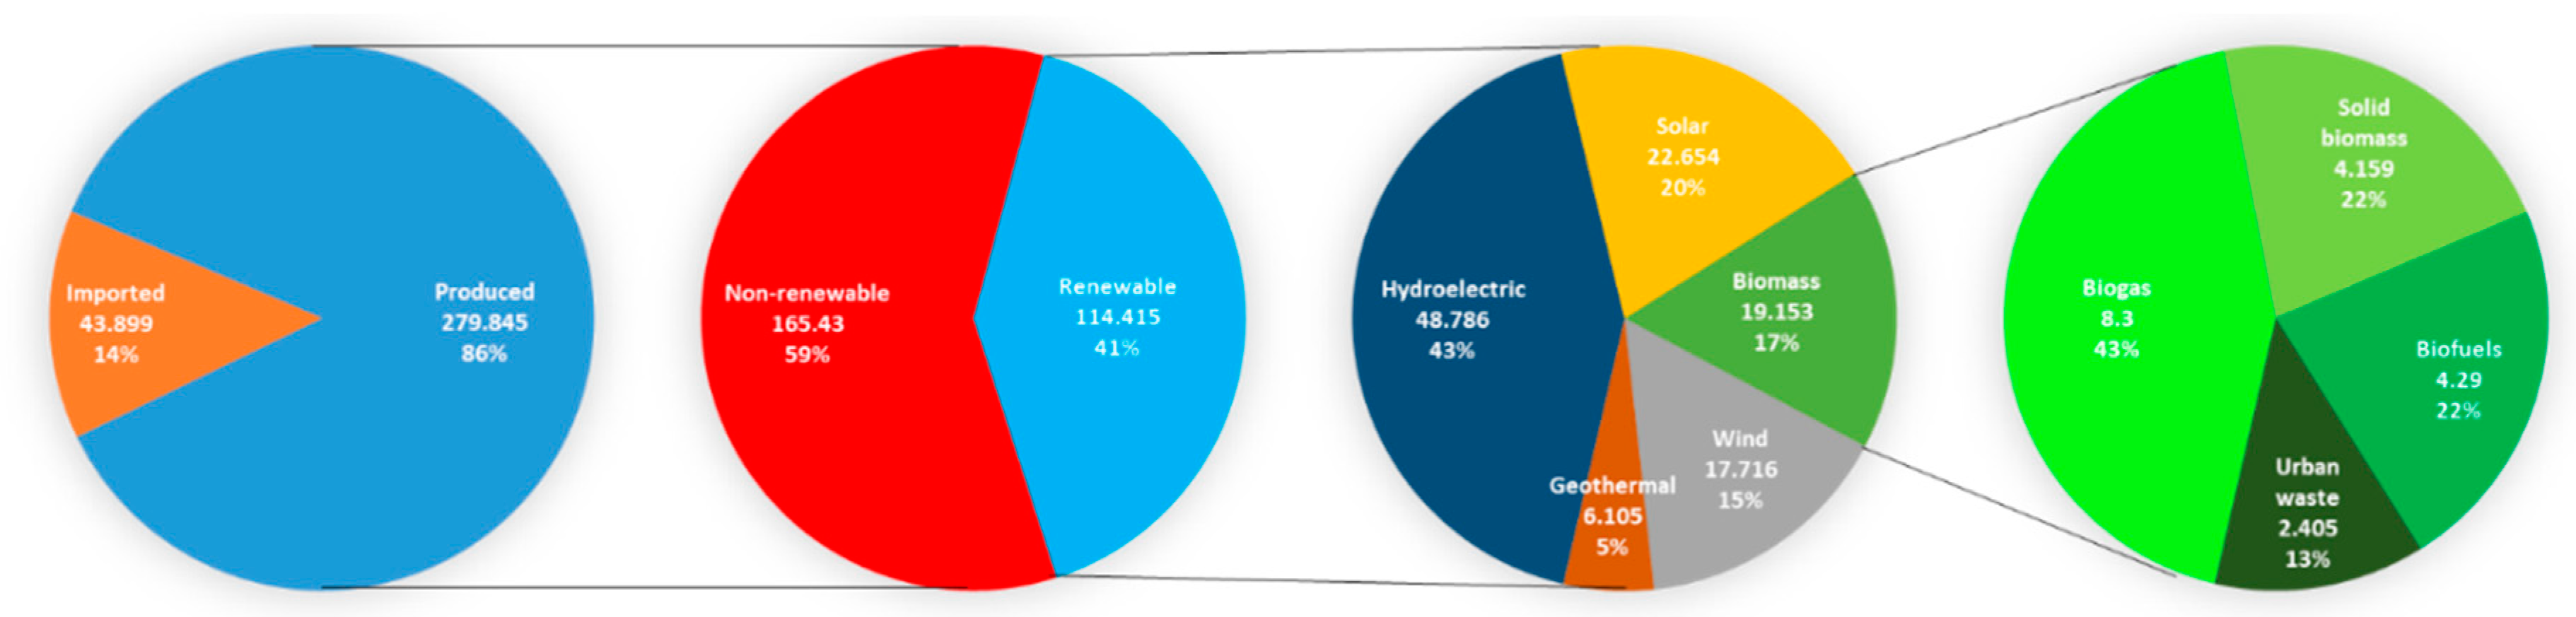
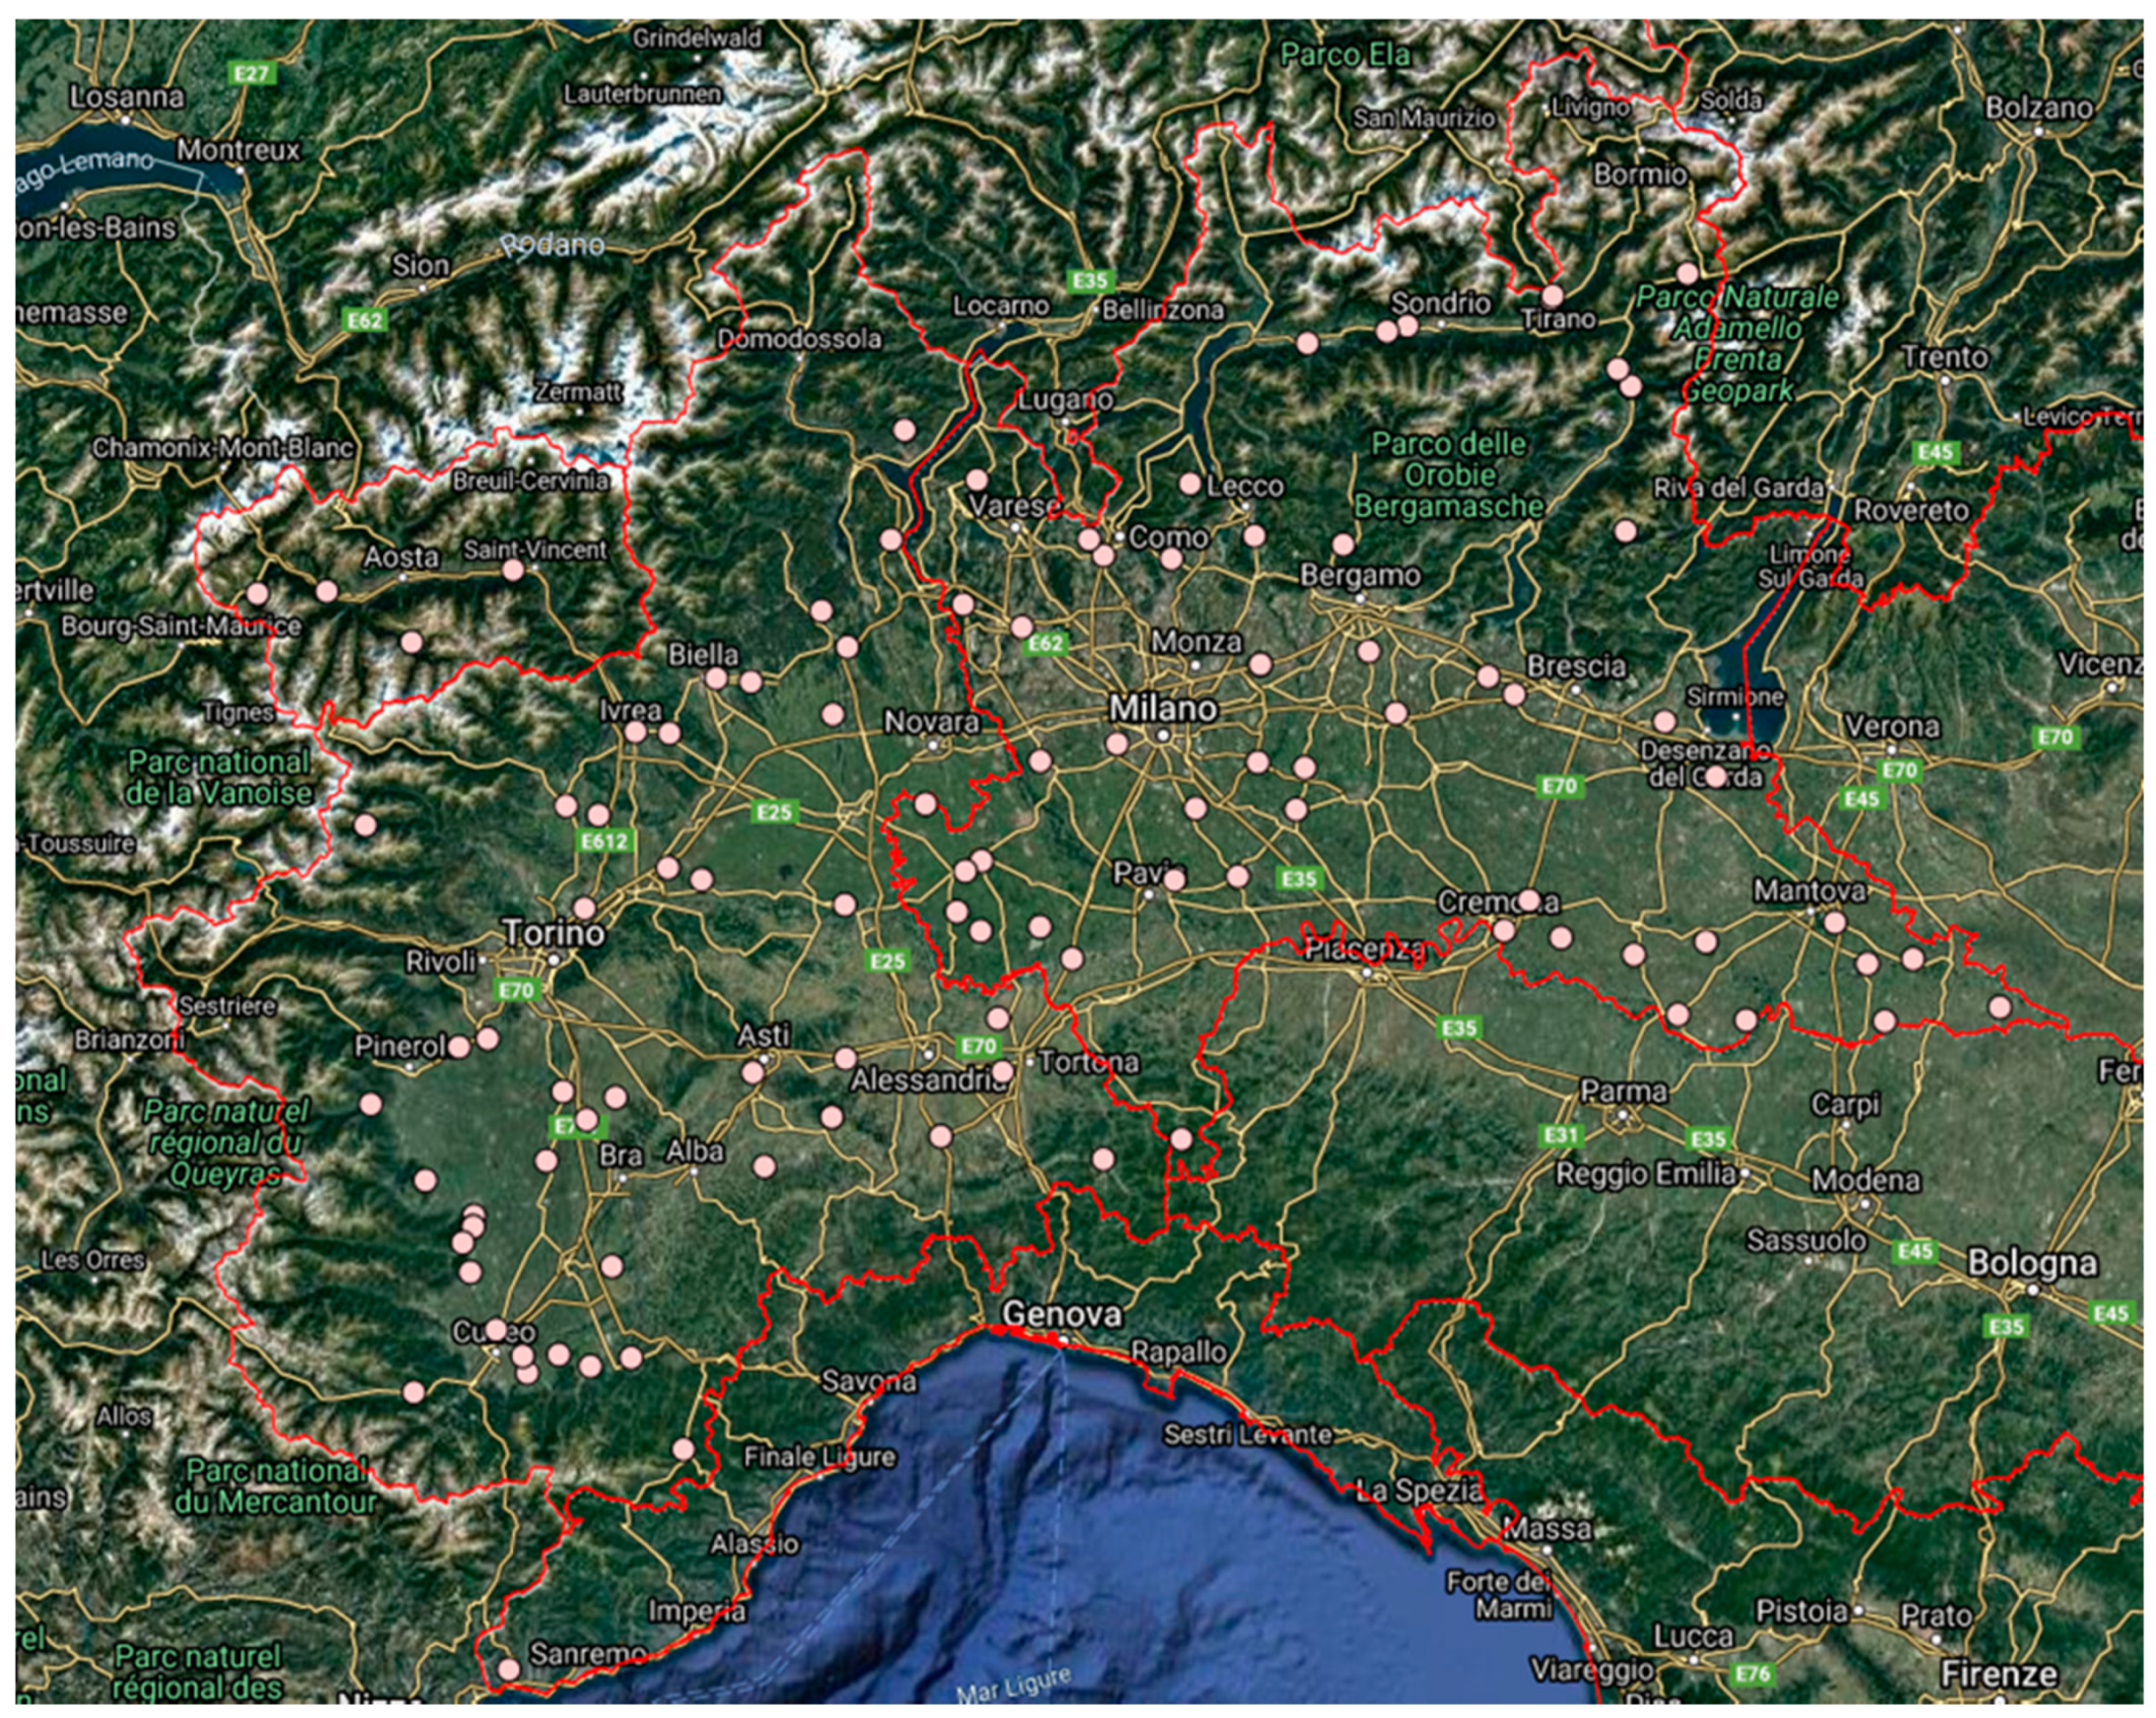
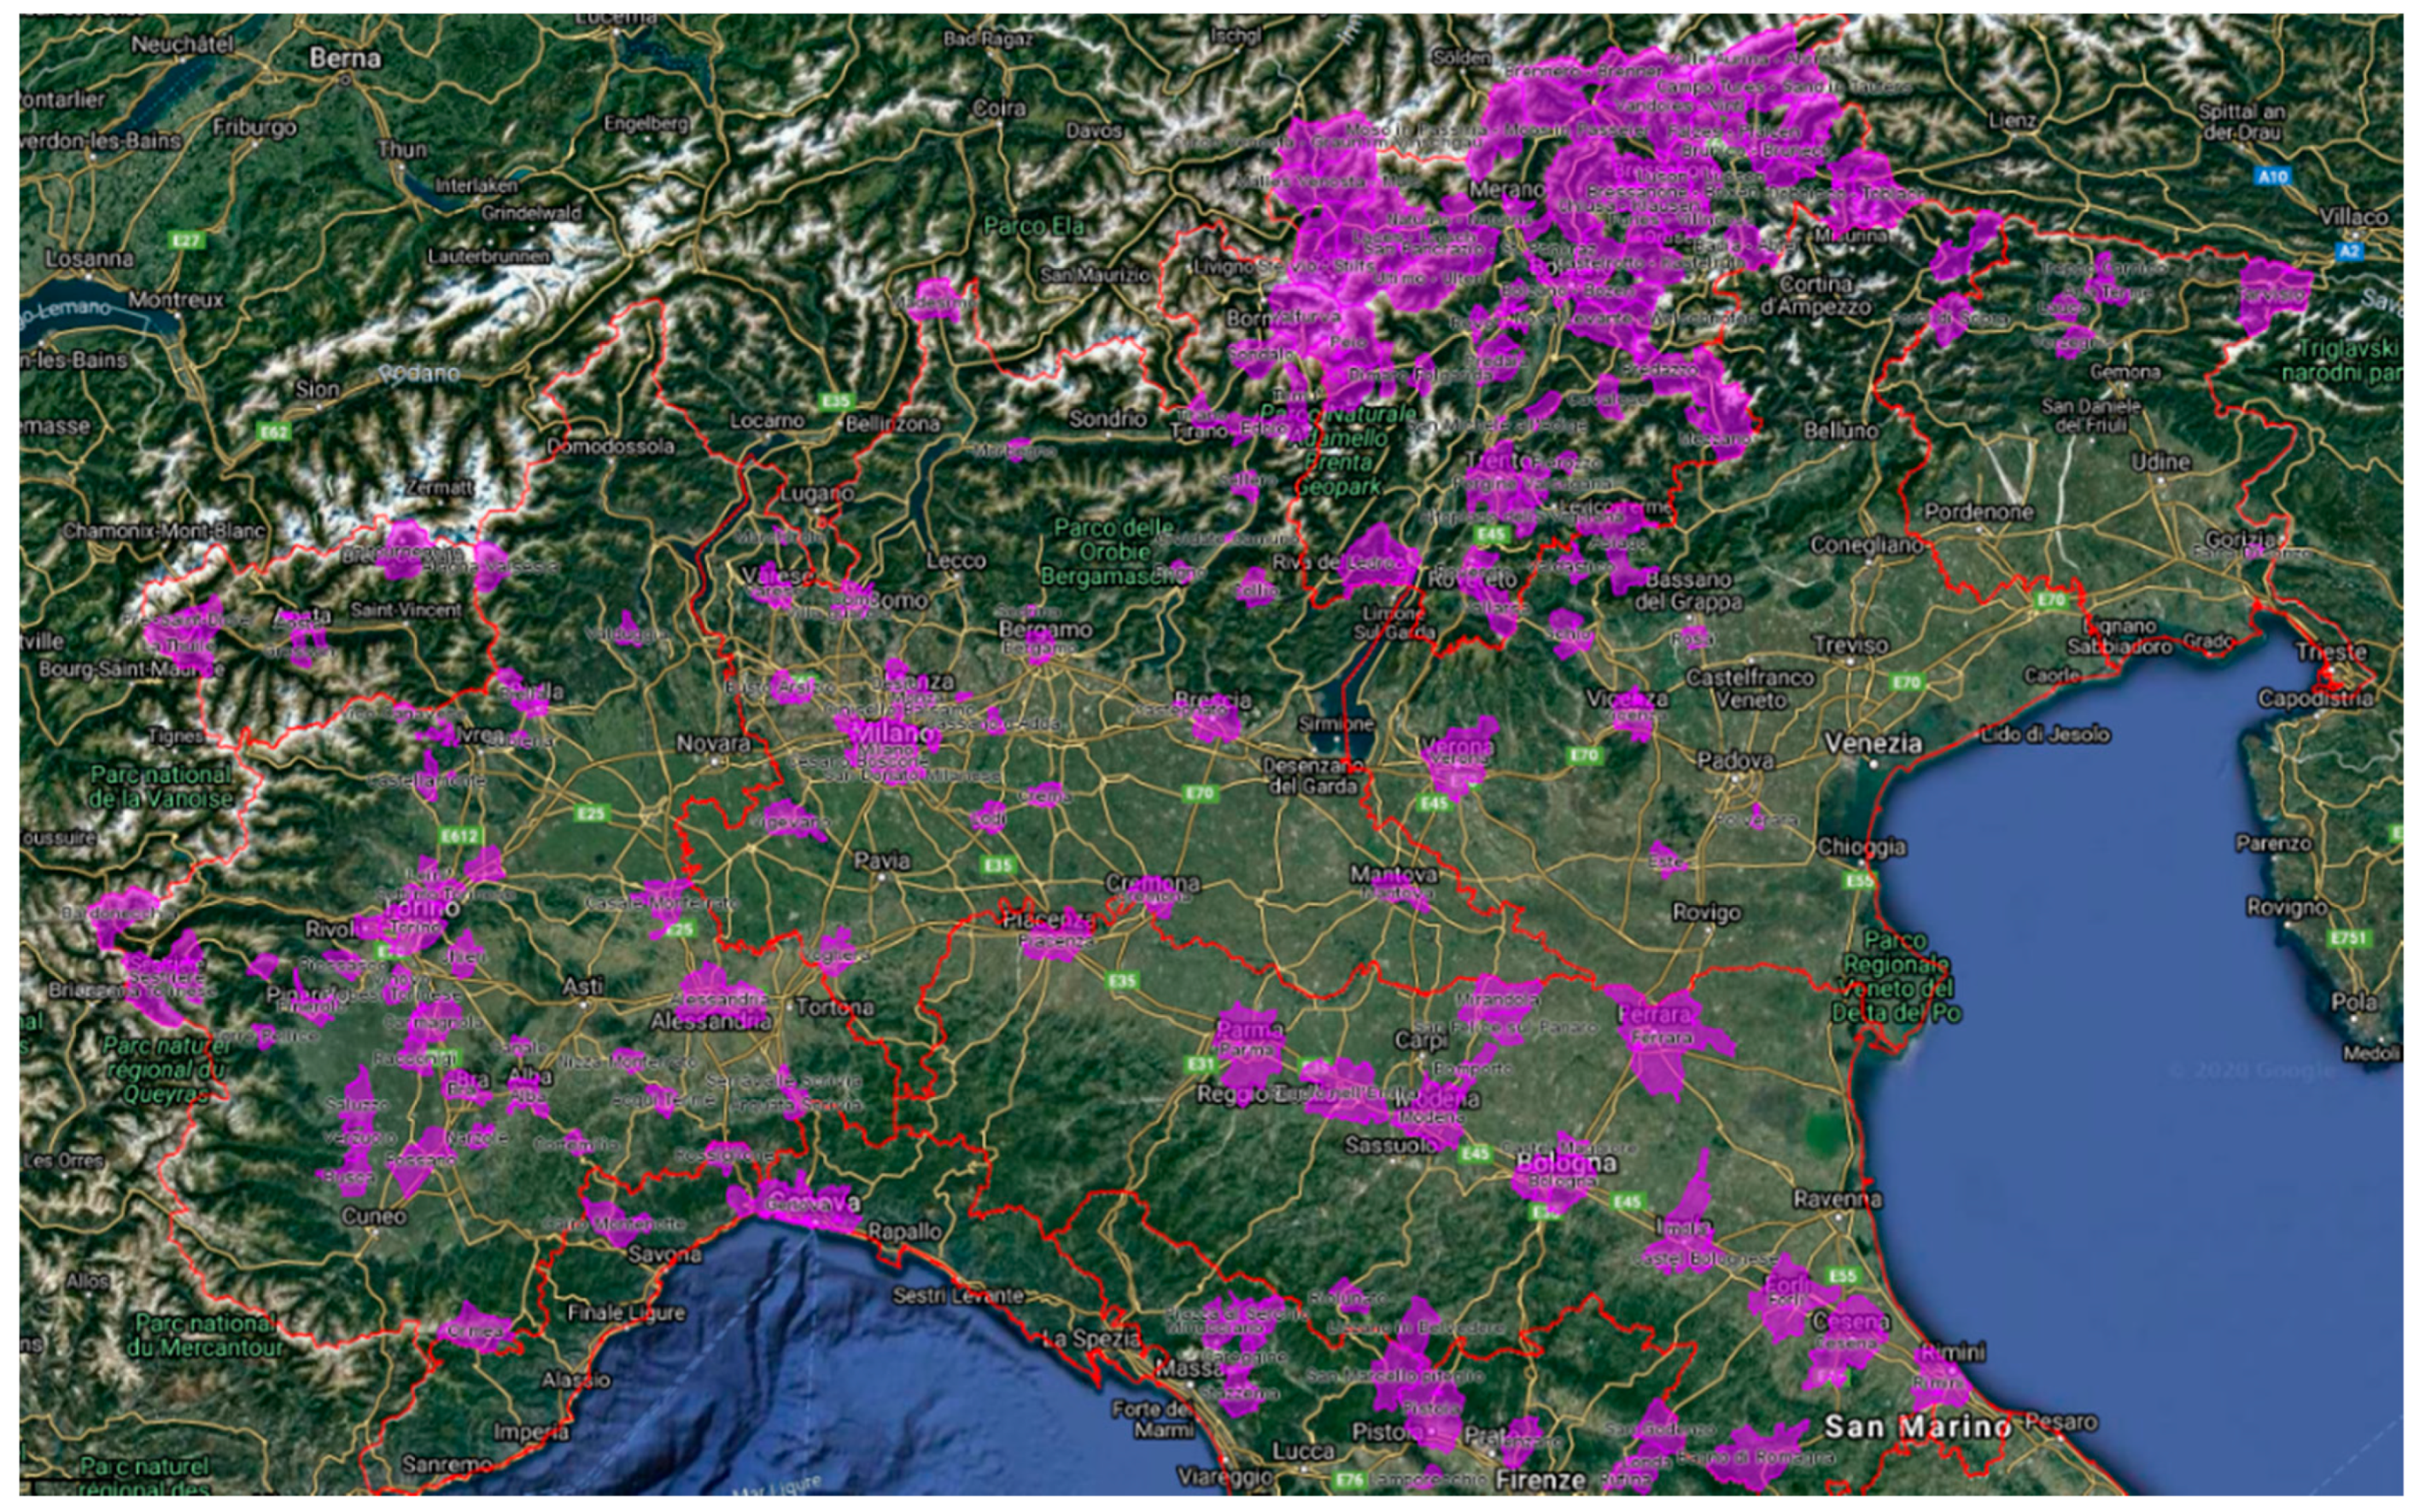
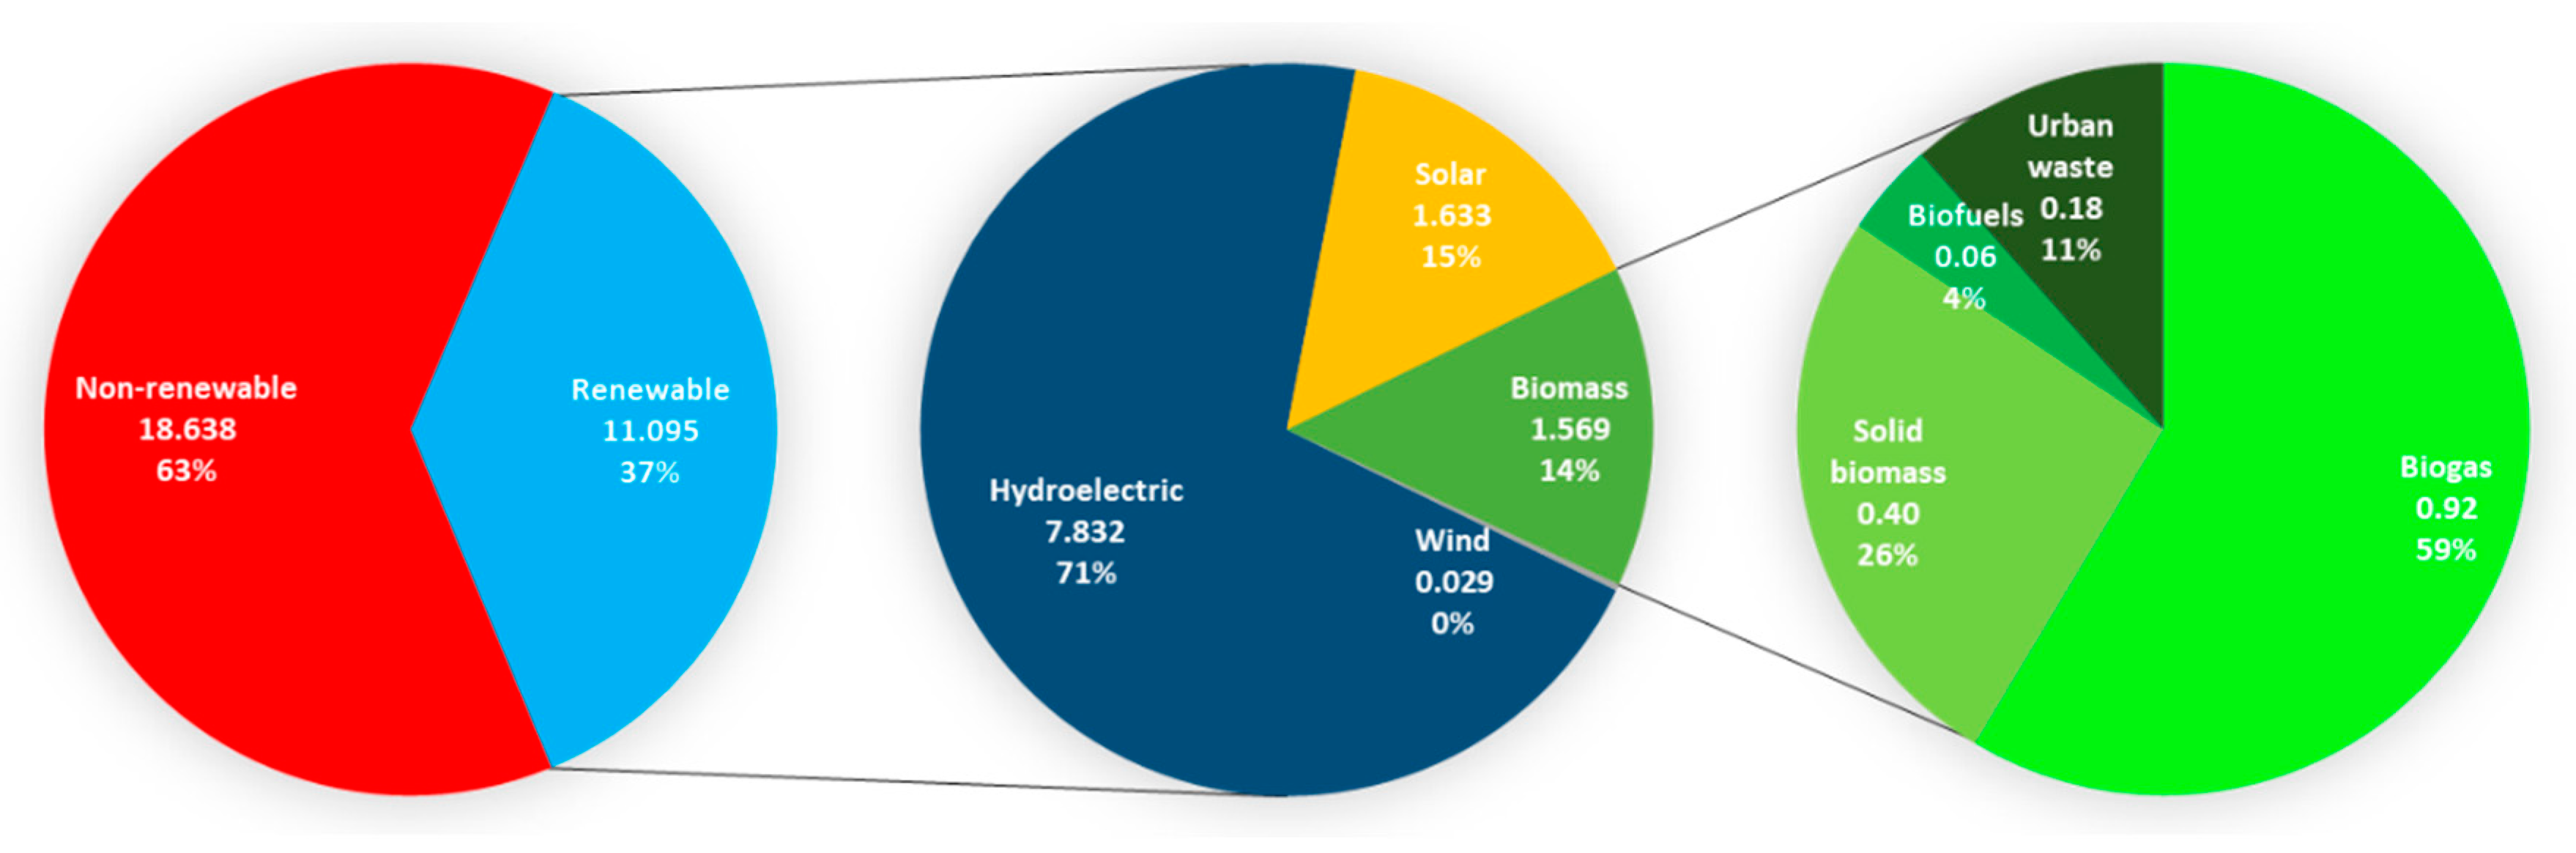