Abstract
Higher speeds, faster acceleration and longer duration need a more realistic driving cycle. As a result, a new test procedure that reflects real-world driving conditions has been applied since 2017, and the previous development environment optimized for NEDC has also changed. In this study, several factors and technologies relating to fuel consumption, such as vehicle weight, tire rolling resistance, drag of aerodynamic, stop–start, and 48 V mild hybrid system, are evaluated as per the new worldwide harmonized light vehicles test procedure (WLTP) and compared with that of the previous European driving cycle (NEDC). The impact of the vehicle weight is increased in case of the WLTP due to faster acceleration compared to that under NEDC. The influence of aerodynamic force is very important as the average and maximum speed are increased. Meanwhile, the impact of idle stop–start technology is lower compared to that under NEDC due to the reduction in idle operation time. The 48-V mild hybrid system is still expected to play a role as a powerful fuel consumption reduction technology under new WLTP by applying energy regeneration, minor torque assist, and extended idle stop–start.
1. Introduction
It has been observed for a long time that exhaust gases emitted under real-world driving conditions are excessive when compared with those measured in a laboratory. Additionally, the worldwide harmonized light vehicles test procedure (WLTP) [1] legislation, which reflects the actual driving factors compared to NEDC [2], was introduced and has been applied since September 2017, owing to the increase in demand for fuel economy and exhaust gas regulations recently triggered by the exhaust gas manipulation incident [3]. Furthermore, the real driving emission (RDE) test, which measures exhaust emissions under actual driving conditions, was enacted to regulate NOx and particle number (PN) emissions.
Based on a report [4] published in 2013 by the International Council on Clean Transportation (ICCT), which first considered excessive NOx emission and requested investigation, the official CO2 emissions by car manufacturers from 2001 to 2015 decreased by approximately 30% (from 170 g to 120 g). However, the actual CO2 emissions on the road were reduced by approximately 10%, from 183 g to 167 g. Hence, this was publicized as a difference of approximately 42% between the officially announced figures and the measured values under actual driving conditions in 2015.
This difference can be due to the exploitation of a loophole by the vehicle manufacturers during the fuel consumption test for certification. Furthermore, actual road conditions vary considerably and are worse than lab conditions. This, in turn, results in high exhaust gas and fuel consumption. Therefore, the Economic Commission for Europe enacted and implemented the WLTP, which is more representative of real-world driving conditions compared to NEDC used for measuring exhaust gas and greenhouse gas, for newly manufactured vehicles effective September 2017. Additionally, the necessity of the test for exhaust gas and fuel consumption under actual road conditions was established. The Technical Committee on Motor Vehicles determined the test timing and applicable standards for the RDE test.
When WLTP mode was applied, it was determined that CO2 emission unavoidably increased when compared to the values measured under NEDC to driving cycle, gear transmission (MT cars), air temperature, vehicle load, and other factors as shown in Table 1 [5]. Specifically, in case of diesel vehicles, the fuel consumption was further worsened because the EGR operation range was expanded until the load on the engine was high enough to reduce NOx and cope with the RDE mode that examines exhaust gas on actual roads.

Table 1.
Parameters with potential impact on CO2 emissions with different definitions in NEDC and WLTP [5].
Yu et al. [6] analyzed driving characteristics in major cities in China by using traffic information and compared their results with those obtained from the WLTC mode. They conducted tests with NEDC and WLTC modes for 30 different car models to verify the effect of the cycles on the fuel consumption. Their results are similar to those in Table 2 [5], which are provided by ICCT. The results consider the effect of different test loads and ambient temperature on fuel consumption.

Table 2.
Total estimated impact of switching from NEDC to WLTP [5].
Piotr et al. [7] compared the emission levels in case of the NEDC, FTP-75, and WLTP modes for gasoline and diesel cars. A switch from NEDC to WLTC revealed changes in NOx, PM, and PN, which were higher than those in THC, CO, and CO2. However, their results were limited to Euro5 and Euro6 compliant cars. In another study by Piotr et al. [8], they measured the fuel consumption as per each mode for five different car models. The results revealed that the fuel consumption was the lowest under the NEDC mode for cars with manual transmission. However, the results were still insufficient to verify the fuel consumption based on cycle difference because of the different vehicle types (weight, tractive resistance) and engine displacements.
Melo et al. [9] compared the fuel consumptions for three types of driving cycles for internal combustion engines, hybrid electric vehicles (HEVs), and electric vehicle (EVs). They described the difference in the fuel consumption between NEDC and WLTC as approximately 9.5–13.5% for internal combustion engines. However, this result was not obtained via experiment. They utilized the CO2 data that were available online at JATO Dynamics. Therefore, the results could include various deviations and could not explain the effect of test cycle sufficiently.
Sarp et al. [10] examined the effect of seven types of driving cycles, namely, NYCC, FTP75, NEDC, WLTC, US06, HWFET, and CADC, for cars with eight power train technologies. Hence, some improvements were expected for all cycles in the Miller cycle and downsizing engines. A prominent improvement was obtained under low-speed zones, such as downtown operation of HEVs and EVs.
The aforementioned studies [11] analyzed the effects of various power train types and driving cycles. However, the results were not validated via testing. Furthermore, many researchers proposed that experimental results are only for cars that comply with the existing emission regulations, such as Euro5 or Euro6. Therefore, there were very rare cases, which is the result for the specification satisfied the latest regulations, such as Euro6d-temp.
Pavlovic et al. [11] carried on tests and simulations on several cases to assess the potential total impact on the final reported type-approval CO2 emissions. The analysis showed the biggest impact on CO2 is coming from the changes in the road load determination procedure (~10% increase) and procedural changes concerning the test in the lab will bring another 8% and post-processing and declaration of results will result in difference of approximately 5%. Overall, the WLTP is likely to increase to the NEDC CO2 emissions by approximately 25%. However, they did not provide quantitative input values, so it was difficult to grasp the CO2 impact for each factor.
Pavlovic et al. [12] also tested the NEDC and WLTP cycle with vehicles that comply with Euro 6 emission standard. The worst case (TMH, test mass high) showed CO2 emission and energy demands to be on average 11% and 44% higher than NEDC, respectively, and best scenario (TML, test mass low) has on average 1% higher CO2 emissions. Their results also showed that higher vehicle inertia and road load along with the higher speed are the key parameters of the new procedure that contribute to the increased CO2 emissions. However, their study was the result of testing vehicles that met Euro 5 and 6 regulations.
The objective of this paper was to investigate the different effect of factors and technologies related to fuel consumption between NEDC and WLTP modes. In this study, 1.6 L gasoline and diesel engine vehicles that meet the latest Euro-6d temp regulations were applied to clarify the contribution of fuel consumption parameters such as vehicle weight, tire rolling resistance, air resistance and idle stop-start under NEDC and WLTP. In order to analyze the qualitative and quantitative impact of these factors, a commercial AVL simulation tool was used, and vehicle tests were performed simultaneously to complement the previous research relied on simulation method. In addition, the recently spotlighted 48 V system was applied to diesel vehicle, and tests were conducted to investigate the quantitative fuel consumption effects on energy recovery, torque assist and extended idle stop-start technology by 48 V MHSG (mild hybrid starter and generator) machine. From this research, we clarified the effective factors which has good effect on better fuel economy.
2. Simulation and Experimental Method
The test vehicles used in this study were compact SUV with 1.6-L gasoline turbo and diesel engine (Table 3), dry type 7-speed dual clutch transmission with idle stop–start technology. The catalyst selection and ECU calibration to comply with the Euro 6d-temp exhaust regulation were completed.

Table 3.
Engine specifications in the test car.
The fuel consumption simulation was conducted using CRUISETM from AVL, as shown in Figure 1. Furthermore, actual measurement data obtained from the gasoline/diesel engine and transmission efficiency at each gear were used for fuel consumption simulation. Additionally, real ECU/TCU mapping data such as desired torque map, gear shift pattern, and target fuel cut-in speed were applied to perform sophisticated analysis.
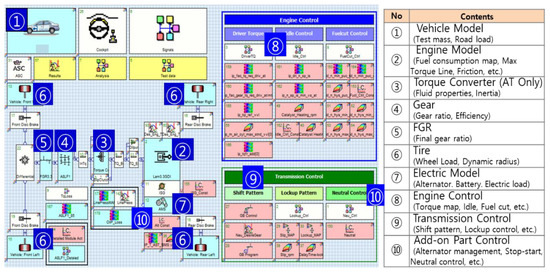
Figure 1.
Vehicle simulation model by AVL CRUISETM.
Prior to vehicle test on chassis dynamometer, the full load performance and BSFC of gasoline and diesel engine were measured through engine dynamometer. Transmission efficiency was also measured for various speeds and input torques.
Figure 2 shows the maximum torque and power curve of gasoline and diesel engines and the fuel consumption rate applied in this study. Specifically, the diesel engine exhibited a lower fuel consumption rate by approximately 8–18% than the gasoline at BMEP 4bar (50~51 Nm).
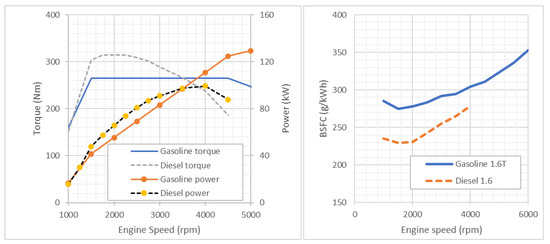
Figure 2.
Full load performance and brake specific fuel consumption at TQ = 50.6 and 50.9 Nm (Gasoline/Diesel).
Figure 3 shows the average transmission efficiency at each speed with respect to the transmission fluid temperature. Specifically, the 7th speed has 5% higher transmission efficiency at 70 °C than at 40 °C.

Figure 3.
Average transmission efficiency at each gear speed with respect to fluid temperature.
To analyze the attribution of the test condition factors, the effect of the road load with respect to the changes in the vehicle weight, drag coefficient, and tire rolling resistance were estimated. The validation test was also conducted with actual vehicles. The calculation method of the road load is as follows.
The road load of the cars consists of mechanical drag and aerodynamic drag as shown in SAE J2263. Furthermore, the mechanical drag is composed of the tire rolling resistance, which is not associated with the vehicle speed and factors that are proportional to vehicle speed. Thus, air resistance was configured to be proportional to the square of the vehicle speed. However, the drag coefficient was modeled as a fifth order function of the yaw angle of the crosswind to the vehicle. Thus, in our case, temperature compensation was applied only for coefficients A and C, which differs from that prescribed by SAE. Thus, the reference air pressure value applied for coefficient C was also different.
Additionally, the actual measurement value was used for the projected front area of the vehicle. Table 4 shows the coefficient of drag for different tire types and options for the vehicle used in this study. Each Cd value was measured in a wind tunnel. In this study, coastdown tests were conducted on the 16-inch base option with the lowest Cd and 19-inch with the highest Cd.

Table 4.
Coefficients of drag for each tire type and option.
We used VMS3200 to measure coastdown time on track. An on-board anemometer was specifically used to measure wind direction and velocity in real driving conditions. Figure 4 shows the coastdown measurement equipment and the requirements and accuracy of the measurement system.
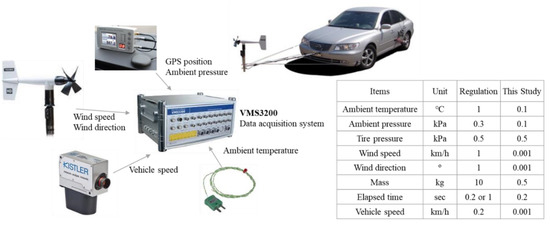
Figure 4.
Coastdown test measurement system and its accuracy.
Subsequently, the neutral coasting time from 135 to 15 km/h, vehicle speed, wind velocity (speed, direction), and ambient temperature were measured five times in both directions of the straight road. Thus, they were measured a total of ten times. The measurements were used to calculate a total of eight unknown coefficients (Am, Bm, Cm, a0, a1, a2, a3, and a4) via a linear regression method. These coefficients were calibrated at standard temperature and atmospheric pressure conditions before the final road load coefficient was determined. The final road load coefficient was proportional to the second order of the vehicle speed (Figure 5 and Equation (1)).
where Me: Effective Vehicle Mass, dV/dt: Acceleration, V: Vehicle Velocity, Vr: Apparent Wind Relative to Vehicle, Cd(Y): Coefficient of Aerodynamic drag at Yaw angle Y.
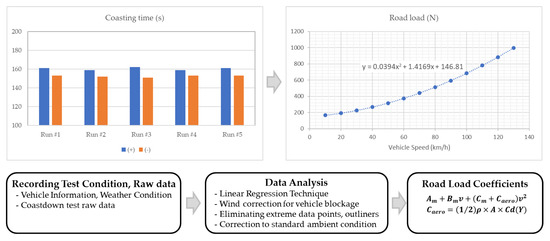
Figure 5.
Worldwide harmonized light vehicles test procedure (WLTP) road load determination via coastdown method.
The equation to determine the road load for the NEDC test, as per (EU) 2018/1002 regulation using the WLTP tractive resistances (calculated above) is presented in Table 5. From NEDC to WLTP, the cycle energy increased by approximately 2.6–2.7 times based on the weight, average speed, and increases in the speed variation.

Table 5.
Factors for fuel consumption contribution analysis in NEDC and WLTP.
In this study, the fuel consumption in NEDC and WLTP was investigated with respect to vehicle weight, drag of coefficient, tire RRc(rolling resistance coefficient), Idle stop–start and 48-V system. Specifically, the vehicle weight, Cd, and tire RRc increased and decreased by 10% relative to the base TML (Test mass low) (Table 5).
Figure 6 shows the relation between vehicle road load and tire size used in this test and simulation. Additionally, the driving energy per distance of the test cycle is shown in this figure. The driving energy is calculated by integrating the road load with respect to the speed of the driving cycle, i.e., NEDC or WLTP.
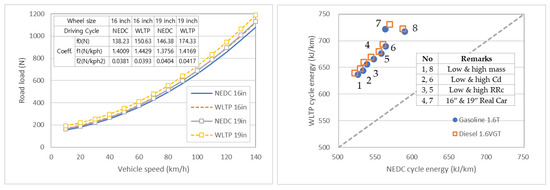
Figure 6.
Road load curve and driving energy per distance according to the test cycle.
Figure 7 shows the overall schematic diagram of the chassis dynamometer and exhaust gas analyzer used for exhaust emissions and fuel consumption in this study. Measurement of vehicle emission gas was performed with a CVS (constant volume sampler) tunnel and emission gas analyzer. In the chassis dynamometer, real-time emission gas and vehicle data were collected for each driving speed by driving in the NEDC and WLTP modes. Furthermore, the final exhaust gas concentration was analyzed via the analysis of the sampling bag containing the exhaust gas. Gasoline and diesel fuel consumption were calculated by using carbon balanced Equations (2) and (3).
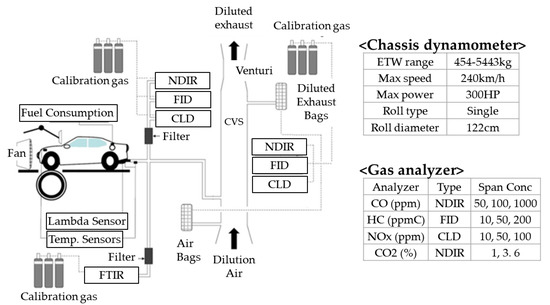
Figure 7.
Schematic diagram of chassis dynamometer and emission measurement system.
3. Results and Discussion
Prior to this study, repeated tests were conducted to confirm the deviation of fuel consumption test in the chassis dynamometer. Given that this study only tested in test mass low (TML) and Test mass high (TMH) conditions for gasoline and diesel engines, it was necessary to check the errors in the test results. Based on the results of five repeated tests, under NEDC and WLTP modes, for 1.6 T gasoline engine, the standard deviation of NEDC was approximately 0.009(0.11%), and the standard deviation of WLTP was approximately 0.016(0.21%)
Figure 8 and Figure 9 present all the simulation and experimental results conducted for NEDC and WLTP modes for the gasoline and diesel engine vehicles in this study. From these simulation and experimental results, we found that the test results can be used to determine the reliability and appropriateness of the simulation results.
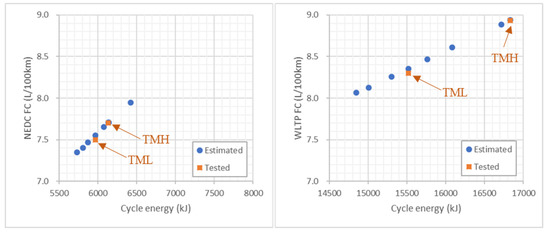
Figure 8.
Fuel consumption under NEDC and WLTP according to the cycle energy of 1.6-L gasoline T-GDI.
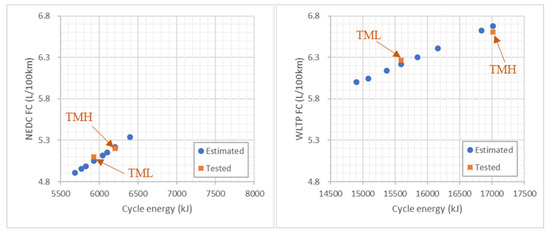
Figure 9.
Fuel consumption under NEDC and WLTP according to the cycle energy of the 1.6-L diesel engine.
The effects of NEDC and WLTP mode on the fuel consumption with respect to road load factors, idle stop–start, and 48-V system technology are explained below.
3.1. Driving Cycle Effect
To determine the cycle energy according to the drive mode, the road load and test vehicle weight were considered. A margin of 3% was provided on the test vehicle weight by considering the rotational inertia of the wheel and tire.
Figure 10 shows the speed and acceleration between WLTP and NEDC modes. The maximum acceleration under the WLTP condition tended to increase according to drive cycle difference. Table 6 indicates the cycle energy and CO2 effect by simulation under two modes. The cycle energy of WLTP increased by 18% than that of NEDC mode. From the simulation result of WLTP mode, CO2 effect increased by 2.7–3.0% for the diesel vehicles and by 4.8–4.9% for the gasoline turbo vehicle when compared with the results under the NEDC condition. According to Pavlovic et al. [11], the effect of the cycle difference was 5.88% for gasoline and 5.24% for diesel vehicle. In case of diesel vehicle, the effect may vary depending on the engine displacement.
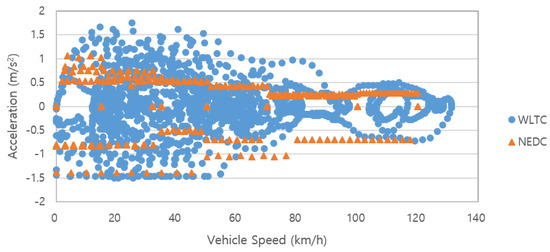
Figure 10.
Speed and acceleration of WLTC and NEDC.

Table 6.
Cycle energy and CO2 effect by simulation according to the test mode (per test mass of 1718 kg, f0 = 150.632 N, f1 = 1.44292 N/kph, f2 = 0.039255 N/kph2).
Figure 11 and Figure 12 show the distribution of the operating time and fuel amount for gasoline and diesel vehicle under NEDC and WLTP cycles. In this figure, the darkness in shade means high contribution. The engine operation zone significantly increased under WLTP compared to that under NEDC, due to increases in engine load and speed. In particular, the dotted line is an additionally expanded area compared to NEDC. In the case of the diesel engine, due to the increase in high load operating time, the EGR operation zone and operating time for reducing NOx emissions were increased. Thus, this resulted in the deterioration of fuel consumption.
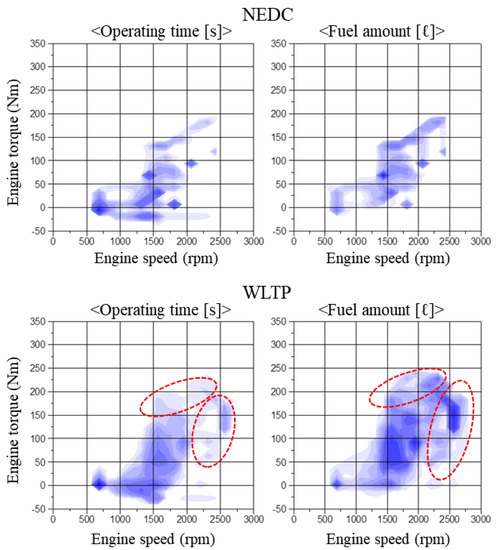
Figure 11.
Operation time and fuel amount according to the driving cycle of the gasoline vehicle.
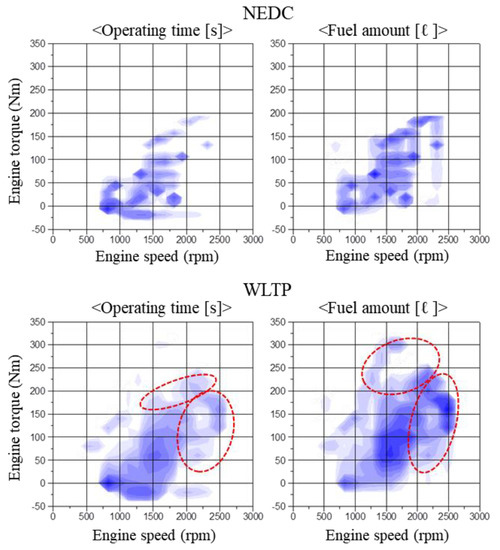
Figure 12.
Operation time and fuel amount according to the driving cycle of the diesel vehicle.
However, under the WLTP mode, the fuel amount did not degrade because the running time under warmed engine condition was increased compared to NEDC. Figure 13 shows the behavior of the coolant and engine oil temperatures per test cycle mode for the diesel vehicle. Figure 14 shows the distribution of the coolant and oil temperatures. The operating time was increased above 80 °C and engine operates under better engine efficiency in the WTLP mode compared to NEDC. This result does not imply that WLTP mode itself always increases fuel consumption rate [L/100 km].
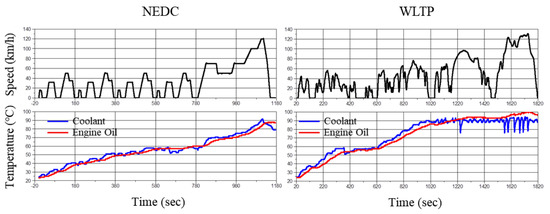
Figure 13.
Coolant and engine oil temperature distribution according to the test cycle.

Figure 14.
Operation time and fuel amount according to coolant and engine oil temperature (Diesel 1.6 VGT engine).
3.2. Test Mass Effect
In the case of the new regulations, the test vehicle weight was changed to that of cars that are currently available for sale. Hence, based on the existing NEDC, the test vehicle weight was the equivalent test weight (ETW) according to the reference mass (RM). Meanwhile, with the new WLTP regulation, the test mass was determined considering the RM, gross vehicle weight (GVW), and full option weight.
In the case of the vehicles used in this study, the test mass was increased by 18–74 kg for the minimum option and by 213–227 kg for the maximum option with respect to the test mass in the existing regulation, as shown in Table 7.

Table 7.
Determination of the test mass.
As the test mass and maximum acceleration were significantly increased in WLTP when compared with those of NEDC, the vehicles consumed more fuel in the acceleration zone. Specifically, increases in test mass affected the tire rolling resistance additionally. This was attributed to the increases in fuel consumption at constant speed. Figure 15 and Figure 16 show the contribution of the fuel consumption to the driving conditions with respect to the drive modes for gasoline and diesel vehicle. The fuel consumption increased during acceleration, and the contribution in the overall fuel consumption was also increased by 5–6% in both types of vehicles.

Figure 15.
Contribution of the fuel consumption to the driving conditions (1.6 L turbo gasoline).

Figure 16.
Contribution of the fuel consumption to the driving conditions (1.6 L diesel).
The effects of the test mass on the cycle energy and fuel consumption are presented in Figure 17 and Figure 18. Once road load is determined from coastdown testing, the road coefficients for NEDC are determined according to the regulation. Therefore, the energy can differ under the NEDC cycle even with the same NEDC ETW. Based on the NEDC test weight, the cycle energy values differed by 4.0–7.8%, and the fuel consumption differed by 2.7–5.7% with NEDC. For WLTP, the cycle energy increased by approximately 4% when the road load increased by 10%. Consequently, the fuel consumption increased by approximately 6.4–6.6%.
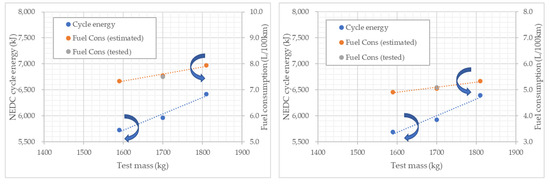
Figure 17.
Effect of the test mass on the energy and fuel consumption in NEDC (left/right: gasoline/diesel).
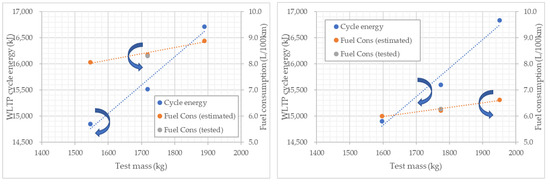
Figure 18.
Effect of the test mass on the energy and fuel consumption in WLTP (left/right: gasoline/diesel).
Test mass is the most influential factor in fuel consumption in each test cycle, and Pavlovic et al. [12] and Moon et al. [13] also showed similar trends in their simulation and test.
3.3. Tire Rolling Resistance Effect
The tire rolling resistance is usually less affected by vehicle speed. The effects of the tire rolling resistance on the cycle energy and fuel consumption are shown in Figure 19 and Figure 20. When the tire rolling resistance was changed by 10%, the cycle energy was changed by approximately 1.7–1.9% under NEDC. On the other hand, it was changed by approximately 2% under WLTP. However, the fuel consumption effect in both cycles were similar as 1.1–1.4%. Dimaratos et al. [14] also showed that limitation of rolling resistance by 10% offers a fuel consumption benefit of 1.2% and 2.2% in NEDC and WLTP, respectively, in diesel vehicle simulation results.

Figure 19.
Effect of the tire rolling resistance on the cycle energy and fuel consumption in NEDC (left/right: gasoline/diesel).
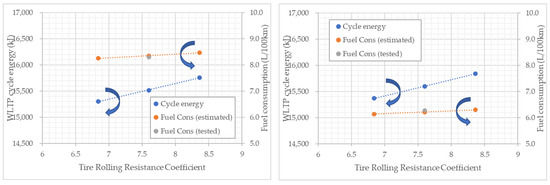
Figure 20.
Effect of the tire rolling resistance on the cycle energy and fuel consumption in WLTP (left/right: gasoline/diesel).
3.4. Coefficeient of Drag Effect
Aerodynamic drag typically increases as a secondary function of vehicle speed. Therefore, it affects fuel consumption during a high-speed driving condition, such as on a highway.
The effects of the aerodynamic drag (drag coefficient) on the cycle energy and fuel consumption are presented in Figure 21 and Figure 22. As the drag coefficient was modified by 10%, the cycle energy changed by 2.7–3.0% in the NEDC, while it changed by 3.3–3.6% in WLTP. Accordingly, the fuel consumptions in NEDC were changed by 1.9–2.1% and 2.7–3.1% in WLTP. The increased effect of aerodynamics might be due to increases in the average speed and maximum speed in WLTP when compared with those in NEDC. Dimaratos et al. [14] presented that 10% reduction in aerodynamic force decreases fuel consumption by 2% and 2.8% in NEDC and WLTP, respectively.
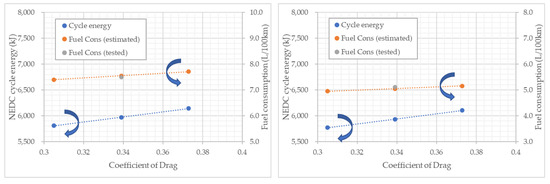
Figure 21.
Effect of the aerodynamic drag (drag coefficient) on the cycle energy and fuel consumption in the NEDC mode (left/right: gasoline/diesel).
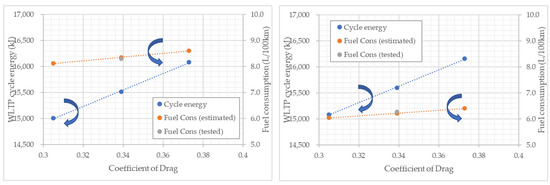
Figure 22.
Effect of the aerodynamic drag (drag coefficient) on the cycle energy and fuel consumption in WLTP (left/right: gasoline/diesel).
The influence of the vehicle’s drag coefficient on fuel consumption went up in WLTP regardless of the type of engine, and Pavlovic et al. [12] also showed an increase in the impact of aerodynamics on fuel consumption from NEDC to WLTP. Moon et al. [13] and Dimaratos et al. [14] also showed similar results through their simulation analysis.
3.5. Effect of Idle Stop-Start Technology
The idle stop–start technology, which is common in the European market but not in the North American market, stops engine operation when a vehicle is stopped, to reduce emissions and save fuel consumption. Given that the idle stop frequency is higher by approximately 24% in the NEDC mode, the fuel consumption effect of the idle stop–start technology is known to be high. Meanwhile, under the WLTP mode, the idle stop frequency is approximately 13% of the total modes, the vehicle weight and drive speed are increased, and the fuel consumption required for driving is increased. Therefore, the effect of idle stop–start technology is reduced when compared to that under the NEDC mode. The effects of the idle stop–start on the fuel consumptions of 1.6-L gasoline and diesel engines for each test cycle are presented in Table 8. By changing the test cycle, the effect of idle stop–start technology was reduced by approximately 2.0–2.5%. It is still a useful tool to ensure compliance with the CAFE regulation and lower fuel consumption in urban driving condition. Dimaratos et al. [14] also showed the effect of stop-start on CO2 emissions is 2.5~4.8% in NEDC and 1.2~2.6% in WLTP. Stop-start technology definitely has a stronger effect on NEDC, owing to the longer idling period compared to WLTP.

Table 8.
Comparison of fuel consumption for idle stop–start by test cycle.
3.6. Effect of the 48-V System
A P0 type of 48-V system was implemented on the diesel 1.6-L engine. For the 10-kW grade MHSG (mild hybrid starter and generator), the electric energy with the regenerative braking was stored during deceleration to assist the torque in starting-and-stopping and driving and to reduce fuel consumption by replacing the electric energy required for driving the vehicle. The idle stop–start technology was applied in the zone with speeds lower than 20 kph during deceleration. This is to ensure that the fuel consumption in the rolling idle zone before stopping the vehicle is not incurred. Figure 23 shows the control strategy of the 48-V motor/generator with respect to the vehicle speed.
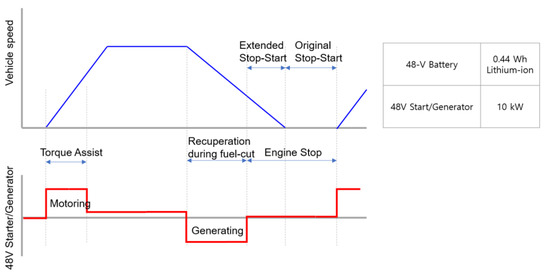
Figure 23.
Strategy for capacity and control of 48-V starter/generator for improving fuel consumption.
Under the WLTP, the fuel consumption of the 48-V system improved by approximately 1.5% when compared with that under the NEDC, as shown in Table 9. Hence, along with the idle stop–start technology, the 48-V system is a cost-effective technology for lowering the fuel consumption in WLTP.

Table 9.
Fuel-consumption improvement of the 48-V system according to drive cycle (1.6 L diesel engine).
Figure 24 presents measured actual torque and behavior of the battery charging in the 48-V motor under NEDC and WLTP. In the WLTP, there are several deceleration events when compared with that of the NEDC mode. Therefore, the regenerative energy of the 48 MHSG was maximized during deceleration, and MHSG also has a minor torque assistance during launching. The electric energy recovered by MHSG is stored in 12 V battery through a DC-DC converter, and is in charge of various electric loads of the vehicle. This ensured an improvement in fuel consumption under WLTP by approximately 1.5% compared with that in NEDC.
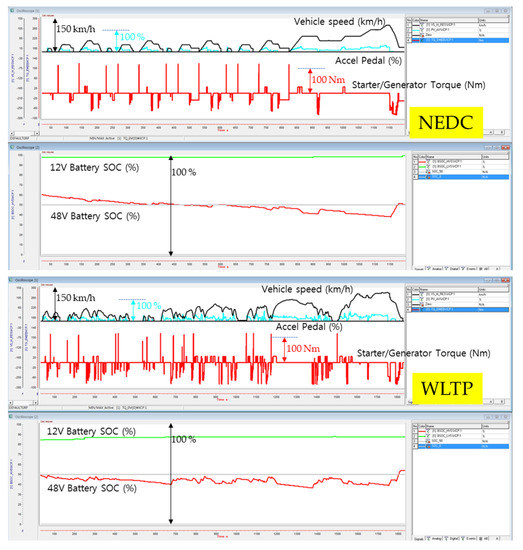
Figure 24.
Torque control of the 48-V motor/generator in NEDC and WLTP modes (Top: NEDC, Bottom: WLTP).
4. Conclusions
When the test cycle was changed from NEDC to WLTP, the fuel consumption was worsened as the cycle energy was increased, due to increase in the acceleration and maximum speed. Conversely, the fuel consumption was also improved due to the increase in operating time after the vehicle was warmed up.
The engine load under the WLTP increased compared with that under the NEDC after considering the weight of the vehicles available for sale. Test weight affects the fuel consumption to the highest extent when compared to the other factors. Specifically, the effect of the vehicle weight increased as the acceleration increased in the WLTP when compared with that in the NEDC. This study showed that when the test mass was changed by 10%, the fuel consumption was affected by approximately 4% in the WLTP.
Under the WLTP, the average and maximum speed of the vehicles increased. This resulted in a higher effect on aerodynamic factors. This study showed that the fuel consumption in WLTP was affected by approximately 3.1% when the aerodynamic drag coefficient was changed by 10%. Thus, this was the sensitive factor that affected the fuel consumption together with vehicle weight.
The tire rolling resistance significantly affects the fuel consumption in low-speed driving conditions, such as urban cycle. Therefore, the effect of the tire rolling resistance on the fuel consumption was reduced because the average vehicle speed was increased in the WLTP mode compared with that in the NEDC. The rolling resistance improved the fuel consumption by approximately 1.4% when the tire rolling resistance was changed by 10% in the WLTP. This indicated that the tire rolling resistance did not affect the fuel consumption as much as the other factors in WLTP.
The effectiveness of the idle stop–start technology on the fuel consumption decreased due to the reduction in idling interval in WLTP compared to NEDC. 48 V MHSG made it possible to realize about 6% fuel improvement by minor torque assist during launching, increased energy recovery during deceleration and extended stop-start technologies in WLTP.
Future Work
Further research is required on vehicles with manual transmission. The manual shift pattern prescribed in the regulation is applied in the NEDC mode. Furthermore, the shift pattern generated by the Steven Tool should be applied under the WLTP mode (692/2008/EC, Annex XXI, Sb-Annex 2). It is quite complex to calculate the WLTP gear selection. Therefore, future work will involve developing a tool which calculates optimum n-min drive for balancing exhaust gas and CO2.
Author Contributions
Conceptualization, methodology, validation, formal analysis, data duration, investigation, writing-original draft preparation and visualization, H.L.; writing-review and editing, supervision and funding acquisition, K.L. All authors have read and agreed to the published version of the manuscript.
Funding
This study was supported by the National Research Foundation of Korea (NRF) grant funded by the Korean government (MSIT) (No. 2019R1A2C1007609).
Conflicts of Interest
The authors declare no conflict of interest.
References
- Commission Regulation (EU) 2017/1151 of 1 June 2017. Available online: https://www.unece.org/fileadmin/DAM/trans/doc/2018/wp29other/EU_2017_1151.pdf (accessed on 10 August 2020).
- Regulation (EC) No 715/2007 on Type Approval of Motor Vehicles. Available online: https://eur-lex.europa.eu/LexUriServ/LexUriServ.do?uri=OJ:L:2007:171:0001:0016:EN:PDF (accessed on 10 August 2020).
- EPA’s Notice of Vibration of the Clean Air Act to Volkswagen, Press Statement, 18 September 2015. Available online: https://theicct.org/news/epas-notice-violation-clean-air-act-volkswagen-press-statement (accessed on 10 August 2020).
- Tietge, U.; Diaz, U.; Mock, P.; German, J.; Bandivadekar, A.; Ligterink, N. From Laboratory to Road—A 2016 Update of Official and ‘Real-World’ Fuel Consumption and CO2 Values for Passenger Cars in Europe, November 2016. Available online: https://theicct.org/sites/default/files/publications/ICCT_LaboratoryToRoad_2016.pdf (accessed on 10 August 2020).
- Peter, M.; Kuhlwein, J.; Tietge, U.; Franco, V.; Bandivadekar, A.; German, J. The WLTP: How a new test procedure for cars will affect fuel consumption values in the EU. Int. Counc. Clean Transp. 2014, 9, 35–47. [Google Scholar]
- Liu, Y.; Zhou, H.; Xu, Y.; Li, M.; Kongjian, Q.; Yu, H. Feasibility Study of Using WLTC for Fuel Consumption Certification of Chinese Light-Duty Vehicles. SAE Technical Paper. 2018-01-0654. Available online: https://www.sae.org/publications/technical-papers/content/2018-01-0654/ (accessed on 10 August 2020).
- Bielaczyc, P.; Woodburn, J.; Szczotka, A. Exhaust Emissions of Gaseous and Solid Pollutants Measured over the NEDC, FTP-75 and WLTC Chassis Dynamometer Driving Cycles. SAE Technical Paper. 2016-01-1008. Available online: https://www.sae.org/publications/technical-papers/content/2016-01-1008/ (accessed on 10 August 2020).
- Bielaczyc, P.; Woodburn, J.; Szczotka, A. A Comparison of Carbon Dioxide Exhaust Emissions and Fuel Consumption for Vehicles Tested over the NEDC, FTP-75 and WLTC Chassis Dynamometer Test Cycles. SAE Technical Paper. 2015-01-1065. Available online: https://www.sae.org/publications/technical-papers/content/2015-01-1065/ (accessed on 10 August 2020).
- de Melo, T.C.; Botero, S.W.; de Carvalho, R.; Villela, A.C.S.; Machado, G.B.; Pontes, A.M.R. Light duty Vehicle Fuel Economy—Comparison of Ice, Hybrid and Electric Vehicles Based on Different Driving Cycles. SAE technical Paper. 2018-36-0035. Available online: https://www.sae.org/publications/technical-papers/content/2018-36-0035/ (accessed on 10 August 2020).
- Mamikoglu, S.; Andric, J.; Dahlander, P. Impact of Conventional and Electrified Powertrains on Fuel Economy in Various Driving Cycles. SAE Technical Paper 2017-01-0903. Available online: https://www.sae.org/publications/technical-papers/content/2017-01-0903/ (accessed on 10 August 2020).
- Pavlovic, J.; Ciuffo, B.; Fontaras, G.; Valverde, V.; Marotta, A. How much difference in type-approval CO2 emissions from passenger cars in Europe can be expected from changing to the new test procedure (NEDC vs. WLTP)? Transp. Res. Part A Policy Pract. 2018, 111, 136–147. [Google Scholar] [CrossRef]
- Pavlovic, J.; Marotta, A.; Ciuffo, B. CO2 emissions and energy demands of vehicles tested under the NEDC and the new WLTP type approval test procedures. Applied Energy 2016, 177, 661–670. [Google Scholar] [CrossRef]
- Moon, J.; Kwon, H.; Kim, S. CO2 and FE Parameters Impact Analysis on WLTC. In Proceedings of the Annual Spring Conference, Wilsonville, Oregon, 17–18 May 2014; Volume 5, pp. 373–378. [Google Scholar]
- Dimaratos, A.; Tsokolis, D.; Fintaras, G.; Tsiakmakis, S.; Ciuffo, B.; Samaras, Z. Comparative evaluation of the effect of various technologies on light-duty vehicle CO2 emissions over NEDC and WLTP. Transp. Res. Procedia 2016, 14, 3169–3178. [Google Scholar] [CrossRef]
© 2020 by the authors. Licensee MDPI, Basel, Switzerland. This article is an open access article distributed under the terms and conditions of the Creative Commons Attribution (CC BY) license (http://creativecommons.org/licenses/by/4.0/).