Abstract
Oil plays an important role in global resource allocation. With the continuous development of the global supply chain, trade has brought a great impact on oil consumption. However, few studies have been focused on the oil consumption embodied in trade, that is, the oil footprints. Therefore, based on the multi-regional input-output model and structural decomposition model, this paper investigates the evolution and driving factors of the oil footprint between the two countries with the largest oil consumption in the world (China and the United States). By measuring the flow of oil footprint in bilateral trade, their trade transactions are analyzed at the national and industry levels. The results show that in Sino-US trade, China is a net exporter of virtual oil and the trade surplus is huge. The United States is the main destination of China’s virtual oil consumption exports. In 2004, China’s embodied oil net exports flowing into the US even exceeded its total net exports. Low value-added, high-consumption manufacturing is the main channel for China’s virtual oil to flow to the United States, which reflects that China is still at the bottom of the value chain. The most important factor in promoting exports’ growth is the scale effect of demand, followed by the input structure effect of intermediate products. The technical effect is an important force to curb the growth of oil footprints. This requires China and the United States to accelerate technological progress and reduce energy consumption intensity. At the same time, China should continue to optimize its trade structure, encourage the export of high-value-added products, and strive to climb the global value chain.
1. Introduction
As the world’s largest energy source, oil is essential for social development (Figure 1). However, oil is unrenewable, and greenhouse gases are generated during its consumption, so that problems of resource shortages and climate warming have become increasingly prominent. The division of global oil consumption responsibility has gradually become the focus of attention in various countries. To ensure the sustainable development of the world and protect the environment, the internationally adopted approach is to allocate responsibilities according to the carbon emissions and energy consumption of each country [1]. That is, the settlement framework of the “National Economic Accounting System” of 1953 is followed, which accounts for pollutant emissions and energy consumption based on the principle of origin.
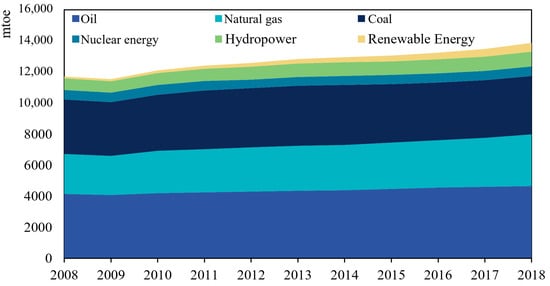
Figure 1.
Global energy consumption and composition.
However, in the context of economic globalization and trade liberalization, there may be a geographic separation between production and consumption activities [2]. Trade makes “energy transfer” more and more common [3]: a country imports goods to meet domestic demand, which keeps energy consumption and pollutants in producing countries [4]. In the current international energy accounting system and climate negotiation framework, it is difficult to determine whether the energy consumed by a country is used to meet its own needs or exported to other countries [5]. Thus, the responsibility for resource conservation and carbon reduction is often attributed to the producing country, leading to some of the environmental pressures that should be borne by consumer countries being transferred to producing countries. This is extremely unfair to some export-oriented countries, such as China [6]. The World Trade Organization (WTO) and the Organisation for Economic Co-operation and Development (OECD) proposed that the value-added in trade should be used as the statistical standard in 2011. The added value and energy consumption embodied in trade has attracted widespread concern. This further increases the necessity of constructing an appropriate model to consider oil consumption caused by trade.
According to the World Energy Statistics Yearbook, the United States and China are the two largest oil consumers in the world (Figure 2). At the same time, the United States is China’s largest trading partner, and China is the United States’ second-largest trading partner. According to data provided by the General Administration of Customs of China, the total value of China-US bilateral trade imports and exports in 2018 was 633.52 billion dollars, an increase of 8.5% year-on-year. The bilateral trade between China and the United States has a huge impact on the economic development of the two countries and has instilled a strong vitality into the world trade [7]. In Sino-US trade, China has always played the role of a net exporter. In 2018, China’s trade surplus with the United States increased by 17.2% year-on-year, reaching 323.32 billion dollars, the highest since 2006. China’s status as a “processing plant” in the global commodity market has not only led to this huge trade surplus but also caused the huge consumption of petroleum resources hidden in commodities [8]. Therefore, research on the flow of oil consumption reflected in Sino-US trade can not only provide policy suggestions for win-win cooperation between the two countries but also provide a reference for other participating countries in the global trade market.
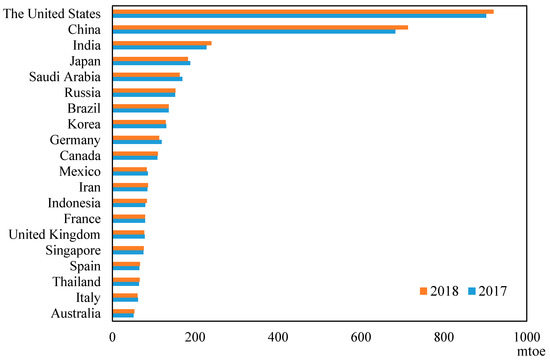
Figure 2.
Top 20 countries with the highest oil consumption.
However, previous studies did not involve the evolution analysis of Sino-US virtual oil trade. Under the above background, the main objectives of this article are: (1) to account for the evolution and composition of virtual oil consumption embodied in Sino-US trade; (2) to analyze the situation of virtual oil trade in various sectors from the industry level; (3) to decompose the change into 5 factors from the perspective of technology, structure, and scale, and tap the driving force behind it.
The structure of the rest of this article is as follows: Section 2 reviews relevant literature and introduces the innovation of this research; Section 3 constructs the accounting model and structural decomposition model, and explains the data sources; Section 4 analyzes the accounting results, and discusses their economic significance; Section 5 summarizes the main points and proposes relevant policy recommendations.
2. Literature Review
With the rapid development of economic globalization, trade has brought more and more influence on the transfer of resources between regions [9]. For example, Li et al., point out that most of the economic prosperity of heterotrophic regions comes from foreign trade [10]. For importers, Chen et al.’s research found that although the transfer of energy-intensive production activities is conducive to achieving domestic environmental protection goals, it is not conducive to long-term energy security [11]. For exporters, while energy is being used to meet foreign demand, environmental pressures are left at home [12]. Therefore, in recent years, scholars have conducted extensive research on energy consumption and pollutant emissions embodied in trade, such as water resources, coal, petroleum, carbon emissions, etc. [13,14,15]. Han et al. pointed out in their research on water resources implied in the trade that this accounting process is conducive to the systematic allocation of water resources worldwide [16]. Dong et al., established a global carbon emissions network embodied in the copper trade [17]. Liu studied the situation of energy transfer in the global construction industry and found that the trade of intermediate products accounted for a huge proportion [18]. China is recognized as a large energy consumer in the world [19,20]. Cui et al. calculated the distribution of embodied energy in China from 2001 to 2007 and found that the export has increased rapidly [21]. The huge export of energy has brought tremendous environmental pressure to China [22,23]. Research by Wu et al. shows that China’s per capita embodied energy growth rate has exceeded the world average level [24]. Chen and Wu pointed out in their research on the global energy supply chain that the United States is the largest end-user and China is the largest miner [25]. Chen and Chen also pointed out that the United States is the largest receiver of embodied energy, and China is the largest exporter [26]. Wu and Chen’s research on coal found that although China is considered to be the world’s largest consumer of coal, in fact, the United States is the largest [27]. Oil resources are also crucial for the development of the US economy [28]. When tracking the consumption of crude oil embodied in global trade, Wu and Chen found that the United States is the world’s largest importer and China is the largest net importer [29]. This conclusion is also reflected in the calculation of CO2 emissions [30]. Tang et al., proposed that most of the oil consumed by “Made in China” before 2010 flowed to the United States. [31]. It can be seen that there have been a large number of research results on global embodied energy. Most of these studies believe that the United States is the largest consumer and China is the largest exporter. Few scholars pay attention to virtual oil consumption in the bilateral trade between China and the United States, which has a huge impact on the global oil trade network.
Researchers agree that consumption-based accounting is more reasonable for pollutant emissions and energy consumption [32,33]. Therefore, in previous studies on carbon footprint, input-output models have been widely used [34,35]. It is suitable for the analysis of international trade because of its detailed description of the relations between the sectors of producer and consumer countries. [36]. Wiedmann evaluated the model in a detailed review of the MRIO and pointed out that it provides a suitable methodological framework for the distribution of the global carbon footprint [37]. The MRIO model is used by scholars to compare the two accounting methods: production-based and consumption-based. [5]. For example, Liu et al., calculated China’s carbon emissions [38], and Sudmant et al., calculated agricultural CH4 and N2O emissions of major global economies [39]. With the continuous deepening of research, the application field of MRIO has been continuously expanded. Han used to calculate the hidden carbon in the global trade of the countries along the Belt and Road and found that the carbon emissions of developed regions such as the United States and the European Union accounted for 30% of its total emissions. [40]. Zhang et al., measure the virtual energy trade situation between various regions of China by using MRIO [41]. Decun and Jinping analyzed the energy footprint of various provinces in China in 2007 [42]. Chen et al. tracked the use of freshwater resources in global supply chains [43]. Based on the current research status of a large number of embodied SO2 emissions exported from China, Liu and Wang reexamined the export of hidden pollutants in various provinces [33]. In the existing research, the MRIO model is mostly used to calculate the total amount of pollutants or energy to show the current state. The accounting results of a single year cannot reflect the long-term overall changes in the hidden oil of global trade and the characteristics of spatial transfer changes. Few studies have combined local policies to analyze the evolution of the trading network in detail. Therefore, this study will combine the relevant policies of China and US to explore the virtual oil evolution embodied in Sino-US trade of 1995–2011, which is from two levels of total trade and industry. The analysis gives full play to the advantages of the MRIO model, and is carried out from the two levels of industry and country.
Structural decomposition analysis methods are widely used in combination with MRIO models to decompose the driving factors of pollutant and virtual energy changes [44]. For example, Zhongwen et al. used the dynamic SDA model to study China’s water footprint, and decomposed the total amount of changes into factors such as water-saving technologies, consumption levels, and demand patterns, and concluded that consumption levels are the main factors that promote water consumption Conclusion [45]. Deng decomposed the global carbon trading volume from 1995 to 2009 [46]. Jiang and Guan decomposed the global CO2 emissions after the financial crisis and found that the increase in consumption and the stagnation of emission intensity decline were the leading factors that caused the emissions increase [47]. Li et al. analyzed the driving factors of China’s energy consumption in 2008–2009 and found that export decline has a strong inhibitory effect [48]. Gao et al. decomposed consumption-based greenhouse gas emissions from 2004 to 2011 into three aspects: emission intensity, input structure, demand scale, and structure [49]. In the research on bilateral trade, Zhao et al. decomposed the driving factors of carbon emissions reflected in Sino-US trade between 1995 and 2009 [50]. Similarly, Xu et al. decomposed other pollutant flow changes in Sino-US trade, but the decomposition results were limited to three aspects: technology, structure, and scale [51]. The effects of import and export of final products are all classified as scale effects, which makes it difficult to identify product effects and country effects of final demand [52]. Based on the previous research, this paper further decomposes the final demand into product structure, country structure, and demand scale. Through the analysis of these five influencing factors, we can gain a deeper understanding of the changes in virtual oil consumption.
All in all, the contribution of this article is mainly reflected in three aspects: firstly, to fill the gaps in the current research on the oil flow embodied in Sino-US trade, the two largest oil-consuming countries are studied to reflect the global hidden oil trade situation. Secondly, based on the multi-regional input-output model, the evolution process of implicit oil flow and industrial association between China and the United States is discussed from the national and industrial levels. Finally, based on previous studies, we will dig deeper into the driving factors behind the evolution of the oil footprints. With the help of the structural decomposition model, the final demand effect is further divided into product effect, country effect, and scale effect, rather than the general effect of scale.
3. Method and Data
3.1. The Multi-Regional Input-Output Model
As a scientific analytical method, input-output analysis is mainly used to study the quantitative relationship between various economic sectors and production links. Its theoretical basis is the Walras general equilibrium model. In this model, the dependence of the number of departments is first expressed as a system of equations, and then based on statistical materials, an input-output table is formed, showing the balance of supply and demand of products in various sectors [53] (Table 1).

Table 1.
The structure of the multi-regional input-output table.
The input-output table contains three quadrants [54]. The first quadrant (Matrix Z area) is the core of this table and mainly reflects the technical and economic links between the industrial sectors of various countries. The matrix Z has a double meaning. From a horizontal perspective, shows that products of region r are supplied as consumer goods to various industrial sectors, called intermediate inputs. From a vertical perspective, indicates that region s consumes the number of products from various industrial sectors during the production process, called intermediate products. The second quadrant (Matrix Y area) includes end-use items such as final consumption, total capital formation, and exports, reflecting the value of the goods or services produced by the product department for various end uses. The third quadrant (Matrix V area) consists of added value for each product department [55].
The single-region input-output model is based on the following assumptions: the technical level of the production country is the same as that of the importing country, and their energy consumption coefficient and pollution emission coefficient are the same, that is, the domestic production technology and energy input method are applied to produce imported goods. The research object of this paper is the implied oil consumption in Sino-US trade and involves other trade participating countries. Considering the different levels of technology in different countries, this paper adopts a multi-regional input-output model to make the accounting results more accurate. Multi-regional input-output (MRIO) analysis can characterize the trade relations between multiple regions in the world and the relations between different production industries.
Based on the input-output table, the basic balance of MRIO can be expressed as
Suppose there are N countries, each country has M production departments, and is the total output of the country r. is the output country r exported to country s. Products from various sectors can be directly consumed or used as intermediate inputs, and countries export intermediate and final products. The total output is used to meet intermediate product demand and final product demand: ; represents the country s‘s final demand for country r’s products. The matrix is the direct consumption coefficient matrix, which describes the industrial links between the intermediate products of countries in world trade.
indicates the number of products i of country r consumed by country s when producing one unit of product j. is the intermediate consumption invested by sector i of country r into the country j sector s.
In Equation (4), is the total consumption coefficient matrix, i.e., the Leontief inverse matrix. It represents the demand for the products of each sector of the country r, for each unit of final product produced by country s, including direct demand and indirect demand.
3.2. The Virtual Oil Measurement Model
As the research object of this paper is bilateral trade, the world can be divided into country a, country b, and country *. Equation (4) can be deformed to Equation (5).
where the subscript represents matrix dimension, such as m × 1. The matrix is the country a’s output consumed by country b. Matrix B and matrix Y are total consumption coefficient matrix and final demand matrix, respectively.
It is assumed that the oil consumption intensity coefficient is represented by the variable , which is the ratio of oil consumption of each industry to the total output of the industry [56].
(1) Virtual oil consumption of the country a exported to country b ()
Since the production process of this part of the goods is completed in the territory of country a, the intensity of oil consumption should be determined by the technical level of country a. The input structure of the intermediate product should include , and . The export is caused by the final demand of country b, so the final demand matrix should consist of , and .
(2) Virtual oil consumption of country a imported from country b ()
Similarly, this part of the goods is produced in country b, so its oil consumption intensity is , and the complete consumption coefficient matrix should include , and . They are finally used to meet the needs of the country a, , and .
3.3. Structural Decomposition Analysis
The structural decomposition model attributes the change in virtual oil consumption to the impact of oil consumption technology level, intermediate production structure, and final demand scale [57]. Among them, the driving factors of final demand can be further divided into product structure [p], country structure [c], and scale effect [s]. Take as an example
The matrix represents the proportion of the demand for a certain product of the national b to the total demand of the global product. The matrix is the proportion of the country b’s demand for the country a’s product to its total demand for the product. The matrix represents the total demand for the product in each country.
When the t-th year and the (t − 1)-th year are respectively used as the base period for the accounting, the change can be decomposed into two forms. To reduce the error, this paper uses the average value as the final result.
Equations (12)–(16) show the final decomposition result of . Five factors are included.
- (1)
- The effect of oil consumption intensity :
- (2)
- The effect of the intermediate input structure :
- (3)
- The effect brought by product structure of final demand :
- (4)
- The effect brought by the country structure of final demand :
- (5)
- The effect brought by final demand scale :
Similarly, Equations (17)–(21) describe the five driving factors of
- (1)
- The effect of oil consumption intensity :
- (2)
- The effect of the intermediate input structure :
- (3)
- The effect brought by product structure of final demand :
- (4)
- The effect brought by the country structure of final demand :
- (5)
- The effect brought by final demand scale :
3.4. Data Sources
This article obtains data from the WIOD database, which contains two parts [58,59]. The first part is the input-output table, which was released in 2013 and covers 41 countries and regions around the world, each country consisting of 35 departments (Appendix A Table A1). Currently updated to 2011. The second part is oil consumption data, which comes from environmental accounts. Although the input-output table released in 2016 covers 2014, it is difficult to use it for the calculation of virtual oil consumption due to the oil consumption and coal consumption in its environmental accounts are combined into one. Therefore, the research range of this paper is 1995–2011. In addition, this period covers important events in global trade, such as China’s accession to the WTO in 2001, the 2008 global financial crisis, and the US shale gas revolution, which is of great research value [60,61,62].
4. Results and Discussion
4.1. The Scale and Evolution of Virtual Oil Embodied in Sino-US Trade
China and the United States are important players in the global oil market. Figure 3 shows the oil consumption embodied in China’s imports and exports and its composition, and the different colors represent the import source country and export destination country (detailed data in Appendix B, Table A2 and Table A3). Before 2009, it can be seen that the annual average of virtual oil exports is greater than the imports. The virtual oil consumption trade deficit reflects China’s role as a “world factory” in international trade and China undertakes a large number of manufacturing tasks from all over the world, especially from developed economies. Judging from the flow of countries, a large part of the oil consumption embodied in its exports has flowed to developed countries such as the United States, Germany, and Japan. Among them, the virtual oil exported to the US accounted for 24.23% of China’s total exports in 1995. China’s accession to the World Trade Organization in 2001 brought about the rapid development of foreign trade. In 2006, the virtual oil consumption embodied in China’s exports to the US peaked at 49.04, mtoe, accounting for 24.39%. Since then, with the advent of the financial crisis and the US shale gas revolution, the dependence of US oil on foreign countries was reduced. However, in terms of virtual oil consumption, China’s exports to the United States have not decreased. By 2011, the exports were 44.53 million tons of oil equivalent, which rose back to pre-crisis levels. Its share of China’s total virtual oil exports has fallen to 19.98%, which may be related to China’s rising position in the global value chain. China has reduced the productivity of low-cost, high-energy products. Increased awareness of environmental protection forced China to reduce its commitment to high-energy processing tasks and seek to climb the value chain. Overall, although China’s virtual oil consumption trade deficit had been reduced, its exports to some developed countries represented by the United States were still much larger than its imports. Therefore, China still has a lot of room to save energy and reduce emissions in the export trade.
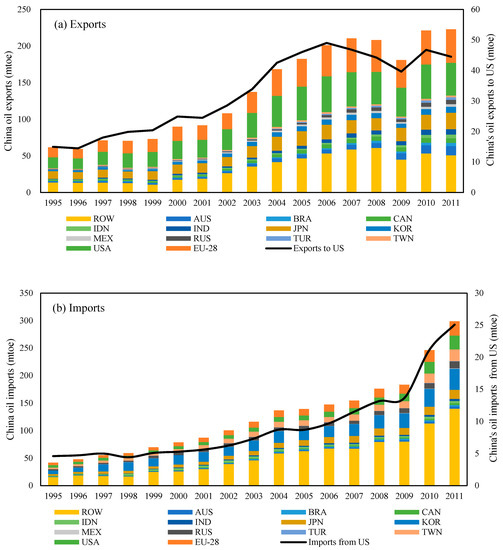
Figure 3.
The evolution of China’s virtual oil consumption: (a) Exports; (b) Imports.
As can be seen from Figure 4, US virtual oil imports far exceed exports, and except for neighboring countries, China is the main source of imports. (Detailed data in Appendix B Table A4 and Table A5). This further illustrates the importance of studying Sino-US virtual oil trade. In 2005, the US’s virtual oil imports were 2.67 times the exports. It is related to the US’s position in the supply chain. The United States tends to import high-energy-consuming intermediate and final products, which mainly come from Canada, China, Russia, South Korea, and other countries. In 1995, US virtual oil consumption from abroad was 223.91 million tons of oil equivalent, of which China accounted for 6.68%. By 2006, US virtual oil imports reached 488.88 million tons, of which China contributed 10.03%, second only to Canada. Since then, with the advent of the economic crisis and the increase of the self-sufficiency rate of the US, total imports have shrunk slightly. In terms of exports, however, most of the virtual oil in the United States flows to neighboring countries, such as Canada and Mexico, or developed countries such as Japan, Germany, France, and the United Kingdom. The total exports have increased significantly since 2009, and the increase in shale oil production may have caused this change. Overall, the deficit of virtual oil trade in the United States is still large.
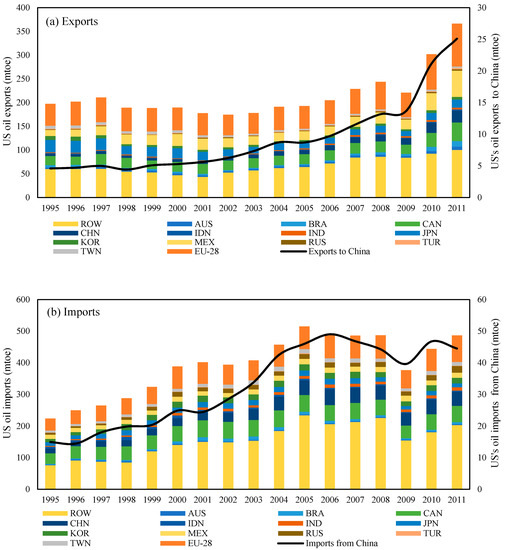
Figure 4.
The evolution of the USA’s virtual oil consumption: (a) Exports; (b) Imports.
The rising trend of virtual oil embodied in China’s exports to the US and US exports to China is basically the same, as can be seen from Figure 5. China’s virtual oil exports to the US have tripled from 1995 to 2011. Among them, the rapid rising phase was mainly concentrated in 2002–2006. This is because, after China’s accession to the world trade organization, it has undertaken a large number of manufacturing production tasks from the US. The US’s virtual oil exports to China increased 4.45 times from 1995 to 2011. It is noteworthy that its rapid growth phase is concentrated after 2009. Hydraulic fracturing technology has brought about an increase in oil and gas production. Before this, the growth was slow. As can be seen from Figure 1 and Figure 3, China’s total virtual oil exports in 1995 were 19.91 million tons of oil equivalent, of which the net exports to the US reached 51.97%. This proportion was as high as 107.42% in 2004. After 2009, net exports to the US were still 25.95 million tons of oil equivalent (2009). Therefore, the comparison of net exports further shows that despite the overall deficit in China’s virtual oil consumption trade after 2009, the trade situation with the United States has not changed. Sino-US trade should be the starting point for the two countries to control oil consumption.
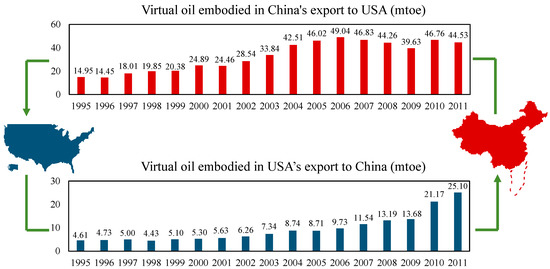
Figure 5.
The virtual oil consumption embodied in Sino-US and its changing trend.
4.2. Virtual Oil Trade between Various Sectors in China and the United States
Figure 6 shows the flow changes (ranging from large to small) in the 12 sectors with the largest volume of virtual oil trade in Sino-US trade. The detailed data is in Appendix B Table A6 and Table A7. It can be seen that China acts as a net exporter of virtual oil consumption in various industries, but the trend and proportion of net exports in each industry are different. The following will focus on the six sectors with the largest virtual oil consumption.
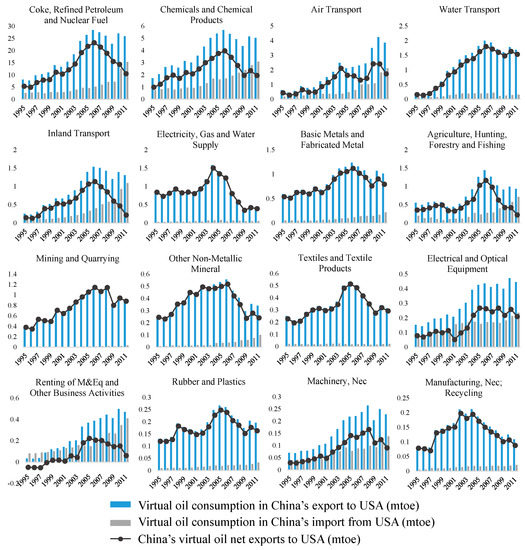
Figure 6.
The changes in virtual oil flow in typical sectors.
“Coke, refining and nuclear fuel” has the largest consumption of virtual oil, which is a heavily polluted heavy industry sector It accounts for 56.8% of China’s total virtual oil exports to the United States, and 56.5% of the US’s total exports to China. Similar to the total amount, China is also the net exporter of embodied oil in this sector. In 1995, China’s virtual oil consumption for the US was three times its import, and by 2011, this figure was 1.67. Furthermore, the trend of net exports after 1995 shows that the Chinese petroleum refining industry, which entered the middle stage of industrialization, developed rapidly and brought a large number of hidden oil exports. After peaking in 2006, with the upgrading of industrial structure and the economic crisis, the export volume of virtual oil began to decline. Therefore, in the bilateral trade, China’s virtual oil trade surplus brought by Coke, Refined Petroleum, and Nuclear Fuel has rapidly shrunk after 2006.
“Chemicals and chemical products” are the second-largest heavy industry sector in virtual oil consumption, accounting for 12.0% and 16.2% of China’s implicit oil exports and imports to the United States, respectively. In line with the oil refining sector, China’s exports of virtual oil to the United States have risen and then declined, and its changes have been affected by various factors such as joining the World Trade Organization, upgrading industrial structure, and the global financial crisis. However, since 1995, US virtual oil exports to China have been steadily increasing, with an average annual growth rate of 9.68%, mainly due to the success of the US shale gas revolution and the relative maturity of US chemical technology.
The transportation industry is also an important part of the Sino-US virtual oil trade, among which “air transportation” accounts for the largest proportion. However, in the three transportation industries, “Water Transport” has the highest oil consumption intensity. This result is mainly due to the geographical distance between China and the United States, and the trade demand for air transportation is relatively large. In the Air Transport sector, China’s exports to the United States determine the trend of net exports in trade, while the virtual oil exports of the United States are steadily increasing, with an annual growth rate of 17.67%.
In the “Electric, Gas, and Water Supply” sector, China’s exports to the United States were relatively stable in 1995–2001, maintaining an annual oil equivalent of 0.87 million tons. Since then, as China successfully joined the WTO, trade has prospered. The production process of goods is inseparable from the supply of electricity, natural gas, and water resources. As a result, the oil consumption embodied in trade has risen rapidly, reaching 1.58 million tons of oil equivalent in 2004. Since then, China’s exports to the United States have fallen sharply as productivity has improved and the financial crisis has hit. However, US exports to China are minimal, with an average annual price of only 0.05 million tons.
Judging from the 16 sectors shown in Figure 4, China is a net exporter of virtual oil consumption in Sino-US trade, particularly in heavy manufacturing sectors such as “Coke, Refined Petroleum, and Nuclear Fuel” and “Chemicals and Chemical Products”. The characteristics of these sectors are high energy consumption, heavy pollution. This further demonstrates that China’s position in the global value chain is very low. Although it obtains economic output by processing and assembling low-value-added products and becomes a major exporter, it consumes a lot of local resources and leaves pollutants at home. On the other hand, the United States tends to transfer high-pollution tasks to other countries to protect local resources.
4.3. The Driving Factors of the Changes in Virtual Oil Flows in Sino-US Bilateral Trade
To further explore the drivers of changes in virtual oil flow reflected in trade, in this part, structural decomposition analysis technology is used to decompose the changes in China’s exports and imports of virtual oil to the United States. Figure 7 depicts the driving forces of the changes in China’s exports to the United States, and Figure 8 presents the US exports to China (detailed data in Appendix C Table A8). In these two waterfall charts, blue and purple are the baseline consumption, yellow represents promotion, and gray represents inhibition.
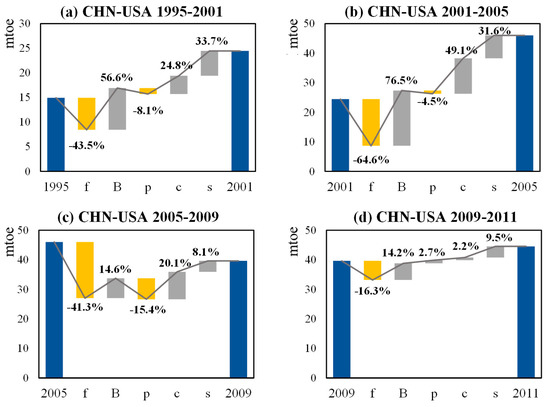
Figure 7.
Decomposing results of virtual oil flows’ changes embodied in China’s exports to the US in 1995–2011: the period of (a) 1995–2001; (b) 2001–2005; (c) 2005–2009; (d) 2009–2011.
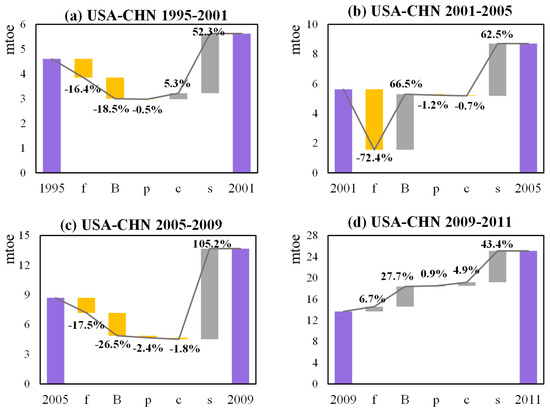
Figure 8.
Decomposing results of virtual oil flows’ changes embodied in the US’s exports to China in 1995–2011: the period of (a) 1995–2001; (b) 2001–2005; (c) 2005–2009; (d) 2009–2011.
The most important factor contributing to this increase was the input structure of intermediate products (b), the country structure of final products (c), and the scale of final demand (s). As shown in Figure 7, these three factors increased the export volume of virtual oil in 2005 by 3.72 times compared to 1995. The change in China’s intermediate product input structure has played the most obvious promoting effect, especially since China’s accession to the WTO. This factor alone has increased the export volume of virtual oil by 76.5%. This is because China has undertaken a large number of manufacturing outsourcing tasks in the United States, leading to the rapid expansion of the export scale of intermediate products in related industries. The country structure effect and the demand scale effect of the final product also showed similar trends, and the export volume in 2005 increased by 1.91 times compared with that in 1995. Since then, with the advent of the financial crisis and the enhancement of American self-sufficiency, these factors have undermined the impetus.
The most important factor inhibiting China’s virtual oil exports to the United States is the technical effect, which is the decline of oil consumption intensity in China’s sectors. Throughout the study period, technological factors have reduced China’s virtual oil exports by 47.78 million tons of oil equivalent. This means that China is committed to improving the efficiency of oil use and reducing resource consumption. However, compared with the previous period (−43.5%, −64.6%), the inhibitory effect of this factor was weakened in 2005–2009 and 2009–2011, which were −41.3% in 2005–2009 and −16.3% in 2009–2011. This shows that it is more difficult for China to further improve the efficiency of oil consumption in the export sector. Otherwise, it should be noted that during the impact period of the US shale oil revolution (2009–2011), the influence of various factors is weakening, which reflects China’s weak growth in US virtual oil exports.
During the whole research period, the US exports of virtual oil to China have been on the rise. As shown in Figure 8, the main driving factor is the scale effect of China’s final demand for the US. This factor alone increased the export volume in 2011 by 4.56 times compared to 1995. Comparing the two columns of the waterfall chart, it can be seen that China’s demand for the US final products is greater than that of the US for China, which reflects that China is more dependent on the final products made in the United States. Especially after China became a WTO member, Sino-US trade has become more frequent, and the United States has opened up a market of technology-intensive products in China. The input structure of intermediate products played different roles at different stages. From 2001 to 2005, the impact of the U.S. intermediate product input structure on virtual oil exports has become a stimulating effect, reflecting the increasing oil intensity of the production structure of various US departments. Since then, with the economic downturn and increased environmental awareness, this factor reduced the total exports by 26.5% between 2005 and 2009. However, after 2009, the sharp increase in domestic oil and gas production in the United States brought about a large amount of oil input in the production of intermediate products, which increased the total exports by 27.7%.
In addition, the decline in oil consumption intensity is the most important factor in the growth of US virtual oil exports to China. From 1995 to 2009, the decline in the intensity of virtual oil consumption in the US production sector reduced exports by 138.04%. This means that the United States is committed to improving energy efficiency at this stage and has achieved significant results. However, from 2009 to 2011, as the production and use of shale oil are still in the initial stage, all five factors resulting from the decomposition of exports are shown as promoting effects. Therefore, the US needs to further improve oil efficiency and optimize the input structure.
5. Conclusions
Based on the WIOD database, this paper establishes an extended virtual oil consumption input-output model and explains the virtual oil flow reflected in bilateral trade between China and the United States. Through the analysis of industry-level data and the factor decomposition of the total volume, the composition and driving factors of the changes in Sino-US virtual oil trade are explored. The main results are concluded as follows:
(1) In bilateral trade between China and the United States, China appears as a net exporter of virtual oil, and its net exports have increased annually, especially after China entered into the WTO. In 2004, China’s embodied oil net exports flowing into US even exceeded the total net exports. After 2008, the global economic crisis has depressed the trade. From 2009 to 2011, the United States successfully carried out the shale oil revolution, thereby improving the self-sufficiency of oil. As a result, China’s net exports of virtual oil to the United States have declined. Overall, the trade surplus has always been huge.
(2) From the perspective of industry structure, China’s net virtual oil exports to the United States are mainly concentrated in the heavy industry sectors represented by “Coke, Refined Petroleum and Nuclear Fuel” and “Chemicals and Chemical Products”. By importing intensive products from China, the United States has outsourced heavily polluting production processes, thus alleviating the environmental pressure of the United States to a certain extent. However, in comparison, China’s technological level and energy efficiency are lower than those of the United States. Therefore, this “outsourcing” behavior has caused a huge adverse impact on the sustainable development of global resources and the environment.
(3) The results of structural decomposition show that in the bilateral trade between China and the United States, the scale effect is the most important factor to promote the increase of virtual oil exports, and the input structure of intermediate products is a secondary factor. Technical effects are an important force to restrain virtual oil consumption. Both China and the United States have made certain achievements in improving the efficiency of oil utilization. However, as far as the United States is concerned, after 2009, the technical effect has promoted the increase in virtual oil exports, which indicates that the United States, which is in the initial stage of shale oil development, still needs to further improve its technological level.
Since 2018, the trade war between China and the US has broken out and intensified, with the petrochemical industry also getting involved. This has adversely affected China-US and global trade. Since the COVID-19 pandemic in 2020, global oil demand has shrunk sharply, causing a severe impact on the oil market. Under this grim situation, an in-depth excavation and interpretation of the implied oil flows in the historical period of China and the United States will help formulate effective policies to promote the balanced development of the oil trade market. From a long-term perspective, both China and the United States should strive to reduce their dependence on oil and improve their technical level to alleviate the negative impact of the shock on the oil industry. The following measures are specifically proposed.
(1) For China, in order to achieve economic growth, it should reduce its dependence on the export of resource-intensive products and encourage the export of high value-added and low-consumption technology-intensive products. This requires China to improve energy efficiency and reduce the intensity of energy consumption. On the one hand, it can reduce oil consumption through the inhibiting effects of technology. On the other hand, exporting low-consumption and high-value-added products is conducive to China’s rise in the value chain of international trade.
(2) For the US, while vigorously developing shale gas, it should continue to work hard to improve the efficiency of oil utilization to ensure that technological progress inhibits the growth of virtual oil consumption. In addition, the United States should actively promote advanced technology in the world, and promote the energy efficiency of other countries through international cooperation, so as to promote the sustainable development of global energy trade. In addition, this study has certain limitations. At present, there is a serious lag in the updating of the input and output tables and their corresponding environmental accounts. The data used in this study is already the latest available for the calculation of virtual oil consumption, which limits Breakthroughs in related research. Therefore, it will be a new direction to compile a new input-output table based on existing data and sort out new oil consumption accounts. By excavating the evolution of virtual oil consumption and its driving factors during major events, it is helpful to formulate new policies to control oil consumption and promote the development of clean energy.
Author Contributions
Conceptualization, J.L.; methodology, J.L.; software, T.G.; validation, J.L.; investigation, J.L.; writing—original draft preparation, L.L.; writing—review and editing, X.W. and G.Q.; supervision, G.Q.; funding acquisition, G.Q. All authors have read and agreed to the published version of the manuscript.
Funding
This research was funded by the China Scholarship Council (CSC NO. 201908510201).
Acknowledgments
Author: Guojin Qin expresses great thanks to the financial support from the China Scholarship Council.
Conflicts of Interest
The authors declare no conflict of interest.
Appendix A
Table A1.
Category of sectors in the World Input-Output Database.
Table A1.
Category of sectors in the World Input-Output Database.
| Code | Sector |
|---|---|
| s1 | Agriculture, Hunting, Forestry, and Fishing |
| s2 | Mining and Quarrying |
| s3 | Food, Beverages, and Tobacco |
| s4 | Textiles and Textile Products |
| s5 | Leather, Leather, and Footwear |
| s6 | Wood and Products of Wood and Cork |
| s7 | Pulp, Paper, Paper, Printing, and Publishing |
| s8 | Coke, Refined Petroleum and Nuclear Fuel |
| s9 | Chemicals and Chemical Products |
| s10 | Rubber and Plastics |
| s11 | Other Non-Metallic Mineral |
| s12 | Basic Metals and Fabricated Metal |
| s13 | Machinery, Nec |
| s14 | Electrical and Optical Equipment |
| s15 | Transport Equipment |
| s16 | Manufacturing, Nec; Recycling |
| s17 | Electricity, Gas, and Water Supply |
| s18 | Construction |
| s19 | Sale, Maintenance, and Repair of Motor Vehicles and Motorcycles; Retail Sale of Fuel |
| s20 | Wholesale Trade and Commission Trade, Except for Motor Vehicles and Motorcycles |
| s21 | Retail Trade, Except for Motor Vehicles and Motorcycles; Repair of Household Goods |
| s22 | Hotels and Restaurants |
| s23 | Inland Transport |
| s24 | Water Transport |
| s25 | Air Transport |
| s26 | Other Supporting and Auxiliary Transport Activities; Activities of Travel Agencies |
| s27 | Post and Telecommunications |
| s28 | Financial Intermediation |
| s29 | Real Estate Activities |
| s30 | Renting of M&Eq and Other Business Activities |
| s31 | Public Admin and Defense; Compulsory Social Security |
| s32 | Education |
| s33 | Health and Social Work |
| s34 | Other Community, Social, and Personal Services |
| s35 | Private Households with Employed Persons |
Appendix B
Table A2.
China’s virtual oil exports (mtoe).
Table A2.
China’s virtual oil exports (mtoe).
| 1995 | 1996 | 1997 | 1998 | 1999 | 2000 | 2001 | 2002 | 2003 | 2004 | 2005 | 2006 | 2007 | 2008 | 2009 | 2010 | 2011 | |
|---|---|---|---|---|---|---|---|---|---|---|---|---|---|---|---|---|---|
| AUS | 1.69 | 1.64 | 1.94 | 1.92 | 2.14 | 2.11 | 1.97 | 2.58 | 3.83 | 5.01 | 5.35 | 5.22 | 6.32 | 6.54 | 8.68 | 11.09 | 12.53 |
| BRA | 0.41 | 0.47 | 0.75 | 0.78 | 0.50 | 0.82 | 0.84 | 0.96 | 1.18 | 1.47 | 1.46 | 1.85 | 2.43 | 3.35 | 2.45 | 3.65 | 4.48 |
| CAN | 1.58 | 1.51 | 1.80 | 1.80 | 1.97 | 2.08 | 2.14 | 2.46 | 3.19 | 4.10 | 4.58 | 5.27 | 5.30 | 5.65 | 5.59 | 6.48 | 6.35 |
| IDN | 0.76 | 0.76 | 1.04 | 0.52 | 0.68 | 1.13 | 1.15 | 1.39 | 1.74 | 1.72 | 1.90 | 2.04 | 2.12 | 2.78 | 3.03 | 4.23 | 5.07 |
| IND | 0.63 | 0.66 | 1.49 | 1.32 | 1.47 | 2.21 | 2.08 | 1.87 | 2.33 | 3.33 | 3.92 | 4.95 | 5.88 | 5.53 | 5.46 | 7.06 | 7.33 |
| JPN | 10.55 | 9.73 | 10.92 | 9.58 | 11.82 | 12.45 | 12.86 | 12.89 | 15.83 | 19.11 | 20.07 | 19.94 | 17.95 | 16.89 | 18.28 | 20.44 | 22.46 |
| KOR | 2.01 | 2.29 | 3.50 | 1.98 | 2.97 | 3.88 | 3.91 | 4.88 | 5.73 | 6.15 | 6.66 | 7.21 | 7.51 | 6.83 | 5.59 | 7.72 | 8.17 |
| MEX | 0.22 | 0.28 | 0.55 | 0.73 | 0.67 | 1.05 | 1.20 | 1.53 | 1.80 | 2.29 | 2.58 | 2.96 | 2.97 | 3.01 | 2.43 | 3.22 | 3.48 |
| RUS | 0.57 | 0.50 | 0.69 | 0.74 | 0.59 | 0.60 | 0.83 | 1.13 | 1.45 | 1.61 | 2.08 | 3.06 | 4.43 | 4.77 | 3.60 | 5.41 | 5.94 |
| TUR | 0.20 | 0.21 | 0.41 | 0.43 | 0.36 | 0.54 | 0.41 | 0.53 | 0.69 | 1.08 | 1.41 | 1.76 | 1.98 | 2.32 | 1.93 | 3.22 | 3.61 |
| TWN | 0.83 | 0.89 | 1.24 | 1.17 | 1.20 | 1.47 | 1.29 | 1.47 | 1.76 | 2.26 | 2.14 | 2.14 | 1.99 | 2.01 | 1.67 | 2.22 | 2.32 |
| USA | 14.95 | 14.45 | 18.01 | 19.85 | 20.38 | 24.89 | 24.46 | 28.54 | 33.84 | 42.51 | 46.02 | 49.04 | 46.83 | 44.26 | 39.63 | 46.76 | 44.53 |
| EU-28 | 13.61 | 12.76 | 15.51 | 17.01 | 17.72 | 19.22 | 19.58 | 21.49 | 28.64 | 36.23 | 37.64 | 42.20 | 45.99 | 43.43 | 37.55 | 46.46 | 45.75 |
| ROW | 13.68 | 13.22 | 13.41 | 12.82 | 10.67 | 17.38 | 19.01 | 26.40 | 35.43 | 41.55 | 46.62 | 53.37 | 58.83 | 61.00 | 44.98 | 53.32 | 50.86 |
Table A3.
China’s virtual oil imports (mtoe).
Table A3.
China’s virtual oil imports (mtoe).
| 1995 | 1996 | 1997 | 1998 | 1999 | 2000 | 2001 | 2002 | 2003 | 2004 | 2005 | 2006 | 2007 | 2008 | 2009 | 2010 | 2011 | |
|---|---|---|---|---|---|---|---|---|---|---|---|---|---|---|---|---|---|
| AUS | 0.59 | 1.04 | 1.28 | 1.06 | 1.08 | 1.42 | 1.37 | 1.17 | 1.34 | 1.50 | 1.87 | 2.12 | 2.34 | 2.58 | 2.84 | 3.43 | 3.83 |
| BRA | 0.17 | 0.19 | 0.27 | 0.25 | 0.34 | 0.42 | 0.58 | 0.81 | 1.22 | 1.47 | 1.42 | 1.38 | 1.58 | 1.97 | 2.32 | 2.42 | 2.75 |
| CAN | 0.73 | 0.77 | 0.79 | 0.88 | 0.87 | 1.06 | 1.18 | 1.25 | 1.38 | 1.82 | 1.75 | 1.62 | 2.07 | 2.37 | 2.29 | 2.58 | 3.26 |
| IDN | 0.75 | 0.79 | 1.15 | 2.98 | 2.63 | 3.23 | 3.42 | 3.60 | 3.56 | 3.19 | 2.78 | 2.26 | 2.32 | 2.24 | 2.50 | 3.92 | 4.00 |
| IND | 0.25 | 0.32 | 0.52 | 0.56 | 0.68 | 1.30 | 1.37 | 1.57 | 1.73 | 1.96 | 1.97 | 2.34 | 2.43 | 2.38 | 2.39 | 3.21 | 3.90 |
| JPN | 3.10 | 3.42 | 4.35 | 4.74 | 4.57 | 5.21 | 5.75 | 6.91 | 7.89 | 9.22 | 10.33 | 11.24 | 12.52 | 13.26 | 12.65 | 14.76 | 16.24 |
| KOR | 6.45 | 7.47 | 12.96 | 15.68 | 14.54 | 17.02 | 17.55 | 16.19 | 19.05 | 21.23 | 18.93 | 19.86 | 21.40 | 23.92 | 26.52 | 32.15 | 38.44 |
| MEX | 0.14 | 0.14 | 0.11 | 0.10 | 0.13 | 0.14 | 0.15 | 0.20 | 0.27 | 0.31 | 0.35 | 0.35 | 0.43 | 0.49 | 0.58 | 0.71 | 0.76 |
| RUS | 2.47 | 2.66 | 2.59 | 2.67 | 4.75 | 5.24 | 5.16 | 6.29 | 6.31 | 6.54 | 6.60 | 6.42 | 5.66 | 6.90 | 8.45 | 9.64 | 12.67 |
| TUR | 0.07 | 0.07 | 0.07 | 0.06 | 0.06 | 0.07 | 0.13 | 0.14 | 0.17 | 0.19 | 0.15 | 0.18 | 0.21 | 0.37 | 0.38 | 0.45 | 0.58 |
| TWN | 2.55 | 3.44 | 4.25 | 4.45 | 4.37 | 5.61 | 7.05 | 8.26 | 9.44 | 10.19 | 10.18 | 9.77 | 11.28 | 11.27 | 12.37 | 17.16 | 21.19 |
| USA | 4.61 | 4.73 | 5.00 | 4.43 | 5.10 | 5.30 | 5.63 | 6.26 | 7.34 | 8.74 | 8.71 | 9.73 | 11.54 | 13.19 | 13.68 | 21.17 | 25.10 |
| EU-28 | 4.34 | 4.43 | 4.77 | 4.77 | 5.61 | 6.86 | 7.93 | 8.86 | 10.62 | 11.89 | 11.60 | 12.56 | 13.53 | 15.48 | 16.05 | 21.44 | 26.02 |
| ROW | 15.58 | 18.67 | 17.57 | 16.64 | 25.06 | 25.84 | 30.05 | 39.28 | 46.01 | 58.74 | 62.85 | 67.59 | 67.40 | 79.55 | 80.27 | 113.32 | 140.11 |
Table A4.
US’s virtual oil exports (mtoe).
Table A4.
US’s virtual oil exports (mtoe).
| 1995 | 1996 | 1997 | 1998 | 1999 | 2000 | 2001 | 2002 | 2003 | 2004 | 2005 | 2006 | 2007 | 2008 | 2009 | 2010 | 2011 | |
|---|---|---|---|---|---|---|---|---|---|---|---|---|---|---|---|---|---|
| AUS | 3.42 | 3.98 | 4.41 | 4.04 | 3.88 | 3.96 | 3.34 | 3.07 | 3.18 | 3.56 | 3.59 | 3.51 | 4.38 | 4.50 | 3.64 | 5.64 | 6.84 |
| BRA | 5.03 | 4.89 | 4.84 | 4.03 | 3.37 | 3.60 | 3.23 | 2.30 | 2.17 | 2.37 | 2.70 | 3.21 | 3.84 | 4.82 | 4.29 | 8.73 | 11.72 |
| CAN | 19.22 | 17.26 | 22.20 | 21.23 | 17.92 | 20.32 | 20.94 | 20.30 | 20.32 | 19.96 | 20.81 | 21.20 | 22.27 | 23.04 | 19.58 | 29.59 | 39.16 |
| CHN | 4.61 | 4.73 | 5.00 | 4.43 | 5.10 | 5.30 | 5.63 | 6.26 | 7.34 | 8.74 | 8.71 | 9.73 | 11.54 | 13.19 | 13.68 | 21.17 | 25.10 |
| IDN | 1.67 | 1.92 | 1.86 | 0.78 | 1.05 | 0.92 | 0.93 | 0.86 | 1.05 | 1.24 | 1.25 | 1.42 | 1.61 | 1.82 | 1.17 | 1.94 | 2.30 |
| IND | 1.36 | 1.40 | 1.66 | 1.72 | 1.87 | 1.32 | 1.19 | 1.36 | 1.60 | 2.05 | 2.25 | 2.96 | 3.46 | 3.60 | 3.02 | 3.91 | 4.08 |
| JPN | 26.30 | 25.17 | 24.35 | 17.90 | 20.29 | 21.30 | 17.81 | 14.87 | 13.85 | 14.20 | 13.15 | 12.42 | 12.32 | 14.31 | 10.99 | 15.09 | 16.83 |
| KOR | 8.27 | 8.82 | 6.44 | 3.75 | 4.43 | 5.12 | 4.24 | 4.27 | 4.18 | 4.36 | 4.32 | 4.70 | 5.08 | 4.63 | 3.48 | 5.62 | 5.75 |
| MEX | 12.59 | 14.76 | 18.90 | 20.50 | 20.99 | 25.01 | 23.44 | 19.22 | 18.37 | 17.84 | 18.78 | 19.09 | 21.40 | 23.50 | 20.68 | 35.98 | 55.29 |
| RUS | 1.40 | 1.41 | 1.73 | 1.26 | 0.69 | 1.44 | 2.16 | 1.91 | 1.38 | 1.18 | 1.36 | 1.60 | 2.02 | 2.20 | 1.65 | 2.43 | 3.00 |
| TUR | 1.41 | 1.53 | 1.53 | 1.30 | 1.15 | 1.25 | 1.00 | 0.84 | 0.96 | 1.15 | 1.18 | 1.34 | 1.52 | 1.74 | 1.23 | 1.80 | 2.69 |
| TWN | 5.98 | 5.87 | 5.36 | 4.46 | 5.49 | 5.02 | 4.04 | 3.66 | 2.94 | 3.15 | 2.68 | 2.47 | 2.55 | 2.68 | 1.96 | 3.16 | 3.17 |
| EU-28 | 46.06 | 50.15 | 52.04 | 49.18 | 49.15 | 47.80 | 46.36 | 43.21 | 43.53 | 49.01 | 47.63 | 49.45 | 52.44 | 57.82 | 51.65 | 74.51 | 90.11 |
| ROW | 60.10 | 60.33 | 60.64 | 54.62 | 53.17 | 47.25 | 43.46 | 52.67 | 57.41 | 62.33 | 64.45 | 71.86 | 84.60 | 86.17 | 84.07 | 92.52 | 100.49 |
Table A5.
US’s virtual oil imports (mtoe).
Table A5.
US’s virtual oil imports (mtoe).
| 1995 | 1996 | 1997 | 1998 | 1999 | 2000 | 2001 | 2002 | 2003 | 2004 | 2005 | 2006 | 2007 | 2008 | 2009 | 2010 | 2011 | |
|---|---|---|---|---|---|---|---|---|---|---|---|---|---|---|---|---|---|
| AUS | 1.61 | 3.71 | 4.14 | 4.10 | 3.03 | 3.61 | 3.23 | 2.42 | 2.69 | 2.73 | 2.82 | 3.03 | 2.93 | 2.48 | 2.75 | 2.73 | 2.53 |
| BRA | 2.70 | 2.95 | 2.93 | 3.55 | 4.19 | 7.81 | 11.32 | 9.62 | 10.89 | 9.12 | 8.37 | 7.41 | 6.15 | 5.93 | 4.22 | 5.44 | 6.52 |
| CAN | 33.62 | 39.00 | 40.23 | 43.28 | 43.29 | 48.66 | 53.69 | 52.77 | 52.33 | 53.38 | 52.92 | 50.04 | 51.16 | 49.18 | 40.10 | 49.14 | 51.63 |
| CHN | 14.95 | 14.45 | 18.01 | 19.85 | 20.38 | 24.89 | 24.46 | 28.54 | 33.84 | 42.51 | 46.02 | 49.04 | 46.83 | 44.26 | 39.63 | 46.76 | 44.53 |
| IDN | 5.51 | 4.61 | 4.17 | 10.11 | 6.19 | 8.03 | 8.52 | 5.18 | 5.30 | 6.12 | 5.12 | 4.78 | 4.02 | 3.57 | 3.00 | 3.21 | 3.09 |
| IND | 2.78 | 3.07 | 3.71 | 4.34 | 5.62 | 8.37 | 8.02 | 8.27 | 7.61 | 8.48 | 8.90 | 10.80 | 9.54 | 8.33 | 8.44 | 9.59 | 10.71 |
| JPN | 11.75 | 12.23 | 15.44 | 16.72 | 15.79 | 17.00 | 16.76 | 17.32 | 16.27 | 16.34 | 17.30 | 17.93 | 17.62 | 14.60 | 11.03 | 13.34 | 12.17 |
| KOR | 10.66 | 10.14 | 14.13 | 19.54 | 17.31 | 18.74 | 19.73 | 17.93 | 17.48 | 19.32 | 19.49 | 18.87 | 20.00 | 16.17 | 14.47 | 17.93 | 17.64 |
| MEX | 13.25 | 13.24 | 12.63 | 13.52 | 13.71 | 14.99 | 14.00 | 13.86 | 15.88 | 16.17 | 17.39 | 16.49 | 16.24 | 15.98 | 17.66 | 15.63 | 16.06 |
| RUS | 6.04 | 5.39 | 5.50 | 8.10 | 11.81 | 15.19 | 12.35 | 13.57 | 13.66 | 13.34 | 15.29 | 16.03 | 12.39 | 15.67 | 13.37 | 16.43 | 21.33 |
| TUR | 0.61 | 0.66 | 0.82 | 1.02 | 0.88 | 1.06 | 1.28 | 1.63 | 1.32 | 1.38 | 2.03 | 1.25 | 1.10 | 1.25 | 0.78 | 1.00 | 1.07 |
| TWN | 6.55 | 5.95 | 6.75 | 7.80 | 8.01 | 8.87 | 9.48 | 11.18 | 13.30 | 13.97 | 13.71 | 12.43 | 12.51 | 9.71 | 9.25 | 12.55 | 11.73 |
| EU-28 | 37.61 | 43.31 | 49.49 | 51.45 | 53.25 | 70.50 | 68.59 | 62.64 | 63.04 | 69.06 | 71.57 | 74.24 | 72.34 | 73.90 | 57.22 | 69.73 | 84.03 |
| ROW | 76.27 | 91.21 | 87.41 | 85.20 | 120.26 | 140.65 | 150.39 | 148.84 | 153.86 | 185.00 | 234.25 | 206.53 | 213.29 | 226.28 | 154.82 | 180.62 | 203.68 |
Table A6.
The oil consumption embodied in China’s inter-industry exports to the US (mtoe).
Table A6.
The oil consumption embodied in China’s inter-industry exports to the US (mtoe).
| 1995 | 1996 | 1997 | 1998 | 1999 | 2000 | 2001 | 2002 | 2003 | 2004 | 2005 | 2006 | 2007 | 2008 | 2009 | 2010 | 2011 | |
|---|---|---|---|---|---|---|---|---|---|---|---|---|---|---|---|---|---|
| c1 | 0.56 | 0.50 | 0.57 | 0.59 | 0.57 | 0.45 | 0.45 | 0.53 | 0.72 | 0.92 | 1.27 | 1.45 | 1.27 | 1.03 | 0.91 | 1.00 | 0.94 |
| c2 | 0.39 | 0.36 | 0.55 | 0.52 | 0.50 | 0.71 | 0.65 | 0.75 | 0.87 | 0.98 | 1.07 | 1.16 | 1.09 | 1.16 | 0.82 | 0.96 | 0.91 |
| c3 | 0.03 | 0.03 | 0.04 | 0.04 | 0.04 | 0.04 | 0.04 | 0.05 | 0.06 | 0.08 | 0.11 | 0.11 | 0.10 | 0.09 | 0.08 | 0.09 | 0.09 |
| c4 | 0.25 | 0.22 | 0.23 | 0.28 | 0.32 | 0.33 | 0.32 | 0.33 | 0.37 | 0.50 | 0.53 | 0.50 | 0.44 | 0.37 | 0.29 | 0.34 | 0.31 |
| c5 | 0.07 | 0.06 | 0.07 | 0.09 | 0.11 | 0.12 | 0.12 | 0.13 | 0.15 | 0.20 | 0.19 | 0.18 | 0.16 | 0.14 | 0.12 | 0.12 | 0.12 |
| c6 | 0.02 | 0.02 | 0.02 | 0.03 | 0.02 | 0.03 | 0.03 | 0.03 | 0.04 | 0.05 | 0.07 | 0.08 | 0.08 | 0.07 | 0.06 | 0.07 | 0.06 |
| c7 | 0.04 | 0.03 | 0.04 | 0.05 | 0.06 | 0.07 | 0.07 | 0.09 | 0.10 | 0.10 | 0.12 | 0.13 | 0.12 | 0.12 | 0.10 | 0.12 | 0.11 |
| c8 | 8.12 | 7.79 | 9.86 | 10.41 | 11.07 | 14.06 | 13.40 | 15.50 | 18.52 | 23.98 | 26.46 | 28.48 | 27.55 | 26.17 | 22.84 | 27.11 | 25.96 |
| c9 | 1.74 | 2.06 | 2.66 | 2.77 | 2.60 | 3.14 | 3.01 | 3.57 | 4.32 | 5.04 | 5.39 | 5.68 | 5.37 | 4.94 | 4.36 | 5.15 | 5.03 |
| c10 | 0.13 | 0.13 | 0.14 | 0.19 | 0.18 | 0.17 | 0.16 | 0.17 | 0.20 | 0.25 | 0.27 | 0.26 | 0.23 | 0.21 | 0.17 | 0.20 | 0.20 |
| c11 | 0.25 | 0.24 | 0.28 | 0.37 | 0.38 | 0.46 | 0.45 | 0.51 | 0.50 | 0.52 | 0.53 | 0.56 | 0.46 | 0.41 | 0.30 | 0.36 | 0.34 |
| c12 | 0.59 | 0.56 | 0.67 | 0.68 | 0.64 | 0.75 | 0.69 | 0.79 | 0.98 | 1.12 | 1.15 | 1.24 | 1.16 | 1.08 | 0.91 | 1.07 | 1.02 |
| c13 | 0.07 | 0.07 | 0.08 | 0.08 | 0.09 | 0.10 | 0.11 | 0.14 | 0.17 | 0.20 | 0.22 | 0.22 | 0.24 | 0.26 | 0.20 | 0.25 | 0.23 |
| c14 | 0.15 | 0.14 | 0.17 | 0.20 | 0.20 | 0.22 | 0.21 | 0.26 | 0.30 | 0.39 | 0.43 | 0.44 | 0.41 | 0.43 | 0.40 | 0.47 | 0.45 |
| c15 | 0.03 | 0.03 | 0.03 | 0.04 | 0.04 | 0.06 | 0.05 | 0.05 | 0.06 | 0.10 | 0.10 | 0.10 | 0.10 | 0.11 | 0.08 | 0.10 | 0.10 |
| c16 | 0.08 | 0.08 | 0.08 | 0.14 | 0.15 | 0.16 | 0.16 | 0.21 | 0.20 | 0.21 | 0.19 | 0.17 | 0.15 | 0.14 | 0.12 | 0.13 | 0.11 |
| c17 | 0.87 | 0.76 | 0.85 | 0.97 | 0.86 | 0.89 | 0.86 | 0.98 | 1.20 | 1.58 | 1.43 | 1.28 | 0.87 | 0.64 | 0.40 | 0.47 | 0.45 |
| c18 | 0.01 | 0.01 | 0.01 | 0.01 | 0.01 | 0.02 | 0.02 | 0.02 | 0.02 | 0.02 | 0.02 | 0.03 | 0.03 | 0.02 | 0.02 | 0.02 | 0.02 |
| c19 | 0.00 | 0.00 | 0.00 | 0.00 | 0.00 | 0.00 | 0.00 | 0.00 | 0.00 | 0.00 | 0.00 | 0.00 | 0.00 | 0.00 | 0.00 | 0.00 | 0.00 |
| c20 | 0.17 | 0.18 | 0.19 | 0.18 | 0.22 | 0.20 | 0.20 | 0.22 | 0.14 | 0.13 | 0.08 | 0.07 | 0.07 | 0.07 | 0.06 | 0.07 | 0.07 |
| c21 | 0.06 | 0.07 | 0.08 | 0.08 | 0.09 | 0.09 | 0.10 | 0.12 | 0.11 | 0.11 | 0.13 | 0.13 | 0.12 | 0.12 | 0.11 | 0.12 | 0.11 |
| c22 | 0.01 | 0.01 | 0.02 | 0.02 | 0.02 | 0.02 | 0.02 | 0.02 | 0.03 | 0.04 | 0.05 | 0.05 | 0.05 | 0.05 | 0.05 | 0.05 | 0.05 |
| c23 | 0.25 | 0.23 | 0.31 | 0.49 | 0.52 | 0.68 | 0.67 | 0.77 | 0.90 | 1.16 | 1.40 | 1.54 | 1.51 | 1.43 | 1.20 | 1.40 | 1.31 |
| c24 | 0.22 | 0.21 | 0.26 | 0.45 | 0.60 | 0.97 | 1.10 | 1.36 | 1.50 | 1.59 | 1.82 | 2.00 | 1.94 | 1.72 | 1.61 | 1.78 | 1.69 |
| c25 | 0.63 | 0.46 | 0.58 | 0.91 | 0.77 | 0.82 | 1.23 | 1.52 | 1.89 | 2.49 | 2.12 | 2.21 | 2.32 | 2.45 | 3.51 | 4.25 | 3.86 |
| c26 | 0.03 | 0.04 | 0.05 | 0.04 | 0.04 | 0.05 | 0.04 | 0.03 | 0.09 | 0.17 | 0.22 | 0.25 | 0.28 | 0.24 | 0.19 | 0.23 | 0.21 |
| c27 | 0.01 | 0.01 | 0.02 | 0.02 | 0.02 | 0.04 | 0.03 | 0.04 | 0.04 | 0.05 | 0.05 | 0.06 | 0.06 | 0.05 | 0.05 | 0.05 | 0.05 |
| c28 | 0.03 | 0.03 | 0.02 | 0.02 | 0.03 | 0.02 | 0.02 | 0.03 | 0.03 | 0.04 | 0.04 | 0.05 | 0.05 | 0.05 | 0.05 | 0.05 | 0.05 |
| c29 | 0.00 | 0.00 | 0.00 | 0.00 | 0.00 | 0.00 | 0.00 | 0.00 | 0.01 | 0.01 | 0.02 | 0.02 | 0.02 | 0.02 | 0.02 | 0.02 | 0.02 |
| c30 | 0.03 | 0.03 | 0.04 | 0.09 | 0.12 | 0.13 | 0.14 | 0.20 | 0.20 | 0.33 | 0.37 | 0.39 | 0.41 | 0.44 | 0.41 | 0.50 | 0.47 |
| c31 | 0.00 | 0.00 | 0.00 | 0.00 | 0.00 | 0.00 | 0.00 | 0.00 | 0.00 | 0.00 | 0.00 | 0.00 | 0.00 | 0.00 | 0.00 | 0.00 | 0.00 |
| c32 | 0.00 | 0.00 | 0.00 | 0.00 | 0.00 | 0.00 | 0.00 | 0.00 | 0.00 | 0.01 | 0.01 | 0.01 | 0.01 | 0.01 | 0.01 | 0.01 | 0.01 |
| c33 | 0.00 | 0.00 | 0.00 | 0.00 | 0.00 | 0.00 | 0.00 | 0.00 | 0.00 | 0.00 | 0.01 | 0.01 | 0.01 | 0.01 | 0.01 | 0.01 | 0.01 |
| c34 | 0.07 | 0.07 | 0.09 | 0.09 | 0.09 | 0.09 | 0.09 | 0.11 | 0.11 | 0.13 | 0.16 | 0.19 | 0.18 | 0.18 | 0.17 | 0.18 | 0.17 |
| c35 | 0.00 | 0.00 | 0.00 | 0.00 | 0.00 | 0.00 | 0.00 | 0.00 | 0.00 | 0.00 | 0.00 | 0.00 | 0.00 | 0.00 | 0.00 | 0.00 | 0.00 |
Table A7.
The oil consumption embodied in the US’s inter-industry exports to China (mtoe).
Table A7.
The oil consumption embodied in the US’s inter-industry exports to China (mtoe).
| 1995 | 1996 | 1997 | 1998 | 1999 | 2000 | 2001 | 2002 | 2003 | 2004 | 2005 | 2006 | 2007 | 2008 | 2009 | 2010 | 2011 | |
|---|---|---|---|---|---|---|---|---|---|---|---|---|---|---|---|---|---|
| c1 | 0.20 | 0.13 | 0.15 | 0.11 | 0.08 | 0.11 | 0.12 | 0.12 | 0.17 | 0.28 | 0.23 | 0.28 | 0.29 | 0.40 | 0.49 | 0.57 | 0.72 |
| c2 | 0.01 | 0.01 | 0.01 | 0.01 | 0.01 | 0.01 | 0.01 | 0.01 | 0.01 | 0.01 | 0.01 | 0.01 | 0.02 | 0.02 | 0.02 | 0.02 | 0.03 |
| c3 | 0.02 | 0.01 | 0.02 | 0.02 | 0.02 | 0.02 | 0.02 | 0.02 | 0.02 | 0.02 | 0.02 | 0.02 | 0.03 | 0.04 | 0.03 | 0.04 | 0.05 |
| c4 | 0.02 | 0.02 | 0.02 | 0.02 | 0.02 | 0.02 | 0.02 | 0.02 | 0.02 | 0.02 | 0.02 | 0.02 | 0.02 | 0.02 | 0.02 | 0.02 | 0.02 |
| c5 | 0.00 | 0.00 | 0.00 | 0.00 | 0.00 | 0.00 | 0.00 | 0.00 | 0.00 | 0.00 | 0.00 | 0.00 | 0.00 | 0.00 | 0.00 | 0.00 | 0.00 |
| c6 | 0.01 | 0.01 | 0.01 | 0.01 | 0.01 | 0.01 | 0.01 | 0.02 | 0.02 | 0.02 | 0.02 | 0.02 | 0.03 | 0.04 | 0.04 | 0.05 | 0.07 |
| c7 | 0.04 | 0.04 | 0.04 | 0.03 | 0.03 | 0.04 | 0.04 | 0.04 | 0.05 | 0.06 | 0.06 | 0.07 | 0.07 | 0.08 | 0.07 | 0.08 | 0.10 |
| c8 | 2.70 | 2.82 | 2.92 | 2.48 | 2.99 | 2.91 | 3.00 | 3.38 | 4.03 | 4.77 | 4.65 | 5.21 | 6.07 | 7.21 | 7.27 | 12.76 | 15.39 |
| c9 | 0.75 | 0.84 | 0.91 | 0.79 | 0.89 | 0.96 | 0.93 | 1.09 | 1.32 | 1.69 | 1.64 | 1.71 | 1.93 | 2.18 | 2.40 | 2.81 | 3.09 |
| c10 | 0.01 | 0.01 | 0.01 | 0.01 | 0.01 | 0.01 | 0.01 | 0.02 | 0.02 | 0.02 | 0.02 | 0.02 | 0.02 | 0.02 | 0.02 | 0.03 | 0.03 |
| c11 | 0.01 | 0.01 | 0.01 | 0.01 | 0.01 | 0.01 | 0.02 | 0.01 | 0.02 | 0.03 | 0.03 | 0.04 | 0.04 | 0.06 | 0.06 | 0.08 | 0.10 |
| c12 | 0.05 | 0.05 | 0.05 | 0.05 | 0.05 | 0.05 | 0.07 | 0.07 | 0.08 | 0.09 | 0.10 | 0.12 | 0.14 | 0.15 | 0.15 | 0.17 | 0.22 |
| c13 | 0.04 | 0.04 | 0.04 | 0.04 | 0.04 | 0.05 | 0.06 | 0.06 | 0.08 | 0.09 | 0.08 | 0.09 | 0.09 | 0.10 | 0.09 | 0.13 | 0.14 |
| c14 | 0.07 | 0.07 | 0.08 | 0.09 | 0.10 | 0.11 | 0.16 | 0.16 | 0.17 | 0.17 | 0.16 | 0.17 | 0.17 | 0.17 | 0.18 | 0.21 | 0.24 |
| c15 | 0.02 | 0.02 | 0.02 | 0.03 | 0.02 | 0.02 | 0.04 | 0.03 | 0.04 | 0.03 | 0.04 | 0.05 | 0.05 | 0.05 | 0.07 | 0.07 | 0.08 |
| c16 | 0.00 | 0.01 | 0.01 | 0.01 | 0.01 | 0.01 | 0.01 | 0.01 | 0.02 | 0.02 | 0.02 | 0.02 | 0.02 | 0.02 | 0.02 | 0.02 | 0.02 |
| c17 | 0.03 | 0.03 | 0.03 | 0.04 | 0.04 | 0.04 | 0.05 | 0.04 | 0.07 | 0.07 | 0.08 | 0.05 | 0.07 | 0.06 | 0.05 | 0.05 | 0.05 |
| c18 | 0.01 | 0.01 | 0.01 | 0.01 | 0.01 | 0.01 | 0.01 | 0.02 | 0.02 | 0.02 | 0.02 | 0.02 | 0.03 | 0.04 | 0.04 | 0.05 | 0.06 |
| c19 | 0.00 | 0.00 | 0.00 | 0.00 | 0.00 | 0.00 | 0.00 | 0.00 | 0.00 | 0.00 | 0.00 | 0.00 | 0.00 | 0.00 | 0.00 | 0.00 | 0.00 |
| c20 | 0.04 | 0.04 | 0.04 | 0.04 | 0.04 | 0.05 | 0.06 | 0.06 | 0.07 | 0.08 | 0.07 | 0.08 | 0.08 | 0.09 | 0.08 | 0.11 | 0.12 |
| c21 | 0.01 | 0.01 | 0.01 | 0.01 | 0.01 | 0.01 | 0.01 | 0.01 | 0.01 | 0.01 | 0.01 | 0.02 | 0.02 | 0.02 | 0.02 | 0.02 | 0.03 |
| c22 | 0.01 | 0.01 | 0.01 | 0.01 | 0.01 | 0.01 | 0.01 | 0.02 | 0.02 | 0.02 | 0.02 | 0.02 | 0.02 | 0.03 | 0.03 | 0.04 | 0.05 |
| c23 | 0.11 | 0.11 | 0.11 | 0.10 | 0.12 | 0.14 | 0.15 | 0.19 | 0.22 | 0.26 | 0.34 | 0.41 | 0.51 | 0.58 | 0.60 | 0.93 | 1.09 |
| c24 | 0.07 | 0.07 | 0.07 | 0.08 | 0.10 | 0.14 | 0.16 | 0.20 | 0.19 | 0.20 | 0.20 | 0.20 | 0.22 | 0.11 | 0.13 | 0.15 | 0.16 |
| c25 | 0.20 | 0.18 | 0.22 | 0.26 | 0.29 | 0.33 | 0.37 | 0.37 | 0.36 | 0.38 | 0.48 | 0.62 | 1.01 | 1.03 | 1.09 | 1.84 | 2.13 |
| c26 | 0.04 | 0.04 | 0.04 | 0.02 | 0.03 | 0.05 | 0.05 | 0.06 | 0.06 | 0.07 | 0.10 | 0.11 | 0.17 | 0.17 | 0.19 | 0.25 | 0.29 |
| c27 | 0.00 | 0.00 | 0.01 | 0.00 | 0.01 | 0.01 | 0.01 | 0.01 | 0.02 | 0.02 | 0.03 | 0.03 | 0.03 | 0.03 | 0.03 | 0.03 | 0.04 |
| c28 | 0.02 | 0.02 | 0.02 | 0.02 | 0.02 | 0.02 | 0.02 | 0.03 | 0.03 | 0.03 | 0.03 | 0.03 | 0.04 | 0.04 | 0.04 | 0.06 | 0.06 |
| c29 | 0.00 | 0.00 | 0.00 | 0.00 | 0.00 | 0.00 | 0.00 | 0.00 | 0.00 | 0.00 | 0.00 | 0.00 | 0.00 | 0.00 | 0.00 | 0.00 | 0.00 |
| c30 | 0.08 | 0.08 | 0.09 | 0.09 | 0.10 | 0.11 | 0.13 | 0.14 | 0.16 | 0.15 | 0.15 | 0.18 | 0.21 | 0.27 | 0.27 | 0.35 | 0.41 |
| c31 | 0.01 | 0.01 | 0.01 | 0.01 | 0.01 | 0.01 | 0.01 | 0.01 | 0.02 | 0.03 | 0.04 | 0.05 | 0.07 | 0.09 | 0.11 | 0.13 | 0.18 |
| c32 | 0.00 | 0.00 | 0.00 | 0.00 | 0.00 | 0.00 | 0.00 | 0.00 | 0.00 | 0.00 | 0.00 | 0.00 | 0.00 | 0.00 | 0.00 | 0.00 | 0.00 |
| c33 | 0.00 | 0.00 | 0.00 | 0.00 | 0.00 | 0.00 | 0.00 | 0.00 | 0.00 | 0.00 | 0.00 | 0.00 | 0.00 | 0.00 | 0.00 | 0.00 | 0.00 |
| c34 | 0.02 | 0.01 | 0.01 | 0.02 | 0.02 | 0.02 | 0.02 | 0.03 | 0.03 | 0.03 | 0.03 | 0.04 | 0.05 | 0.07 | 0.07 | 0.09 | 0.11 |
| c35 | 0.00 | 0.00 | 0.00 | 0.00 | 0.00 | 0.00 | 0.00 | 0.00 | 0.00 | 0.00 | 0.00 | 0.00 | 0.00 | 0.00 | 0.00 | 0.00 | 0.00 |
Appendix C
Table A8.
The driving forces of virtual oil consumption changes (mtoe).
Table A8.
The driving forces of virtual oil consumption changes (mtoe).
| Driving Factor | China’s Exports to the US | US’s Exports to China |
|---|---|---|
| (1995–2001) | ||
| Effect of oil consumption intensity (f) | −6.5025 | −0.7575 |
| Effect of intermediate input structure (B) | 8.4663 | −0.8517 |
| Effect brought by product structure of final demand (p) | −1.2149 | −0.0213 |
| Effect brought by country structure of final demand (c) | 3.7133 | 0.2431 |
| Effect brought by final demand scale (s) | 5.0408 | 2.4084 |
| (2001–2005) | ||
| Effect of oil consumption intensity (f) | −15.8015 | −4.0740 |
| Effect of intermediate input structure (B) | 18.7070 | 3.7435 |
| Effect brought by product structure of final demand (p) | −1.0916 | −0.0671 |
| Effect brought by country structure of final demand (c) | 12.0066 | −0.0420 |
| Effect brought by final demand scale (s) | 7.7404 | 3.5181 |
| (2005–2009) | ||
| Effect of oil consumption intensity (f) | −18.9990 | −1.5259 |
| Effect of intermediate input structure (B) | 6.7229 | −2.3063 |
| Effect brought by product structure of final demand (p) | −7.0986 | −0.2048 |
| Effect brought by country structure of final demand (c) | 9.2726 | −0.1530 |
| Effect brought by final demand scale (s) | 3.7150 | 9.1610 |
| (2009–2011) | ||
| Effect of oil consumption intensity (f) | −6.4791 | 0.9103 |
| Effect of intermediate input structure (B) | 5.6393 | 3.7896 |
| Effect brought by product structure of final demand (p) | 1.0802 | 0.1258 |
| Effect brought by country structure of final demand (c) | 0.8828 | 0.6664 |
| Effect brought by final demand scale (s) | 3.7726 | 5.9327 |
References
- Liu, H.; Liu, W.; Fan, X.; Liu, Z. Carbon emissions embodied in value added chains in China. J. Clean. Prod. 2015, 103, 362–370. [Google Scholar] [CrossRef]
- AKIN, C.S. The impact of foreign trade, energy consumption and income on CO2 emissions. Int. J. Energy Econ. Policy 2014, 4, 465–475. [Google Scholar]
- López, L.A.; Cadarso, M.Á.; Zafrilla, J.; Arce, G. The carbon footprint of the US multinationals’ foreign affiliates. Nat. Commun. 2019, 10, 1–11. [Google Scholar] [CrossRef] [PubMed]
- Aïssa, M.S.B.; Jebli, M.B.; Youssef, S.B. Output, renewable energy consumption and trade in Africa. Energy Policy 2014, 66, 11–18. [Google Scholar] [CrossRef]
- Wang, Z.; Li, Y.; Cai, H.; Wang, B. Comparative analysis of regional carbon emissions accounting methods in China: Production-based versus consumption-based principles. J. Clean. Prod. 2018, 194, 12–22. [Google Scholar] [CrossRef]
- Guo, S.; Zheng, S.; Hu, Y.; Hong, J.; Wu, X.; Tang, M. Embodied energy use in the global construction industry. Appl. Energy 2019, 256, 113838. [Google Scholar] [CrossRef]
- Liu, Y.; Chen, S.; Chen, B.; Yang, W. Analysis of CO2 emissions embodied in China’s bilateral trade: A non-competitive import input–output approach. J. Clean. Prod. 2017, 163, S410–S419. [Google Scholar] [CrossRef]
- Arce, G.; López, L.A.; Guan, D. Carbon emissions embodied in international trade: The post-China era. Appl. Energy 2016, 184, 1063–1072. [Google Scholar] [CrossRef]
- Farhani, S.; Chaibi, A.; Rault, C. CO2 emissions, output, energy consumption, and trade in Tunisia. Econ. Model. 2014, 38, 426–434. [Google Scholar] [CrossRef]
- Li, J.S.; Chen, G.Q.; Wu, X.F.; Hayat, T.; Alsaedi, A.; Ahmad, B. Embodied energy assessment for Macao’s external trade. Renew. Sustain. Energy Rev. 2014, 34, 642–653. [Google Scholar] [CrossRef]
- Chen, B.; Yang, Q.; Li, J.S.; Chen, G.Q. Decoupling analysis on energy consumption, embodied GHG emissions and economic growth—The case study of Macao. Renew. Sustain. Energy Rev. 2017, 67, 662–672. [Google Scholar] [CrossRef]
- Chen, B.; Li, J.S.; Wu, X.F.; Han, M.Y.; Zeng, L.; Li, Z.; Chen, G.Q. Global energy flows embodied in international trade: A combination of environmentally extended input–output analysis and complex network analysis. Appl. Energy 2018, 210, 98–107. [Google Scholar] [CrossRef]
- Ali, Y. Carbon, water and land use accounting: Consumption vs. production perspectives. Renew. Sustain. Energy Rev. 2017, 67, 921–934. [Google Scholar] [CrossRef]
- Xia, X.H.; Chen, B.; Wu, X.D.; Hu, Y.; Liu, D.H.; Hu, C.Y. Coal use for world economy: Provision and transfer network by multi-region input–output analysis. J. Clean. Prod. 2017, 143, 125–144. [Google Scholar] [CrossRef]
- Xueliu, X.; Mingjie, M.; Qian, W. Recalculating CO2 emissions from the perspective of value-added trade: An input–output analysis of China’s trade data. Energy Policy 2017, 107, 158–166. [Google Scholar]
- Han, M.; Dunford, M.; Chen, G.; Liu, W.; Li, Y.; Liu, S. Global water transfers embodied in Mainland China’s foreign trade: Production-and consumption-based perspectives. J. Clean. Prod. 2017, 161, 188–199. [Google Scholar] [CrossRef]
- Dong, D.; An, H.; Huang, S. The transfer of embodied carbon in copper international trade: An industry chain perspective. Resour. Policy 2017, 52, 173–180. [Google Scholar] [CrossRef]
- Liu, B.; Wang, D.; Xu, Y.; Liu, C.; Luther, M. Embodied energy consumption of the construction industry and its international trade using multi-regional input–output analysis. Energy Build. 2018, 173, 489–501. [Google Scholar] [CrossRef]
- Gao, C.; Su, B.; Sun, M.; Zhang, X.; Zhang, Z. Interprovincial transfer of embodied primary energy in China: A complex network approach. Appl. Energy 2018, 215, 792–807. [Google Scholar] [CrossRef]
- He, B.J. Towards the next generation of green building for urban heat island mitigation: Zero UHI impact building. Sustain. Cities Soc. 2019, 50, 101647. [Google Scholar] [CrossRef]
- Cui, L.B.; Peng, P.; Zhu, L. Embodied energy, export policy adjustment and China’s sustainable development: A multi-regional input–output analysis. Energy 2015, 82, 457–467. [Google Scholar] [CrossRef]
- Qin, G.; Zhang, P.; Wang, Y. Investigating an assessment model of system oil leakage considering failure dependence. Environ. Sci. Pollut. Res. 2020, 1–13. [Google Scholar] [CrossRef]
- Zhang, G.; He, B.J.; Dewancker, B.J. The maintenance of prefabricated green roofs for preserving cooling performance: A field measurement in the subtropical city of Hangzhou, China. Sustain. Cities Soc. 2020, 61, 102314. [Google Scholar] [CrossRef]
- Wu, R.; Geng, Y.; Liu, W. Trends of natural resource footprints in the BRIC (Brazil, Russia, India and China) countries. J. Clean. Prod. 2017, 142, 775–782. [Google Scholar] [CrossRef]
- Chen, G.Q.; Wu, X.F. Energy overview for globalized world economy: Source, supply chain and sink. Renew. Sustain. Energy Rev. 2017, 69, 735–749. [Google Scholar] [CrossRef]
- Chen, Z.M.; Chen, G.Q. An overview of energy consumption of the globalized world economy. Energy Policy 2011, 39, 5920–5928. [Google Scholar] [CrossRef]
- Wu, X.F.; Chen, G.Q. Coal use embodied in globalized world economy: From source to sink through supply chain. Renew. Sustain. Energy Rev. 2018, 81, 978–993. [Google Scholar] [CrossRef]
- Brown, S.P. New estimates of the security costs of US oil consumption. Energy Policy 2018, 113, 171–192. [Google Scholar] [CrossRef]
- Wu, X.F.; Chen, G.Q. Global overview of crude oil use: From source to sink through inter-regional trade. Energy Policy 2019, 128, 476–486. [Google Scholar] [CrossRef]
- Liu, X.; Klemeš, J.J.; Varbanov, P.S.; Čuček, L.; Qian, Y. Virtual carbon and water flows embodied in international trade: A review on consumption-based analysis. J. Clean. Prod. 2017, 146, 20–28. [Google Scholar] [CrossRef]
- Tang, X.; Zhang, B.; Feng, L.; Snowden, S.; Höök, M. Net oil exports embodied in China’s international trade: An input–output analysis. Energy 2012, 48, 464–471. [Google Scholar] [CrossRef]
- Liu, Q.; Wang, Q. Sources and flows of China’s virtual SO2 emission transfers embodied in interprovincial trade: A multiregional input–output analysis. J. Clean. Prod. 2017, 161, 735–747. [Google Scholar] [CrossRef]
- Qin, G.; Zhang, P.; Hou, X.; Wu, S.; Wang, Y. Risk assessment for oil leakage under the common threat of multiple natural hazards. Environ. Sci. Pollut. Res. 2020, 27, 16507–16520. [Google Scholar] [CrossRef] [PubMed]
- Acquaye, A.; Feng, K.; Oppon, E.; Salhi, S.; Ibn-Mohammed, T.; Genovese, A.; Hubacek, K. Measuring the environmental sustainability performance of global supply chains: A multi-regional input–output analysis for carbon, sulphur oxide and water footprints. J. Environ. Manag. 2017, 187, 571–585. [Google Scholar] [CrossRef]
- Heihsel, M.; Lenzen, M.; Malik, A.; Geschke, A. The carbon footprint of desalination: An input–output analysis of seawater reverse osmosis desalination in Australia for 2005–2015. Desalination 2019, 454, 71–81. [Google Scholar] [CrossRef]
- Nagashima, S.; Uchiyama, Y.; Okajima, K. Hybrid input–output table method for socioeconomic and environmental assessment of a wind power generation system. Appl. Energy 2017, 185, 1067–1075. [Google Scholar] [CrossRef]
- Wiedmann, T. A review of recent multi-region input–output models used for consumption-based emission and resource accounting. Ecol. Econ. 2009, 69, 211–222. [Google Scholar] [CrossRef]
- Liu, L.C.; Liang, Q.M.; Wang, Q. Accounting for China’s regional carbon emissions in 2002 and 2007: Production-based versus consumption-based principles. J. Clean. Prod. 2015, 103, 384–392. [Google Scholar] [CrossRef]
- Sudmant, A.; Gouldson, A.; Millward-Hopkins, J.; Scott, K.; Barrett, J. Producer cities and consumer cities: Using production-and consumption-based carbon accounts to guide climate action in China, the UK, and the US. J. Clean. Prod. 2018, 176, 654–662. [Google Scholar] [CrossRef]
- Han, M.; Yao, Q.; Liu, W.; Dunford, M. Tracking embodied carbon flows in the Belt and Road regions. J. Geogr. Sci. 2018, 28, 1263–1274. [Google Scholar] [CrossRef]
- Zhang, B.; Qiao, H.; Chen, Z.M.; Chen, B. Growth in embodied energy transfers via China’s domestic trade: Evidence from multi-regional input–output analysis. Appl. Energy 2016, 184, 1093–1105. [Google Scholar] [CrossRef]
- Wu, D.; Liu, J. Multi-Regional Input–Output (MRIO) study of the provincial ecological footprints and domestic embodied footprints traded among China’s 30 provinces. Sustainability 2016, 8, 1345. [Google Scholar] [CrossRef]
- Chen, B.; Han, M.Y.; Peng, K.; Zhou, S.L.; Shao, L.; Wu, X.F.; Wei, W.D.; Liu, S.Y.; Li, Z.; Li, J.S.; et al. Global land-water nexus: Agricultural land and freshwater use embodied in worldwide supply chains. Sci. Total Environ. 2018, 613, 931–943. [Google Scholar] [CrossRef] [PubMed]
- Su, B.; Ang, B.W. Multi-region comparisons of emission performance: The structural decomposition analysis approach. Ecol. Indic. 2016, 67, 78–87. [Google Scholar] [CrossRef]
- Yang, Z.; Liu, H.; Xu, X.; Yang, T. Applying the water footprint and dynamic structural decomposition analysis on the growing water use in China during 1997–2007. Ecol. Indic. 2016, 60, 634–643. [Google Scholar] [CrossRef]
- Deng, G.; Xu, Y. Accounting and structure decomposition analysis of embodied carbon trade: A global perspective. Energy 2017, 137, 140–151. [Google Scholar] [CrossRef]
- Jiang, X.; Guan, D. The global CO2 emissions growth after international crisis and the role of international trade. Energy Policy 2017, 109, 734–746. [Google Scholar] [CrossRef]
- Li, F.; Song, Z.; Liu, W. China’s energy consumption under the global economic crisis: Decomposition and sectoral analysis. Energy Policy 2014, 64, 193–202. [Google Scholar] [CrossRef]
- Gao, H.; Gu, A.; Wang, G.; Teng, F. A structural decomposition analysis of China’s consumption-based greenhouse gas emissions. Energies 2019, 12, 2843. [Google Scholar] [CrossRef]
- Zhao, Y.; Wang, S.; Zhang, Z.; Liu, Y.; Ahmad, A. Driving factors of carbon emissions embodied in China-US trade: A structural decomposition analysis. J. Clean. Prod. 2016, 131, 678–689. [Google Scholar] [CrossRef]
- Xu, S.; Gao, C.; Li, Y.; Ma, X.; Zhou, Y.; He, Z.; Zhao, B.; Wang, S. What influences the cross-border air pollutant transfer in China-United States trade: A comparative analysis using the extended IO-SDA method. Sustainability 2019, 11, 6252. [Google Scholar] [CrossRef]
- Wang, H.; Ang, B.W.; Su, B. Multiplicative structural decomposition analysis of energy and emission intensities: Some methodological issues. Energy 2017, 123, 47–63. [Google Scholar] [CrossRef]
- Leontief, W.; Strout, A. Multiregional input–output analysis. In Structural Interdependence and Economic Development; Barna, T., Ed.; Palgrave Macmillan: London, UK, 1963. [Google Scholar]
- Steen-Olsen, K.; Owen, A.; Barrett, J.; Guan, D.; Hertwich, E.G.; Lenzen, M.; Wiedmann, T. Accounting for value added embodied in trade and consumption: An intercomparison of global multiregional input–output databases. Econ. Syst. Res. 2016, 28, 78–94. [Google Scholar] [CrossRef]
- Yang, X.; Zhang, W.; Fan, J.; Yu, J.; Zhao, H. Transfers of embodied PM2.5 emissions from and to the North China region based on a multiregional input–output model. Environ. Pollut. 2018, 235, 381–393. [Google Scholar] [CrossRef] [PubMed]
- Aydin, C.; Esen, Ö. Does the level of energy intensity matter in the effect of energy consumption on the growth of transition economies? Evidence from dynamic panel threshold analysis. Energy Econ. 2017, 69, 185–195. [Google Scholar]
- Cansino, J.M.; Román, R.; Ordóñez, M. Main drivers of changes in CO2 emissions in the Spanish economy: A structural decomposition analysis. Energy Policy 2016, 89, 150–159. [Google Scholar] [CrossRef]
- Wang, H.; Xu, J.; Wang, D.; Zhang, T.; Liu, Y. Cleaner production based on sustainable development in Chinese power plants. Environ. Eng. Sci. 2015, 32, 461–469. [Google Scholar] [CrossRef]
- Timmer, M.P.; Dietzenbacher, E.; Los, B.; Stehrer, R.; De Vries, G.J. An illustrated user guide to the world input–output database: The case of global automotive production. Rev. Int. Econ. 2015, 23, 575–605. [Google Scholar] [CrossRef]
- Wang, H.; Xu, J.; Zhao, W.; Zhang, J. Effects and risk evaluation of oil spillage in the sea areas of Changxing Island. Int. J. Environ. Res. Public Health 2014, 11, 8491–8507. [Google Scholar] [CrossRef]
- Werner, A.K.; Vink, S.; Watt, K.; Jagals, P. Environmental health impacts of unconventional natural gas development: A review of the current strength of evidence. Sci. Total Environ. 2015, 505, 1127–1141. [Google Scholar] [CrossRef]
- Walmsley, T.; Hertel, T. China’s accession to the WTO: Timing is everything. World Econ. 2000, 24, 1019–1049. [Google Scholar] [CrossRef]


© 2020 by the authors. Licensee MDPI, Basel, Switzerland. This article is an open access article distributed under the terms and conditions of the Creative Commons Attribution (CC BY) license (http://creativecommons.org/licenses/by/4.0/).