Histidine Decorated Nanoparticles of CdS for Highly Efficient H2 Production via Water Splitting


Abstract
:1. Introduction
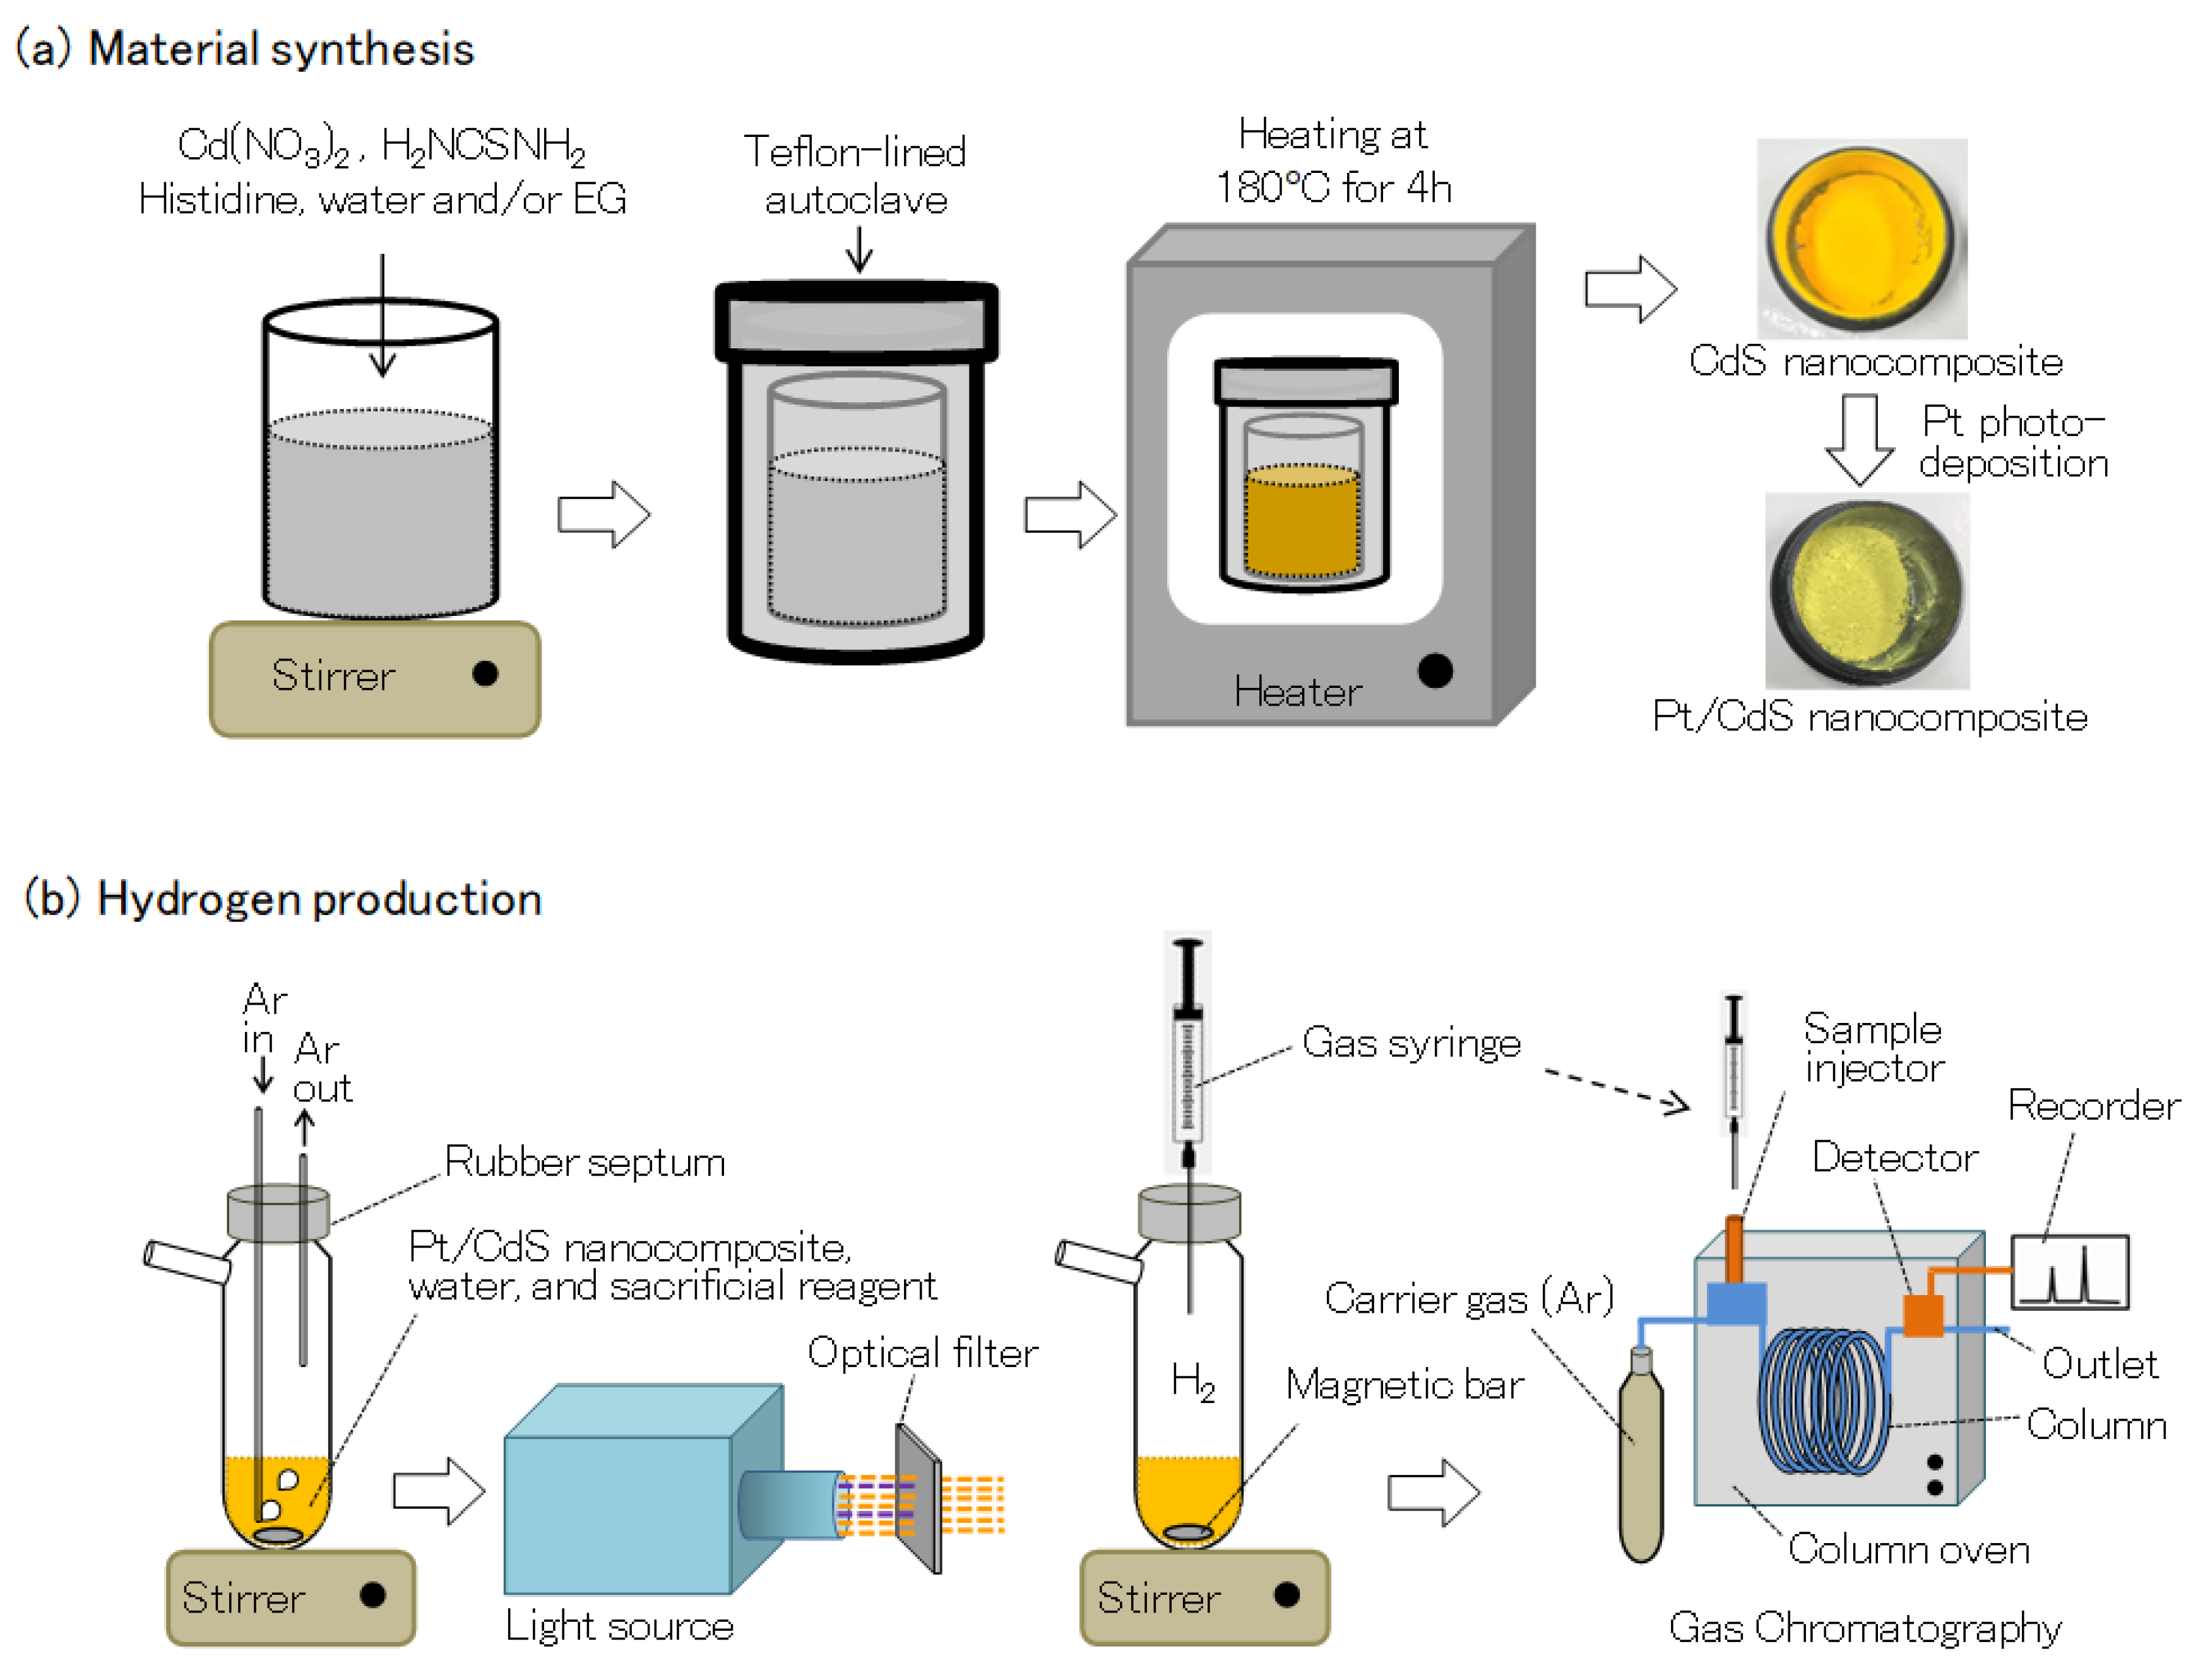
2. Materials and Methods
3. Results and Discussion
4. Conclusions
Author Contributions
Funding
Acknowledgments
Conflicts of Interest
References
- Kudo, A.; Miseki, Y. Heterogeneous photocatalyst materials for water splitting. Chem. Soc. Rev. 2009, 38, 253–278. [Google Scholar] [CrossRef] [PubMed]
- Vaquero, F.; Navarro, R.M.; Fierro, J.L.G. Evolution of the nanostructure of CdS using solvothermal synthesis at different temperature and its influence on the photoactivity for hydrogen production. Int. J. Hydrog. Energy 2016, 41, 11558–11567. [Google Scholar] [CrossRef]
- Wang, Y.; Wang, Y.; Xu, R. Photochemical deposition of Pt on CdS for H2 evolution from water: Markedly enhance activity by controlling Pt reduction environment. J. Phys. Chem. C 2013, 117, 783–790. [Google Scholar] [CrossRef]
- Lingampalli, S.S.R.; Gautam, U.K.; Rao, C.N.R. Highly efficient photocatalytic hydrogen generation by solution-processed ZnO/Pt/CdS, ZnO/Pt/Cd1−xZnxS and ZnO/Pt/CdS1−xSex hybrid nanostructures. Energy Environ. Sci. 2013, 6, 2589–3594. [Google Scholar] [CrossRef]
- Kalisman, P.; Nakibli, Y.; Amirav, L. Perfect photo-to-hydrogen conversion efficiency. Nanol Lett. 2016, 16, 1776–1781. [Google Scholar] [CrossRef]
- Ma, D.; Shi, J.-W.; Zou, Y.; Fan, Z.; Ji, X.; Niu, C.; Wang, L. Rational design of CdS@ZnO core-shell structure via atomic layer deposition for drastically enhanced photocatalytic H2 evolution with excellent photostability. Nano Energy 2017, 39, 183–191. [Google Scholar] [CrossRef] [Green Version]
- Bao, N.; Shen, L.; Takata, T.; Domen, K. Self-templated synthesis of nanoporous CdS nanostructures for highly efficient photocatalytic hydrogen production under visible light. Chem. Matter. 2008, 20, 110–117. [Google Scholar] [CrossRef]
- Zhang, B.; Yao, W.; Huang, C.; Xu, Q.; Wu, Q. Shape effects of CdS photocatalysts on hydrogen production. Int. J. Hydrog. Energy 2013, 38, 7224–7231. [Google Scholar] [CrossRef]
- Li, C.; Yuan, J.; Han, B.; Shangguan, W. Synthesis and photochemical performance of morphology-controlled CdS photocatalysts for hydrogen evolution under visible light. Int. J. Hydrog. Energy 2011, 36, 4271–4279. [Google Scholar] [CrossRef]
- Muruganandham, M.; Kusumoto, Y.; Okamoto, C.; Muruganandham, A.; Mamun, M.A.; Ahmmad, B. Mineralizer-assisted shape-controlled synthesis, characterization, and photocatalytic evaluation of CdS microcrystals. J. Phys. Chem. C 2009, 113, 19506–19517. [Google Scholar] [CrossRef]
- Zhang, L.; Hao, X.; Jian, Q.; Jin, Z. Ferrous oxalate dehydrate over CdS as Z-scheme photo catalytic hydrogen evolution. J. Solid State Chem. 2019, 274, 286–294. [Google Scholar] [CrossRef]
- Lu, J.; Zhang, X.; Gao, H.; Cui, W. Three-dimensional structure of PANI/CdS NRs-SiO2 hydrogen for photocatalytic hydrogen evolution with high activity and stability. Nanomaterials 2019, 9, 427. [Google Scholar] [CrossRef] [PubMed] [Green Version]
- Wang, Q.; Lian, J.; Li, J.; Wang, R.; Huan, H.; Su, B.; Lei, Z. Highly efficient photocatalytic hydrogen production of flower-like cadmium sulfide decorated by histidine. Sci. Rep. 2015, 5, 13593. [Google Scholar] [CrossRef] [PubMed] [Green Version]
- Li, Y.; Hu, Y.; Lu, G.; Li, S. Synthesis of CdS nanorods by an ethylenediamine assisted hydrothermal method for photo catalytic hydrogen evolution. J. Phys. Chem. C 2009, 113, 9352–9358. [Google Scholar] [CrossRef]
- Qingqing, W.; Gang, X.; Gaorong, H. Solvothermal synthesis and characterization of uniform CdS nanowires in high yield. J. Solid State Chem. 2005, 178, 2680–2685. [Google Scholar] [CrossRef]
- Murugan, A.V.; Sonawane, R.S.; Kale, B.B.; Apte, S.K.; Kulkarni, A.V. Microwave-solvothermal synthesis of nanocrystalline cadmium sulfide. Mater. Chem. Phys. 2001, 71, 98–102. [Google Scholar] [CrossRef]
- Xu, D.; Liu, Z.; Liang, J.; Qian, Y. Solvothermal synthesis of CdS nanowires in a mixed solvent of ethylenediamine and dodecanethiol. J. Phys. Chem. B 2005, 109, 14344–14349. [Google Scholar] [CrossRef] [PubMed]
- Vamvasakis, I.; Liu, B.; Armatas, G.S. Size effects of platinum nanoparticles in the photocatalytic hydrogen production over 3D mesoporous networks of CdS and Pt nanojunctions. Adv. Funct. Mater. 2016, 26, 8052–8071. [Google Scholar] [CrossRef]
- Kauthale, S.S.; Tekale, S.U.; Jadhav, K.M.; Pawar, R.P. Ethylene glycol promoted catalyst-free pseudo three-component green synthesis of bis(coumarin)s and bis(3-methyl-1-phenyl-1 H-pyrozol-5-ol)s. Mol. Divers. 2016, 20, 763–770. [Google Scholar] [CrossRef]
- Verma, S.; Jain, S.L. Complexation of KBr3 with poly(ethylene glycol): Efficient bromination of aromatics under solvent-less conditions. Org. Chem. Curr. Res. 2012, 1, 100105. [Google Scholar] [CrossRef] [Green Version]
- Akerlof, G. Dielectric constants of some organic solvent-water mixture at various temperatures. J. Am. Chem. Soc. 1932, 54, 4125–4139. [Google Scholar] [CrossRef]
- Saravanan, L.; Jayavel, R.; Aldeyab, S.S.; Zaidi, J.S.M.; Ariga, K.; Vinu, A. Synthesis and morphological control of europium doped cadmium sulfide nanocrystals. J. Nanosci. Nanotechnol. 2011, 11, 7783–7788. [Google Scholar] [CrossRef] [PubMed]
- Li, Q.; Guo, B.; Yu, J.; Ran, J.; Zhang, B.; Yan, H.; Gong, J.R. Highly efficient visible-light-driven photocatalytic hydrogen production of CdS-Cluster-decorated graphene nanosheets. J. Am. Chem. Soc. 2011, 133, 10878–10884. [Google Scholar] [CrossRef] [PubMed]
- Qiu, W.; Xu, M.; Yang, X.; Chen, F.; Nan, Y.; Chen, H. Novel hierarchical CdS crystals by an amino acid mediated hydrothermal process. J. Alloys Compd. 2011, 509, 8413–8420. [Google Scholar] [CrossRef]
- Sing, K.S.W.; Everett, D.H.; Haul, R.A.W.; Moscou, L.; Pierotti, R.A.; Rouquerol, J.; Siemieniewska, T. Reporting physisorption data for gas/solid systems with special reference to the determination of surface area and porosity. Pure Appl. Chem. 1985, 57, 603–619. [Google Scholar] [CrossRef]
- Yu, J.G.; Yu, H.G.; Cheng, B.; Zhou, M.H.; Zhao, X.J. Enhanced photo catalytic activity of TiO2 powder (P25) by hydrothermal treatment. J. Mol. Catal. A Chem. 2006, 253, 112. [Google Scholar] [CrossRef]
- Ikuma, Y.; Bessho, H. Effect of Pt concentration on the production of hydrogen by a TiO2 photocatalyst. Int. J. Hydrog. Energy 2007, 32, 2689–2692. [Google Scholar] [CrossRef]
- Oros-Ruiz, S.; Hernandez-Gordillo, A.; Garcia-Mendoza, C.; Rodriguez-Rodriguez, A.A.; Gomez, R. Comparative activity of CdS nanofibers superficially modified by Au, Cu, Ni nanoparticles as co-catalysts for photocatalytic hydrogen production under visible light. J. Chem. Technol. Biotechnol. 2016, 91, 2205–2210. [Google Scholar] [CrossRef]
- Ahmmad, B.; Kusumoto, Y.; Somekawa, S.; Ikeda, M. Carbon nanotubes synergistically enhance photocatalytic activity of TiO2. Catal. Commun. 2008, 9, 1410–1413. [Google Scholar] [CrossRef]
- Gerischer, H. The impact of semiconductors on the concepts of electrochemistry. Electrochim. Acta 1990, 35, 1677–1699. [Google Scholar] [CrossRef]
- Xu, J.; Wang, L.; Cao, X. Polymer supported graphene-CdS composite catalyst with enhanced photocatalytic hydrogen production from water splitting under visible light. Chem. Eng. J. 2016, 238, 816–825. [Google Scholar] [CrossRef]
- Holmes, M.A.; Townsend, T.K.; Osterloh, F. Quantum confinement controlled photocatalytic water splitting by suspended CdSe nanocrystals. Chem. Commun. 2012, 48, 371–373. [Google Scholar] [CrossRef] [PubMed] [Green Version]
- Zhang, K.; Guo, L. Metal sulphide semiconductors for photo catalytic hydrogen production. Catal. Sci. Technol. 2013, 3, 1672–1690. [Google Scholar] [CrossRef]
- Xiao, Q.; Xiao, C.; Ouyang, L. Strong enhancement of band-edge photoluminescence in CdS nanocrystals prepared by one-step aqueous synthesis method. J. Lumin. 2008, 128, 1942–1947. [Google Scholar] [CrossRef]
- Ghamsari, M.S.; Ghamsari, A.H.S. CdS colloidal nanocrystals with narrow green emission. J. Nanophotonics 2016, 10, 026007. [Google Scholar] [CrossRef]


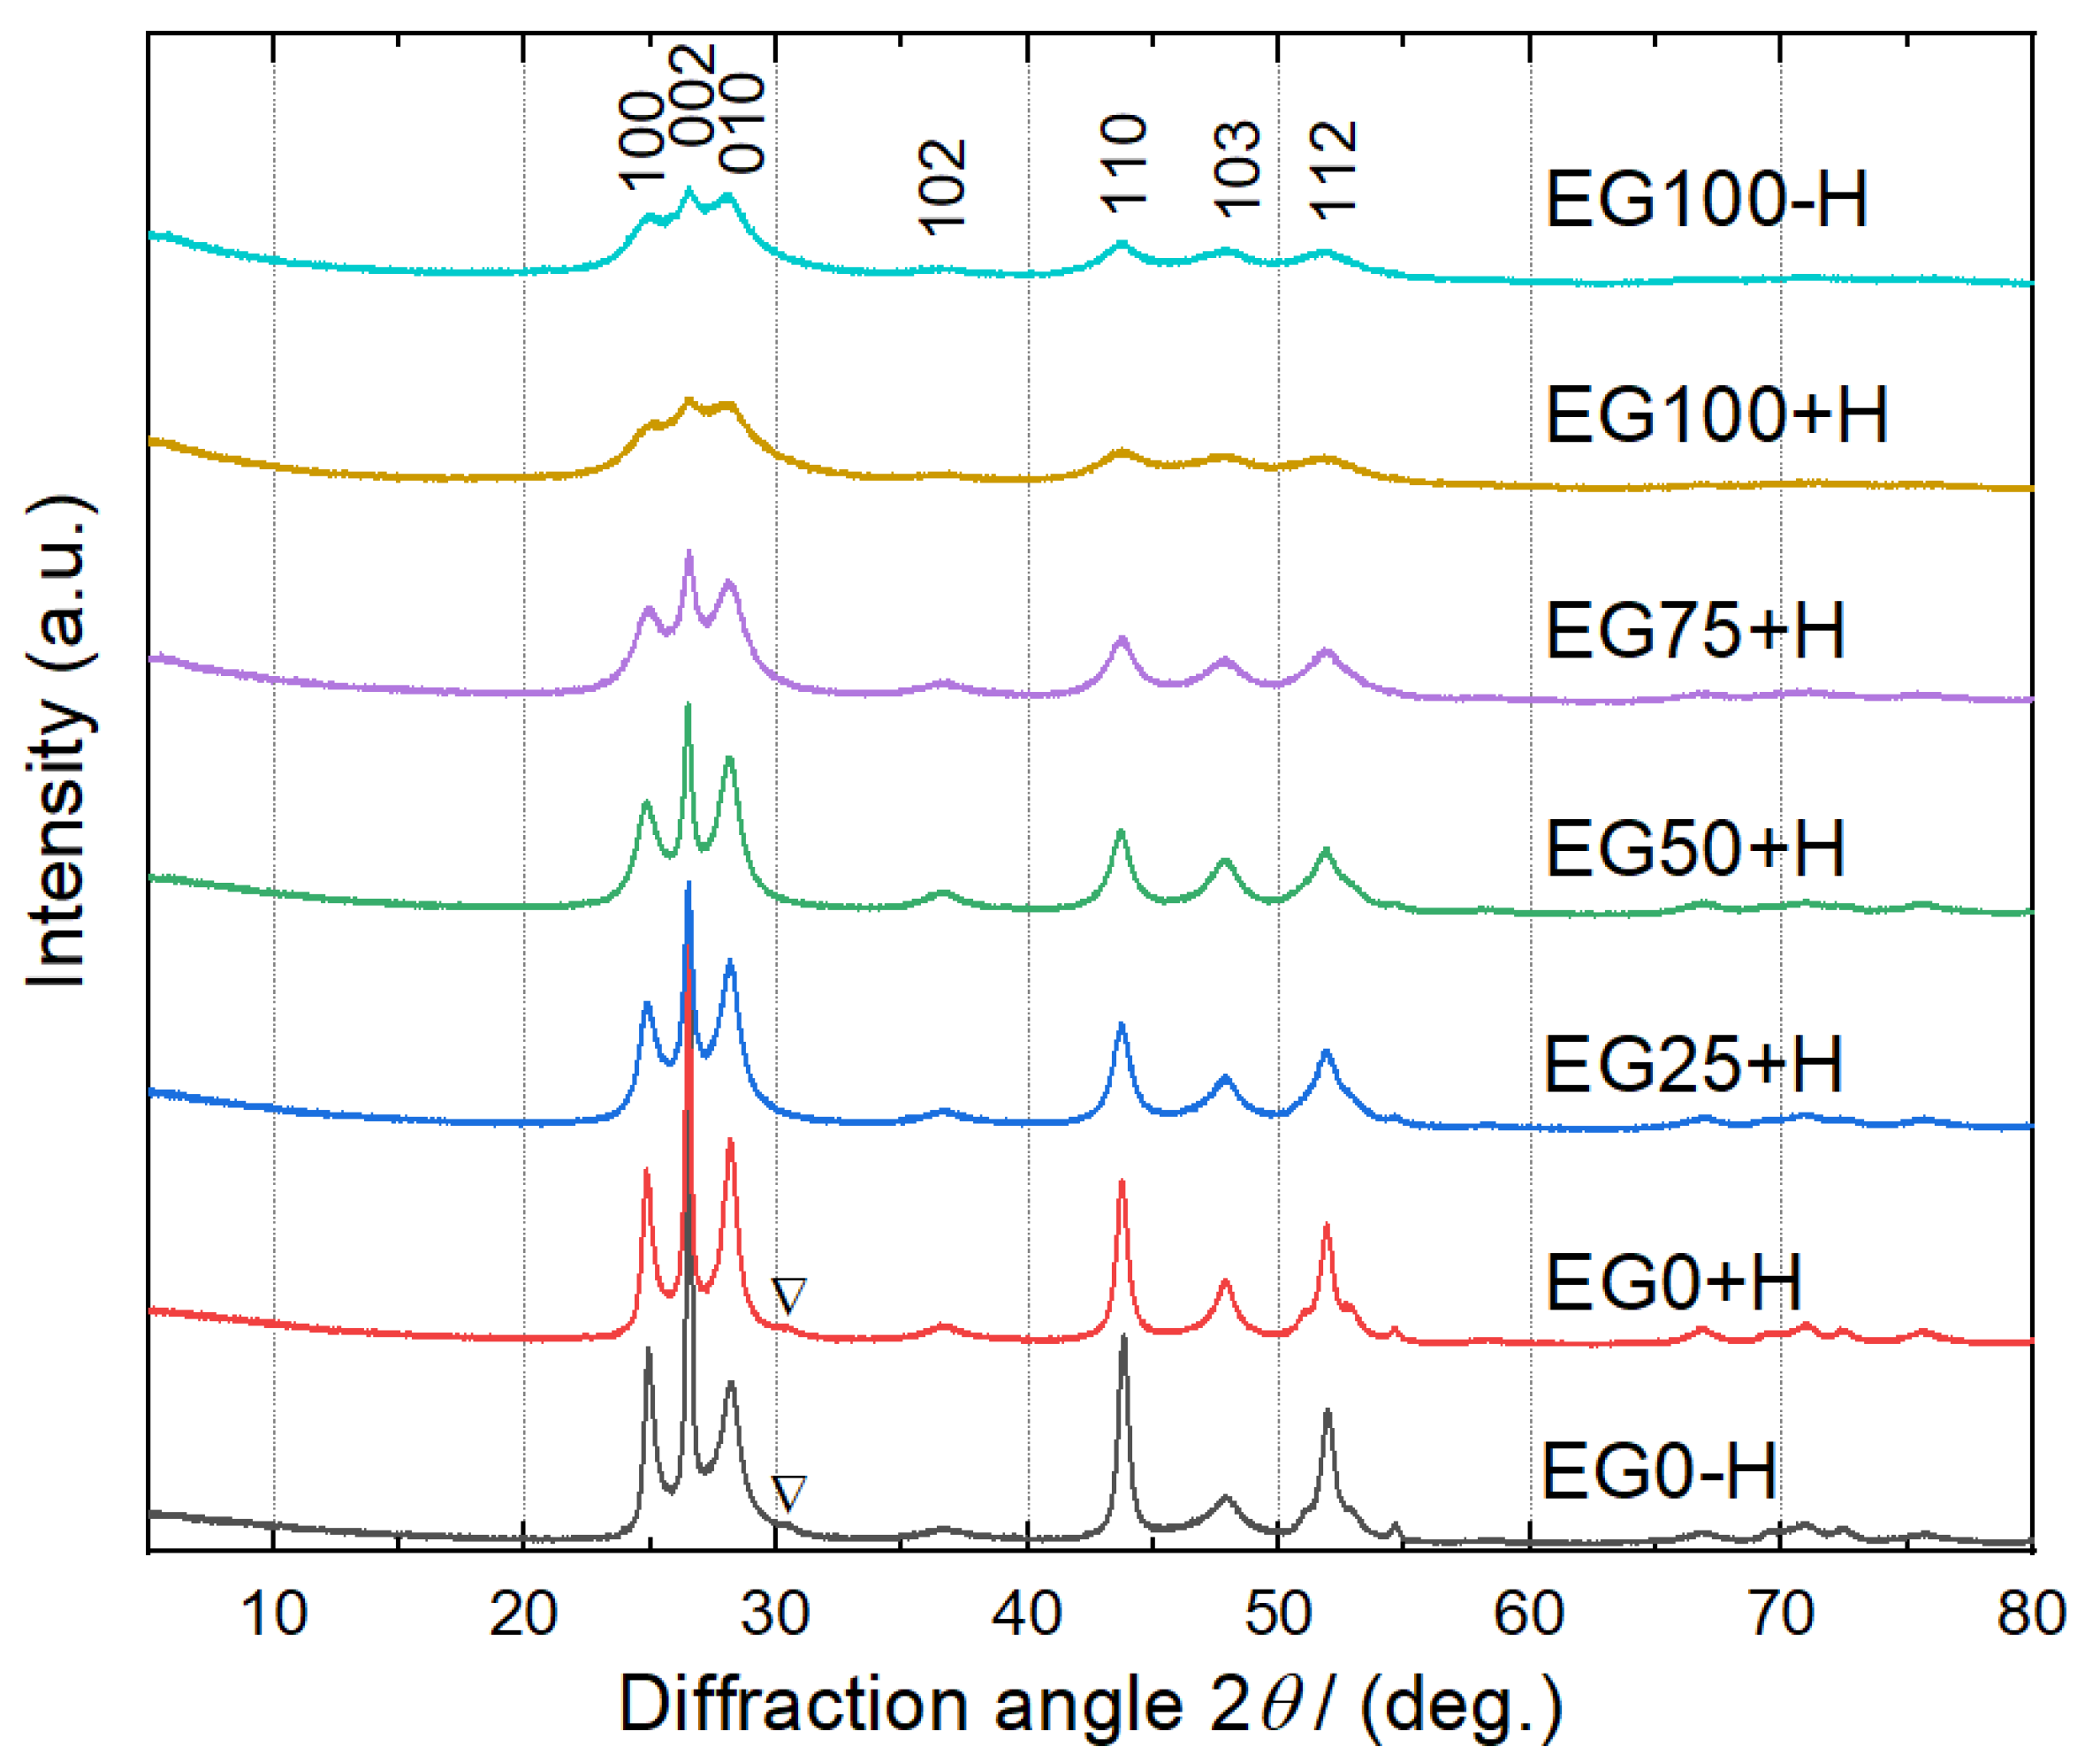
| Sample | EG0-H | EG0+H | EG25+H | EG50+H | EG75+H | EG100+H | EG100-H |
|---|---|---|---|---|---|---|---|
| Crystal size (nm) | 44.3 | 42.3 | 28.0 | 22.7 | 20.3 | 10.1 | 11.7 |
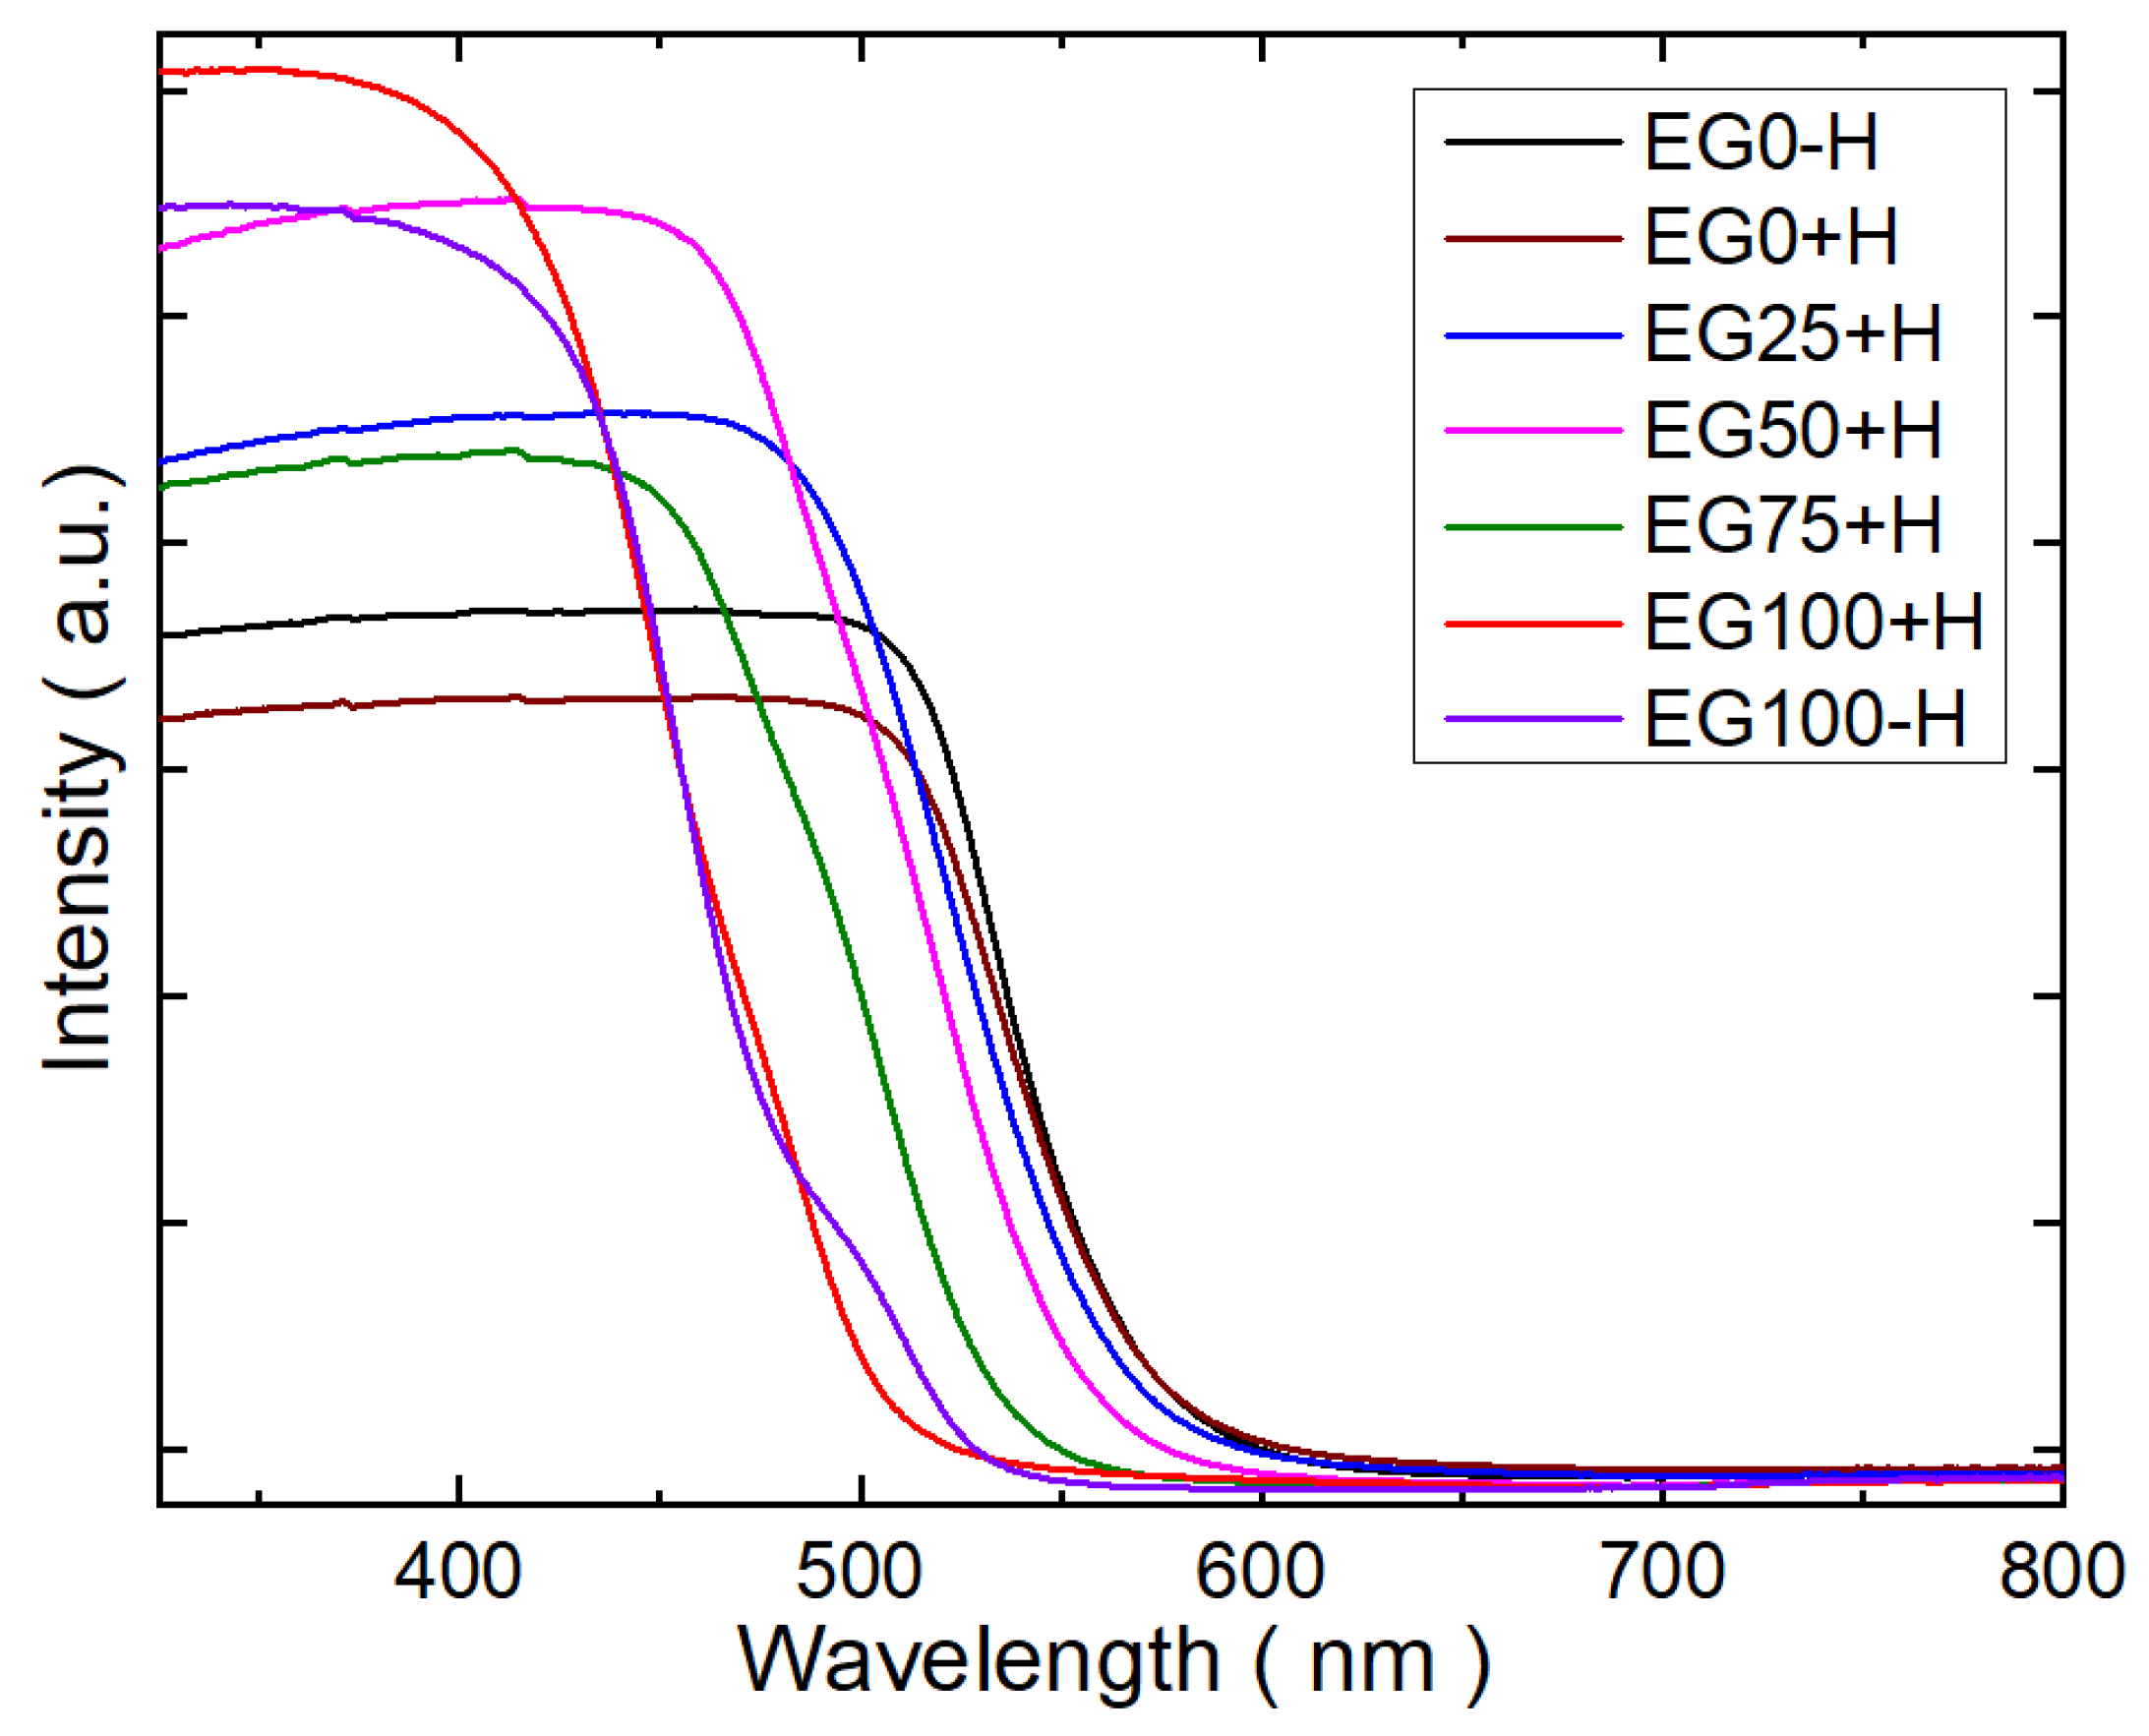
| Sample | EG0-H | EG0+H | EG25+H | EG50+H | EG75+H | EG100+H | EG100-H |
|---|---|---|---|---|---|---|---|
| Wavelength (nm) | 550 | 550 | 535 | 520 | 510 | 485 | 490 |
| Bandgap (eV) | 2.25 | 2.25 | 2.32 | 2.38 | 2.43 | 2.56 | 2.53 |
© 2020 by the authors. Licensee MDPI, Basel, Switzerland. This article is an open access article distributed under the terms and conditions of the Creative Commons Attribution (CC BY) license (http://creativecommons.org/licenses/by/4.0/).
Share and Cite
Tojo, F.; Ishizaki, M.; Kubota, S.; Kurihara, M.; Hirose, F.; Ahmmad, B. Histidine Decorated Nanoparticles of CdS for Highly Efficient H2 Production via Water Splitting. Energies 2020, 13, 3738. https://doi.org/10.3390/en13143738
Tojo F, Ishizaki M, Kubota S, Kurihara M, Hirose F, Ahmmad B. Histidine Decorated Nanoparticles of CdS for Highly Efficient H2 Production via Water Splitting. Energies. 2020; 13(14):3738. https://doi.org/10.3390/en13143738
Chicago/Turabian StyleTojo, Fumiya, Manabu Ishizaki, Shigeru Kubota, Masato Kurihara, Fumihiko Hirose, and Bashir Ahmmad. 2020. "Histidine Decorated Nanoparticles of CdS for Highly Efficient H2 Production via Water Splitting" Energies 13, no. 14: 3738. https://doi.org/10.3390/en13143738
APA StyleTojo, F., Ishizaki, M., Kubota, S., Kurihara, M., Hirose, F., & Ahmmad, B. (2020). Histidine Decorated Nanoparticles of CdS for Highly Efficient H2 Production via Water Splitting. Energies, 13(14), 3738. https://doi.org/10.3390/en13143738