Advanced Distribution Measurement Technologies and Data Applications for Smart Grids: A Review


Abstract
1. Introduction
- A comparison of eight advanced measurement devices for distribution networks, based on their technical characteristics, including reporting periods, observability, measure quantities, precision, and sample rate.
- A review of the most recent applications of micro-Phasor Measurement Units, Smart Meters, and Power Quality Monitoring devices used in distribution systems, considering different novel methods applied for data analysis.
- An input-output table that relates the measured quantities from PMUs and smart meters needed for each specific application found in this review. To our knowledge, this is the first time that a review integrates the input data according to each application.
2. Advanced Measurement Devices for Active Distribution Networks
2.1. Monitoring Active Distribution Networks
2.2. Types of Measurement Devices in Distribution Systems
- Power Sensor: The power sensor provide the supervision, back-up management, control, and regulation of power grids usually for SCADA systems. This sensor is able to measure the Root Mean Square (RMS) value of the voltage, active, and reactive power measurements, each 2–4 s. Then, this information is sent to a master station that allows the operator to monitor and control the grid. In recent years, hybrid SCADA systems based on distribution phasor measurement units have been proposed to enhance the observability on distribution networks [47,48]. In Reference [49], the authors proposed a SCADA system based on internet of things, which had integrated a fog router and a cloud architecture that takes care of outage managements. This fog router was able to locate faults in a distribution system using voltages and currents from smart meters and line sensors.
- Smart Meter: Smart meters are electronic devices that measure active and reactive power, current, voltage RMS, and, in some cases, power quality data, with a measurement accuracy of ±1% or ±0.5%, with an adjustable reporting rate from 1 to 60 min. They are usually installed in the low voltage side of the distribution system. The main functionalities of smart meters are for automatic billing and energy management. The two-way communication is the most important difference that distinguishes advanced smart meters from conventional smart meters [50]. In smart distribution grids, smart meters provide consumers and energy providers knowledge about the price information generally every 15 to 30 min. This enables the consumer to know when is the cheapest time to use energy and also to manage their own consumption. Electric service companies control smart meters remotely and use this information to forecast their daily production. In Section 4, recent smart meters data application are analysed, such as Non-Technical Loss (NTL) detection, customer characterization, and load clustering with recent novel techniques.
- Micro-Phasor Measurement Unit: The PMU is currently the most advanced measurement device used in medium and low voltage level for distribution grids. It is able to measure different quantities, such as 3-phase voltage phasors, 3-phase current phasors, active power, reactive power, and frequency, with a reporting rate up to 120 samples each second, in a 60 Hz system. This last feature allows the operator to observe dynamic and transient events on the distribution system with a sampling rate of over 30 kHz. Furthermore, the high sampling rate allows to have an angle accuracy of ±0.010° and an amplitude accuracy of ±0.05%. The PMU has precise time stamps that are synchronized with the phase angle between multiple locations. In Reference [51], an experimental microgrid was developed using seven PMUs located at the Lawrence Berkeley National Laboratory. This was the first pilot network at distribution-level using PMUs.
- Phasor Measurement Unit: The PMU is a measurement device that was originally developed to observe the dynamic operation of transmission power grids. However, the use of PMUs in active distribution grids, can also be a very helpful tool to estimate the state variables of a distribution system. This device has the ability to measure 3-phase voltage phasors, 3-phase current phasors, active power, reactive power, frequency, and power factor, with a reporting period of 10–60 samples each second. Although the operator is able to observe steady and dynamic state conditions, it lacks in observing transient events. Most of the commercial PMUs have a maximum sample rate of 2880 Hz, angle accuracy of ±1°, and amplitude accuracy of ±1%. The PMUs also have precise time stamps that compare and synchronize the phase angle between different locations. PMUs are used in Wide-Area Measurement Systems (WAMS) to improve the monitoring, protection, and control of power networks, some of these applications are discussed in Reference [52,53].
- Power Quality Monitor: The PQM is an advanced measurement device that collect difference quantities, such as frequency, RMS voltage, currents, total harmonic distortion, individual harmonics, and flickers. The PQM have a maximum sample rate of 4 MHz, which is the best performance of all the presented devices, having a sensor accuracy of ±0.1% and ±0.2%. This key feature allows to track transient events and harmonic sources in a distribution grid with high precision. The PQMs devices are being widely deployed in distribution systems due to the growing penetration of renewable sources, energy storage systems, and electronic devices installed in distribution networks. Some recent applications of PQM devices used for power quality distribution monitoring are presented in Section 4.
- Substation Meters: Substation meters are wireless sensors located on transmission and distribution substations. Their main function is to measure active power, reactive power, complex current and complex voltage typically at a frequency rate of 1 Hz (1 measurement each second). A recent work has developed an online learning algorithm for energy management and energy balance for a three-phase distribution feeder. This algorithm uses sensor fusion to incorporate output equations from real measurements, such as active and reactive power flow, complex bus voltage measurements from distribution substation measurements, and residential smart meter measurements [40].
- Digital Fault Recorder (DFR): The DFR is an automatic recorder capable of storing transient fault events from different protection relays distributed at the substation level (Medium Voltage). Its main functionality is to automatically record and store events in a local database so that the operator has all the information to perform fault and post-mortem disturbance analysis with higher resolution and accuracy than power line sensors. The Digital fault recorder have a precise measurement recorder, sensor accuracy of ±0.1%, and a sampling rate of 512 samples per cycle (25.6 kHz), ideal for monitoring transients from flexible alternating current transmission systems and switching operational events [41].
- Wireless Power Line Sensor (PLS): The overhead line sensor is a low investment cost device used primarily to monitor the status of distribution lines, including line faults, line loads, power quality, conductor temperature and can also optimize the distribution network topology. Power line sensors report line status up to every 5 min at a sampling rate of 12.8 kHz and sensor accuracy of ±0.5%. The sensor can be charged with a minimum current flow of 1 ampere, saving the use of batteries. The main advantages are low maintenance, remote configuration and easy installation on live networks. The PLS can also send warning messages to distribution system operator when a fault event occurs [42].
3. Communication of Advanced Measurement Technology in Distribution Systems
3.1. PMU Storage and Communication System
3.2. Smart Meter Communication
3.3. Power Quality Monitor Communication
4. Distribution Measurement Technologies: Application of Data
4.1. PMU Data Applications
- Situational Awareness: Most of applications are driven to aware distribution operator of transient events due to the high sampling frequency and communication abilities of PMUs. In Reference [66], the authors proposed a method based on the compensation theorem to detect abnormal events in distribution systems. This method generates an equivalent circuit using the current and voltage phasors captured by PMUs. Similarly, a cumulative sum (CUSUM) algorithm was proposed in Reference [67] to detect anomalies having limited micro-PMUs. Validation results showed the effectiveness of this algorithm to voltage, current, and active power changes in the distribution system. In Reference [68], the authors proposed the multi-class Support Vector Machine (SVM) method to detect and classify abnormal events based on large volumes of data. A total of 1.2 billion real measurements of two micro-PMU installed in a distribution feeder were analyzed to evaluate their actual performance and were validated with two different methods, which are K-Nearest Neighbor (k-NN) and Decision Tree (DT). The results showed that the proposed technique can accurately identify a total of 10,700 events, outperforming the other two evaluated techniques. In Reference [69], a generalized Graph Laplacian Matrix (GLM) to visualize different voltage and current events in a real test feeder was proposed. Moreover, a kernel principle component analysis and a partially Support Vector Machine (pSVM) was used in Reference [70] for voltage sags detection based on data index and reconstruction error. The effectiveness of these methods were tested on a real distribution network with PMUs. In Reference [71], the authors proposed a Granger causality technique to analyze the frequency event propagation from the transmission network to the main feeder of a distribution network using PMUs measurements. The authors also proposed a sparse coding method to determine the spectral frequency of abnormal events. The proposed approach was tested with real-time data from a public network located in Riverside, California. In Reference [72], the authors proposed a state estimator to identify faults in distribution lines using micro-PMUs. This estimator determines the error, using a weighted residual metric. Validation tests have shown that the proposed estimator correctly detects and locates distribution line failures in presence of bi-directional flows. In Reference [73], an experimental analysis of lightening strikes was proposed using PMU data collected during a day of rainstorms. The main interest of the study was to analyze the transient response of a 7.5 MW PV farm and its associated substation. Results showed the high resolution of micro-PMU to capture transients of current and voltage phasors during lightening-induced events. Reference [74] proposed a parametric sparsity method to detect and locate events from distribution grids. An optimization algorithm based on particle swarm was proposed in Reference [75] to coordinate overcurrent relays installed in microgrids and distribution networks. In addition, a technique to identify uncertainties in real-time was also proposed. Authors in Reference [76] proposed a method to synthesize steady state models for multiple-sections of active distribution networks (unbalanced) using real-time PMU data. Additionally, a Kalman filtering technique was proposed to extract the quasi-steady state components, noise filtration, and outliers from PMUs. The results from two simulated events demonstrate that the proposed technique can produce an accurate model for any feeder configuration located between PMUs installed in active distribution networks. Authors in Reference [77] evaluated the transmission characteristics of a Rogowski electronic current transformer and an electronic voltage transformer (EVT) in a simulated and real testing platform. Experiment results showed that the EVT and the traditional power transformer have similar performance in the transient process of disconnecting switch breaking. Additionally, the power transformer was not affected by temperature changes, while that in the electronic voltage transformer the temperature had a great influence impact.
- Topology Verification: Distribution networks models are often imprecise or outdated. Topology identification is essential for monitoring and control distribution systems. The PMUs devices are able to extract measurements from network nodes in real-time in order to track topology changes. In Reference [78], the authors proposed a technique to estimate impedances through a reduced Kron matrix also called “subKron” form. Additionally, a recursive clustering algorithm was implemented to reconstruct the topology of radial networks from line impedances. The results of the simulation showed that this technique is robust to measurements with additive noise that is generally captured by micro-PMUs; however, it has limitations when applied to large distribution networks. In Reference [74], the authors proposed an adaptive lasso technique to identify changes in topology caused by permanent failures in distribution systems. This technique is able to locate faults geographically in real time using PMUs that capture voltage and current phasors with high accuracy. The results of this work demonstrated the efficiency of this technique in different case studies. In Reference [79], the authors proposed a method to detect topology changes in distribution networks based on the Time-Series Signature Verification (TSV) method. This method considers the relationship that occur when there are changes in network topology. Validation results showed that the proposed method works satisfactorily with the partial knowledge of the state of the network. Authors in Reference [80] proposed a data driven approach based on the projection of a norm tren vector in to a topology library. This method was able to detect over 32 possible topology scenarios in a distribution grid.
- Classification of Events: The classification of disturbing events is responsible for quantifying abnormal events that occur in the system. Recent approaches of event classification have been explored. In Reference [68], the authors proposed the multi-class Support Vector Machine (SVM) method to classify abnormal events based on large volumes of data. A total of 1.2 billion real measurements of two micro-PMU installed in a distribution feeder were analyzed to evaluate their actual performance, and were validated with two different methods (K-Nearest Neighbor (k-NN) and Decision Tree (DT)). The results showed that the proposed technique can accurately identify a total of 10,700 events, outperforming the other two evaluated techniques. A neural network approach was proposed in Reference [81], using autoencoders along with soft-max classifiers to distinguish two disruptive events. The performance of the algorithm was tested to identify if a capacitor bank switching has a normal load change or if it has a malfunctioned switching. In Reference [82], authors proposed two different algorithms to classify disruptive events in distribution networks. The first algorithm was based on a hybrid combination of Principle Component Analysis (PCA) together with a multi-class SVM, and the second algorithm was with an auto-encoder along with soft-max classifier. Validation results showed the superiority of the second algorithm over the first algorithm in term of accuracy. The data for training and testing was simulated in the IEEE 13-bus distribution system.
- State Estimation (SE): Distribution system state estimation (DSSE) is the minimum set of variables that can be used to describe the dynamic behavior of the system, advanced measurement devices are useful to quantify these variables. In Reference [83], the authors proposed a decentralized state estimator to improve the operating privacy in active distribution networks and microgrids. In this work, the iterative procedure based on quadratic programming was demonstrated, which used micro-PMUs as main inputs. The studies demonstrated a high accuracy of this proposed approach for different scenarios. In Reference [84], the authors proposed a regularized estimator to accurately identify the operating state of the system in a short time. This estimator operated with different measuring devices with different resolutions using data mainly from SCADA-type systems and micro-PMUs. This fusion of data allowed to provide greater robustness of the estimator to noise and less error in the estimation of states. The authors of Reference [85] proposed a weighted least square-based for distribution system state estimation, in which voltages and loads are chosen as state variables to compensate insufficient real-time measurements in medium voltage distribution systems. In Reference [86], the authors proposed a method based on the compensation circuit theory to generate an equivalent circuit. This method was able to estimate and follow the system states when sudden load changes occurred. This method used real measurement from PMUs in a distribution system. In Reference [87], the authors proposed a simple method to determine the state variables based on power line data and bus voltage phasors from micro-PMUs installed in a distribution network. The authors showed that the proposed method can be robust to noise measurements, high levels of distributed generation, and a reduced number of measurements. Authors in Reference [88] proposed an open testbed to evaluate and compare PMU estimation algorithms accuracy under experimental conditions, considering the noise propagation in order to quantify the uncertainty contributions and their impact on the estimates of the variables.
- Optimal Placement: The optimal placement of PMUs aims to maximize the observability of the distribution network while minimizing investment costs. In Reference [84], the authors propose a D-Weighted Total Variation State Estimation (WTVSE) algorithm to estimate system states with a reduced time scale (every 15 min), considering the observations of a SCADA system and micro-PMUs. In addition, a semi-defined scheduling model was proposed to optimally locate micro-PMUs and thus improve state estimation. The results of the simulation of a 95 bus distribution network showed that this proposal presents a great accuracy in the estimation of states under a diversity of scenarios, in addition to its low computational complexity. In Reference [89], the authors proposed a linear programming model to optimally locate phasor measurement units in distribution networks. The aim of this model was to ensure observability during possible changes in topology by operational actions. The results obtained from a medium voltage distribution network in southern China showed that the proposed method is efficient and robust to topology changes. In Reference [67], a greedy search algorithm was proposed for optimal PMUs placement. This algorithm uses an optimal location criterion to achieve maximum observability and therefore increase the monitoring range considering different event scenarios.
- Model Calibration: Dynamic models can be calibrated based on real-time advanced measurements. This is a new field of application that promises to improve the current models. In Reference [90], the authors proposed a methodology to enhance the synchronous generator model, based on PMU measurements. First, the estimation of the variables (frequency, voltage, and current phasors) of the dynamic state were obtained. Then, the authors calibrated the inertia constant and the reactances of the model. Finally, the performance results were obtained under different perturbation scenarios. The authors conclude that the calibration of parameters in real time requires high accuracy of advanced measurement devices.
- Operation Events: The high resolution of the PMU data allows to observe the dynamics (transient) of operational events that generally occur in distribution networks, such as the reconnection of microgrids, the connection of loads, and/or the connection of capacitor banks. In Reference [91], the authors proposed a method to analyze the transient behaviors caused by the addition of flexible loads/generation in distribution feeders. This approach modeled the load profiles based on the collection of data from various PMU located at the low voltage level. The authors demonstrated that it is possible to compromise network reliability if several flexible regulation resources are located on the same feeder. In Reference [92], the authors analyzed the switching events of a three-phase capacitor bank to determine the operational parameters and the flow of reactive energy from a capacitor. The authors conducted an experimental study based on real measurements from PMUs that were installed in an electrical distribution network. The results showed that the magnitude of the transient current of the feeder depends on the initial condition and the phase angle at the time of capacitor switching.
4.2. Smart Meter Data Applications
- Anomaly Detection: Anomaly detection techniques are useful to detect abnormal conditions in smart meters data, such as suspicious consumption, missing data, or unplanned events. In Reference [93], authors proposed an algorithm based on isolation forest to detect the presence of anomalies in smart grid using non-labeled data. Authors also used a Principal Component Analysis (PCA) to compress the volume of data in a distribution system. In Reference [94], authors implemented a support vector regression with a random forest method using sliding windows, to identify anomalous consumptions of real-world data. In Reference [95], the authors developed an anomaly detector system, capable of analyzing smart meter measurements from a data concentrator in near real-time. The design of this system can detect abnormal conditions at medium and low voltage levels using a quasi-linear classifier. Reference [96] proposed a technique with a Lambda architecture to detect anomalies. This technique was based on real-time consumptions that were analyzed through supervised learning. Additionally, a threshold index for the detection of suspicious consumption was considered. The evaluation of this algorithm in real scenarios demonstrated its effectiveness and precision in detecting anomalies.
- Compression of Data: Data compression techniques help to reduce the volume of data collected from advanced measurement devices; they also help to improve the transmission speeds from multiple measurement points. In Reference [97], the authors proposed a deep learning technique with a convolutional dispersion auto-encoder for data compression. This method keeps more information than Singular Value Decomposition (SVD) and PCA methods, at the same coding speed, preserving details of the original power, and the calculation times are lower. In Reference [98], the authors proposed a neural network based on an automatic encoder to compress household consumption data in a distribution network. This proposed encoder must be installed on the user’s side to compress the smart meter readings. Compared to some existing linear compression models, such as PCA, DWT, and SVD, the SAE compressor has lower % errors according to a study carried out with real data from China and Ireland. Similarly, in Reference [99], a methodology using the SVD technique for data compression was presented. This methodology was used in a test system with data from different substations of a UK company. This technique achieves a significant reduction in the volume of data to be transmitted, with minimal error in its reconstruction. Reference [100] proposed a SVD sparse coding technique to compress smart meter data. This dispersion technique extracts the information using linear combinations from load clusters. The results obtained comparing 4 techniques showed that the proposed technique obtains the least loss of information.
- Customer Characterization (Socio-demographic): Predictive analysis can also be applied to determine the characteristics of network consumers, for example, predicting the number of unemployed people, number of occupants in a building and/or predicting daily household activities. In Reference [101], authors compared six machine learning models to determine the number of unemployed people in a household. The overall results showed that the most accurate models were the multi-layered perception and distance-weighted discrimination aproach. Similarly, in Reference [104], a neural model was proposed to determine the employment situation of consumers. This type of information can help governments to reduce unemployment levels and also help to improve their economy. In Reference [102], the authors implemented a genetic algorithm to identify the number of occupants in a residential building using smart meter data. Validation results showed that this algorithm can optimally predict the number of occupants in households. In Reference [103], an automatic learning model was proposed to identify characteristics of residential occupants, e.g., people living in the household, average age, and daily activities in the household, from the daily electricity consumption of the users. The validation of this model was implemented in a real distribution network in Ireland, in which technical characteristics allow obtaining this information.
- Forecasting: The optimal generation planning requires that operators have tools to predict demand growth in a short and medium terms. In recent years, techniques based on machine learning have been developed, considering multiple variables in the prediction models, including electricity consumption, weather conditions, electricity tariff costs, and population growth that contributes to generate accurate prediction models. In addition, with the growing technological development, it is possible to concentrate all this data in real time, which allows the parameters of the models to be systematically updated. In Reference [106], the authors designed a short-term prediction model based on a Q-learning scheme that used meteorological data and smart meters as input variables. This scheme was composed of ten deterministic prediction models and four probabilistic heuristic models which were selected based on their accuracy. The results presented demonstrate a higher accuracy of Q-learning predictions than traditional approaches. In Reference [105], an artificial neural network with a multiple regression technique was proposed to predict load consumption using temperature and solar irradiation variables in the model to obtain more accurate predictions. The validation of this proposal was demonstrated in a real data set of smart meters that included photovoltaic generation. In Reference [107], the authors proposed a recurrent neural network technique to predict consumption in short-term scenarios. This proposed approach was tested on a public data set on real residential consumption and compared with other techniques for validation. In Reference [108], the authors proposed a Nest-Bcktr algorithm for short-term load forecasting. A comparison between other six machine learning algorithms were made, in terms of RMSE indices and absolute errors. The validation was programmed in Python using a 2-year data set from smart meters. The results showed that this proposed algorithm predicts consumption with lower errors. In Reference [109], a load ensemble method to forecast aggregated loads was proposed. This method produces multiple training and prediction models with different sub-profiles. In addition, a weighted optimization is used to combine and determine the best prediction. In Reference [111], an additive regression model was proposed to forecast the distribution of electricity consumption added to the network. This model generates different probability scenarios that help operators to plan and operate the network in the future. In Reference [112], the authors used a method based on kernel density estimation to forecast future growth of electricity consumption. This method considered predictions of electricity costs for different tariffs, which means potentially important savings for users.
- Load Classification: Refers to the grouping of electrical consumption including residential, commercial and industrial loads. In recent years, various grouping techniques have been proposed with data from smart meters that have provided useful information to distribution system operators. In Reference [113], electricity consumption and energy tariff variability were analysed in four different seasons. In this analysis, several statistical tools were applied to analyze different energy consumption’s using real data from smart meters. The study showed that users consume more energy when they do not know the variability of energy costs. The authors recommended that consumers learn about tariff dynamics in order to minimize energy consumption costs. In Reference [114], the authors proposed a prediction technique based on a trained auto-encoder that analyzed smart meter data and also grouped them using a self organizing map. In Reference [115], a finite mixture model based on a variant Gaussian distribution to identify non-typical behavior in the distribution system was proposed. This model classified different customer profiles according to their load levels and variability. In Reference [116], the authors proposed a k-means clustering algorithm for phase identification of interconnected customers in the network. This algorithm uses as inputs the voltage signals from smart meters and SCADA measurement system. The test results obtained from a distribution network in California showed that the algorithm has an overall accuracy above 90%.
- Non-technical loss detection: Detection of non-technical losses are basically electricity theft consumers, faulty meters or billing errors. In Reference [110], a hybrid deep neuronal network to detect non-technical losses in smart meters was proposed. This algorithm was tested with real smart meter data from the largest electric utility in Spain. Validation results showed the accuracy of this aproach to identify anomalies in distribution systems. In Reference [117], the authors proposed a deep convolutional neural network to detect non technical losses in distribution grids. This approach detected manipulations of consumer energy readings that falsely overloaded the power company. The results obtained in this work indicate that the fusion of multiple data, including smart meters, SCADA systems, and meteorological reports, contributes to the accurate detection of energy theft consumers. Reference [118] proposed a methodology based on the hybrid combination of decision tree and support vector machine classifiers to detect fraudulent consumption. In Reference [119], the authors proposed a classifier based on the optimal-path forest algorithm to detect anomalies and non-technical losses in distribution networks. This machine learning technique requires training from regular consumer profiles in order to generate a sample group base, and, when a new consumer connects with irregular profiles, he is automatically identified. Validation results showed that this technique is robust and accurate for classifying different types of consumers.
- Sensor Fusion: Sensor fusion is the integration of data from smart meters with other measurement devices and is intended to improve the observability and accuracy of monitoring distribution systems. In Reference [120], the authors proposed a state estimator to identify harmonic sources in an unbalanced distribution system. The state estimator was based on neural networks and Bayesian learning, and the input signals were captured by smart meters and micro-PMUs. Validation results showed the high accuracy of the estimator even in presence of distributed generation. In Reference [40], the authors proposed an algorithm to disaggregate loads from a distribution feeder into N components. The main objective was to separate network losses and reactive power injections from capacitors. This algorithm was based on a learning aproach and used multiple measurement sensors to determine the technical feasibility of separation. Validation results indicate that data fusion of reactive power measurements in the algorithm can improve the accuracy in the prediction of the network behavior up to 32%. In Reference [121], the authors proposed a mixed integer linear programming algorithm to determine fault locations and prediction of outage regions. This algorithm requires of smart meter data and remote fault indicators measurements in near real-time in order to support distribution system operation in a precise time-step.
- Topology Identification: Information on the topology of the distribution network helps the operator to make optimal decisions when unexpected events occur. Authors in Reference [122] proposed a physical probabilistic network model to identify the connections using voltage correlations between different buses. This method was compared with a lasso regression method. In Reference [123], a tree-based search methodology was proposed to approximate the missing cable information in low voltage distribution networks. In Reference [124], a method to identify the connectivity between load phases in distribution networks was proposed. Additionally, the presence of technical losses and some errors that may arise during measurements (missing data, synchronization) were considered. This method implemented the principal component analysis to infer the topology of the use of smart meter measurements. This method proved to be robust in the presence of distributed generation. In Reference [125], the authors presented an algorithm for topology estimation based on voltage measurements from smart meters. Validation results showed that 9 out of 10 of the estimates were correct in secondary circuits of a Georgia Tech distribution system, even in noisy environments. The authors mentioned that it is extremely important to have ultra-precise measurement devices for correct estimation of voltage drop based topology, especially when analyzing short lines feeding small loads. In Reference [126], a graphical model to identify distribution topologies based on a probabilistic relationship between different voltage measurements was proposed. Additionally, the authors proposed an expansion-tree based algorithm aimed at minimizing the Kullback-Leibler divergence in a distribution system. In Reference [127], an algorithm to correct connectivity errors of smart meters and meters on distribution feeders was developed. This algorithm identified the neighboring meters through a voltage profile correlation analysis.
4.3. Power Quality Monitoring Applications
- Optimal Placement: This large application group describes some recent approaches to determine the optimal positioning of PQM, with the aim of minimizing network investment costs. In Reference [128], the authors implemented the TLBO algorithm to optimally locate PQMs by considering degradation in large distribution networks. The objective of this approach was to minimize the number of PQMs in order to minimize the costs of assets in the monitoring system. In Reference [129], the authors proposed the MEAT optimization algorithm to find the best locations to install advanced PQM in distribution network. This proposed approach had multiple objectives, such as minimizing monitoring investment costs, minimizing voltage drops, and maximizing system observability. The authors recommend this approach for those electricity companies that need to evaluate the investments they will make to optimally improve network observability. In Reference [130], authors proposed the seeker optimization algorithm to find the optimal locations of PQM devices in a 14-bus test system. The test system results showed that with few locations of the PQMs the values of the harmonic state were accurately estimated. In Reference [131], an optimization algorithm based on Bayesian network models was proposed. The objective was to minimize the investment costs of PQ monitoring devices and to maximize the observability of the distribution network. Evaluation results showed that this algorithm significantly reduced the uncertainty of PQ values on unsupervised feed links. In Reference [132], the authors proposed a probabilistic method to observe the uncertainty associated with high/low impedance faults in distribution systems. The objective was to determine the optimal location of PQM devices to maximize observability in the system. In addition, two indices were proposed in this work to quantify the robustness of distribution networks with different voltage drops. The authors in Reference [133] mathematically analyzed the impact of the accuracy of state estimation (with power meters) by varying the spatial distribution and number of devices installed in the network. The objective was to minimize the number of devices to be installed and to identify the optimal location in the distribution networks, ensuring a desired accuracy in the estimation of voltage and current. The results show that the proposed mathematical framework is a useful tool for the design of optimal device placement strategies in current monitoring systems.
- Fault Location: Due to the high sampling rate and precision of this device, some authors have proposed algorithms to track faults in distribution systems. In Reference [134], the authors proposed a PQ disturbance predictor based on a Multi-Hidden Markov Model (MHMM). This predictor analyzes large volumes of data, including local weather variables to improve forecast accuracy, and also incorporates a Hadoop system that reduces calculation times for very complex systems. The forecast of this model can be adapted to different resolutions (minutes, hours, days, or up to 3 weeks). In Reference [135], the authors proposed a multivariate data analysis technique to locate line failures in unbalanced distribution systems.This technique was based on PQM devices installed in distribution substations, line parameters and the topology configuration. The authors concluded that the proposed technique benefits operators to accelerate the tasks of system restoration (permanent faults). In Reference [136], the authors designed a power quality software to identify and locate faults in distribution feeders. This software performs a short circuit analysis based on historic and real measurements of PQM. The validation results showed that this software has better accuracy for locating faults in distribution feeders than some commercial software.
- Harmonic Analysis: These application refers to detect harmonics or abnormal behaviours in distribution system using advanced PQ devices. The authors in Reference [137] presented multiple techniques to locate harmonic sources in distribution grids using PQ data. The objective was to design strategies to mitigate potential problems. Additionally, in this work a harmonic compliance index was presented, which allows to give a quick indication about violations of the permissible harmonic limit in a particular site. In addition, a graphical method based on harmonic reports showed a wide detail of harmonic performance in many sites in a compact form. The authors in Reference [138] presented several digital processing techniques to detect missing or abnormal data. The validation tests were implemented in 8 German networks with residential, commercial and mixed customer loads. The authors concluded that: "The identification of useful information cannot be manual anymore and requires a comprehensive set of intelligent and automated analysis tools". Authors in Reference [139], compared the robustness, flexibility, and limitations of a composite bus index and an aggregate bus index. These two indices were proposed and validated in a test system to evaluate the PQ of buses installed in distribution networks. The authors concluded that these indices were closely related and it is important to provide an adequate weighting in order to have a greater flexibility between them.
- Power Quality Monitoring System: Power Quality Monitoring Systems (PQMS) have been implemented in several countries to improve the power quality in distribution systems. In Reference [65], the authors designed a power quality monitoring software based on real-time data. This software was capable to analyze complex power quality problems using a FPGA-type hardware that worked as an independent integrated system. The authors concluded that these modern monitoring system substantially improve the life of the assets that make up the smart grids. Authors in Reference [140] presented a project report of a power quality monitoring system which has been in operation in Australia since 2002. The objective of this report was to provide a general overview of the main problems found during the development of the PQMS. The authors concluded that monitoring systems with advanced measurement devices capable of providing PQ indices will rapidly increase in future power grids. Authors in Reference [141] designed a PQ monitoring system for a new generation of substations located in Shanghai, China. This system was based on international communication standards that allow remote monitoring of harmonics at a frequency of 12.8 kHz. This system is capable to analyze complex power quality problems, as well as the location of harmonic sources in the distribution networks. An improved hardware/software architecture with a real-time monitoring and control system for the integration of micro grids into MV distribution networks was presented in Reference [142]. The proposed system is capable of estimating the power flows of the medium voltage branch by means of load power measurements and a suitable load flow algorithm. The proposed system was considered more efficient than SCADA implementation.
- Data error detection: Data error detection is the process where the system automatically detects and corrects errors in PQ monitoring data. In Reference [143], an automatic detection and correction of errors system was developed based on data captured by PQ meters installed on a UK smart grid. The objective of the automatic system was to reduce the number of errors caused by various factors, such as poor installation of the devices, poor synchronization between multiple PQMs or by non-captured data (missing data), and maximizing the useful data for future network operations. The authors conclude that the number of errors can be reduced considerably by adopting a correct installation procedure for PQ monitoring devices.
- Load Modeling: To represent the loads of an electrical network, mathematical models are used to simulate the dynamic or static behavior considering the active and reactive power of the load with respect to the variation of the voltage and frequency. In Reference [144], the authors derived the parameters of a dynamic load model of an 11 kV distribution network using a power quality monitoring system. The measurements used in the load model includes voltages, currents, active power, and reactive power at a sampling frequency of 1.6 kHz. To validate these results, the distribution network was simulated in a software using the parameters of the load model obtained and the load response to a disturbance was compared against a real disturbance in the distribution system captured by the PQMs. The general conclusion of this work was that 30–40% of the commercial loads considered in the distribution network are composed of induction motor loads, and if you want to make an accurate load model at the distribution level it is imperative to consider them.
5. Conclusions
- The dominant applications of interest for PMU data is currently leaning towards analyzing situational awareness events and estimating the state variables of the system in near real-time. With the extremely high resolution (sampling rate up to 30,720 s/s), amplitude accuracy of 0.05%, and angle accuracy of 0.01%, it is possible to visualize transitory events in the distribution network. The sensor accuracy can have a strong influence on the uncertainty of the quantities to be measured and thus can highly impacting in the algorithms performance.
- The dominant application of interest of smart meter data is currently driven to forecast future load consumption in a short term horizon based on artificial intelligence, machine learning, and deep learning techniques. Topology identification is also of current interest due to the limited knowledge about the topology of low voltage networks. Some novel methods are related to correlation techniques and graph theory methods.
- The most recent applications of PQM devices are related to find the optimal placement of the PQM based on multiple objectives, focusing on minimizing the cost of monitoring, minimizing topological ambiguity and maximizing the load monitoring.
Author Contributions
Funding
Acknowledgments
Conflicts of Interest
Abbreviations
| ANN | Artificial Neural Network |
| ARMA | Auto-Regressive Moving Average |
| CA | California |
| CART | Classification and Regression Trees |
| CCAD-SW | Collective Contextual Anomaly Detection using a Sliding Window |
| CNN | Convolutional Neuronal Network |
| CUSUM | Cumulative Sum |
| DFT | Discrete Fourier Transform |
| DFR | Digital Fault Recorder |
| DNN | Deep Neural Network |
| DSSE | Distribution System State Estimation |
| DSTE | Distribution System Topology Estimation |
| DT | Decision Tree |
| DWD | Distance Weighted Discrimination |
| DWT | Discrete Wavelet Transform |
| FF-ANN | Feed-Forward Artificial Neural Network |
| FPGA | Field Programmable Gate Array |
| GBM | Gradient Boosting Machines |
| GLM | Graph Laplacian Matrix |
| GMM | Gaussian mixture model |
| HAN | Home Area Network |
| Hz | Hertz |
| k-NN | k-Nearest Neighbor |
| KF | Kalman Filter |
| kV | Kilovolts |
| LAMDA | Learning Algorithm for Multivariable Data Analysis |
| LSTM | Long Short Term Memory |
| LWLS-SE | Linear Weighted Least Squares State Estimator |
| MHMM | Multi-Hidden Markov Model |
| ML | Machine Learning |
| MLR | Multiple Linear Regression |
| MW | Megawatt |
| NAN | Neighborhood Area Network |
| NARX | Non-linear AutoRegressive with eXogenous |
| NN | Neuronal Network |
| NR | Normalized Residuals |
| NTLs | Non-Technical Losses |
| PAA | Piece-Wise Aggregate Approximation |
| PCA | Principle Component Analysis |
| PDCs | Phasor Data Concentrators |
| PF | Path Forest |
| PLS | Power Line Sensor |
| PMRA | Probabilistic Monitor Research Area |
| PMU | Phasor Measurement Unit |
| PQM | Power Quality Monitor |
| PQMS | Power Quality Monitoring System |
| pSVM | Partially Support Vector Machine |
| PV | Photovoltaic |
| R-NESE | Regularized version of the Normal Equations based State Estimation |
| RF | Random Forest |
| RMS | Root Mean Square |
| SAE | Stacked Autoencoder |
| SCADA | Supervisory Control And Data Acquisition |
| SCSAE | Stacked Convolutional Sparse auto-encoder |
| SM | Smart Meter |
| SOM | Self Organizing Map |
| SVD | Singular Value Decomposition |
| SVM | Support Vector Machine |
| SVR | Support Vector Regression |
| THD | Total Harmonic Distortion |
| TLBO | Teaching Learning Based Optimization |
| TSV | Time-Series Signature Verification |
| UDP | User Datagram Protocol |
| WAMS | Wide-Area Measurement Systems |
| WAN | Wide Area Network |
| WLS | Weighted Least Squares |
| WSMW | Window Size with a Moving Window |
| WT | Wavelet Transform |
| WTVSE | Weighted Total Variation State Estimation |
| PMU | Micro-Phasor Measurement Unit |
References
- Fang, X.; Misra, S.; Xue, G.; Yang, D. Smart grid—The new and improved power grid: A survey. IEEE Commun. Surv. Tutor. 2011, 14, 944–980. [Google Scholar] [CrossRef]
- Walling, R.; Saint, R.; Dugan, R.C.; Burke, J.; Kojovic, L.A. Summary of distributed resources impact on power delivery systems. IEEE Trans. Power Deliv. 2008, 23, 1636–1644. [Google Scholar] [CrossRef]
- Brown, R.E. Impact of smart grid on distribution system design. In Proceedings of the 2008 IEEE Power and Energy Society General Meeting-Conversion and Delivery of Electrical Energy in the 21st Century, Pittsburgh, PA, USA, 20–24 July 2008; pp. 1–4. [Google Scholar]
- Dileep, G. A survey on smart grid technologies and applications. Renew. Energy 2020, 146, 2589–2625. [Google Scholar] [CrossRef]
- Kabalci, Y. A survey on smart metering and smart grid communication. Renew. Sustain. Energy Rev. 2016, 57, 302–318. [Google Scholar] [CrossRef]
- Morello, R.; Mukhopadhyay, S.C.; Liu, Z.; Slomovitz, D.; Samantaray, S.R. Advances on sensing technologies for smart cities and power grids: A review. IEEE Sens. J. 2017, 17, 7596–7610. [Google Scholar] [CrossRef]
- Ali, S.; Jawad, M.; Khan, B.; Mehmood, C.; Zeb, N.; Tanoli, A.; Farid, U.; Glower, J.; Khan, S. Wide area smart grid architectural model and control: A survey. Renew. Sustain. Energy Rev. 2016, 64, 311–328. [Google Scholar] [CrossRef]
- Von Meier, A.; Culler, D.; McEachern, A.; Arghandeh, R. Micro-synchrophasors for distribution systems. In Proceedings of the ISGT 2014, Istanbul, Turkey, 12–15 October 2014; pp. 1–5. [Google Scholar]
- Von Meier, A.; Stewart, E.; McEachern, A.; Andersen, M.; Mehrmanesh, L. Precision micro-synchrophasors for distribution systems: A summary of applications. IEEE Trans. Smart Grid 2017, 8, 2926–2936. [Google Scholar] [CrossRef]
- Arghandeh, R. Micro-Synchrophasors for Power Distribution Monitoring, a Technology Review. arXiv 2016, arXiv:1605.02813. [Google Scholar]
- Mohsenian-Rad, H.; Stewart, E.; Cortez, E. Distribution synchrophasors: Pairing big data with analytics to create actionable information. IEEE Power Energy Mag. 2018, 16, 26–34. [Google Scholar] [CrossRef]
- Dusabimana, E.; Yoon, S.G. A Survey on the Micro-Phasor Measurement Unit in Distribution Networks. Electronics 2020, 9, 305. [Google Scholar] [CrossRef]
- Liu, Y.; Wu, L.; Li, J. D-PMU based applications for emerging active distribution systems: A review. Electr. Power Syst. Res. 2020, 179, 106063. [Google Scholar] [CrossRef]
- Wang, Y.; Chen, Q.; Hong, T.; Kang, C. Review of smart meter data analytics: Applications, methodologies, and challenges. IEEE Trans. Smart Grid 2018, 10, 3125–3148. [Google Scholar] [CrossRef]
- Yildiz, B.; Bilbao, J.I.; Dore, J.; Sproul, A.B. Recent advances in the analysis of residential electricity consumption and applications of smart meter data. Appl. Energy 2017, 208, 402–427. [Google Scholar] [CrossRef]
- McKenna, E.; Richardson, I.; Thomson, M. Smart meter data: Balancing consumer privacy concerns with legitimate applications. Energy Policy 2012, 41, 807–814. [Google Scholar] [CrossRef]
- Alahakoon, D.; Yu, X. Smart electricity meter data intelligence for future energy systems: A survey. IEEE Trans. Ind. Inf. 2015, 12, 425–436. [Google Scholar] [CrossRef]
- Haitao, Y.; Tao, R.; Junyi, C.; Yun, Z.; Junjie, C.; Jiachao, H.; Guofa, Z.; Bo, M. Usage and Application of Power Quality Monitor on Harmonic Measurement. In Proceedings of the 2018 IEEE 3rd International Conference on Integrated Circuits and Microsystems (ICICM), Shanghai, China, 24–26 November 2018; pp. 212–216. [Google Scholar]
- Kamyabi, L.; Esmaeili, S.; Koochi, M.H.R. Power quality monitor placement in power systems considering channel limits and estimation error at unobservable buses using a bi-level approach. Int. J. Electr. Power Energy Syst. 2018, 102, 302–311. [Google Scholar] [CrossRef]
- Dehghanpour, K.; Wang, Z.; Wang, J.; Yuan, Y.; Bu, F. A survey on state estimation techniques and challenges in smart distribution systems. IEEE Trans. Smart Grid 2018, 10, 2312–2322. [Google Scholar] [CrossRef]
- Hyndman, R.J.; Liu, X.A.; Pinson, P. Visualizing big energy data: Solutions for this crucial component of data analysis. IEEE Power Energy Mag. 2018, 16, 18–25. [Google Scholar] [CrossRef]
- Tu, C.; He, X.; Shuai, Z.; Jiang, F. Big data issues in smart grid–A review. Renew. Sustain. Energy Rev. 2017, 79, 1099–1107. [Google Scholar] [CrossRef]
- Stewart, E.M.; Kiliccote, S.; Shand, C.; McMorran, A.; Arghandeh, R.; von Meier, A. Addressing the challenges for integrating micro-synchrophasor data with operational system applications. In Proceedings of the 2014 IEEE PES General Meeting| Conference & Exposition, National Harbor, MD, USA, 27–31 July 2014; pp. 1–5. [Google Scholar]
- Kumar, P.; Lin, Y.; Bai, G.; Paverd, A.; Dong, J.S.; Martin, A. Smart grid metering networks: A survey on security, privacy and open research issues. IEEE Commun. Surv. Tutor. 2019, 21, 2886–2927. [Google Scholar] [CrossRef]
- Neagu, B.C.; Grigoraş, G.; Ivanov, O. The Optimal Operation of Active Distribution Networks with Smart Systems. In Advanced Communication and Control Methods for Future Smartgrids; IntechOpen: London, UK, 2019. [Google Scholar]
- Uribe-Pérez, N.; Hernández, L.; De la Vega, D.; Angulo, I. State of the art and trends review of smart metering in electricity grids. Appl. Sci. 2016, 6, 68. [Google Scholar] [CrossRef]
- Prostejovsky, A.M.; Brosinsky, C.; Heussen, K.; Westermann, D.; Kreusel, J.; Marinelli, M. The future role of human operators in highly automated electric power systems. Electr. Power Syst. Res. 2019, 175, 105883. [Google Scholar] [CrossRef]
- McDonald, J.D. Substation automation. IED integration and availability of information. IEEE Power Energy Mag. 2003, 1, 22–31. [Google Scholar] [CrossRef]
- Khedkar, M.; Dhole, G. A Textbook of Electric Power Distribution Automation; Laxmi Publications Pvt Limited: New Delhi, India, 2010. [Google Scholar]
- Electric, S. Monitoring Devices Class. 2020. Available online: https://download.schneiderelectric.com/files?p_enDocType=Price+List&p_File_Name=PM_Solutions_PriceList2020.pdf&p_Doc_Ref=PMSolutionsPriceList2020 (accessed on 12 June 2020).
- Grigsby, L. Electric Power Generation, Transmission, and Distribution, Third Edition; Electric Power Engineering Series; Taylor & Francis: London, UK, 2012. [Google Scholar]
- Zheng, J.; Gao, D.W.; Lin, L. Smart meters in smart grid: An overview. In Proceedings of the 2013 IEEE Green Technologies Conference (GreenTech), Denver, CO, USA, 4–5 April 2013; pp. 57–64. [Google Scholar]
- P Monteiro, F.; A Monteiro, S.; Tostes, M.E.; H Bezerra, U. Using True RMS Current Measurements to Estimate Harmonic Impacts of Multiple Nonlinear Loads in Electric Distribution Grids. Energies 2019, 12, 4132. [Google Scholar] [CrossRef]
- 50470-1:2007, U.E. Aparatos de Medida de la Energía Eléctrica y del Control de Cargas. 2020. Available online: https://www.une.org/encuentra-tu-norma/busca-tu-norma/norma?c=N0039265 (accessed on 12 June 2020).
- Lab, P.S. Data Sheet of Micro Synchrophasors. 2019. Available online: https://www.powerstandards.com/download/micropmu-data-sheet/ (accessed on 1 April 2020).
- Bush, S. Smart Grid: Communication-Enabled Intelligence for the Electric Power Grid; Wiley: Hoboken, NJ, USA, 2014. [Google Scholar]
- Barolli, L.; Kryvinska, N.; Enokido, T.; Takizawa, M. Advances in Network-Based Information Systems: The 21st International Conference on Network-Based Information Systems (NBiS-2018); Lecture Notes on Data Engineering and Communications Technologies; Springer International Publishing: New York, NY, USA, 2018. [Google Scholar]
- Lab, P.S. Data Sheet of PQube3. 2019. Available online: https://www.powerstandards.com/download/pqube-3-data-sheet/ (accessed on 1 April 2020).
- Eaton. Next-Generation Power Quality Meters. 2020. Available online: http://www.eaton.com/FR/ecm/idcplg?IdcService=GET_FILE&allowInterrupt=1&RevisionSelectionMethod=LatestReleased&noSaveAs=0&Rendition=Primary&dDocName=1138850333755 (accessed on 1 April 2020).
- Ledva, G.S.; Mathieu, J.L. Separating Feeder Demand into Components Using Substation, Feeder, and Smart Meter Measurements. IEEE Trans. Smart Grid 2020, 11, 3280–3290. [Google Scholar] [CrossRef]
- Solutions, G.G. Standards Requirements for Distributed Digital Fault Recorder. 2019. Available online: https://www.gegridsolutions.com/multilin/catalog/ddfr.htm (accessed on 25 March 2020).
- Rexvolt. Distribution Line Monitoring and Analytics. 2020. Available online: https://www.rexvolt.com/overhead-line-monitoring-analytics/ (accessed on 1 April 2020).
- Electric, S. Power Monitoring Solutions and Metering Products (Price List 2020). 2020. Available online: https://www.se.com/in/en/download/document/PMSolutionsPriceList2020/ (accessed on 12 June 2020).
- Electric, S. LV Power Metering Products (Price List 2020). 2020. Available online: https://www.se.com/in/en/download/document/LVProductsPricelist2020/ (accessed on 12 June 2020).
- Standards, P. PQube 3 Series Price List. 2020. Available online: https://www.powerstandards.com/wp-content/uploads/dlm_uploads/2019/09/MAP-Price-Sheet-USA-Canada-2019.pdf (accessed on 12 June 2020).
- SmartGrid. PMU Installation Costs. 2020. Available online: https://www.smartgrid.gov/files/recovery_act/PMU-cost-study-final-10162014_1.pdf (accessed on 12 June 2020).
- Santos, R.Z.S.; Orillaza, J.R.C. Distribution System State Estimator Using SCADA and μPMU Measurements. In Proceedings of the 2018 IEEE Innovative Smart Grid Technologies—Asia (ISGT Asia), Singapore, 22–25 May 2018; pp. 558–562. [Google Scholar] [CrossRef]
- Kong, X.; Chen, Y.; Xu, T.; Wang, C.; Yong, C.; Li, P.; Yu, L. A Hybrid State Estimator Based on SCADA and PMU Measurements for Medium Voltage Distribution System. Appl. Sci. 2018, 8, 1527. [Google Scholar] [CrossRef]
- Tom, R.J.; Sankaranarayanan, S. IoT based SCADA integrated with Fog for power distribution automation. In Proceedings of the 2017 12th Iberian Conference on Information Systems and Technologies (CISTI), Lisbon, Portugal, 14–17 June 2017; pp. 1–4. [Google Scholar] [CrossRef]
- Avancini, D.B.; Rodrigues, J.J.; Martins, S.G.; Rabêlo, R.A.; Al-Muhtadi, J.; Solic, P. Energy meters evolution in smart grids: A review. J. Clean. Prod. 2019, 217, 702–715. [Google Scholar] [CrossRef]
- Liao, A.L.; Stewart, E.M.; Kara, E.C. Micro-synchrophasor data for diagnosis of transmission and distribution level events. In Proceedings of the 2016 IEEE/PES Transmission and Distribution Conference and Exposition (T&D), Dallas, CO, USA, 2–5 May 2016; pp. 1–5. [Google Scholar]
- De La Ree, J.; Centeno, V.; Thorp, J.S.; Phadke, A.G. Synchronized Phasor Measurement Applications in Power Systems. IEEE Trans. Smart Grid 2010, 1, 20–27. [Google Scholar] [CrossRef]
- Messina, A.R. Wide Area Monitoring of Interconnected Power Systems; The Institution of Engineering and Technology: London, UK, 2015. [Google Scholar]
- Della Giustina, D.; Rinaldi, S. Hybrid communication network for the smart grid: Validation of a field test experience. IEEE Trans. Power Deliv. 2015, 30, 2492–2500. [Google Scholar] [CrossRef]
- Sharma, K.; Saini, L.M. Power-line communications for smart grid: Progress, challenges, opportunities and status. Renew. Sustain. Energy Rev. 2017, 67, 704–751. [Google Scholar] [CrossRef]
- Von Meier, A.; Brown, M.L.; Arghandeh, R.; Stewart, E.M. Synchrophasor Monitoring for Distribution Systems -Technical Foundations and Applications; Technical Report; North American SynchroPhasor Initiative: Washington, DC, USA, 2018. [Google Scholar] [CrossRef]
- Derviškadić, A.; Romano, P.; Pignati, M.; Paolone, M. Architecture and experimental validation of a low-latency phasor data concentrator. IEEE Trans. Smart Grid. 2016, 9, 2885–2893. [Google Scholar] [CrossRef]
- Andersen, M.P.; Culler, D.E. Btrdb: Optimizing storage system design for timeseries processing. In Proceedings of the 14th {USENIX} Conference on File and Storage Technologies ({FAST} 16), Santa Clara, CA, USA, 22–25 February 2016; pp. 39–52. [Google Scholar]
- Andersen, M.P.; Kumar, S.; Brooks, C.; von Meier, A.; Culler, D.E. DISTIL: Design and implementation of a scalable synchrophasor data processing system. In Proceedings of the 2015 IEEE International Conference on Smart Grid Communications (SmartGridComm), Miami, FL, USA, 2–5 November 2015; pp. 271–277. [Google Scholar]
- Pingthings. The PredictiveGrid Platform. 2019. Available online: https://www.pingthings.io/platform.html (accessed on 25 March 2020).
- Fadel, E.; Gungor, V.C.; Nassef, L.; Akkari, N.; Malik, M.A.; Almasri, S.; Akyildiz, I.F. A survey on wireless sensor networks for smart grid. Comput. Commun. 2015, 71, 22–33. [Google Scholar] [CrossRef]
- Yigit, M.; Gungor, V.C.; Tuna, G.; Rangoussi, M.; Fadel, E. Power line communication technologies for smart grid applications: A review of advances and challenges. Comput. Netw. 2014, 70, 366–383. [Google Scholar] [CrossRef]
- Artale, G.; Cataliotti, A.; Cosentino, V.; Di Cara, D.; Fiorelli, R.; Guaiana, S.; Panzavecchia, N.; Tine, G. A new PLC-based smart metering architecture for medium/low voltage grids: Feasibility and experimental characterization. Measurement 2018, 129, 479–488. [Google Scholar] [CrossRef]
- Ikpehai, A.; Adebisi, B.; Rabie, K.M. Broadband PLC for clustered advanced metering infrastructure (AMI) architecture. Energies 2016, 9, 569. [Google Scholar] [CrossRef]
- Yildirim, O.; Eristi, B.; Eristi, H.; Unal, S.; Erol, Y.; Demir, Y. FPGA-based online power quality monitoring system for electrical distribution network. Measurement 2018, 121, 109–121. [Google Scholar] [CrossRef]
- Farajollahi, M.; Shahsavari, A.; Stewart, E.M.; Mohsenian-Rad, H. Locating the source of events in power distribution systems using micro-PMU data. IEEE Trans. Power Syst. 2018, 33, 6343–6354. [Google Scholar] [CrossRef]
- Jamei, M.; Scaglione, A.; Roberts, C.; Stewart, E.; Peisert, S.; McParland, C.; McEachern, A. Anomaly Detection Using Optimally-Placed Micro-PMU Sensors in Distribution Grids. arXiv 2017, arXiv:1708.00118. [Google Scholar]
- Shahsavari, A.; Farajollahi, M.; Stewart, E.M.; Cortez, E.; Mohsenian-Rad, H. Situational awareness in distribution grid using micro-PMU data: A machine learning approach. IEEE Trans. Smart Grid. 2019, 10, 6167–6177. [Google Scholar] [CrossRef]
- Cui, M.; Wang, J.; Florita, A.R.; Zhang, Y. Generalized Graph Laplacian Based Anomaly Detection for Spatiotemporal MicroPMU Data. IEEE Trans. Power Syst. 2019, 34, 3960–3963. [Google Scholar] [CrossRef]
- Zhou, Y.; Arghandeh, R.; Konstantakopoulos, I.; Abdullah, S.; von Meier, A.; Spanos, C.J. Abnormal event detection with high resolution micro-PMU data. In Proceedings of the 2016 Power Systems Computation Conference (PSCC), Genoa, Italy, 20–24 June 2016; pp. 1–7. [Google Scholar]
- Duan, N.; Stewart, E.M. Frequency Event Categorization in Power Distribution Systems using Micro PMU Measurements. IEEE Trans. Smart Grid. 2020, 11, 3043–3053. [Google Scholar] [CrossRef]
- Pignati, M.; Zanni, L.; Romano, P.; Cherkaoui, R.; Paolone, M. Fault detection and faulted line identification in active distribution networks using synchrophasors-based real-time state estimation. IEEE Trans. Power Deliv. 2016, 32, 381–392. [Google Scholar] [CrossRef]
- Shahsavari, A.; Farajollahi, M.; Stewart, E.; Roberts, C.; Mohsenian-Rad, H. A data-driven analysis of lightning-initiated contingencies at a distribution grid with a PV farm using micro-PMU data. In Proceedings of the 2017 North American Power Symposium (NAPS), Morgantown, WV, USA, 17–19 September 2017; pp. 1–6. [Google Scholar]
- Ardakanian, O.; Wong, V.W.; Dobbe, R.; Low, S.H.; von Meier, A.; Tomlin, C.J.; Yuan, Y. On identification of distribution grids. IEEE Trans. Control Netw. Syst. 2019, 6, 950–960. [Google Scholar] [CrossRef]
- Zanjani, M.G.M.; Mazlumi, K.; Kamwa, I. Application of μPMUs for adaptive protection of overcurrent relays in microgrids. IET Gener. Trans. Distrib. 2018, 12, 4061–4068. [Google Scholar] [CrossRef]
- Mahmood, F.; Hooshyar, H.; Lavenius, J.; Bidadfar, A.; Lund, P.; Vanfretti, L. Real-time reduced steady-state model synthesis of active distribution networks using pmu measurements. IEEE Trans. Power Deliv. 2016, 32, 546–555. [Google Scholar] [CrossRef]
- Li, J.; Liu, H.; Martin, K.E.; Li, J.; Bi, T.; Yang, Q. Electronic transformer performance evaluation and its impact on PMU. IET Gener. Trans. Distrib. 2019, 13, 5396–5403. [Google Scholar] [CrossRef]
- Moffat, K.; Bariya, M.; Von Meier, A. Unsupervised Impedance and Topology Estimation of Distribution Networks—Limitations and Tools. IEEE Trans. Smart Grid. 2019, 11, 846–856. [Google Scholar] [CrossRef]
- Cavraro, G.; Arghandeh, R. Power distribution network topology detection with time-series signature verification method. IEEE Trans. Power Syst. 2017, 33, 3500–3509. [Google Scholar] [CrossRef]
- Cavraro, G.; Arghandeh, R.; Poolla, K.; Von Meier, A. Data-driven approach for distribution network topology detection. In Proceedings of the 2015 IEEE Power & Energy Society General Meeting, Denver, CO, USA, 26–30 July 2015; pp. 1–5. [Google Scholar]
- Niazazari, I.; Livani, H. A PMU-data-driven disruptive event classification in distribution systems. Electr. Power Syst. Res. 2018, 157, 251–260. [Google Scholar] [CrossRef]
- Niazazari, I.; Livani, H. Disruptive event classification using PMU data in distribution networks. In Proceedings of the 2017 IEEE Power & Energy Society General Meeting, Chicago, IL, USA, 16–20 July 2017; pp. 1–5. [Google Scholar]
- Lin, C.; Wu, W.; Guo, Y. Decentralized Robust State Estimation of Active Distribution Grids Incorporating Microgrids Based on PMU Measurements. IEEE Trans. Smart Grid. 2019, 11, 810–820. [Google Scholar] [CrossRef]
- Tsitsimelis, A.; Antón-Haro, C. A regularized state estimation scheme for a robust monitoring of the distribution grid. Intl. J. Electr. Power Energy Syst. 2020, 117, 105621. [Google Scholar] [CrossRef]
- Liu, Y.; Li, J.; Wu, L. State estimation of three-phase four-conductor distribution systems with real-time data from selective smart meters. IEEE Trans. Power Syst. 2019, 34, 2632–2643. [Google Scholar] [CrossRef]
- Farajollahi, M.; Shahsavari, A.; Mohsenian-Rad, H. Tracking state estimation in distribution networks using distribution-level synchrophasor data. In Proceedings of the 2018 IEEE Power & Energy Society General Meeting (PESGM), Portland, OR, USA, 5–9 August 2018; pp. 1–5. [Google Scholar]
- Majidi, M.; Etezadi-Amoli, M.; Livani, H. Distribution system state estimation using compressive sensing. Intl. J. Electr. Power Energy Syst. 2017, 88, 175–186. [Google Scholar] [CrossRef]
- Luiso, M.; Macii, D.; Tosato, P.; Brunelli, D.; Gallo, D.; Landi, C. A low-voltage measurement testbed for metrological characterization of algorithms for phasor measurement units. IEEE Trans. Ins. Meas. 2018, 67, 2420–2433. [Google Scholar] [CrossRef]
- Su, H.; Wang, C.; Li, P.; Liu, Z.; Yu, L.; Wu, J. Optimal placement of phasor measurement unit in distribution networks considering the changes in topology. Appl. Energy 2019, 250, 313–322. [Google Scholar] [CrossRef]
- Marchi, P.; Messina, F.; Vega, L.R.; Galarza, C.G. Online tracking of sub-transient generator model variables using dynamic phasor measurements. Electr. Power Syst. Res. 2020, 180, 106057. [Google Scholar] [CrossRef]
- Shahsavari, A.; Sadeghi-Mobarakeh, A.; Stewart, E.M.; Cortez, E.; Alvarez, L.; Megala, F.; Mohsenian-Rad, H. Distribution grid reliability versus regulation market efficiency: An analysis based on micro-PMU data. IEEE Trans. Smart Grid. 2017, 8, 2916–2925. [Google Scholar] [CrossRef]
- Shahsavari, A.; Farajollahi, M.; Stewart, E.; von Meier, A.; Alvarez, L.; Cortez, E.; Mohsenian-Rad, H. A data-driven analysis of capacitor bank operation at a distribution feeder using micro-PMU data. In Proceedings of the 2017 IEEE Power & Energy Society Innovative Smart Grid Technologies Conference (ISGT), Washington, DC, USA, 23–26 April 2017; pp. 1–5. [Google Scholar]
- Ahmed, S.; Lee, Y.; Hyun, S.H.; Koo, I. Unsupervised Machine Learning-Based Detection of Covert Data Integrity Assault in Smart Grid Networks Utilizing Isolation Forest. IEEE Trans. Inf. Forens. Secur. 2019, 14, 2765–2777. [Google Scholar] [CrossRef]
- Araya, D.B.; Grolinger, K.; ElYamany, H.F.; Capretz, M.A.; Bitsuamlak, G. An ensemble learning framework for anomaly detection in building energy consumption. Energy Build. 2017, 144, 191–206. [Google Scholar] [CrossRef]
- Moghaddass, R.; Wang, J. A hierarchical framework for smart grid anomaly detection using large-scale smart meter data. IEEE Trans. Smart Grid. 2017, 9, 5820–5830. [Google Scholar] [CrossRef]
- Liu, X.; Iftikhar, N.; Nielsen, P.S.; Heller, A. Online anomaly energy consumption detection using lambda architecture. In International Conference on Big Data Analytics and Knowledge Discovery; Springer: Cham, Switzerland, 2016; pp. 193–209. [Google Scholar]
- Wang, S.; Chen, H.; Wu, L.; Wang, J. A novel smart meter data compression method via stacked convolutional sparse auto-encoder. Intl. J. Electr. Power Energy Syst. 2020, 118, 105761. [Google Scholar] [CrossRef]
- Huang, X.; Hu, T.; Ye, C.; Xu, G.; Wang, X.; Chen, L. Electric load data compression and classification based on deep stacked auto-encoders. Energies 2019, 12, 653. [Google Scholar] [CrossRef]
- de Souza, J.C.S.; Assis, T.M.L.; Pal, B.C. Data compression in smart distribution systems via singular value decomposition. IEEE Trans. Smart Grid 2015, 8, 275–284. [Google Scholar] [CrossRef]
- Wang, Y.; Chen, Q.; Kang, C.; Xia, Q.; Luo, M. Sparse and redundant representation-based smart meter data compression and pattern extraction. IEEE Trans. Power Syst. 2016, 32, 2142–2151. [Google Scholar] [CrossRef]
- Montañez, C.A.C.; Hurst, W. A Machine Learning Approach for Detecting Unemployment Using the Smart Metering Infrastructure. IEEE Access. 2020, 8, 22525–22536. [Google Scholar] [CrossRef]
- Razavi, R.; Gharipour, A.; Fleury, M.; Akpan, I.J. Occupancy detection of residential buildings using smart meter data: A large-scale study. Energy Build. 2019, 183, 195–208. [Google Scholar] [CrossRef]
- Sun, G.; Cong, Y.; Hou, D.; Fan, H.; Xu, X.; Yu, H. Joint household characteristic prediction via smart meter data. IEEE Trans. Smart Grid 2017, 10, 1834–1844. [Google Scholar] [CrossRef]
- Wang, Y.; Chen, Q.; Gan, D.; Yang, J.; Kirschen, D.S.; Kang, C. Deep learning-based socio-demographic information identification from smart meter data. IEEE Trans. Smart Grid. 2018, 10, 2593–2602. [Google Scholar] [CrossRef]
- Khan, Z.A.; Jayaweera, D. Smart Meter Data Based Load Forecasting and Demand Side Management in Distribution Networks with Embedded PV Systems. IEEE Access. 2019, 8, 2631–2644. [Google Scholar] [CrossRef]
- Feng, C.; Sun, M.; Zhang, J. Reinforced deterministic and probabilistic load forecasting via Q-learning dynamic model selection. IEEE Trans. Smart Grid. 2019, 11, 1377–1386. [Google Scholar] [CrossRef]
- Kong, W.; Dong, Z.Y.; Jia, Y.; Hill, D.J.; Xu, Y.; Zhang, Y. Short-term residential load forecasting based on LSTM recurrent neural network. IEEE Trans. Smart Grid. 2017, 10, 841–851. [Google Scholar] [CrossRef]
- Oprea, S.V.; Bâra, A. Machine Learning Algorithms for Short-Term Load Forecast in Residential Buildings Using Smart Meters, Sensors and Big Data Solutions. IEEE Access. 2019, 7, 177874–177889. [Google Scholar] [CrossRef]
- Wang, Y.; Chen, Q.; Sun, M.; Kang, C.; Xia, Q. An ensemble forecasting method for the aggregated load with subprofiles. IEEE Trans. Smart Grid. 2018, 9, 3906–3908. [Google Scholar] [CrossRef]
- Buzau, M.M.; Tejedor-Aguilera, J.; Cruz-Romero, P.; Gómez-Expósito, A. Hybrid deep neural networks for detection of non-technical losses in electricity smart meters. IEEE Trans. Power Syst. 2019, 35, 1254–1263. [Google Scholar] [CrossRef]
- Taieb, S.B.; Huser, R.; Hyndman, R.J.; Genton, M.G. Forecasting uncertainty in electricity smart meter data by boosting additive quantile regression. IEEE Trans. Smart Grid. 2016, 7, 2448–2455. [Google Scholar] [CrossRef]
- Arora, S.; Taylor, J.W. Forecasting electricity smart meter data using conditional kernel density estimation. Omega 2016, 59, 47–59. [Google Scholar] [CrossRef]
- Akinsipe, O.C.; Leskarac, D.; Stegen, S.; Moya, D.; Kaparaju, P. The Utilisation of Smart Meter Technology to Increase Energy Awareness for Residential Buildings in Queensland, Australia. In Sustainability in Energy and Buildings; Springer: Cham, Switzerland, 2020; pp. 1–10. [Google Scholar]
- Ullah, A.; Haydarov, K.; Ul Haq, I.; Muhammad, K.; Rho, S.; Lee, M.; Baik, S.W. Deep Learning Assisted Buildings Energy Consumption Profiling Using Smart Meter Data. Sensors 2020, 20, 873. [Google Scholar] [CrossRef]
- Haben, S.; Singleton, C.; Grindrod, P. Analysis and Clustering of Residential Customers Energy Behavioral Demand Using Smart Meter Data. IEEE Trans. Smart Gri. 2016, 7, 136–144. [Google Scholar] [CrossRef]
- Wang, W.; Yu, N.; Foggo, B.; Davis, J.; Li, J. Phase identification in electric power distribution systems by clustering of smart meter data. In Proceedings of the 2016 15th IEEE International Conference on Machine Learning and Applications (ICMLA), Anaheim, CA, USA, 18–20 December 2016; pp. 259–265. [Google Scholar]
- Ismail, M.; Shaaban, M.F.; Naidu, M.; Serpedin, E. Deep Learning Detection of Electricity Theft Cyber-attacks in Renewable Distributed Generation. IEEE Trans. Smart Grid. 2020, 11, 3428–3437. [Google Scholar] [CrossRef]
- Jindal, A.; Dua, A.; Kaur, K.; Singh, M.; Kumar, N.; Mishra, S. Decision tree and SVM-based data analytics for theft detection in smart grid. IEEE Trans. Ind. Inf. 2016, 12, 1005–1016. [Google Scholar] [CrossRef]
- Júnior, L.A.P.; Ramos, C.C.O.; Rodrigues, D.; Pereira, D.R.; de Souza, A.N.; da Costa, K.A.P.; Papa, J.P. Unsupervised non-technical losses identification through optimum-path forest. Electr. Power Syst. Res. 2016, 140, 413–423. [Google Scholar] [CrossRef]
- Zhou, W.; Ardakanian, O.; Zhang, H.T.; Yuan, Y. Bayesian Learning-Based Harmonic State Estimation in Distribution Systems With Smart Meter and DPMU Data. IEEE Trans. Smart Grid 2019, 11, 832–845. [Google Scholar] [CrossRef]
- Jiang, Y. Data-Driven Fault Location of Electric Power Distribution Systems With Distributed Generation. IEEE Trans. Smart Grid. 2019, 11, 129–137. [Google Scholar] [CrossRef]
- Jiang, W.; Chen, J.; Tang, H.; Cheng, S.; Hu, Q.; Cai, M.; Rahman, S. A Physical Probabilistic Network Model for Distribution Network Topology Recognition Using Smart Meter Data. IEEE Trans. Smart Grid. 2019, 10, 6965–6973. [Google Scholar] [CrossRef]
- Mokhtar, M.; Robu, V.; Flynn, D.; Higgins, C.; Whyte, J.; Loughran, C.; Fulton, F. Automating the Verification of the Low Voltage Network Cables and Topologies. IEEE Trans. Smart Grid. 2019. [Google Scholar] [CrossRef]
- Pappu, S.J.; Bhatt, N.; Pasumarthy, R.; Rajeswaran, A. Identifying topology of low voltage distribution networks based on smart meter data. IEEE Trans. Smart Grid 2017, 9, 5113–5122. [Google Scholar] [CrossRef]
- Peppanen, J.; Grijalva, S.; Reno, M.J.; Broderick, R.J. Distribution system low-voltage circuit topology estimation using smart metering data. In Proceedings of the 2016 IEEE/PES Transmission and Distribution Conference and Exposition (T&D), Dallas, CO, USA, 2–5 May 2016; pp. 1–5. [Google Scholar]
- Weng, Y.; Liao, Y.; Rajagopal, R. Distributed energy resources topology identification via graphical modeling. IEEE Trans. Power Syst. 2016, 32, 2682–2694. [Google Scholar] [CrossRef]
- Luan, W.; Peng, J.; Maras, M.; Lo, J.; Harapnuk, B. Smart meter data analytics for distribution network connectivity verification. IEEE Trans. Smart Grid 2015, 6, 1964–1971. [Google Scholar] [CrossRef]
- Yu, J.; Sun, Y.; Lu, J.; Zou, Q.; Xie, X.; Fu, B.; Liu, W.; Ye, L.; Chen, Y. Optimal Placement of Power Quality Monitors in Complex Distribution Network Based on Topological Degradation. In Proceedings of the 2019 14th IEEE Conference on Industrial Electronics and Applications (ICIEA), Xi’an, China, 19–21 June 2019; pp. 58–61. [Google Scholar]
- Branco, H.; Oleskovicz, M.; Coury, D.V.; Delbem, A.C.B. Multiobjective optimization for power quality monitoring allocation considering voltage sags in distribution systems. Intl. J. Electr. Power Energy Syst. 2018, 97, 1–10. [Google Scholar] [CrossRef]
- Sheibani, M.; Ketabi, A.; Nosratabadi, M. Optimal power quality meters placement with consideration of single line and meter loss contingencies. Intl. J. Ind. Electron. Control Optimiz. 2018, 1, 81–89. [Google Scholar]
- Ali, S.; Wu, K.; Weston, K.; Marinakis, D. A machine learning approach to meter placement for power quality estimation in smart grid. IEEE Trans. Smart Grid 2015, 7, 1552–1561. [Google Scholar] [CrossRef]
- Nasiri, S.; Seifi, H. Robust probabilistic optimal voltage sag monitoring in presence of uncertainties. IET Gener. Trans. Distrib. 2016, 10, 4240–4248. [Google Scholar] [CrossRef]
- Pau, M.; Pegoraro, P.A.; Monti, A.; Muscas, C.; Ponci, F.; Sulis, S. Impact of current and power measurements on distribution system state estimation uncertainty. IEEE Trans. Ins. Meas. 2018, 68, 3992–4002. [Google Scholar] [CrossRef]
- Xiao, F.; Ai, Q. Data-driven multi-hidden markov model-based power quality disturbance prediction that incorporates weather conditions. IEEE Trans. Power Syst. 2018, 34, 402–412. [Google Scholar] [CrossRef]
- Mora-Florez, J.; Barrera-Nunez, V.; Carrillo-Caicedo, G. Fault location in power distribution systems using a learning algorithm for multivariable data analysis. IEEE Trans. Power Deliv. 2007, 22, 1715–1721. [Google Scholar] [CrossRef]
- Kim, J.; Baran, M.E.; Lampley, G.C. Estimation of fault location on distribution feeders using PQ monitoring data. In Proceedings of the 2007 IEEE Power Engineering Society General Meeting, Tampa, FL, USA, 24–28 June 2007; pp. 1–4. [Google Scholar]
- Elphick, S.; Gosbell, V.; Smith, V.; Perera, S.; Ciufo, P.; Drury, G. Methods for harmonic analysis and reporting in future grid applications. IEEE Trans. Power Deliv. 2016, 32, 989–995. [Google Scholar] [CrossRef]
- Gasch, E.; Domagk, M.; Meyer, J.; Abdelrahman, S.; Liao, H.; Milanović, J.V. Assessment of power quality performance in distribution networks part I-Measurement campaign and initial analysis. In Proceedings of the 2016 17th International Conference on Harmonics and Quality of Power (ICHQP), Belo Horizonte, Brazil, 16–19 October 2016; pp. 164–169. [Google Scholar]
- Abdelrahman, S.; Liao, H.; Milanović, J.V.; Gasch, E.; Domagk, M.; Meyer, J. Assessment of Power Quality performance in distribution networks part II-Performance Indices and ranking of network buses. In Proceedings of the 2016 17th International Conference on Harmonics and Quality of Power (ICHQP), Belo Horizonte, Brazil, 16–19 October 2016; pp. 431–436. [Google Scholar]
- Elphick, S.; Ciufo, P.; Drury, G.; Smith, V.; Perera, S.; Gosbell, V. Large scale proactive power-quality monitoring: An example from Australia. IEEE Trans. Power Deliv. 2016, 32, 881–889. [Google Scholar] [CrossRef]
- Luo, L.; Chen, S.; Yang, Y.; Yuan, S.; Luo, H.; Hu, Y. Design and application of power quality monitoring system for the smart substation based on IEC 61850. CIRED-Open Access Proc. J. 2017, 2017, 577–580. [Google Scholar] [CrossRef]
- Artale, G.; Cataliotti, A.; Cosentino, V.; Di Cara, D.; Guaiana, S.; Panzavecchia, N.; Tinè, G. Real-Time Power Flow Monitoring and Control System for Microgrids Integration in Islanded Scenarios. IEEE Trans. Ind. Appl. 2019, 55, 7186–7197. [Google Scholar] [CrossRef]
- Blair, S.M.; Booth, C.D.; Williamson, G.; Poralis, A.; Turnham, V. Automatically detecting and correcting errors in power quality monitoring data. IEEE Trans. Power Deliv. 2016, 32, 1005–1013. [Google Scholar] [CrossRef]
- Rahim, A.A.; Hashim, M.F.; Siam, M.M. Dynamic load modelling based on power quality recorder data. In Proceedings of the 2013 IEEE 7th International Power Engineering and Optimization Conference (PEOCO), Langkawi Island, Malaysia, 3–4 June 2013; pp. 119–123. [Google Scholar]


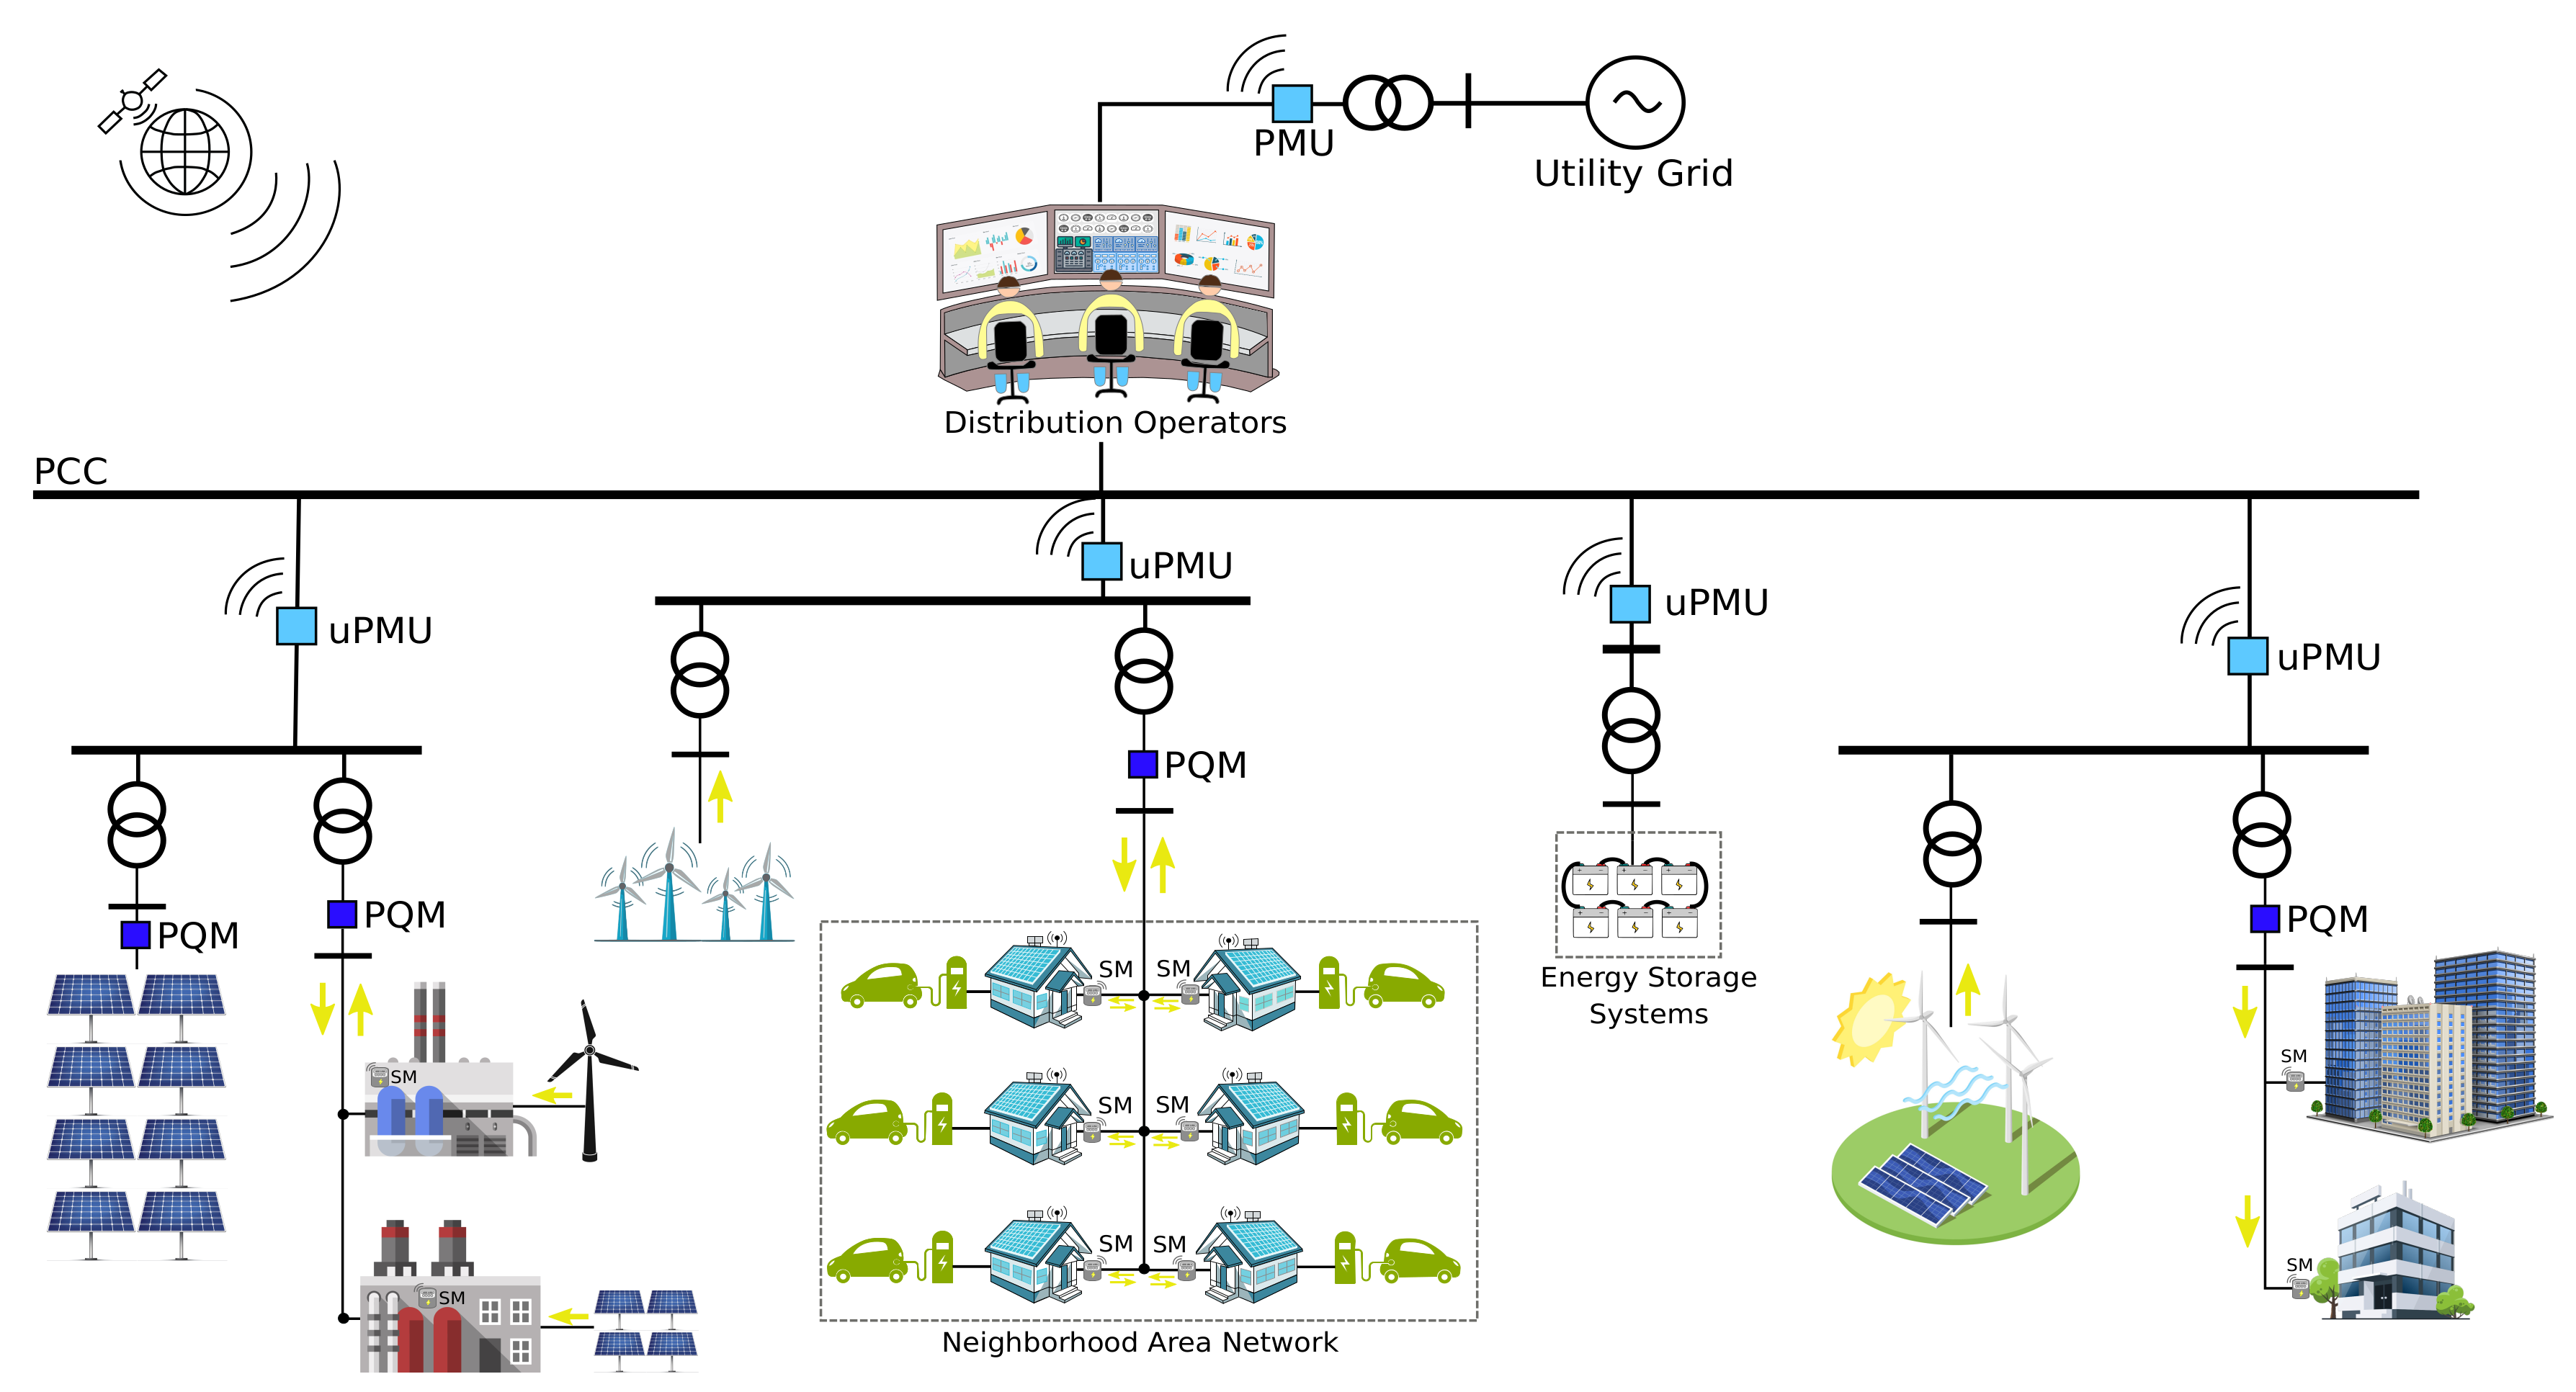
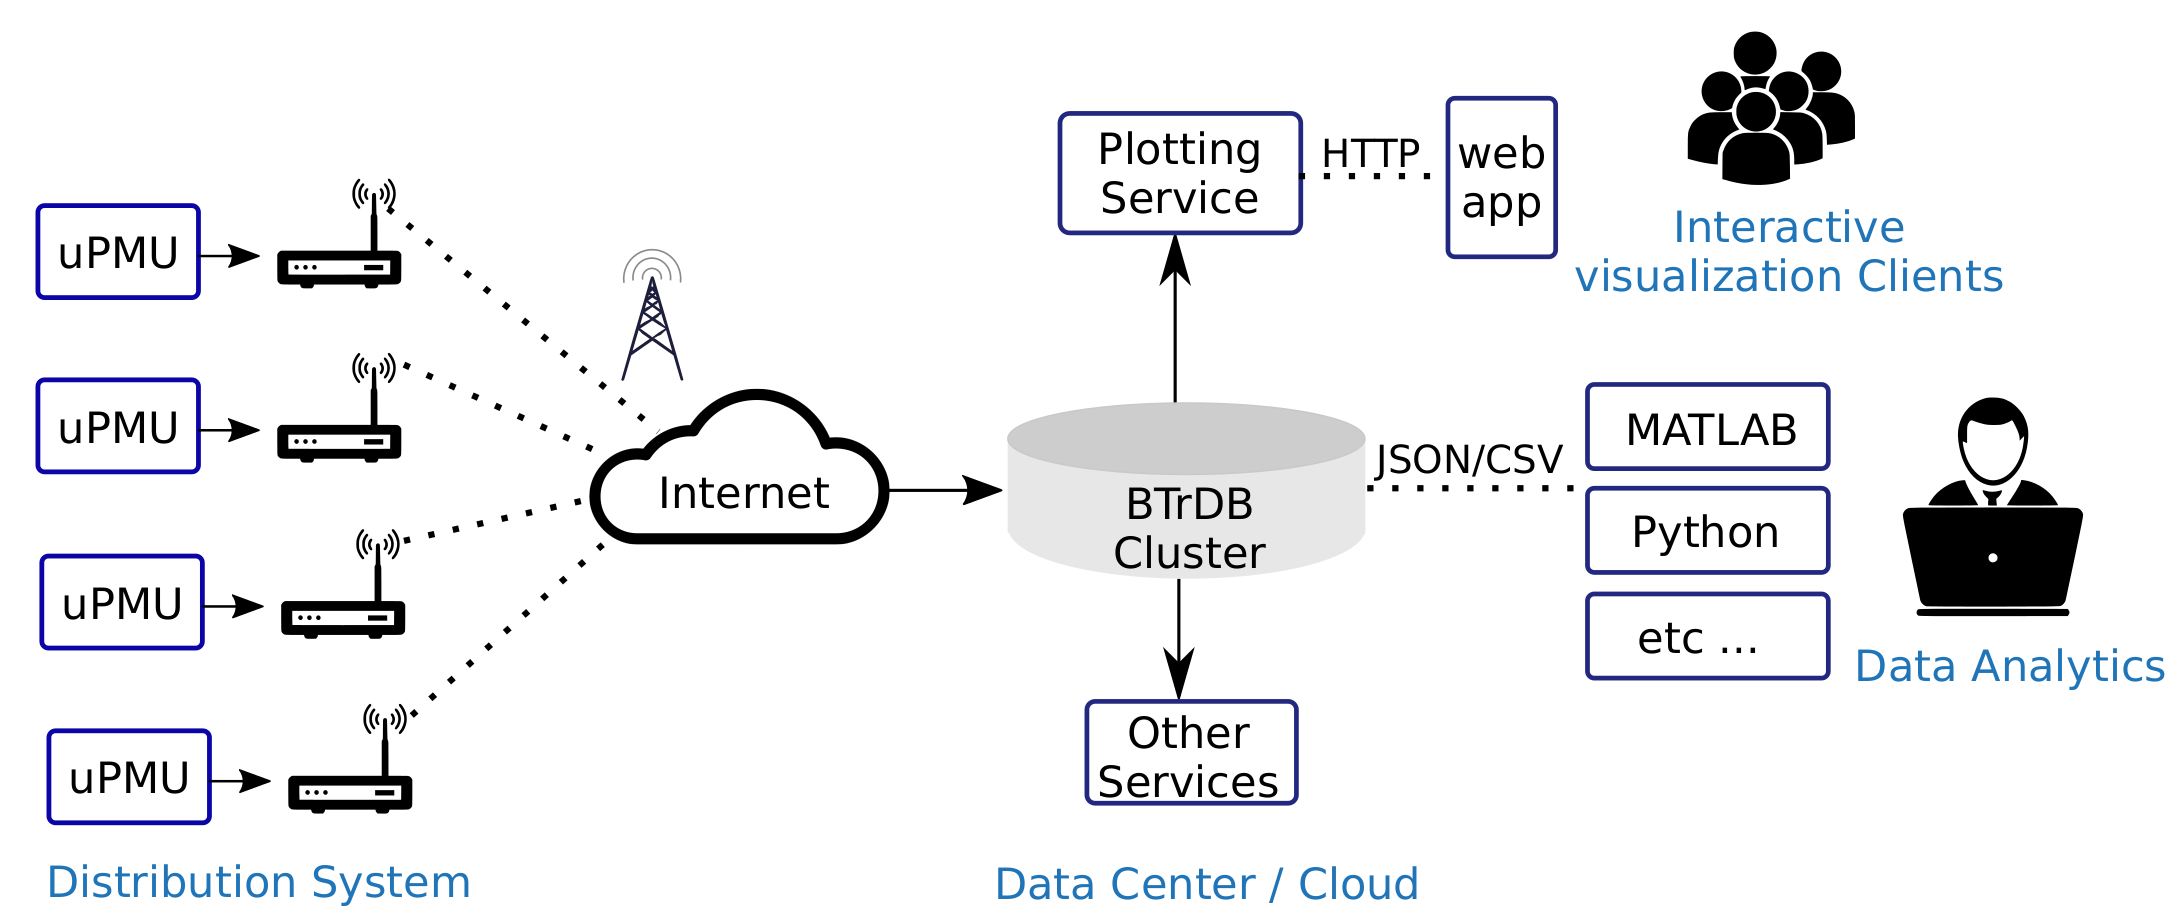
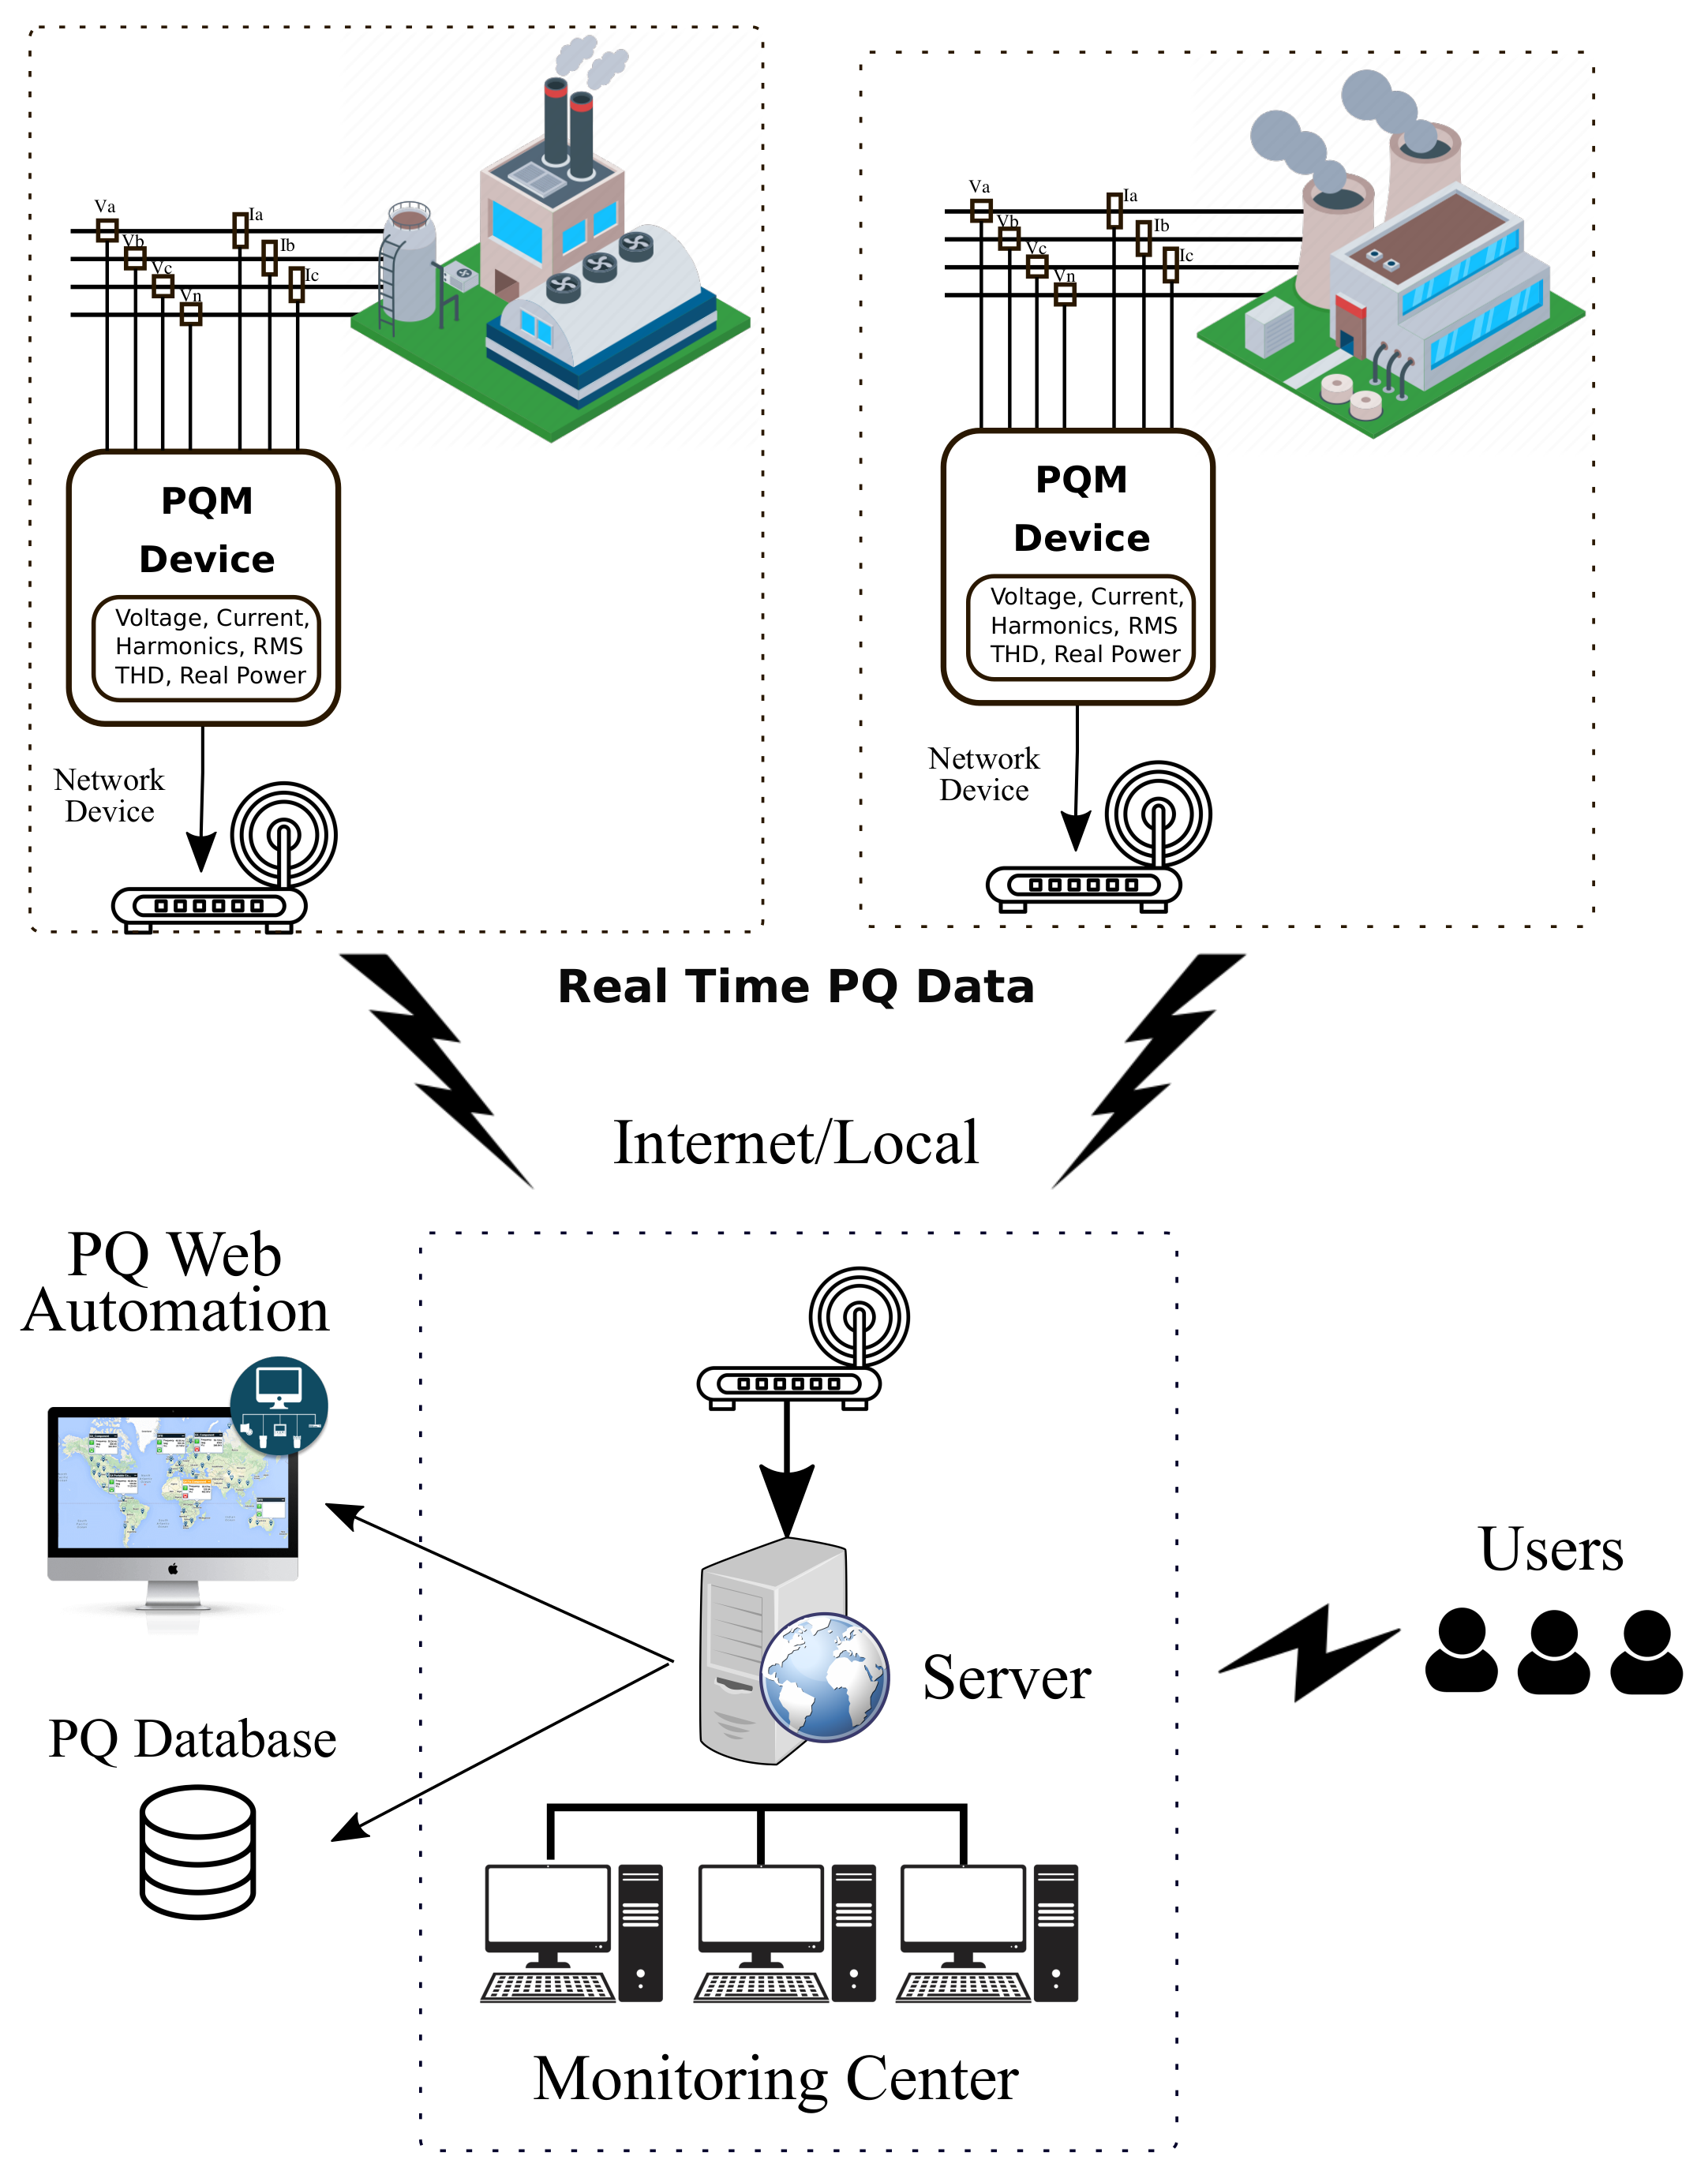
| Power Sensors | Smart Meter | PMU | PMUs | Power Quality Monitors | Substation Meters | Digital Fault Recorders | Wireless Power Line Sensors | |
|---|---|---|---|---|---|---|---|---|
| Reporting period: | 1 sample each (2–4) s | 1 sample each 1–60 min | Up to 120 samples each second | 10–60 samples each second | 1 sample each second | 1 sample each min | Record the event Up to 120 s | Record the event |
| System Observability: | Steady State | Load Profiles | Dynamic and Transient State | Steady and Dynamic State | Transient events | Dynamic State | Transient and Disturbance Events | Transient and Disturbance Events |
| Network Monitoring: | Medium Voltage | Low Voltage | Medium and Low Voltage | High and Medium voltage | Medium and Low Voltage | Medium Voltage | Medium Voltage | Medium and Low Voltage |
| Measure Quantities | Voltage (RMS) Active Power, Reactive Power | Active Power, PF Reactive Power Frequency, Current, RMS Voltage and Power Quality data | 3 Ph-Voltage phasors 3 Ph-Current phasors Active Power Reactive Power Frequency, PF. | 3 Ph-Voltage phasors 3 Ph-Current phasors Active Power Reactive Power Frequency, PF. | Frequency, Voltage, Current, THD, Harmonics, Flicker, Unbalance | Active and reactive power flow, complex current and complex voltage | Voltage, Currents, frequency, P, Q, S, PF, Harmonics, Symmetrical Components | 3 Ph-Current phasor, electric field, P, Temperature |
| Sensor Accuracy | ±0.5% | Active Power: ±1% Reactive power: ±2% | Amplitude: ±0.05% Angle: ±0.01% | Amplitude: ±1% Angle: ±1% | ±0.2% and ±0.1% | ±0.5% | ±0.1% | ±0.5% |
| Sample Rate | - | - | Up to 30,720 s/s | Up to 2880 s/s | Up to 100,000 s/s | - | Up to 25,600 s/s | 12,800 s/s |
| Cost Level * | Medium | Low | Medium | High | Low | High | Medium | Low |
| Reference: | [28,29,30] | [31,32,33,34] | [35] | [36,37] | [30,38,39] | [30,40] | [30,41] | [42] |
| Application Group | Input Data | Methods | Output Visualization | Year (Reference) | Is It Real PMU Data ? | Simulation Data? |
|---|---|---|---|---|---|---|
| Situational Awareness | 3-Ph voltage and currents (magnitudes and angles), frequency, active power, reactive power. | 1. Three stage algorithm 2. Dynamic WSMW 3. Generalized GLM 4. Parametric Sparsity 5. Compensation Theorem 6. CUSUM 7. Thevenin Estimation 8. LWSS 9. Experimental Analysis 10. Kernel PCA and pSVM 11. KF and Model Synthesis 12. Theoretical Analysis | Voltage magnitud change, current magnitud change, active power change. | 1. 2020 [71] 2. 2019 [68] 3. 2019 [69] 4. 2019 [74] 5. 2018 [66] 6. 2018 [67] 7. 2018 [75] 8. 2017 [72] 9. 2017 [73] 10. 2016 [70] 11. 2016 [76] 12. 2019 [77] | 1. Yes 2. Yes 3. Yes 4. No 5. Yes 6. Yes 7. No 8. Yes 9. Yes 10. Yes 11. Yes 12. Yes | 1. No 2. No 3. No 4. Yes 5. Yes 6. Yes 7. Yes 8. Yes 9. No 10. No 11. Yes 12. Yes |
| Topology Identification | Voltage (magnitude and phase angle) | 1. Recursive Grouping 2. Adaptive Lasso 3. TSV-Top 4. Projection of Norm tren Vector | New switch configuration in the topology | 1. 2020 [78] 2. 2019 [74] 3. 2018 [79] 4. 2015 [80] | 1. No 2. No 3. No 4. No | 1. Yes 2. Yes 3. Yes 4. Yes |
| Classification of Events | 3 Ph-Voltage and currents (magnitudes & angles) | 1. Multi-class SVM 2. NN based autocoders (Softmax) 3. PCA and SVM based autocoders | Event location and disruptive classes | 1. 2019 [68] 2. 2018 [81] 3. 2017 [82] | 1. Yes 2. No 3. No | 1. No 2. Yes 3. Yes |
| State Estimation | Voltages, currents, line admittances, loads. | 1. WLS, WLS with NR 2. R-NESE & WTVSE 3. LSE, ARMA and SVM 4. Compensation Theorem 5. Compressive Sensing & WLS 6. DFT and WLS | Estimation of voltage magnitud, loads, currents and errors from actual states. | 1. 2020 [83] 2. 2020 [84] 3. 2019 [85] 4. 2018 [86] 5. 2017 [87] 6. 2018 [88] | 1. No 2. No 3. No 4. Yes 5. No 6. Yes | 1. Yes 2. Yes 3. Yes 4. Yes 5. Yes 6. Yes |
| Optimal Placement | Voltage phasor, parameters of the branch. | 1. Mixed Integer Semi-definite Programming Model 2. Integer linear programming 3. Greedy Search | Optimal number and localization of micro-PMUs at buses | 1. 2020 [84] 2. 2019 [89] 3. 2018 [67] | 1. No 2. No 3. Yes | 1. Yes 2. Yes 3. Yes |
| Model Calibration | Frequency, voltage and current phasors. | 1. Non-Linear Estimation | Calibrated parameters | 1. 2020 [90] | 1. No | 1. Yes |
| Operation Events | Voltage and currents (magnitudes and angles) | 1. Fuzzy C-means 2. Data driven analysis based on RLC Model | Switching event, operational parameters (real and reactive power flow), voltage and current (feeders and loads) | 1. 2017 [91] 2. 2017 [92] | 1. Yes 2. Yes | 1. No 2. No |
| Micro-PMU Data | Specific Applications in Distribution Network | ||
|---|---|---|---|
| 3 Ph-I (Phasors): | Analysis of Transient Load Behaviors [91] | ||
| 3 Ph-Currents (Phasor) & Y (Admitance matrix): | Optimal number and localization of PMUs in buses [84,89] | ||
| 3-Ph-V (Phasors): | Estimation of Voltage Magnitude error [84] | Identification of swithching actions and new topology scenarios [74,79,80] | |
| 3-Ph-V (Phasors) & Loads: | Load and Voltage Estimation Error [85] | ||
| 3 Ph-V & 3 Ph-I (Phasors): | Single and 3 phase current & voltage event detection [69] | Response of a PV farm (Current and Voltage) of 3 lightning events [73]. | Detection of capacitor bank switching [92] |
| 3 Ph-V & 3 Ph-I (Phasors): | Fault position with accuracy, sensitivity to noise level [72] | Distinguishing between two disruptive events and the normal load changing event [82]. | Identify event location and disruptive classes [74,81] |
| 3 Ph-V & 3 Ph-I (Phasors): | Event Location and Identification [66] | Event detection of voltage sag based on Data Index and Reconstruction Error [70]. | Fault currents to coordinate relays [75] |
| 3 Ph-V & 3 Ph-I (phasors), frequency: | Estimation of sub-transient generator model variables [90]. | Cyclic frequency trend and anomaly signals detection [71] | |
| 3 Ph-V & 3 Ph-I (Phasors), Active and Reactive Power, frequency: | Anomaly Detection Architecture [67,68] | Optimal D-PMU placement [67] | Event Classifier of PQ events [68] |
| 3 Ph-V & 3 Ph-I (Phasors), loads, Y (admitance matrix): | Tracking State Estimation [86,87] | ||
| Application Groups | Input Data | Methods | Output Visualization | Year (Reference) | Is It Real SM Data ? | Simulation Data? |
|---|---|---|---|---|---|---|
| Anomaly Detection | Load Profiles (kWh), RMS Voltage, history data | 1. Isolation Forest 2. CCAD-SW, SVR, RF 3. Quasi-linear classifier 4. Lambda system | Anomaly consumption detection, data integrity assault, identification of anomalous consumption. | 1. 2019 [93] 2. 2017 [94] 3. 2017 [95] 4.2016 [96] | 1. No 2. Yes 3. No 4. Yes | 1. Yes 2. Yes 3. Yes 4. No |
| Compression of Data | Load Profiles (kWh) | 1. Deep Learning via SCSAE 2. SAE 3. SVD 4. K-SVD, K-mean, DWT, PCA, PAA | Storage and transmission of large sets of power consumption data measured by smart meters. | 1. 2020 [97] 2. 2019 [98] 3. 2017 [99] 4. 2017 [100] | 1. Yes 2. Yes 3. Yes 4. Yes | 1. No 2. No 3. No 4. No |
| Customer Characterization | Load Profiles (kWh), Sociodemographic atributes of households | 1. GBM, CART, RF, DWD, Discrimination with Polynomial Kernel 2. Random Forests, SVM, K-nearest Neighbors and NN 3. Discriminative multi-task relationship learning model 4. Deep-CNN and SVM | Unemployment prediction of household occupants, prediction of home-occupancy status of households, prediction of multiple household characteristics. | 1. 2020 [101] 2. 2019 [102] 3. 2019 [103] 4. 2018 [104] | 1. Yes 2. Yes 3. Yes 4. Yes | 1. No 2. No 3. No 4. No |
| Forecasting | Load Profiles (kWh), Weather | 1. Extended k-means, ANN and MLR 2. ML using a Q-learning 3. LSTM Recurrent Neural Network 4. FF-ANN, NARX, DNN, Gradient Tree Boosting and Random Forests 5. Load Ensemble Method 6. Boosting additive quantile regression 7. Conditional Kernel Density estimation | Short-Term Load Forecast in Residential Buildings, prediction interval of electricity cost for different time-of-use tariffs, forecast the aggregated load. | 1. 2020 [105] 2. 2020 [106] 3. 2019 [107] 4. 2019 [108] 5. 2018 [109] 6. 2018 [110] 7. 2016 [111] 8. 2016 [112] | 1. Yes 2. Yes 3. Yes 4. Yes 5. Yes 6. Yes 7. Yes 8. Yes | 1. No 2. No 3. No 4. No 5. No 6. No 7. No 8.No |
| Load Classification | Load Profiles (kWh) | 1. Statistical Tool 2. Deep auto-encoder and (SOM) 3. Finite Mixture Model of Gaussian multivariate distributions 4. Constrained k-means algorithm | Energy tariffs at different times of the day and identification of time periods during the season, months, etc. | 1. 2020 [113] 2. 2020 [114] 3. 2016 [115] 4. 2016 [116] | 1. Yes 2. Yes 3. Yes 4. Yes | 1. No 2. No 3. No 4. No |
| Non Technical Loss Detection | Load Profiles (kWh), Geographical information, line parameters | 1. Hybrid Deep Neuronal Networks 2. Deep convolutional-recurrent NN 3. Hybrid DT and SVM classifiers 4. Optimum PF, k-means, GMM, Birch, affinity propagation and SVM | Detection and location of electricity thefts, irregular and regular profiles | 1. 2020 [110] 2. 2020 [117] 3. 2016 [118] 4. 2016 [119] | 1. Yes 2. No 3. No 4. Yes | 1. No 2. Yes 3. Yes 4. No |
| Sensor Fusion | Load profiles (kWh), currents, voltages, admittance matrix, bus voltage phasor, power flows. | 1. Recurrent neural networks, and sparse Bayesian learning for state estimation 2. Modified Dynamic Mirror Descendent 3. Mixed integer linear programming | Locating harmonic sources, separation of measurements in a distribution feeder, prediction of outage regions. | 1. 2020 [120] 2. 2020 [40] 3. 2019 [121] | 1. No 2. Yes 3. No | 1. Yes 2. Yes 3. Yes |
| Topology Identification | Load profiles (kWh), RMS voltage (feeder and smart meter), line parameters, currents. | 1. Physical-probabilistic-network, lasso regression 2. Tree-based search methodology 3. PCA and Grap Theory 4. DSTE Algorithm 5. Graphical Modeling 6. Inhouse algorithm based Voltage profile correlation analysis | Operation mode of distribution networks and voltage correlations with different buses. Topology Estimation | 1. 2019 [122] 2. 2019 [123] 3. 2017 [124] 4. 2016 [125] 5. 2016 [126] 6. 2015 [127] | 1. No 2. Yes 3. No 4. Yes 5. Yes 6. Yes | 1. Yes 2. No 3. Yes 4. No 5. Yes 6. No |
| Smart Meter Input Data | Specific Application in Distribution Network | ||||
|---|---|---|---|---|---|
| Household Load Profiles (kWh): | Identification of anomalous consumption patterns based on classifiers [94] | Storage and transmission of large volumes of power consumption data [97,98,100] | Consumption profiling and prediction of energy consumption [110,114] | Short-Term Load Forecast in Residential Buildings [107,108,109] | Online Anomaly consumption detection [96,118] |
| Household Load Profiles (kWh): | Identification of time periods during the day and seasonality [112,115] | Phase identification based on clustering [116] | Non-technical losses identification [119] | Load profiling based on the energy tariffs across four climatic conditions [113] | Forecasting uncertainty in electricity data [111] |
| Load Profiles and geographical data: | Detection of Non-Technical Losses [110] | Identification of network topology and load phase connectivity [124] | Topology Identification via Graphical Modeling [126] | ||
| Voltage Magnitudes and Household Load Profiles (kWh): | Network Topology identification [127] | ||||
| Voltage and Current Magnitudes, load profiles and admittance matrix of the network: | Inferring operation modes of distribution networks [122] | Identifying the connections, as well as the voltage correlations between different buses [122] | Distribution system Low-Voltage Circuit Topology Estimation [125] | Approximation the missing cable information in LV networks (cable’s cross section area (XSA) data). [123] | |
| Load profiles and socio- demographic attributes of households: | Unemployment prediction of single household occupants [101] | Household Load Forecasting based on clustering [105] | Predict the home occupancy status of households [102] | Predict multiple household characteristics (e.g., age of person, household income, cooking style, etc.) [103,104] | |
| Application Group | Input Data | Methods | Output Visualization | Year (Reference) | Is It Real PQM Data ? | Simulation Data? |
|---|---|---|---|---|---|---|
| Optimal Placement | Topology of Distribution Grid (Line parameters, Transformers capacity, Loads and generation). Historic Measurement of PQM (sag/swell, THD) | 1. TLBO Algorithm 2. Multi-objective Evolutionary Algorithm with Tables 3. Seeker Optimization Algorithm based on Pareto 4. Entropy-based and Bayesian Network Model 5. PMRA Algorithm 6. WLS Method | Optimal placement of PQM in complex distribution networks. | 1. 2019 [128] 2. 2018 [129] 3. 2018 [130] 4. 2016 [131] 5. 2016 [132] 6. 2018 [133] | 1. No 2. No 3. No 4. Yes 5. No 6. No | 1. Yes 2. Yes 3. Yes 4. Yes 5. Yes 6. Yes |
| Fault Location | 3-Phase Voltage and Current Transient, such as Sags/Swell. | 1. Multi-hidden Markov model 2. LAMDA technique. 3. Fault distance estimation | Locate and forecast the presence of PQ disturbances, and determine the fault type on radial DS. | 1. 2019 [134] 2. 2007 [135] 3. 2007 [136] | 1. Yes 2. Yes 3. Yes | 1. No 2. No 3. No |
| Harmonic Analysis | 3-phase Voltage and Current magnitude of harmonic distortion, Odd harmonics, flicker, THD. | 1. Fast Fourier Transform 2. Fourier Analysis 3. Fourier Analysis | Describe harmonic behavior at an individual site, as well as at many sites across a DS using different indices of PQ. | 1. 2017 [137] 2. 2016 [138] 3. 2016 [139] | 1. Yes 2. Yes 3. Yes | 1. No 2. No 3. No |
| Power Quality Monitoring System | Power quality indices (Voltage and current sags/swells, THD, indi- vidual harmonics, flick- ers, etc.) | 1. Sag reporting techniques. 2. Data acquisition system. 3. Data acquisition system. 4. Load Flow Algorithm | Power Quality Monitoring Projects for Distribution Network Service Providers. | 1. 2018 [65] 2. 2017 [140] 3. 2017 [141] 4. 2019 [142] | 1. No 2. Yes 3. Yes 4. Yes | 1. Yes 2. No 3. No 4. No |
| Data error detection | Voltage and current phasors, THD, TDD, and short term flicker. | 1. Correlation Analysis | Detection and correction error in PQ monitoring data. | 1. 2017 [143] | 1. Yes | 1. No |
| Load Modeling | RMS voltage and current, Active and Reactive Power, during disturbances on the upstream networks. | 1. Load parameter derivation | Derive, test, and verify the dynamic load model parameters. | 1. 2013 [144] | 1. Yes | 1. Yes |
© 2020 by the authors. Licensee MDPI, Basel, Switzerland. This article is an open access article distributed under the terms and conditions of the Creative Commons Attribution (CC BY) license (http://creativecommons.org/licenses/by/4.0/).
Share and Cite
Saldaña-González, A.E.; Sumper, A.; Aragüés-Peñalba, M.; Smolnikar, M. Advanced Distribution Measurement Technologies and Data Applications for Smart Grids: A Review. Energies 2020, 13, 3730. https://doi.org/10.3390/en13143730
Saldaña-González AE, Sumper A, Aragüés-Peñalba M, Smolnikar M. Advanced Distribution Measurement Technologies and Data Applications for Smart Grids: A Review. Energies. 2020; 13(14):3730. https://doi.org/10.3390/en13143730
Chicago/Turabian StyleSaldaña-González, Antonio E., Andreas Sumper, Mònica Aragüés-Peñalba, and Miha Smolnikar. 2020. "Advanced Distribution Measurement Technologies and Data Applications for Smart Grids: A Review" Energies 13, no. 14: 3730. https://doi.org/10.3390/en13143730
APA StyleSaldaña-González, A. E., Sumper, A., Aragüés-Peñalba, M., & Smolnikar, M. (2020). Advanced Distribution Measurement Technologies and Data Applications for Smart Grids: A Review. Energies, 13(14), 3730. https://doi.org/10.3390/en13143730