Abstract
Greenhouse crops represent a significant productive sector of the agricultural system; one of the main problems to be addressed is indoor air conditioning to ensure thermal well-being of crops. This study focuses on the ventilation analysis of solar greenhouse with symmetrical flat pitched roof and single span located in a warm temperate climate. This work proposes the dynamic analysis of the greenhouse modeled in TRNsys, simultaneously considering different thermal phenomena three-dimensional (3D) shortwave and longwave radiative exchange, airflow exchanges, presence of lamps with their exact 3D position, ground and plant evapotranspiration, and convective heat transfer coefficients. Several air conditioning systems were analyzed, automatic window opening, controlled mechanical ventilation systems (CMV) and horizontal Earth-to-Air Heat Exchanger (EAHX) coupled with CMV, for different air volume changes per hour. In summer, the exploitation of the ground allows having excellent results with the EAHX system, reducing the temperature peaks of up to 5 °C compared to the use of CMV. In winter, it is interesting to note that, although the EAHX is not the solution that raises the temperature the most during the day, its use allows flattening the thermal wave more. In fact, the trend is almost constant during the day, raising the temperature during the first and last hours of the day.
1. Introduction
The world’s growing population and the challenges of climate change require increasingly sustainable and productive agricultural systems to meet new needs. For agriculture, as for other sectors, climate change represents a dual challenge: reducing its greenhouse gas emissions (mitigation) and adapting to the consequences of warming (adaptation) [1]. It requires a reorganization of the production process to reduce the impact on climate and environmental balances. The development of cheaper systems and greater use of renewable energy is needed.
Solar greenhouses are a good compromise to increase world production by encouraging off-season cultivation, providing additional protection for crops from adverse outdoor conditions and ensuring the growth of certain varieties in areas where this was not previously possible. These systems provide the most suitable microclimate for maximum flower, plant and vegetable growth within a controlled environment throughout the year, strongly affecting the cost and environmental sustainability. In fact, solar greenhouses, characterized by a high technological level, are part of the most energy-intensive sector of agriculture [2]. Over and above protecting against adverse weather conditions, the main purpose of the solar greenhouse is to optimize the supply of light and heat. Therefore, the final performance of the solar greenhouse is strongly linked to the climatic and microclimatic characteristics of the area, as well as its geometry.
It is well known [3] that the climate is one of the key elements to face specific technological choices that acts in the reduction of energy consumption in the building sector. The greenhouse is a special case of a building, where the envelope is almost completely transparent and consequently the direct and diffuse solar radiation is much higher than a normal building. Furthermore, it is well known that the transparent envelope is the building’s weakest part as it causes around 30–50% of transmission losses through the envelope [4]. The shape and orientation of the greenhouse roof most influence the level of solar energy supply in the greenhouse [5]. Another distinctive characteristic is the large internal volume, which causes horizontal and vertical thermal stratification. The height of the greenhouse permits to improve the internal ventilation, a greater height means greater temperature gradient in the vertical axis and, therefore, more intensive natural ventilation. In addition, it is necessary to consider the influence of evapotranspiration from the ground and plants inside greenhouses.
The design of the greenhouse is complex because many factors need to be carefully weighed; first of all, it is important to assess the effective end-use, i.e., whether the greenhouse is used for cultivation or plant protection, and consequently, a careful and calibrated selection of building materials is required, which should be able to offer a thermo-hygrometric balance for the growth of the crop. In the European Union (EU), greenhouse planning complies with EU standard EN-13031-1 [6].
Worldwide many typologies of greenhouse are used with different geometries, such as greenhouses with curved roofs, tunnel greenhouses, greenhouses with symmetrical and asymmetrical pitched roofs. In the Mediterranean regions, characterized by mild winters and very hot summers with high solar radiation, the most common Type of greenhouse construction is characterized by a curved roof, more generally a tunnel, with plastic roofing materials.
The greenhouses show high consumption of fossil fuels for indoor climate control [7,8] and one of the main technical problems to overcome in greenhouses is energy-saving [9]. Conventional cooling systems involve an increase in capital and operating costs.
RES (renewable energy sources) ensure a secure and sustainable energy supply, but their significant intermittence and the uncertainty caused by climate variability often make the single-use of such systems unreliable; for this reason, hybrid systems could be a perfect compromise to meet the needs of the load to be covered [10,11].
Geothermal systems improve the energy performance of buildings and reduce energy consumption by using the ground as an easily accessible heat source or heat sink. Geothermal energy is one of the many renewable resources that nature offers in a constant and durable way and has the potential to be exploited all year round [12]. In fact, the system benefits from almost constant ground temperature during the whole year, below the outside temperature in summer and above in winter [13]. The heating and cooling of the internal air of the buildings can be carried out through preheating and pre-cooling of the incoming air using geothermal energy [14].
Many experimental projects and commercial implementations have been developed to assess the potential of geothermal heat pumps for specific greenhouse cultivation, leading to excellent results both in terms of energy consumption and environmental, economic and agronomic implications [15,16,17].
There are two different Types of geothermal energy, depending on the temperature of underground sources and on the different technologies used: high-temperature geothermal energy and low-temperature or low-enthalpy geothermal energy. Low-enthalpy geothermal energy uses the heat from the surface layers of the ground to heat and cool buildings. Geothermal pipes can be vertical or horizontal.
In the literature, there are several ways to call the geothermal systems with horizontal pipes, for example, Horizontal Earth-To-Air Heat Exchanger (EAHX) or Horizontal Air-Ground Heat Exchanger (HAGHE).
The EAHX consists of underground pipes, generally placed near a building, and connected in series to its ventilation system. In the Mediterranean climate, it can be considered an optimal solution for the cooling load reduction in the buildings during the summer season [18].
It has been demonstrated that EAHX can significantly decrease the cooling and heating requirements in greenhouses, as it leads to a significant decrease in internal temperatures in summer and an increase during winter seasons.
In winter, the temperature of the greenhouse increases as the burial depth and the length of the pipes increases and the diameter of the pipes and the air speed decreases [19,20].
Mongkon et al. [21] conducted a comparative experiment to highlight the differences between a conventional greenhouse and an experimental greenhouse in which an underground heat exchanger was installed, both greenhouses are structurally identical. Two species of plants, Dahlias and Lettuce, were planted inside the greenhouses. Experimentation has shown that more than other parameters, the diameter of the pipes and the speed of the air influence the COP value.
L. Ozgener et al. [22] described a greenhouse conditioned in both summer and winter according to the needs of the products. The exchanger is an underground pipe (diameter of 56 cm, length of 47 m, buried depth of 3 m) inside which the air is moved by a fan. The system is used only during the day and was turned off during the night. The total exergy efficiency is equal to 60.7%, the evaluation of the exergy allows to better identify the process efficiencies and losses. In fact, as the authors predicted, the maximum irreversibility of the system takes place in underground pipes.
Several studies have investigated how inlet air temperature, air velocity, pipe length, pipe radius and pipe burial depth can affect system performance. Tzaferis et al. [23] studied eight algorithms to determine the behavior of EAHXs.
The physical characteristics of the ground and the climate of the specific place where the system is installed affect its overall performance [24].
Lu Aye et al. [25] presented heat pump systems with different configurations aimed at the reduction of energy use and costs for heating the greenhouses, particularly when using off-peak electricity. The authors affirmed that a ground source heat pump can offer higher energy savings than the solution adopted, as the ground temperature is warmer than the external air temperature in winter.
Other studies [26,27] coupled the air-source heat pump with an EAHX with the aim of extending the use of the heat pump to areas, characterized by extreme climate, where it is not currently recommended to use them, for an average external temperature lower than the limit operating temperature of the heat pump.
This study focuses on the ventilation analysis of a Venlo solar greenhouse [28] characterized by symmetrical flat pitched roof and single span. Several air conditioning systems were analyzed, automatic window opening, controlled mechanical ventilation systems (CMV) and EAHX systems coupled with CMV, for different air volume changes per hour.
2. Materials and Methods
This section illustrates the Solar Greenhouse chosen as case study (Section 2.1), all the system combinations applied for the air conditioning (Section 2.2) and the simulation software for the numerical analysis with its set-up (Section 2.3).
2.1. Solar Greenhouse
The present study focuses on a greenhouse located in Crotone, a city on the eastern side of Calabria (Italy). In accordance with the Italian climate classification [29], the city belongs to the climate zone B (characterized by 899 heating degrees days), where the building heating systems work in the period from 1st December to 31st March. Using the Köppen Climate Classification [30], one of the most widely used international climate classification systems, the climate of Crotone is identified as “Csa” (C = warm temperate, s = summer dry, a = hot summer) with mild winter and warm summer.
The analysis was carried out on a Venlo solar greenhouse characterized by a single span that covers an area of 500 m2 with a volume of 2750 m3, whose surfaces with the longest sides oriented to South and North [31]. As reported in Figure 1, the geometric parameters that characterize the solar greenhouse are:
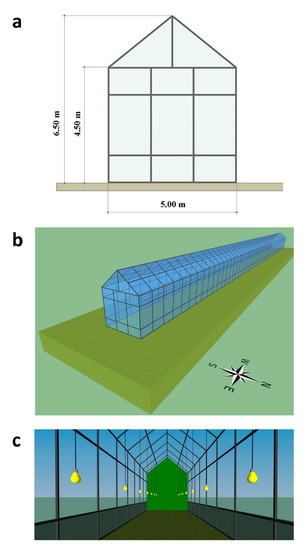
Figure 1.
Solar greenhouse: (a) geometrical definition; (b) orientation; (c) lamp disposition.
- -
- Span width = 5 m;
- -
- Total length = 100 m;
- -
- Height of ridge = 6.5 m;
- -
- Gutter height = 4.5 m.
The model provides the presence of 48 lamps (single lamp 600 W) distributed at 4.5 m height every 2 m (along the horizontal).
The covering of the upper and lateral partitions of the greenhouse are mainly in glass, about 97.3% of the total surface, while the structural part is in steel. Table 1 reports the thermo-physical characteristics of materials that compose the envelope. From the point of view of the boundary condition, the presence of plants acts as an additional heat resistance.

Table 1.
Thermo-physical characteristics of materials that compose the envelope.
The analyzed solar greenhouse is used for chrysanthemum growth. The chrysanthemum requires specific hours of light and darkness to obtain different Types of color, shape and size throughout the year. To guarantee the growth of the flower, it is necessary to reach and maintain precise internal thermo-hygrometric conditions [32]:
- Air temperature (Optimal condition): 16–21 °C;
- Air Temperature (Limit condition): 10–27 °C;
- CO2 concentration (Optimal condition): 900–1400 ppm;
- Average level of CO2 concentration in the air (Standard condition): 300 ppm;
- Relative humidity (Optimal condition): 60–70%;
- Dark-Light Hours (Optimal condition): 9–15 h.
2.2. The Simulated Air Conditioning Systems
In order to guarantee well-being and a microclimate suitable for the physiology and growth of the plant, it is necessary to work with an air conditioning system. An adequate ventilation permits to ensure optimal values of temperature and humidity, avoiding the production of pathogens that can cause plant destruction. Typically, internal cooling is guaranteed by manually or automatically opening the windows of the greenhouse or using vents and recirculation fans.
This study proposes the comparison in terms of internal temperature between the use of only windows (W), the air conditioning by Controlled Mechanical Ventilation (CMV) and by Controlled Mechanical Ventilation coupled with Horizontal Earth-To-Air Heat Exchanger (EAHX). The combinations examined are listed in Table 2.
Table 2.
Combinations examined.
C.00-W is set up to ensure the natural mass air exchange inside the greenhouse through large external openings located at the bottom and top on each long side and on the roof of the solar greenhouse, covering about 3% of the entire envelope with dimensions equal to 0.125 × 100 m.
The large windows are open when the conditions of Equation (1) are satisfied:
where Ti is the internal air temperature of the greenhouse and Text is the external one.
In particular, the Boolean openings controller allows:
- -
- The natural cooling of the greenhouse, if the internal temperature (Ti) is higher than the limit and higher than the external one (Text);
- -
- The natural heating of the greenhouse, if the internal temperature (Ti) is below the limit and below the external temperature (Text).
Figure 2 shows the air volume changes per hour guaranteed by the automatic window openings (C.00-W) resulting from the Equation (1) and the fixed air volume changes per hour equal to 5 vol/h (C.01-CMV/EAHX), 10 vol/h (C.02-CMV/EAHX), 15 vol/h (C.03-CMV/EAHX) and 20 vol/h (C.04-CMV/EAHX) provided by the CMV and EAHX systems.
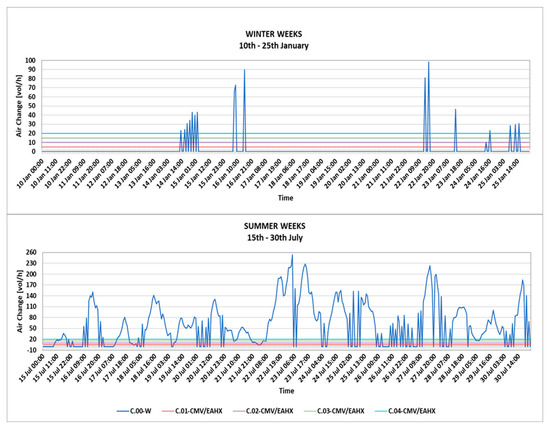
Figure 2.
Air volume changes per hour provided by the C.00-W, C.01-CMV/EAHX, C.02-CMV/EAHX, C.03-CMV/EAHX and C.04-CMV/EAHX.
The average annual value of air volume changes obtained for C.00-W is 22.2 vol/h. The air volume changes per hour for CMV and EAHX systems of 5 vol/h, 10 vol/h, 15 vol/h and 20 vol/h have been chosen to be as close as possible to the air volume changes annual average obtained with the automatic window opening system (C.00-W).
Combinations C.01/04-CMV represent the application of CMV for ventilation, renovating the air through the installation of electromechanical fans. As shown in the Section 2.3, this Type of application can be implemented by setting the desired number of air volume changes in the “Infiltration Type” Manager section of TRNBuild.
Combinations C.01/04-EAHX are characterized by the CMV coupled with EAHX. The underground horizontal pipes are placed exactly under the greenhouse and connected to it, as shown in Figure 3. This configuration allows a possible installation in series of greenhouses, each one with its own independent geothermal system.
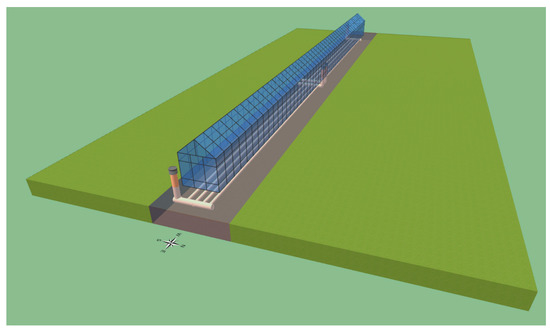
Figure 3.
EAHX applied to the solar greenhouse.
During the year, the temperature of the ground is almost constant with small and slow oscillations, as it is lower in summer and higher in winter than outside, thus, it is possible to use this difference to pre-cool the air in summer preheat in winter before reaching the inner space of the greenhouse.
The airflow of Combinations C.01/04-EAHX has been set to match air volume changes resulting from Combinations C.01/04-CMV. Therefore, the mechanical ventilation of the four Combinations C.01/04-EAHX has been reproduced coupling the geothermal system to the CMV.
The air flow rate for hour through the pipe is calculated as described in Equation (2):
where Q is the air flow rate, v is the fluid velocity and A is the pipe section area. The pipe section area is equal to:
where D is the pipe diameter equal to 0.566 m.
In Table 3, changing the number of air volume changes per hour, the air flow rate for each combination is shown and the respective speed of the air flowing in each pipe.
Table 3.
Air flow rate and air speed flowing in each pipe of the Combinations C.01/04-EAHX.
As the total number of EAHX pipes is equal to 8, it is verified that the above-mentioned air flow rates pass through each pipe at speeds not exceeding 5 m/s. The only exception is C.04-EAHX that exceeds the maximum speed allowed in the pipe (as it is greater than 5 m/s); consequently, it has been considered a limit case.
In TRNSYS the complete solar greenhouse has been modelled by entering the parameters shown in Table 4 regarding the properties of the pipes, air and ground.
Table 4.
Configuration parameters for EAHX simulations.
The length of the pipes has been simulated considering eight pipes with each one having a length of 50 m, positioned as shown in Figure 3.
2.3. Numerical Simulation
The greenhouse ventilation modelling was performed with TRaNsient SYstem Simulation Tool (TRNsys) [33]. It is a software designed for the analysis of complex systems capable of determining, with considerable detail, the transient performance of energy systems whose behavior varies over time. TRNsys software is characterized by an open modular structure and by a programming code. The simulation in TRNsys environment is realized through the connection of a series of Types, identified in an already existing library, within the Simulation Studio interface.
The model calculates the outputs in functions of the time, by specifying parameters, input data and time-dependent and independent values. The outputs obtained can be used as inputs for other components that contain a different mathematical model. The various Types must be connected to allow the execution of an ordered sequence of operations which depends on the Type of simulation to be performed. Once all the links have been created, the project can be simulated using the Run Simulation command to determine the results.
The solar greenhouse and geothermal system have been modeled in Trnsys and validated in previous studies. In particular, the complex aspect related to the modeling of the greenhouse was extensively investigated in [31] and the validation of the model was carried out through the comparison with the EnergyPlus software. The results of the validation show that, on a yearly basis, the average relative errors are 11.1%, while the standard deviations are almost identical for the two software. The validation of the geothermal system modeled in Trnsys was performed by comparison with real experimental data, showing a good agreement between simulated and monitored data [26].
Figure 4 shows the TRNsys scheme complete with all the Types used.
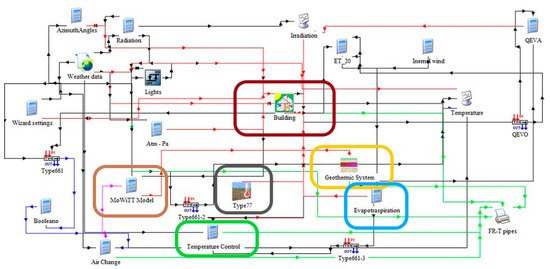
Figure 4.
TRNsys scheme.
The red block (Type 56) permits the definition of the dynamic model of the solar greenhouse. It is possible to define the 3structural data (material parameters and stratigraphy), inputs (climatic data), GAIN (presence of lamps, computer people, etc.) and system outputs. The implementation of the lamps with their exact three-dimensional (3D) position, distributed throughout the greenhouse, and the evapotranspiration of chrysanthemums makes the greenhouse modelling more detailed. The lamps are distributed at 4.5 m height every 2 m (along the horizontal).
The blue block represents the calculation of Evaporation according the Penman-Monteith’s formula. Evapotranspiration is a physical quantity used in agrometeorology, it consists of the quantity of water that passes from the ground to the air in the vapor state due to the combined effect of transpiration through plants and evaporation. The FAO Penman-Monteith equation implemented for hourly time steps is reported in Equation (4):
where:
- -
- Δ is the saturation slope vapor pressure curve at Thr [kPa/°C];
- -
- Thr is the mean hourly air temperature [°C];
- -
- γ is the psychrometric constant equal to 0.067 kPa/°C;
- -
- u2 is the constant average hourly wind speed inside the greenhouse equal to 0.34 m/s;
- -
- Rn is the net radiation at the glass surface [MJ/m2 h];
- -
- eo is the saturation vapor pressure at air temperature Thr [kPa]
- -
- ea is the average hourly actual vapor pressure [kPa]
- -
- G is the ground heat flux density [MJ/m2 h].
TRNsys allows implementing equations that manage the convective heat coefficient. This study provides the use of the formula of MoWiTT (Equation (5)) that best suits glass surfaces. In the brown block the equation has been added as an input in Type 56 for the management of the external convective coefficient:
where hc is the surface exterior convective heat transfer coefficient. The coefficient Ct (turbulent natural convection) is chosen equal to 0.84 W/(m2K4/3), the constants a equal to 3.26 W/(m2K(m/s)b) and b equal to 0.89. ΔT represents the difference between the external surface temperature and the internal temperature. Vz is the Local wind speed calculated at the height above ground of the central surface.
Type 15 has been used to generate the weather data. It starts from a meteorological data file .tm2 from Meteonorm and process it with a 1-h step for a total duration of 8760 h (one year). Type 15 calculates the total, diffuse sky radiation, solar radiation reflected from the ground, angle of incidence of direct solar radiation, inclination angle and azimuth for all surfaces that the user decides to define. To generate the fictive sky temperature, the Berdhal et al. model [34] has been used. To determine the global solar radiation on the greenhouse differently oriented and inclined surfaces, the Perez model [35] for the diffuse component has been selected; this model considers circumsolar radiation, horizon brightening and diffuse isotropic radiation. The Type includes the calculation of the water supply temperature and the real sky temperature for radiation calculations. It also returns several indicators, such as seasonal, monthly and annual maximum and minimum average heating and cooling.
The grey block shapes the vertical distribution of the ground temperature, using Type 77, it has been possible to model the ground. It uses the Kasuda et al. model [36] to detect the vertical distribution of ground temperature over time according to the average surface temperature of the ground in undisturbed conditions. The Kasuda equation results in a distribution of temperature with respect to time for different values of ground depth and for a given climate. The ground temperature at a specific depth, which can be considered undisturbed, is used as a boundary condition on the bottom side of the ground into the greenhouse.
The green block represents the thermostats, appropriately implemented to be turned on or off according to the temperature leaving the pipe with respect to the temperature range to be guaranteed. In winter, the thermostat is switched off if the temperature leaving the pipe is less than the lower limit of the range and, in summer, the thermostat is off if the temperature leaving the pipe is higher than the upper limit of the range.
The yellow block contains Type 952, which models a pipe buried into the ground surrounded by a 3D finite difference model to calculate the heat transfer through the ground using iterative method [36]. This subroutine uses as input data the inlet fluid temperature and the inlet fluid flow rate. The Type then generates in output the flow rate and the temperature of the fluid coming out of the horizontal underground pipe. These values are directly connected to the internal “ventilation Type” of Type 56 described above. An air flow inside the greenhouse is therefore generated.
Type 661 has been used to improve the entire simulation. Physical systems often have time delays, in order to have a simulation closer to reality, this Type allows a delay and significantly increases the stability of a control strategy. The time delay and the initial value for all desired inputs are considered among the parameters. The initial value of each input is maintained until the time step defined for the output is reached. At that point, the input value is released. In this study, a delay of 1 h has been considered. The connection of a series of Types has allowed to implement very complex and detailed simulations.
3. Simulations and Results
This section provides the results obtained from simulations of all combinations. Figure 5 and Figure 6 show the comparison of the internal air temperature between C.00-W and C.01/04-CMV (a) and C.00-W and C.01/04-EAHX (b), during the coldest and hottest two weeks of the year. The choice to plot two weeks was born from the need to make clear the reading of the graphs and, therefore, the two most critical weeks were chosen for the winter and the summer period.
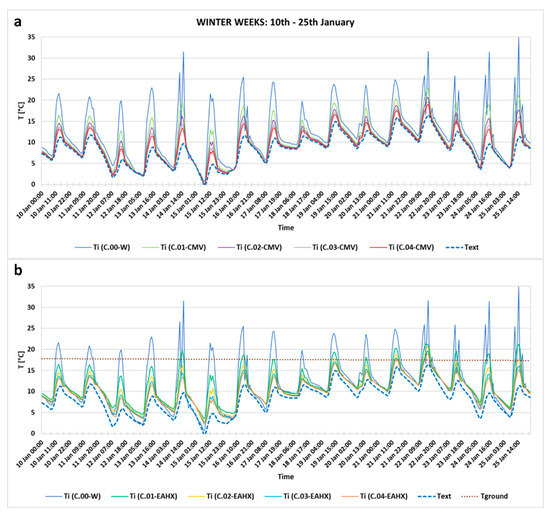
Figure 5.
Winter comparison of the internal air temperature between C.00-W and C.01/04-CMV (a) and C.00-W and C.01/04-EAHX (b): 10th–25th January.
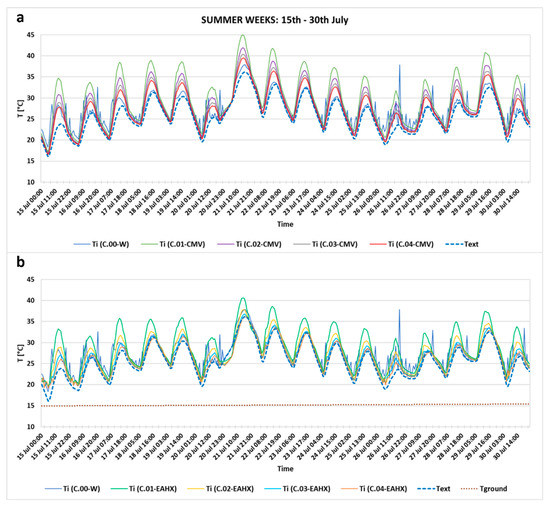
Figure 6.
Summer comparison of the internal air temperature between C.00-W and C.01/04-CMV (a) and C.00-W and C.01/04-EAHX (b): 15th–30th July.
Both figures illustrate the trend of the internal air temperature resulting from the CMV system C.01/04-CMV (case a) and from the EAHX system C.01/04-EAHX (case b). In addition, in Figure 5 and Figure 6, the external temperatures (Text) and ground temperatures (Tground) have been plotted. The ground temperature is at the burial depth and it is reported only for the graphs (b) with the EAHX system. All cases have been compared with the combination C.00-W, which provides the natural ventilation by the automatic window opening.
In Figure 5, it is evident that, in winter, the highest temperature is obtained by the automatic window opening (C.00-W), increasing the internal temperature up to 5 °C, but this result must not be misleading. Looking at Figure 2, it is evident that the air exchange is very often close to zero. This certainly allows to keep the temperature higher in winter but with the obvious disadvantage of not guaranteeing a correct oxygenation of the plants.
Although more moderate, both C.01/04-CMV and C.01/04-EAHX lead to a rise in temperature inside the greenhouse. In all cases, the C.01 with 5 vol/h shows highest values of temperatures, followed by C.02 (10 vol/h), C.03 (15 vol/h) and C.04 (20 vol/h), meaning that it is more convenient to have fewer air volume changes per hour. This occurs because more air volume changes per hour lead the temperature to get very close to the external temperature, worsening the winter behavior. From the comparison between the cases (a) and (b) the trends seem very similar but observing the curves it is possible to notice that the geothermal system tends to flatten the curve.
During the hottest weeks (Figure 6), it is interesting to note that the exploitation of the ground with the EAHX leads to a lowering of the internal air temperatures. For example, the temperature peak of 45 °C at 21th July is reduced by approximately 5 °C using the EAHX, compared with the CMV system. The automatic window opening (C.00-W) shows a fluctuating trend. In both cases (a) and (b), the best values of temperatures are reached by guaranteeing more air volume changes per hour. Between all combinations, in summer, it is preferable to use the EAHX guaranteeing more air volume changes per hour. The increase in the number of air volume changes in the CMV system results in a more pronounced temperature decrease than in the EAHX case.
Figure 7 and Figure 8 show the winter and summer comparison of the indoor air temperature between CMV and EAHX, with the same air volume changes per hour. In addition, the indoor air temperature of combination C.00-W, the external air and the ground temperature are shown. From Figure 7 in winter, it is evident that the use of EAHX leads to an increase in the internal air temperature of up to about 2 °C compared to the use of the CMV system. The good behavior is confirmed also in summer, where the lowering of the internal air temperature can be about 5 °C using EAHX, as shown in Figure 8. The C.00-W curve shows visible oscillations due to natural ventilation with automatic window opening. These oscillations are the result of very high and frequent air changes in summer, as also evidenced in Figure 2.
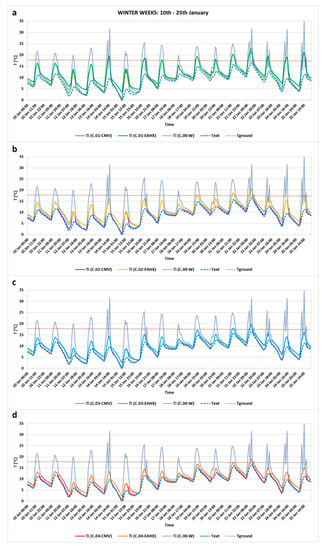
Figure 7.
Winter comparison of the internal air temperature between C.01-CMW and C01-EAHX (a), C.02-CMW and C02-EAHX (b), C.03-CMW and C03-EAHX (c) and C.04-CMW and C04-EAHX (d): 10th–25th January.
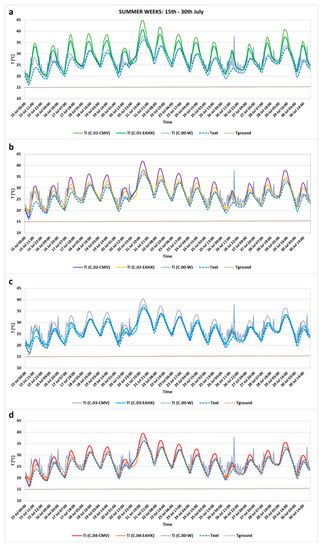
Figure 8.
Summer comparison of the internal air temperature between C.01-CMV and C.01-EAHX (a), C.02-CMV and C.02-EAHX (b), C.03-CMV and C.03-EAHX (c) and C.04-CMV and C04-EAHX (d): 15th–30th July.
A further analysis has been conducted for the coldest and highest days of the year, as reported in Figure 9 and Figure 10, respectively. In Figure 9 for winter, it is interesting to note that, although the EAHX is not the solution that raises the temperature the most during the day, its use allows to flatten the thermal wave more. In fact, the trend is almost constant during the day, raising the temperature during the first and last hours of the day, thanks to the rather constant temperature of the ground during the day. With fewer air volume changes per hour (C.01-EAHX), the EAHX system allows to reach the highest temperature peaks, while with more air volume changes per hour the flattening of the curve is more evident all day.
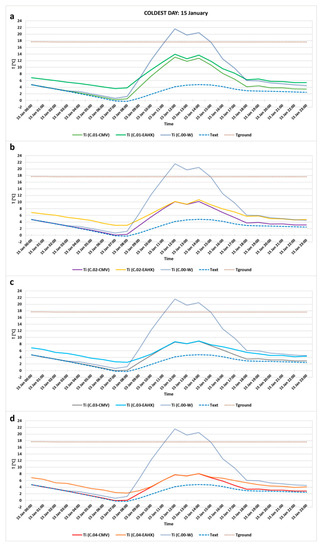
Figure 9.
Winter comparison of the internal air temperature between C.01-CMV and C.01-EAHX (a), C.02-CMV and C.02-EAHX (b), C.03-CMV and C.03-EAHX (c) and C.04-CMV and C.04-EAHX (d): 15th January.
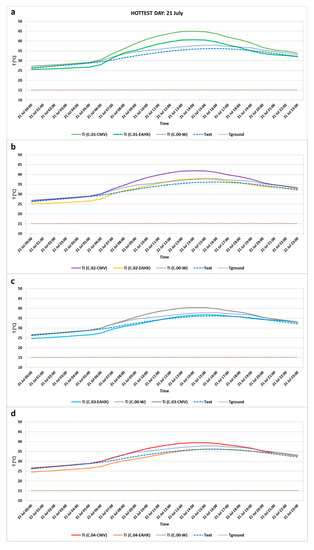
Figure 10.
Summer comparison of the internal air temperature between C.01-CMV and C.01-EAHX (a), C.02-CMV and C.02-EAHX (b), C.03-CMV and C.03-EAHX (c) and C.04-CMV and C04-EAHX (d): 21st July.
Figure 10 confirms that, in summer, it is more convenient to have more air volume changes per hour. The EAHX system tends to flatten the curve, thanks to the stability of the ground temperature. The EAHX works very well especially in the early hours of the day where it allows the temperature to drop below the external temperature. It is evident that the geothermal system has a very similar performance for all air volume changes per hour, which leads to the choice of a system with fewer air volume changes per hour, as it is also economically more advantageous.
The internal temperature range to be respected in the greenhouse for the growth and well-being of the plants is between 16 °C and 21 °C. Considering the optimal average temperature of 18 °C, the deviations in absolute value have been calculated to assess how much the internal temperatures, obtained from all combinations, deviate from the average temperature that should be guaranteed inside the greenhouse.
Then, it is assumed to have an air flow rate regulation system that allows to minimize the deviation from the average optimal value of 18 °C, choosing, continuously, the ideal air volume change.
A first simulation is made by discarding combinations with 20 air changes per hour, excluding C.04, to reduce energy consumption. Figure 11 shows, as a percentage, how many times the different hourly air exchange values have been used. In other words, for example, the percentage of 40.78% for (C.00-W) means that natural ventilation has been used for 3572 h (40.78% of 8760 h/year). Following this, combinations with 5 (C.01-EAHX) and 15 (C.03-EAHX) air volume changes per hour with the geothermal system are used, during the year, with percentages of 18.98 and 20.71, respectively. Analyzing Figure 11, the ventilation method that gives the smallest deviation from the temperature range 16–21 °C is C.00-W, as it covers 40.78% of the total hours of a year.
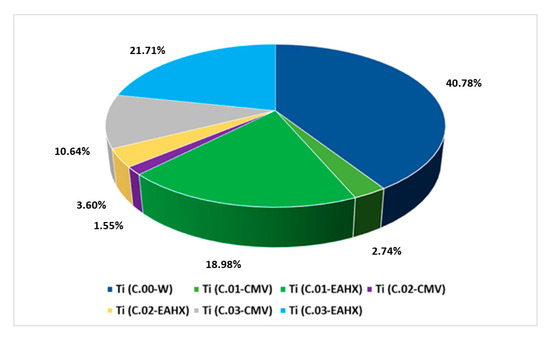
Figure 11.
Flow rate regulation system: percentage of use of the different hourly air volume changes during the year (excluding combinations C.04).
Similarly, Figure 12 shows the percentages of use of the different hourly air volume changes during the year, also considering the replacement capacity of 20 volume/hour (Combinations C.04).
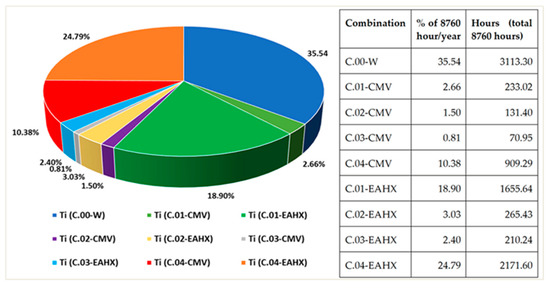
Figure 12.
Flow rate regulation system: percentage of use of the different hourly air volume changes during the year (including combinations C.04).
Figure 13 shows the percentages in which each combination complies with the imposed 16–21 °C temperature range, i.e., how many hours of the year the hourly temperature of each combination falls within the range. The total percentage of compliance with the internal temperature range is 36.64%, meaning that that range respected only for 3210 h out of 8760 of the year.
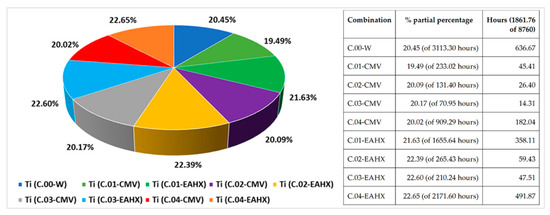
Figure 13.
Percentages in which each combination complies with the imposed 16–21 °C temperature range.
4. Conclusions
Greenhouses are becoming more widespread in the agricultural world, given the possibility of producing quality floral fruit and vegetables all year round, regardless of external weather conditions. Their operation often requires accurate control of the internal microclimate, ensuring optimal air exchanges per hour. Ventilation is one of the most important issues to be addressed to have a successful greenhouse. If there is not adequate ventilation, plant growth can be subject to problems, as ventilation ensures a supply of fresh air for photosynthesis and plant respiration. The consequence is a high demand for heating/cooling load, often satisfied with traditional, unsustainable fossil sources and a high rate of environmental pollution. In this direction, numerous experimental researches are being carried out to identify sustainable and renewable methods with minimal impact on the environment. A possible solution is the horizontal Earth-to-Air Heat Exchanger (EAHX), which uses the ground as a heat tank. The ground temperature is almost constant, with small and slow oscillations throughout the year, being lower than the outside temperature in summer and higher in winter.
This study focuses on the ventilation analysis of solar greenhouse with symmetrical flat pitched roof and single span located in Crotone, a city on the eastern side of Calabria (Italy) characterized by a warm temperate climate. This work proposes the dynamic analysis of the greenhouse modeled in TRNsys, considering simultaneously different thermal phenomena 3D shortwave and longwave radiative exchange, airflow exchanges, presence of lamps with their exact 3D position, ground and plant evapotranspiration and convective heat transfer coefficients. Several air conditioning systems were analyzed, automatic window opening, controlled mechanical ventilation systems (CMV) and horizontal Earth-to-Air Heat Exchanger (EAHX) coupled with CMV, for different air volume changes per hour.
In summer, the exploitation of the ground allows having excellent results with the EAHX system, reducing the temperature peaks of up to 5 °C compared to the use of CMV. The study shows that more air changes are needed in the summer. The increase in the number of air volume changes in the CMV system results in a more pronounced temperature decrease than in the EAHX case. The EAHX system tends to flatten the curve, thanks to the stability of the ground temperature. The EAHX works very well especially in the early hours of the day where it allows the temperature to drop below the external temperature. It is evident that the geothermal system has a very similar performance for all air volume changes per hour, which leads to the choice of a system with fewer air volume changes per hour as it is also economically more advantageous.
In winter, it is interesting to note that, although the EAHX is not the solution that raises the temperature the most during the day, its use allows flattening the thermal wave more. In fact, the trend is almost constant during the day, raising the temperature during the first and last hours of the day. With fewer air volume changes per hour (C.01-EAHX) the EAHX system allows to reach the highest temperature peaks, while with more air volume changes per hour the flattening of the curve is more evident all day. In winter it is preferable to have a system operating with few air changes per hour, in fact, the automatic opening system of the windows shows how the number of air changes must be very close to zero, but this involves little oxygenation of the plants. Therefore, analyzing the performance of CMV and EAHX, the best behavior is with 5 vol/h. This occurs because more air volume changes per hour lead the temperature to get very close to the external temperature, worsening the winter behavior. In winter the behavior of CMV and EAHX is very similar, but it is possible to notice that the geothermal system tends to flatten the curve.
One of the main problems to be avoided is the internal overheating that can occur in the summer season in the solar greenhouse; the EAHX system is an optimal solution as it permits to improve the internal condition of the greenhouse reducing the temperature peaks in summer and flattening the thermal wave both in summer and winter making the temperatures almost constant during the day.
Since the case study of this article focuses on the analysis of a single-span solar greenhouse, future development could be the modeling of a greenhouse consisting of several spans in series and comparing the resulting indoor temperature trends.
Moreover, the results obtained are strongly related to the temperate climate in which the greenhouse is located; the study can be extended to the analysis of the performances related to different climates and different materials composing the greenhouse.
Author Contributions
Conceptualization, C.B., D.M. and P.M.C.; Data curation, S.B., S.P., C.B., D.M., N.M. and P.M.C.; Formal analysis, C.B., D.M., P.M.C. and G.O.; Investigation, S.B., S.P., C.B., D.M., N.M. and P.M.C.; Methodology, S.B., S.P., C.B., D.M. and P.M.C.; Resources, S.P., D.M. and P.M.C.; Software, S.P., D.M. and N.M.; Supervision, S.B., C.B., P.M.C. and G.O.; Visualization, G.O.; Writing—original draft, S.B., C.B., P.M.C. and G.O.; Writing—review and editing, C.B., P.M.C. and G.O. All authors have read and agreed to the published version of the manuscript.
Funding
This research received no external funding.
Conflicts of Interest
The authors declare no conflict of interest.
Nomenclature
| Symbol | Title | Unit of Measure |
| A | Pipe section area | m2 |
| a | Constant | W/[m2K(m/s)b] |
| b | Constant | - |
| bool | Boolean parameter | - |
| c | Thermal Capacity | kJ/kgK |
| Ct | Turbulent natural convection constant | W/(m2K4/3) |
| D | Pipe diameter | m |
| ea | Average hourly actual vapor pressure | kPa |
| eo | Saturation vapor pressure at air temperature Thr | kPa |
| ET0 | Evapotranspiration | mm/h |
| G | Soil heat flux density | MJ/m2h |
| hc | External convective heat transfer coefficient | W/m2K |
| Q | Air flow rate for hour through the pipe | m3/h |
| R | Thermal resistance | hm2K/kJ |
| Rn | Net radiation at the grass surface | MJ/m2h |
| Text | External temperatures | °C |
| Tground | Ground temperatures | °C |
| Thr | Mean hourly temperature | °C |
| Ti | Internal Temperature | °C |
| U | Thermal Conductivity | W/mK |
| u2 | Average hourly wind speed | m/s |
| Vz | Wind speed at the height above ground | m/s |
| ν | Fluid velocity | m/s |
| Symbol | ||
| γ | Psychrometric constant | kPa/°C |
| Δ | Saturation slope vapor pressure curve at Thr | kPa/°C |
| ΔT | Difference between the external surface and air temperatures | °C |
| ρ | air density | kg/m3 |
References
- Valutazioni E Miglioramenti per L’Energia E Le Emissioni Di GAS a Effetto Serra a Livello Aziendale Nell’Unione Europea. Available online: https://agriadapt.eu/wp-content/uploads/download-manager-files/Manual_Italian.pdf (accessed on 29 May 2020).
- Taki, M.; Rohani, A.; Rahmati-Joneidabad, M. Solar thermal simulation and applications in greenhouse. Inf. Process. Agric. 2018, 5, 83–113. [Google Scholar] [CrossRef]
- Baglivo, C.; Congedo, P.M.; Di Cataldo, M.; Coluccia, L.D.; D’Agostino, D. Envelope design optimization by thermal modelling of a building in a warm climate. Energies 2017, 10, 1808. [Google Scholar] [CrossRef]
- Malvoni, M.; Baglivo, C.; Congedo, P.M.; Laforgia, D. CFD modeling to evaluate the thermal performances of window frames in accordance with the ISO 10077. Energy 2016, 111, 430–438. [Google Scholar] [CrossRef]
- Mobtaker, H.G.; Ajabshirchi, Y.; Ranjbar, S.F.; Matloobi, M. Simulation of thermal performance of solar greenhouse in north-west of Iran: An experimental validation. Renew. Energy 2019, 135, 88–97. [Google Scholar] [CrossRef]
- European Committee for Standardization. Standard UNE-EN 13031-1. In Greenhouses: Design and Construction, Part 1: Commercial Production Greenhouses; AENOR: Madrid, Spain, 2001. [Google Scholar]
- Bronchart, F.; De Paepe, M.; Dewulf, J.; Schrevens, E.; Demeyer, P. Thermodynamics of greenhouse systems for the northern latitudes: Analysis, evaluation and prospects for primary energy saving. J. Environ. Manag. 2013, 119, 121–133. [Google Scholar] [CrossRef] [PubMed]
- El-Maghlany, W.M.; Teamah, M.A.; Tanaka, H. Optimum design and orientation of the greenhouses for maximum capture of solar energy in North Tropical Region. Energy Convers. Manag. 2015, 105, 1096–1104. [Google Scholar] [CrossRef]
- Hassanien, R.H.E.; Li, M.; Lin, W.D. Advanced applications of solar energy in agricultural greenhouses. Renew. Sustain. Energy Rev. 2016, 54, 989–1001. [Google Scholar] [CrossRef]
- Mazzeo, D.; Baglivo, C.; Matera, N.; Congedo, P.M.; Oliveti, G. A novel energy-economic-environmental multi-criteria decision-making in the optimization of a hybrid renewable system. Sustain. Cities Soc. 2020, 52. [Google Scholar] [CrossRef]
- Mazzeo, D.; Oliveti, G.; Baglivo, C.; Congedo, P.M. Energy reliability-constrained method for the multi-objective optimization of a photovoltaic-wind hybrid system with battery storage. Energy 2018, 156, 688–708. [Google Scholar] [CrossRef]
- Ghosal, M.K.; Tiwari, G.N. Modeling and parametric studies for thermal performance of an earth to air heat exchanger integrated with a greenhouse. Energy Convers. Manag. 2006, 47, 1779–1798. [Google Scholar] [CrossRef]
- Baglivo, C.; D’Agostino, D.; Congedo, P.M. Design of a ventilation system coupled with a horizontal air-ground heat exchanger (HAGHE) for a residential building in a warm climate. Energies 2018, 11, 2122. [Google Scholar] [CrossRef]
- Congedo, P.M.; Lorusso, C.; Baglivo, C.; Milanese, M.; Raimondo, L. Experimental validation of horizontal air-ground heat exchangers (HAGHE) for ventilation systems. Geothermics 2019, 80, 78–85. [Google Scholar] [CrossRef]
- Benli, H. A performance comparison between a horizontal source and a vertical source heat pump systems for a greenhouse heating in the mild climate Elaziğ, Turkey. Appl. Therm. Eng. 2013, 50, 197–206. [Google Scholar] [CrossRef]
- Benli, H.; Durmus, A. Evaluation of ground-source heat pump combined latent heat storage system performance in greenhouse heating. Energy Build. 2009, 41, 220–228. [Google Scholar] [CrossRef]
- Mugnozza, G.S.; Pascuzzi, S.; Anifantis, A.; Verdiani, G. Use of low-enthalpy geothermal resources for greenhouse heating: An experimental study. Acta Sci. Pol. Tech. Agrar. 2012, 11, 13–19. [Google Scholar]
- Wu, H.; Wang, S.; Zhu, D. Modelling and evaluation of cooling capacity of earth–air–pipe systems. Energy Convers. Manag. 2007, 48, 1462–1471. [Google Scholar] [CrossRef]
- Santamouris, M.; Mihalakakou, G.; Balaras, C.; Argiriou, A.; Asimakopoulos, D.; Vallindras, M. Use of buried pipes for energy conservation in cooling of agricultural greenhouses. Sol. Energy 1995, 55, 111–124. [Google Scholar] [CrossRef]
- Santamouris, M.; Mihalakakou, G.; Balaras, C.A.; Lewis, J.; Vallindras, M.; Argiriou, A.A. Energy conservation in greenhouses with buried pipes. Energy 1996, 21, 353–360. [Google Scholar] [CrossRef]
- Mongkon, S.; Thepa, S.; Namprakai, P.; Pratinthong, N. Cooling performance assessment of horizontal earth tube system and effect on planting in tropical greenhouse. Energy Convers. Manag. 2014, 78, 225–236. [Google Scholar] [CrossRef]
- Ozgener, L.; Ozgener, O. An experimental study of the exergetic performance of an underground air tunnel system for greenhouse cooling. Renew. Energy 2010, 35, 2804–2811. [Google Scholar] [CrossRef]
- Tzaferis, A.; Liparakis, D.; Santamouris, M.; Argiriou, A.A. Analysis of the accuracy and sensitivity of eight models to predict the performance of earth-to-air heat exchangers. Energy Build. 1992, 18, 35–43. [Google Scholar] [CrossRef]
- Argiriou, A. Ground cooling. In Passive Cooling of Buildings; Santamouris, M., Asimakopoulos, D., Eds.; Earthscan: New York, NY, USA, 2013; pp. 360–403. [Google Scholar]
- Aye, L.; Fuller, R.; Canal, A. Evaluation of a heat pump system for greenhouse heating. Int. J. Therm. Sci. 2010, 49, 202–208. [Google Scholar] [CrossRef]
- Congedo, P.M.; Baglivo, C.; Bonuso, S.; D’Agostino, D. Numerical and experimental analysis of the energy performance of an air-source heat pump (ASHP) coupled with a horizontal earth-to-air heat exchanger (EAHX) in different climates. Geothermics 2020, 87, 101845. [Google Scholar] [CrossRef]
- Baglivo, C.; Bonuso, S.; Congedo, P.M. Performance Analysis of Air Cooled Heat Pump Coupled with Horizontal Air Ground Heat Exchanger in the Mediterranean Climate. Energies 2018, 11, 2704. [Google Scholar] [CrossRef]
- Reichrath, S.; Davies, T.W. Computational fluid dynamics simulations and validation of the pressure distribution on the roof of a commercial multi-span venlo-Type glasshouse. J. Wind. Eng. Ind. Aerodyn. 2002, 90, 139–149. [Google Scholar] [CrossRef]
- Tabella Dei Gradi/Giorno Dei Comuni Italiani Raggruppati per Regione E Provincia Estratta (Allegato A) D.P.R. 26 Agosto 1993 No. 450 Consolidato 2018. Available online: https://www.certifico.com/impianti/documenti-impianti/337-documenti-impianti-riservati/7099-zone-climatiche-tabella-a-aggiornata-d-p-r-412-1993 (accessed on 1 June 2020).
- Kottek, M.; Grieser, J.; Beck, C.; Rudolf, B.; Rubel, F. World map of the Köppen-Geiger climate classification updated. Meteorologische Zeitschrift 2006, 15, 259–263. [Google Scholar] [CrossRef]
- Baglivo, C.; Mazzeo, D.; Panico, S.; Bonuso, S.; Matera, N.; Congedo, P.M.; Oliveti, G. Complete greenhouse dynamic simulation tool to assess the crop thermal well-being and energy needs. Appl. Therm. Eng. 2020, 115698. [Google Scholar] [CrossRef]
- Guida Operativa: L’ottenimento Dei Certificati Bianchi”, La Scheda 40E:i Sistemi Serra Ai Sensi Del Decreto Del Ministero Sviluppo Economico 28 December 2010, art.15 Comma 2. Available online: https://www.enea.it/it/seguici/pubblicazioni/pdf-volumi/V2014CertificatiBianchi.pdf (accessed on 3 June 2020).
- Bradley, D.; Kummert, M. New evolutions in TRNSYS—A selection of version 16 features. In Proceedings of the Ninth International IBPSA Conference, Montréal, QC, Canada, 15–18 August 2005; pp. 107–114. [Google Scholar]
- Martin, M.; Berdahl, P. Characteristics of infrared sky radiation in the United States. Sol. Energy 1984, 33, 321–336. [Google Scholar] [CrossRef]
- Perez, R.; Stewart, R.; Seals, R.; Guertin, T. The Development and Verification of the Perez Diffuse Radiation Model. Sandia Report SAND88-7030. 1988. Available online: https://pdfs.semanticscholar.org/2132/4d502d248d9a415447a7a1abc3536e163d90.pdf (accessed on 16 April 2020).
- Kasuda, T.; Archenbach, P.R. Earth Temperature and Thermal Diffusivity at Selected Stations in the United States. ASHRAE Trans. 1965, 71. [Google Scholar] [CrossRef]


© 2020 by the authors. Licensee MDPI, Basel, Switzerland. This article is an open access article distributed under the terms and conditions of the Creative Commons Attribution (CC BY) license (http://creativecommons.org/licenses/by/4.0/).