Abstract
The detection, mitigation, and classification of power quality (PQ) disturbances have been issues of interest in the power system field. This paper proposes an approach to detect and classify various types of PQ disturbances based on the Stockwell transform (ST) and decision tree (DT) methods. At first, the ST is developed based on the moving, localizing, and scalable Gaussian window to detect five statistical features of PQ disturbances such as the high frequency of oscillatory transient, distinction between stationary and non-stationary, the voltage amplitude oscillation around an average value, the existence of harmonics in a disturbance signal, and the root mean square voltage at the internal period of sag, swell or interruption. Then, these features are classified into nine types, such as normal, sag, swell, interruption, harmonic, flicker, oscillatory transient, harmonic voltage sag, and harmonic voltage swell by using the DT algorithm that is based on a set of rules with the structure “if…then’’. This proposed study is simulated using MATLAB simulation. The IEEE 13-bus system, the recorded real data based on PQube, and the experiment based on the laboratory environment are applied to verify the effectiveness.
1. Introduction
Power quality (PQ) is a significant issue that has become increasingly important to both electric power utilities and their customers because of financial losses caused by insufficient PQ [1]. PQ disturbance issues and the resulting problems are the consequences of using light flickers in the 1930s; air conditioners in the 1950s; sensitive electronics, computers, power electronics and microelectronics in the 1990s; and nowadays, based on the modern power electronics industry, connecting the distributed generation based on energy sources, controlling heavy non-linear loads, and using the rectifies and inverters in the industrial plant [2]. The Electric Power Research Institute (EPRI) carried out a study in the year 2001 on 24 utilities throughout the United States (US) about the occurring PQ disturbance levels in which they found 46% of power sag; 5% of frequency variations, flicker, noise, and harmonics, respectively; 7% of over voltage and under voltage, respectively; and 10% of swell and spikes, respectively [3]. A report from the Consortium for Electric Infrastructure to Support a Digital Society (CIEDS) shows that the US economy has lost from $15 billion to $24 billion every year due to PQ disturbances [4]. According to [5], almost all the PQ disturbances occur 70% of the time because of the customer and 30% because of the network side, in which the industrial devices are dominant, such as 43% of computers and microprocessor-based devices, 13% of variable speed drives, 8% of lighting equipment, 5% of motors, 1% of relays, and 30% of other equipment.
In order to extract and classify the distinctive features of PQ disturbances in the power system, various signal processing techniques have been introduced such as the Fourier transform (FT) [6,7], the short-time FT (STFT) [8,9], the fast Fourier transform (FFT) [10], and the discrete Fourier transform (DFT) [11,12]. However, the FT is not enough for extracting the feature because of the transient natures of most of the PQ disturbances where time information is necessary [13] and it is not effective when the signal exists as short-term transient disturbances [14]. The DFT method is a frequency domain technique that estimates the individual harmonic components, and does not provide time domain information for non-stationary PQ disturbances signals. The FFT is a method used to obtain harmonic information about the monitored signals. However, this method is not suitable for detecting short or transient spikes. The STFT is an improvement of FT to overcome the DFT disadvantages. However, its disadvantage is that the size of the window is fixed for all frequencies, so there is a low resolution for high frequencies and unsuitability is found for the analysis of the non-stationary and transient PQ disturbances [15].
In order to overcome the limitation of the methods based on the FT technique, some of the promissory methods have been proposed for detecting and classifying various types of PQ disturbances based on the wavelet transform (WT) method [16,17,18,19,20]. The WT window size varies according to the signal frequency which can apply short windows at high frequencies and long windows at low frequencies, respectively. Thus, it allows for better time and frequency resolution for the processing of non-stationary signals. The extended versions of WT are the discrete wavelet transform (DWT) [21,22] and continuous wavelet transform (CWT) [23]. However, the disadvantages of WT are its degraded performance under the noisy condition and the selection of mother wavelet and the level of decomposition, which have to be properly based on disturbances [24].
The Stockwell transform (ST) method was developed in [25] and the decision tree (DT) method was developed in 1980 and introduced for application in the field of the power system in 1989 by Breimain and Wehenkel, respectively [26]. They are two productive methods and can be used to solve the detection and classification of PQ disturbances in the power system. The ST performs a multi-resolution analysis of a time-varying signal when the absolute phase of each frequency is retained and uses the window width to vary inversely with frequency. Thus, it can provide a time-frequency representation by a frequency-dependent resolution and produce high time and frequency resolutions at high and low frequencies, respectively [27]. In particular, the authors in [28] proposed ST to analyze PQ disturbances. In addition, ST has the ability to detect different PQ disturbances like voltage sag, voltage swell, and voltage interruption. Thanks to this new way, these PQ disturbances can easily classify when they were compounded with other methods. DT performs a binary tree to reveal the hidden relationship between inputs and outputs following the classification in the tree from the root node down to a leaf node, and the leaf node especially contains the response.
In recent years, a number of other theories have been proven effective for detecting and classifying PQ disturbances in power systems introduced as combination methods of DWT and two types of machine learning-based algorithms [29], an improved method from the iterative adaptive kernel regression method [30], a method based on multi-resolution ST and DT [31], and the method based on image enhancement techniques and feature selection [32].
Based on these facts, this paper proposes a combination algorithm between ST and DT methods for solving the detection and classification of PQ disturbances in the power system under the consideration. Firstly, the ST method is used to detect five statistical features such as the high frequency of oscillatory transient, the distinction between stationary and non-stationary, the voltage amplitude oscillation around an average value, the existence of harmonics in disturbance signal, and the root mean square voltage at the internal period of sag, swell or interruption of the input PQ disturbance signals. Secondly, the DT algorithm that is based on the set of rules with the structure “if…then’’ is used to classify these features into nine various PQ disturbance types such as normal, sag, swell, interruption, harmonic, flicker, oscillatory transient, harmonic voltage sag, and swell voltage well. The proposed method is varied based on PQ disturbance signals by using a mathematical model to evaluate the efficiency of classification. The IEEE 13-bus distribution test feeder, the recorded real data based on PQube, and the experiment based on the laboratory environment are carried out to analyze the efficiency of this study. The proposed method features the following advantages:
- It is a combination of ST and DT methods for accurately detecting and classifying nine stationary and non-stationary PQ disturbances
- It responds to the automatic PQ disturbance classification in real-time analysis
The rest of this paper is organized as follows: Section 2 covers the ST method while Section 3 covers the DT method. Section 4 provides the proposed algorithm for detecting and classifying PQ disturbances. A case study, simulation results, and discussion of the results are handled in Section 5. Finally, conclusions are reported in Section 6.
2. Stockwell Transform Method
The Stockwell transform (ST) method was proposed by Stockwell in 1996 [25] and is a powerful mathematic method for applying the time-frequency multi-resolution analysis. In this paper, the ST method is used as an extension of the WT method based on a moving and scalable localized Gaussian window. The ST is calculated by moving the window function down the signal in time across a range of frequencies and can be defined as [25,33]
where τ is the shift parameter for adjusting the position in the time axis, x(t) is the input signal, and g(f,t) is the Gaussian window function and its width is determined by the examined frequency and can be given as follows
in which σ(f) is the width of the Gaussian window. Similar to a wavelet, its value is inversely proportional to frequency f and can be defined as
in Equation (3), a and b are fixed read numbers and b ≠ 0.
Substituting Equations (2) and (3) into (1) and setting a is equal to zero, the ST can be rewritten as [23,34].
The ST also can be written as operations on the Fourier spectrum X(f) of Y(t) as
where α is the Fourier transform pair of t. Using the discrete Fourier transformation and inverse discrete Fourier transformation, the ST of discrete-time series x[n] can be represented as
where l, m, k = 0, 1, 2, …, N−1; with N is the total number of sampling points and when k is equal to zero, we have
and G[k,m] the Gaussian function is derived from the DFT of the Gaussian window function w(f,t), and can be considered as follows:
The output of the ST is a complex matrix of the size k × n size called S-matrix, in which the rows express the time-domain distribution of the signal in the particular frequency and the columns express the frequency amplitude characteristics. Each element of the S-matrix is complexly valued. The ST-amplitude (STA) matrix used to analyze PQ disturbances is obtained as
3. Decision Tree Method
Data classification is the process of controlling the uniformities in a dataset and classifying them into distinctive classes. Recently, DT is one of the most numerously used classification methods. The DT method was developed in 1980 and introduced for applying the field of the power system in 1989 by Breimain and Wehenkel, respectively [26]. There are many DT algorithms such as ID3, CART, C4.5, C5.0, SPRINT, etc. Moreover, the Neyman-Pearson and Bayesian approaches are also used to classify five features, which extracted from ST. The Bayesian-based approach is considered in this study.
Assuming that there are classes (Cl) of disturbances C0, C1, C2, …, CCl−1, in which Cl is forewarned. Each datum is extracted that records to the feature vector with M-dimensional x = [x1 x2 … xM]T and besides it assumes that the probability distribution of x for each class is estimated.
Let Cl hypotheses be {Hi, i = 0, 1,..., Cl−1} and the ith hypotheses Hi denote that a given feature vector x belongs to the class Ci, we have
The classification problem under the framework of hypothesis testing given a feature vector x can be regarded as deciding the best Hj among the Cl possible hypotheses {Hi, i = 0, 1,…, Cl−1} under a preselected criterion. If the probability of x being in each class is known, Equation (10) can also be written under the following form
where p(x; Ci) is the probability of x being in class Ci.
It assumes that the conditional probability density functions {p(x|Ci), i = 0, 1, … Cl−1} is forewarned and the prior probabilities of all classes are equal P(Ci) = P(Cj), the feature vector x in Equation (11) can be expressed as follows:
Under using the Bayesian approach to be the minimum of the overall risk by combining the prior knowledge of each class, the corresponding multiple hypotheses H = {H0,…, HCl−1} are defined as follows
in which P(x|Ci) is the posterior probability of x in class Ci. The risk for a given feature vector x when deciding Hi is
here, λij is the cost, that incurred for deciding Hi when x actually belongs to Cj. When λij − λjj is always positive for i ≠ j, the overall risk can be obtained as follows
Therefore, the Bayes decision rule is to minimize Equation (15) that is equivalent to choose the hypothesis Hj as follows
4. Detection and Classification Features of the PQ Disturbances
4.1. PQ Disturbances Analysis Using ST
In order to detect and classify various PQ disturbances, the signals of PQ disturbances types, including normal voltage, voltage sag, voltage swell, interruption, flicker, oscillatory transient, harmonic, harmonic voltage sag, and harmonic voltage swell are analyzed based on the STA matrix. These disturbance signals were generated in MATLAB based on the mathematical relations introduced in [35] so that to describe the real-time data. They are decomposed using multi-resolution based ST to obtain the STA matrix with the frequency of 50 Hz, 15 cycles corresponding with total 960 points and the sampling frequency of 3.2 kHz corresponding to 64 points/cycle. In this paper, the main plots of nine types can be extracted by using the STA matrix and can be detailed as follows.
(i) Time maximum amplitude (TvA) is a maximum amplitude versus time, searching columns of STA matrix at every frequency, and can be obtained as
(ii) Time amplitude of maximum frequency (TvHFA) is the last row of STA matrix.
(iii) Frequency maximum amplitude (FvA) is a maximum amplitude versus frequency, searching rows of STA matrix at every time and can be obtained as
where STA’ is the transpose matrix of STA.
Therefore, the obtained results are used as the input signals of the proposed detection and classification system.
4.2. Features Extraction
The performance of PQ disturbance classification depends on their features. The statistics of features of PQ disturbances are extracted from the proposed ST labeled as F1, F2,…, and F5 and can be defined as follows:
Feature-1 (F1): This presents the existence of the high-frequency component of the oscillatory transient. For the three-phase power system, the most common harmonics are the 5, 7, and 11th harmonics and the oscillatory transient mainly includes the high-frequency components. Accordingly, F1 is used to classify the oscillatory transient with other disturbances. If there is a peak in the proximity of the high frequency (fn ≥ 650 Hz) on FvA plots, then F1 = 1, otherwise F1 = 0.
Feature-2 (F2): This distinguishes between stationary and non-stationary signals. If the number of peaks on TvHFA plots is greater than or equal to 2, then F2 = 1, and if there is no peak, then F2 = 0. Thus, if F2 = 0, then the signal is the stationary signal as the normal, harmonic, and flicker. If F2 = 1 then signal is the non-stationary signal as the sag, swell, interruption, harmonic voltage sag, harmonic voltage swell, and oscillatory transient. Moreover, F2 is used to identify the start time ts (s) or ks (sample) and the end time te (s) or ke (sample) which corresponds to the peaks on TvHFA plots of non-stationary signals.
Feature-3 (F3): This presents the voltage amplitude oscillation around the average value. F3 is determined on TvA plots as follows
where mean(.) expresses the mean value of the argument and root(.) expresses the number of roots of the argument. From TvA plots, numzeros is greater than 2 for the flicker signal and numzeros is smaller than 2 for the other disturbances. Therefore, F3 is used to distinguish the flicker signal from the other ones, if numzeros > 3 the F3 = 1, else F3 = 0.
Feature-4 (F4): This presents the existence of harmonics in the disturbance signal. F4 is determined by using FvA plot and the total harmonic distortion (THDV) factor can be defined as:
where V1 is corresponding to the fundamental frequency amplitude of 50 Hz, N is the number of points in the DFT. F4 is identified as the following rule, if THDV ≤ 0.05 then F4 = 0, otherwise F4 = 1. So F4 = 1 if the signal is the voltage harmonic, harmonic voltage sag, or harmonic voltage swell, F4 = 0 for other signals.
Feature-5 (F5): This is the root mean square (RMS) of the signal at the time that is the internal period of voltage sag, swell, or interruption. F5 is defined by using the half-cycle RMS method at the time ki of sampling signal, and F5 is calculated as follows
in which the half-cycle RMS at the sample time ki of sampling signal can be calculated as follows
and the sample time ki obtains from between ks and ke of the non-stationary signal as follows
where round(.) is the nearest integer of the argument.
Using F5 to distinguish between with/without voltage sag, swell and interruption signals through rules if 0.1 ≤ F5 ≤ 0.9 then the signal is the sag signal; if 1.1 ≤ F5 ≤ 1.8 then the signal is the swell signal; otherwise if F5 ≤ 0.1 then the signal is the interruption signal.
The proposed ST algorithm is described in Figure 1.
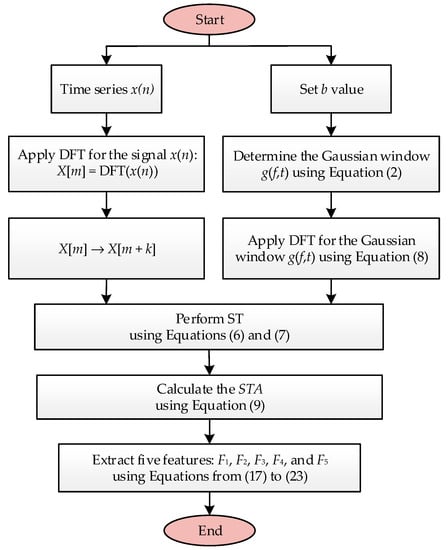
Figure 1.
The proposed Stockwell transform (ST) algorithm.
4.3. PQ Disturbances Analysis
Case 1: The pure sine voltage waveform and related STA are shown in Figure 2. The amplitude 1 pu of frequency appears as shown in Figure 2d; it is the frequency of 50 Hz. Observing Figure 2a–c shows that the related plots of the pure since voltage obtained based on STA with constant amplitudes. Therefore, in this case, it is considered as a reference signal for detecting and classifying various PQ disturbances.

Figure 2.
Pure sine voltage and related ST amplitude (STA): (a) Sine voltage; (b) time maximum amplitude (TvA); (c) time amplitude of maximum frequency (TvHFA); (d) frequency maximum amplitude (FvA).
Case 2: The first disturbance is the voltage sag, in the present study, Figure 3 depicts the voltage sag of 20% and various plots related to STA. It can easily detect due to the decrease in the value 0.8 pu of the amplitude of TvA as shown in Figure 3b. It is clear from Figure 3c that the value of the amplitude of TvHFA appears abruptly two times and it can effectively be utilized to localize the beginning and ending of voltage sag (0.0775 s to 0.2334 s, respectively). This is the same as in the case of pure sine voltage, the amplitude 1.0 pu of frequency appears as shown in Figure 3d; it is the frequency of 50 Hz.
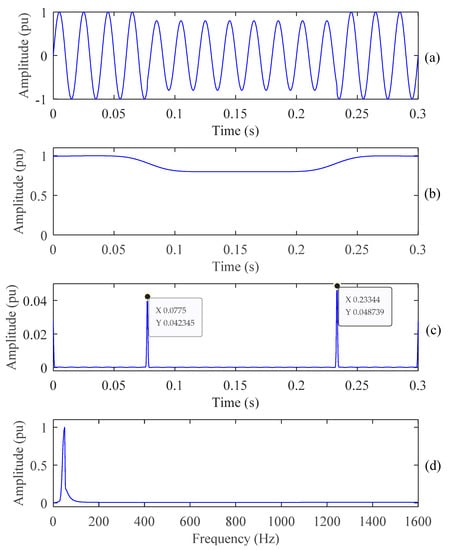
Figure 3.
Voltage sag and related STA: (a) Voltage sag; (b) TvA; (c) TvHFA; (d) FvA.
Case 3: The second disturbance is the voltage interruption, in this case, the voltage interruption of 5% and related STA plots are depicted in Figure 4. This voltage interruption disturbance can be approved from the change in the amplitude of TvA and TvHFA as shown in Figure 4b,c respectively. It is clear from Figure 4c that the amplitude of TvHFA value appears abruptly two times and it can effectively be utilized to localize the beginning and ending of voltage sag (0.06906 s to 0.18219 s, respectively).
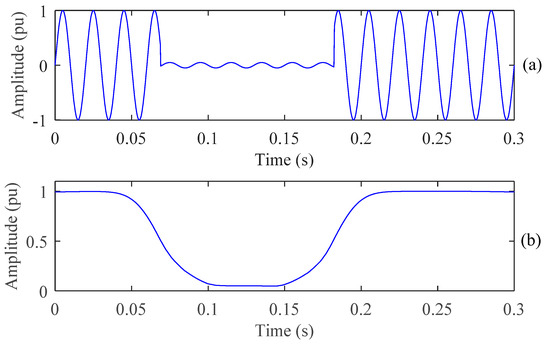
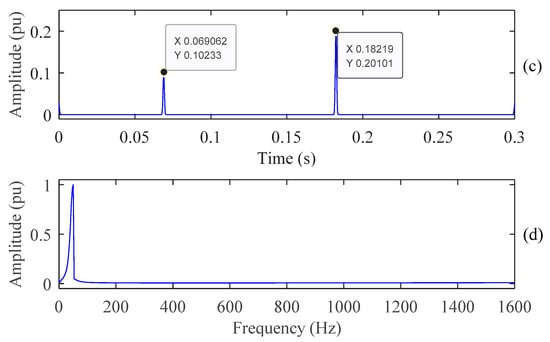
Figure 4.
Voltage interruption and related STA: (a) Voltage interruption; (b) TvA; (c) TvHFA; (d) FvA.
Case 4: The third disturbance is the voltage swell, in this case, the voltage swell of 30% and related STA plots are depicted in Figure 5. This voltage swell disturbance can be approved from the change in the amplitude of TvA and TvHFA as shown in Figure 5b,c respectively. It is clear from Figure 5c that the value of TvHFA amplitude appears abruptly two times and it can effectively be utilized to localize the beginning and ending of voltage sag (0.06594 s to 0.19062 s, respectively).
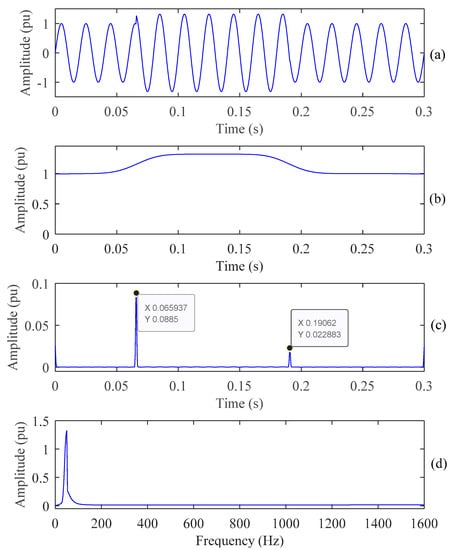
Figure 5.
Voltage swell and related STA: (a) Voltage swell; (b) TvA; (c) TvHFA; (d) FvA.
Case 5: The fourth disturbance is the harmonic; in this case, the harmonic and related STA plots are depicted in Figure 6. It can be observed from continuous ripples in the amplitude of TvA and TvHFA as shown in Figure 6b,c respectively. It is clear from Figure 6d that the amplitude of FvA value appears the high-level frequency and it can effectively be utilized to detect the harmonic.

Figure 6.
Harmonic and related STA: (a) Harmonic; (b) TvA; (c) TvHFA; (d) FvA.
Case 6: The fifth disturbance is the oscillatory transient; in this case, the oscillatory transient and related STA plots are depicted in Figure 7. It can be observed from continuous ripples in the amplitude of TvA as shown in Figure 7b. In Figure 7c, the amplitude of TvHFA value appears as an oscillatory transient and in Figure 7d, the amplitude of FvA value appears as the high-level frequency, besides the frequency of 50 Hz. Therefore, the presence of oscillatory transient can be observed by significant changes in TvHFA and FvA and that is also the basis for utilization to detect the oscillatory transient voltage signal.

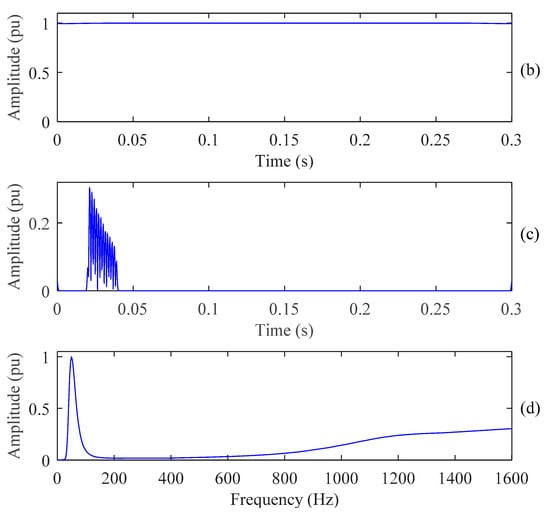
Figure 7.
Oscillatory transient and related STA: (a) Voltage transient; (b) TvA; (c) TvHFA; (d) FvA.
Case 7: The sixth disturbance is chosen to be the flicker; in this case, the flicker and related STA plots are illustrated in Figure 8. The presence of flicker be observed by a series of circles in TvA and that is the basic to be utilized to detect the flicker voltage signal.
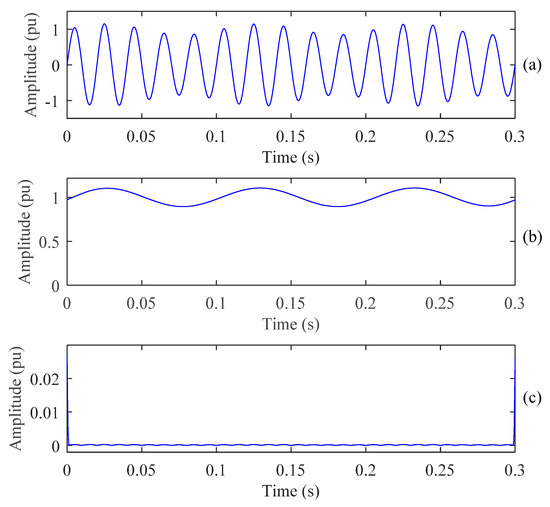

Figure 8.
Flicker and related STA: (a) Voltage flicker; (b) TvA; (c) TvHFA; (d) FvA.
Case 8: The sixth disturbance is both the voltage sag and harmonic, in the present study, Figure 9 depicts the voltage sag of 50% and various plots related to STA. It is clear from Figure 9c that the value of the amplitude of TvHFA appears abruptly two times and from Figure 9d that the amplitude of FvA value appears the high-level frequency, besides the frequency of 50 Hz. Therefore, it can effectively be utilized to localize the beginning and ending of both the voltage sag 50% and the harmonic (0.06875 s to 0.16375 s) and it can effectively be utilized to detect this disturbance.
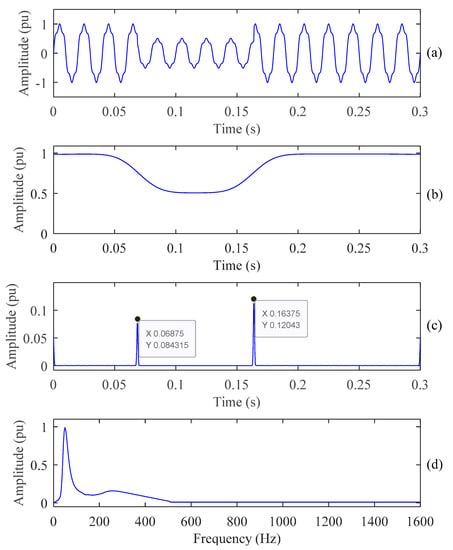
Figure 9.
Harmonic voltage sag and related STA: (a) Voltage waveform; (b) TvA; (c) TvHFA; (d) FvA.
Case 9: The eighth disturbance is both the voltage swell and harmonic, in the present study, Figure 10 depicts a voltage sag of 65% with harmonic and various plots related to STA. The presence of this case is the value of the amplitude of TvHFA and FvA as shown in Figure 10c,d.

Figure 10.
Harmonic voltage swell and related STA: (a) Waveform; (b) TvA; (c) TvHFA; (d) FvA.
4.4. Proposed Method
The proposed algorithm for detecting and classifying features of the PQ disturbances as shown in Figure 11, in which Figure 1 is the proposed ST algorithm and the rest of part is the proposed DT algorithm detailed as follows.
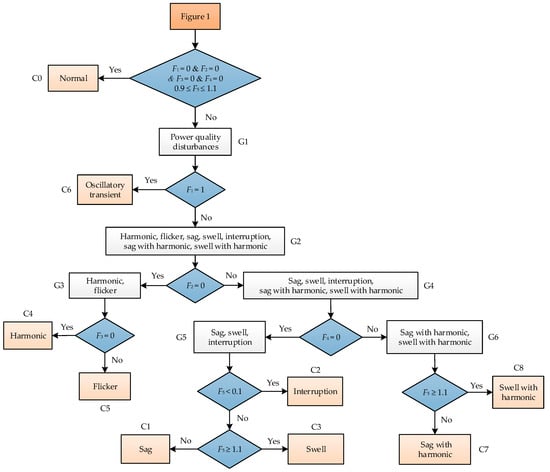
Figure 11.
The proposed algorithm for detecting and classifying power quality (PQ) disturbances.
This algorithm is proposed based on the features F1 to F5. These features are extracted using the proposed ST algorithm to make the rules for classifying into nine voltage disturbances.
The pure sine voltage (C0) will have the values F1 = 0, F2 = 0, F3 = 0, F4 = 0, and 0.9 ≤ F5 ≤ 1.1, whereas signals are classified under group G1 called the PQ disturbances (C1 to C8). The signals classified under group G1 are further classified into subgroup G2 and the oscillatory transient based on F1. The oscillatory transient voltage (C6) will have the values F1 = 1, whereas signals are classified under group G2 called the PQ disturbances (C2 to C8).
The signals classified under group G2 are further classified into subgroup G3 (C4 and C5) and G4 (C1, C2, C3, C7, C8) based on F2. The group G3 contains the signals with F2 = 0, whereas the signals with other values of F1 are classified under group G4.
The two signals under group G3 are further classified based on the value of F3. The harmonic (C4) will have F3 = 0, whereas the Flicker (C5) will have other values of F3.
The signals classified under group G4 are further classified into subgroup G5 (C1, C2, and C3) and G6 (C7, C8) based on F4. The group G5 contains the signals with F4 = 0, whereas the signals with other values of F4 are classified under group G6.
The two signals under group G5 are further classified based on the value of F5. The interruption (C2) will have F5 < 0.1, whereas the signals with F5 ≥ 0.1 are classified under group G7. The two signals under group G7 are further classified based on the value of F5. The swell (C3) will have F5 ≥ 1.1, whereas the sag (C1) will have F5 < 1.1.
According to the above description and the PQ disturbances definition, the feature values of nine types of PQ disturbances are shown in Table 1, which can be the rules of identifying and classifying PQ disturbance types.

Table 1.
PQ disturbance values.
5. Tests and Discussion
5.1. Performance Evaluation
In order to evaluate the performance of the proposed method, Matlab/Simulink software is used to generate nine hundred disturbance waveforms (that means in this study 100 waveforms from each type of disturbances are generate) of PQ disturbances with different parameters such as magnitude percentages, durations and instants on waveform according to the signal models in [36]. Then the ST is used to extract the five features given in Figure 1 are calculated. These features, which include F1, F2, F3, F4, and F5 are the input vector of the DT. Finally, the DT structure is shown in Figure 11 is used to classify the various types of PQ disturbances. The performance results of the proposed method are given in Table 2.

Table 2.
Classification results of PQ disturbances.
As shown in Table 2, the ST based DT method which is proposed in this paper has the classification result with high accuracy (99.78%). From Table 2, although the average accuracy is high, but there are also some mistakes in the classification of the voltage interruption signals (98%) because the magnitude percentages of interruption and sag signals are sometimes similar.
As an obtained result, it is shown that the classification accuracy when using the proposed method (99.78%) is higher than when using the Stockwell transform and probabilistic neural network (ST-PNN) method (93.3%) [37]; wavelet packet transform and support vector machine (WPT-SVM) method (98.3%) [38]; wavelet transform, article swarm optimization, and extreme learning machine (WT-PSO-ELM) method [39] (97.6%); wavelet transform and hidden markov model (WT-HMM) method (99.46%) [40]; and ST-based Fuzzy (more than 98%) [13].
5.2. Test the PQ Disturbance on Standard IEEE Network
In this section, the IEEE 13-bus test feeder is carried out to test the PQ events as shown in Figure 12 [41]. The test is found similar to the actual power distribution system. This system consists of 50 Hz, 5 MVA two voltage levels of 4.16 kV and 0.48 kV with balanced and unbalanced loads. The load and line parameters of the test system are presented in [41]. The monitor (M) is placed at the bus node 634 to record PQ disturbance types and it placed as shown in Figure 12. These PQ disturbances involve the voltage sag and interruption created by the short circuit fault, the voltage swell created by the switching-off load, the oscillatory transient created by switching on the capacitor, and the harmonics created by the non-linear power electronic converters. In this study, in order to test the proposed method for identifying and classifying PQ disturbance types, it can simulate the following some case studies.
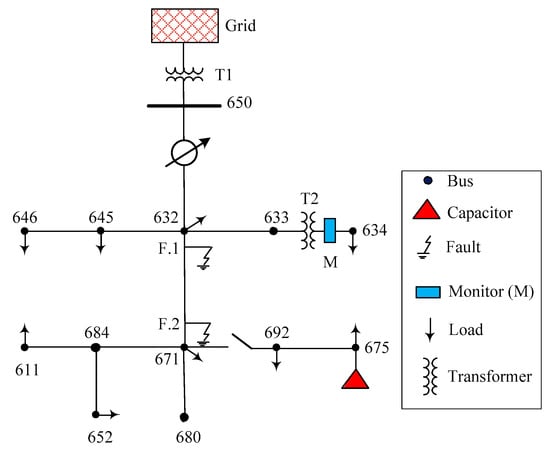
Figure 12.
The tested IEEE 13-bus system [41].
Test 1: The phase A to ground fault occurs at F.1 and F.2 in the line between bus nodes 632 and 671 at 0.7 s and it is cleared after 0.16 s by opening the faulted line. Figure 13 and Figure 14 plot the PQ events at bus node 634 that the system is bearing disturbance when the fault occurs at F.2 and F.1, respectively.

Figure 13.
Related STA plots of PQ event when phase A to ground fault occurs at F.2: (a) TvA; (b) TvHFA; (c) FvA.

Figure 14.
Related STA plots of PQ event when phase A to ground fault occurs at F.1: (a) TvA; (b) TvHFA; (c) FvA.
Observing the related STA plots at bus node 634 from Figure 13 and comparing with Figure 2, it can conclude that when phase A to ground fault occurs at F.2 the system is bearing a disturbance that is the voltage sag and the amplitude obtained based on monitor M having 0.423 pu as shown in Figure 15.

Figure 15.
Voltage sag when phase A to ground fault occurs at F.2.
And observing the related STA plots at bus node 634 from Figure 14 and comparing with Figure 4, it can conclude that when phase A to ground fault occurs at F.1 the system is bearing a disturbance that is the voltage interruption and the amplitude obtained based on monitor M having 0.02142 pu as shown in Figure 16.

Figure 16.
The voltage sag when phase A to ground fault occurs at F.1.
Test 2: Figure 17 plots the PQ event at bus node 634 that the system is bearing disturbance when the three-phase voltage increases from the grid. Observing the related STA plots at bus node 634 from this figure and comparing ones with Figure 5. It can conclude that when the three-phase voltage increases from the grid, the system is bearing a disturbance that is the voltage swell and the amplitude obtained based on monitor M before and after increasing the three-phase voltage 0.943 pu and 1.18 pu respectively as shown in Figure 18.
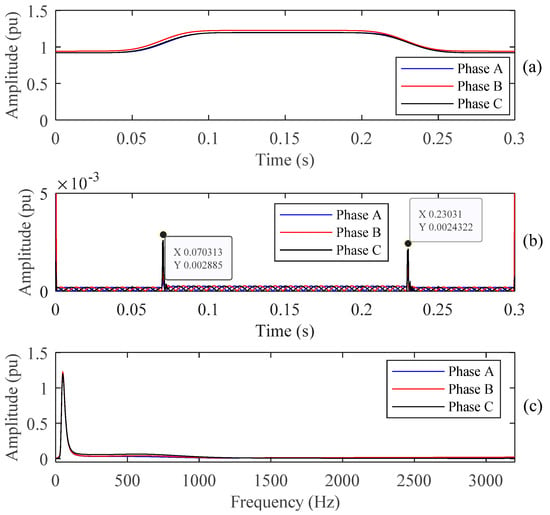
Figure 17.
Related STA plots of PQ event at bus node 634 when the three-phase voltage increases from the grid: (a) TvA; (b) TvHFA; (c) FvA.
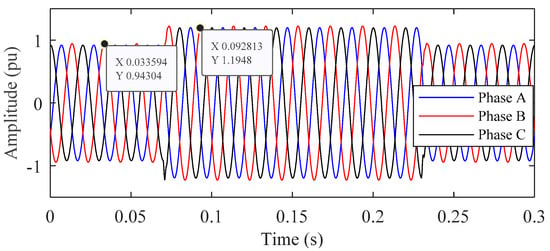
Figure 18.
The voltage swell when the three-phase voltage increases from the grid.
Test 3: We assume that the bank of the capacitor at bus node 675 switches on at 0.07 s. Figure 19 plots the related STA plots at bus node 634. Observing this figure and comparing one with Figure 6, we can conclude that when the bank of the capacitor at bus node 675 switches on, the system bears a disturbance that is the voltage harmonic and the disturbance obtained based on monitor M as shown in Figure 20.

Figure 19.
Related STA plots of PQ event at bus node 634 that the bank of the capacitor at bus node 675 switches on: (a) TvA; (b) TvHFA; (c) FvA.
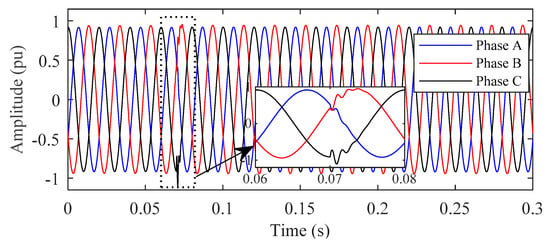
Figure 20.
The oscillatory transient when the bank of the capacitor at bus node 675 switches on.
Based on the above analysis results of the PQ events generated using the IEEE 13-bus system, the proposed combination of the ST and DT method is a highly accurate approach for PQ detection and classification.
5.3. Test the PQ Disturbance on Recorded Real Data of PQube
In this test case, the PQ disturbances are used for analysis based on the recorded real data of PQube 3 equipment. This equipment is a compact instrument, and is simply the best power monitor and real-time sensor. It is made based on IEC 61000-4-30 standard and used to record all types of AC power disturbance including 4 MHz sampling of impulses. Presently, PQube 3 equipment is installed in different positions around the world to record PQ Events. The main purpose is free to study the PQ [42,43]. Figure 21 shows a view of the PQube 3 equipment installed at some locations in Europe [44].

Figure 21.
A cloud-based map of PQubes installed some locations in Europe [44].
The PQube with ID P007629 installed at a location in the University of Strathclyde, England was chosen to analyze this test case. This located position has line-to-line and phase-to-neutral voltages of 400 V and 231 V, respectively, and the sampling frequency is set at the value of 128 samples per cycle corresponding to a sampling time of 156.426 microseconds. This section considers two following test cases.
Test 4: We consider the event that snapshotted on 29 June 2020 (15:00:00.010 UTC), and the the line-to-line and phase-to-neutral voltages snapshotted through PQube under the RMS voltage profiles and the voltage waveforms as shown in Figure 22. To apply the proposed method, all data of the event, in this case, are recorded under the “.csv” file considered as the input signal for the proposed DT algorithm. The analyzed result is shown in Figure 23. Observing this figure, the related plots are pure since the voltage is obtained to be constant amplitudes. Therefore, it can determine the PQ disturbance event, namely the pure sine voltage (class C0).
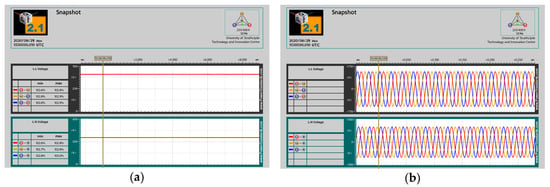
Figure 22.
An actual voltage snapshot recorded by PQube at the University of Strathclyde on 29 June 2020 [45]: (a) the RMS voltage profiles; (b) the voltage waveforms.


Figure 23.
An actual voltage snapshot recorded by PQube at the University of Strathclyde on 29 June 2020 [45] and related STA: (a) three-phase voltage; (b) TvA; (c) TvHFA; (d) FvA.
Test 5: Considering the event that is the voltage sag on 27 June 2020 (04:59:51.987 UTC). The voltage sag occurs at 04:59:51.987 and it is cleared after 0.051 s. The voltage sag magnitude is 12.9% of the norm voltage. For this event, the line-to-line and phase-to-neutral voltages are snapshotted through PQube as shown in Figure 24. The same is true of Test 4, all data of the event, in this case, are recorded under the “.csv” file considered as the input signal for the proposed DT algorithm. Figure 25 depicts the voltage sag and various plots related to STA. It can easily detect due to the decrease in the value 0.9 pu of the amplitude of TvA as shown in Figure 25b. It is clear from Figure 3c that the value of the amplitude of TvHFA appears abruptly two times. This is the same as in the case of pure sine voltage, the amplitude 1.0 pu of frequency appears as shown in Figure 3d; it is the frequency of 50 Hz. Therefore, it can determine the PQ disturbance event namely the voltage sag (class C1).
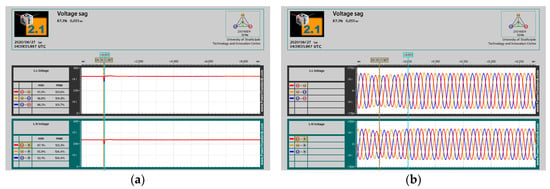
Figure 24.
An actual voltage sag recorded by PQube at the University of Strathclyde on 27 June 2020 [46]: (a) the root mean square (RMS) voltage profiles; (b) the voltage waveforms.
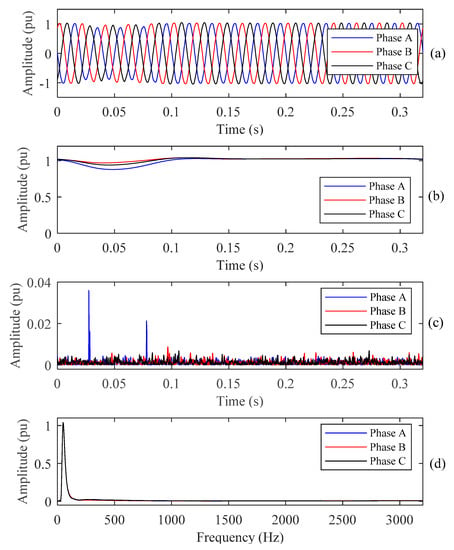
Figure 25.
An actual voltage sag recorded by PQube at the University of Strathclyde on 27 June 2020 [46] and related STA: (a) Voltage sag; (b) TvA; (c) TvHFA; (d) FvA.
5.4. Test PQ Disturbance in Laboratory Environment
To verify the effectiveness of the proposed method, a test PQ disturbance in the laboratory environment is applied. Figure 26a shows a tested circuit installed in the laboratory, in which the Fluke 435 series II is used to analyze PQ, the 400 V, 50 Hz AC three-phase voltage source is used as a supply source, and the fault creator is used to create faults. Figure 26b shows an event that captures from Fluke 435 series II when a three-phase voltage sag 40% occurs and it is cleared after 200 ms. All data of the event are recorded to be considered as the input signal for the proposed DT algorithm. This section considers two following test cases.

Figure 26.
The test system for acquiring PQ disturbance data: (a) testbench in the laboratory; (b) an actual sag voltage event recorded by Fluke 435 series II on 2 July 2020.
Test 6: The sixth test is considered for a two-phase voltage sag 40% at 100 ms and it is cleared after 200 ms. The data of the event are recorded as shown in Figure 27a. Figure 27b–d shows the related STA. observing this figure that for this test is the same Test 1 and Case 2. Therefore, it can determine the PQ disturbance event namely the voltage sag (class C1).

Figure 27.
The processing results for the two-phase voltage sag data recorded by Fluke 435 at the laboratory on 2 July 2020: (a) actual voltage waveform; (b) TvA; (c) TvHFA; (d) FvA.
Test 7: The seventh test is considered for a single-phase voltage interruption at 100 ms and it is cleared after 300 ms. The data of the event are recorded as shown in Figure 28a. Figure 28b–d shows the related STA. observing this figure that for this test is the same Test 1 and Case 3. Therefore, it can determine the PQ disturbance event, namely the voltage sag (class C2).
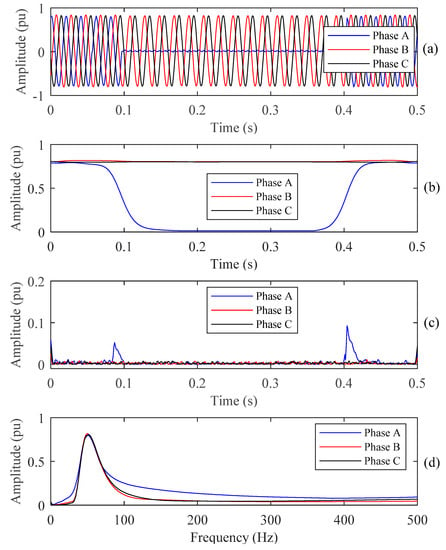
Figure 28.
The processing results for the single-phase voltage interruption data recorded by Fluke 435 at the laboratory on 2 July 2020: (a) actual voltage waveform; (b) TvA; (c) TvHFA; (d) FvA.
6. Conclusions
An approach based on the combination of ST and DT methods for detecting and classifying power quality (PQ) disturbances was presented in this research work. The signals of PQ disturbance types like the normal voltage, voltage sag, voltage swell, interruption, flicker, oscillatory transient, harmonic, harmonic voltage sag, and harmonic voltage swell were generated in MATLAB based on the mathematical relations under analysis of the real-time data. These signals are decomposed using multi-resolution-based proposed ST through the STA matrix with a frequency of 50 Hz, 15 cycles corresponding with total 960 points, and a sampling frequency of 3.2 kHz corresponding to 64 points/cycle to obtain five features (F1, …F5). The PQ disturbances are detected based on the time maximum amplitude, the time amplitude of maximum frequency, and the frequency maximum amplitude of the STA matrix. The proposed DT method is used to classify PQ disturbances based on five features to nine voltage disturbances.
The effectiveness of the proposed method is verified on the IEEE 13-bus system, the recorded real data based on PQube, and the experiment based on the laboratory environment. The obtained results show that the proposed algorithm accurately detects and classifies nine stationary and non-stationary PQ disturbances with an accuracy as high as 99.78% and responds to the automatic PQ disturbance classification in real-time analysis.
Author Contributions
Conceptualization, L.V.D.; methodology, N.M.K.; software and experiment, N.M.K. and L.V.D.; validation, L.V.D.; formal analysis, N.M.K.; investigation, L.V.D.; resources, N.M.K.; data curation, L.V.D.; writing—original draft preparation, N.M.K.; writing—review and editing, L.V.D.; visualization, N.M.K.; supervision, L.V.D. All authors have read and agreed to the published version of the manuscript.
Funding
This research received no external funding.
Acknowledgments
This work was supported by the project B2020-DQN-02 sponsored by the Ministry of Education and Training, Vietnam.
Conflicts of Interest
The authors declare no conflict of interest.
References
- Liao, H.; Milanović, J.V. On capability of different FACTS devices to mitigate a range of power quality phenomena. IET Gen. Trans. Distr. 2017, 11, 1202–1211. [Google Scholar] [CrossRef]
- Saini, K.M.; Beniwal, R.K. Detection and classification of power quality disturbances in wind-grid integrated system using fast time-time transform and small residual-extreme learning machine. Int. Trans. Electr. Energy Syst. 2018, 28, 2519. [Google Scholar] [CrossRef]
- Jones, G.A.; Layer, D.H.; Osenkowsky, T.G. National Association of Broadcasters Engineering Handbook: NAB Engineering Handbook; Taylor & Francis: New York, NY, USA, 2013. [Google Scholar]
- Wang, M.; Rowe, G.I.; Mamishev, A.V. Classification of power quality events using optimal time-frequency representations—Part 2: Application. IEEE Trans. Power Del. 2004, 19, 1496–1503. [Google Scholar] [CrossRef]
- Bhattacharyya, S.; Cobben, S. Consequences of poor power quality—An overview. In Power Quality; Intech Open: Rijeka, Croatia, 2011. [Google Scholar]
- IEEE. IEEE Standard Definitions for the Measurement of Electric Power Quantities under Sinusoidal, Nonsinusoidal, Balanced, or Unbalanced Conditions; IEEE Std.1459-2010; IEEE Standards: Piscataway, NJ, USA, 2010; pp. 1–50. [Google Scholar]
- Hooshmand, R.A.; Enshaee, A. Detection and classification of single and combined power quality disturbances using fuzzy systems oriented by particle swarm optimization algorithm. Electr. Power Syst. Res. 2010, 80, 1552–1561. [Google Scholar] [CrossRef]
- Gu, Y.H.; Bellon, M.H.J. Time-frequency and time-scale domain analysis of voltage disturbances. IEEE Trans. Power Del. 2000, 15, 1279–1284. [Google Scholar] [CrossRef]
- Jaramillo, S.H.; Heydt, G.T.; O’Neill-Carrillo, E. Power quality indices for aperiodic voltages and currents. IEEE Trans. Power Del. 2000, 15, 784–790. [Google Scholar] [CrossRef]
- Heydt, G.; Fjeld, P.S.; Liu, C.C.; Pierce, D.; Tu, L.; Hensley, G. Applications of the windowed FFT to electric power quality assessment. IEEE Trans. Power Del. 1999, 14, 1411–1416. [Google Scholar] [CrossRef]
- Barros, J.; Diego, R.I. Application of the wavelet-packet transform to the estimation of harmonic groups in current and voltage waveforms. IEEE Trans. Power Del. 2006, 21, 533–535. [Google Scholar] [CrossRef]
- Zhang, M.; Li, K.; Hu, Y. A real-time classification method of power quality disturbances. Electr. Power Syst. Res. 2011, 81, 660–666. [Google Scholar] [CrossRef]
- Chilukuri, M.V.; Dash, P.K. Multiresolution S-Transform-Based Fuzzy Recognition System for Power Quality Events. IEEE Trans. Power Del. 2004, 19, 323–330. [Google Scholar] [CrossRef]
- Axelberg, P.G.V.; Gu, I.Y.; Bollen, M.H.J. Support Vector Machine for classification of voltage disturbances. IEEE Trans. Power Del. 2007, 22, 1297–1303. [Google Scholar] [CrossRef]
- Dash, P.K.; Panigrahi, B.K.; Sahoo, P.K.; Panda, G. Power quality disturbance data compression, detection and classification using integrated spline wavelet and S-transform. IEEE Trans. Power Del. 2003, 18, 595–600. [Google Scholar] [CrossRef]
- Uyara, M.; Yildirima, S.; Gencoglub, M.T. An effective wavelet-based feature extraction method for classification of power quality disturbance signals. Electr. Power Syst. Res. 2008, 78, 1747–1755. [Google Scholar] [CrossRef]
- Lin, W.M.; Wu, C.H.; Lin, C.H.; Chen, F.S. Detection and classification of multiple power-quality disturbances with wavelet multiclass SVM. IEEE Trans. Power Del. 2008, 23, 2575–2582. [Google Scholar] [CrossRef]
- Poisson, O.; Rioual, P.; Meunier, M. Detection and measurement of power quality disturbances using wavelet transform. IEEE Trans. Power Del. 2000, 15, 1039–1044. [Google Scholar] [CrossRef]
- Masoum, M.; Jamali, S.; Ghaffarzadeh, N. Detection and classification of power quality disturbances using discrete wavelet transform and wavelet networks. IET Sci. Meas. Technol. 2010, 4, 193–205. [Google Scholar] [CrossRef]
- Khokhar, S.; Mohd Zin, A.A.; Mokhtar, A.S.; Zareen, N. Automatic pattern recognition of single and multiple power quality disturbances. Aust. J. Electr. Electron. Eng. 2016, 13, 43–53. [Google Scholar] [CrossRef]
- Decanini, J.G.M.S.; Tonelli-Neto, M.S.; Malange, F.C.V.; Minussi, C.R. Detection and classification of voltage disturbances using a Fuzzy-ARTMAP-wavelet network. Electr. Power Syst. Res. 2011, 81, 2057–2065. [Google Scholar] [CrossRef]
- Gaouda, A.M.; Salama, M.M.A.; Sultan, M.R.; Chikhani, A.Y. Power quality detection and classification using wavelet-multiresolution signal decomposition. IEEE Trans. Power Del. 1999, 14, 1469–1476. [Google Scholar] [CrossRef]
- Reddy, M.J.B.; Mohanta, D.K.; Sagar, K. A Multifunctional Real-Time Power Quality Monitoring System Using Stockwell Transform. IET Sci. Meas. Technol. 2014, 8, 155–169. [Google Scholar] [CrossRef]
- Granados-Lieberman, D.; Romero-Troncoso, R.J.; Osornio-Rios, R.A.; Garcia-Perez, A.; Cabal-Yepez, E. Techniques and methodologies for power quality analysis and disturbances classification in power systems: A review. IET Gener. Transm. Distrib. 2011, 5, 519–529. [Google Scholar] [CrossRef]
- Stockwell, R.G.; Mansinha, L.; Lowe, R.P. Localization of the complex spectrum: The S transform. IEEE Trans. Signal. Process. 1996, 44, 998–1001. [Google Scholar] [CrossRef]
- Chen, Y.L.; Hu, H.W.; Tang, K. Constructing a decision tree from data with hierarchical class labels. Expert Syst. Appl. 2009, 36, 4838–4847. [Google Scholar] [CrossRef]
- Ray, P.; Kishor, N.; Mohanty, S. Islanding and power quality disturbance detection in grid-connected hybrid power system using wavelet and S-transform. IEEE Trans. Smart Grid 2012, 3, 1082–1094. [Google Scholar] [CrossRef]
- Dash, P.K.; Panigrahi, B.K.; Panda, G. Power quality analysis using S-Transform. IEEE Trans. Power Del. 2003, 18, 406–411. [Google Scholar] [CrossRef]
- Parvez, I.; Aghili, M.; Sarwat, A.I.; Rahman, S.; Fahmida, A. Online power quality disturbance detection by support vector machine in smart meter. J. Mod. Power Syst. Clean Energy 2019, 7, 1328–1339. [Google Scholar] [CrossRef]
- Yan, W.; Qunzhan, L.I.; Fulin, Z. Transient power quality disturbance denoising and detection based on improved iterative adaptive kernel regression. J. Mod. Power Syst. Clean Energy 2019, 7, 644–657. [Google Scholar]
- Zhong, T.; Zhang, S.; Cai, G.; Li, Y.; Yang, B.; Chen, Y. Power Quality Disturbance Recognition Based on Multiresolution S-Transform and Decision Tree. IEEE Access 2019, 7, 88380–88392. [Google Scholar] [CrossRef]
- Lin, L.; Wang, D.; Zhao, S.; Chen, L.; Huang, N. Power quality disturbance feature selection and pattern recognition based on image enhancement techniques. IEEE Access 2019, 7, 67889–67904. [Google Scholar] [CrossRef]
- Biswal, M.; Dash, P.K. Detection and characterization of multiple power quality disturbances with a fast S-transform and decision tree based classifier. Digit. Signal. Proc. 2013, 23, 1071–1083. [Google Scholar] [CrossRef]
- Gargoom, A.M.; Ertugrul, N.; Soong, W.L. Automatic classification and characterization of power quality events. IEEE Trans. Power Del. 2008, 23, 2417–2425. [Google Scholar] [CrossRef]
- Tan, R.H.; Ramachandaramurthy, V.K. Numerical model framework of power quality events. Eur. J. Sci. Res. 2010, 43, 30–47. [Google Scholar]
- Uyar, M.; Yildirim, S.; Gencoglu, M.T. An expert system based on S-transform and neural network for automatic classification of power quality disturbances. Expert Syst. Appl. 2009, 36, 5962–5975. [Google Scholar] [CrossRef]
- Mishra, S.; Bhende, C.N.; Panigrahi, B.K. Detection and classification of power quality disturbances using S-transform and probabilistic neural network. IEEE Trans. Power Del. 2007, 23, 280–287. [Google Scholar] [CrossRef]
- Manimala, K.; Selvi, K.; Ahila, R. Optimization techniques for improving power quality data mining using wavelet packet based support vector machine. Neurocomputing 2012, 77, 36–47. [Google Scholar] [CrossRef]
- Ahila, R.; Sadasivam, V.; Manimala, K. An integrated PSO for parameter determination and feature selection of ELM and its application in classification of power system disturbances. Appl. Soft Comput. 2015, 32, 23–37. [Google Scholar] [CrossRef]
- Dehghani, H.; Vahidi, B.; Naghizadeh, R.A.; Hosseinian, S.H. Power quality disturbance classification using a statistical and wavelet-based Hidden Markov Model with Dempster–Shafer algorithm. Int. J. Electr. Power Energy Syst. 2013, 47, 368–377. [Google Scholar] [CrossRef]
- Kersting, W.H. Radial distribution test feeders. In Proceedings of the 2001 IEEE Power Engineering Society Winter Meeting, Columbus, OH, USA, 28 January–1 February 2001. [Google Scholar]
- Christe, A.; Negrashov, S.; Johnson, P. Open Power Quality: An open source framework for power quality collection, analysis, visualization, and privacy. In Proceedings of the 2016 IEEE Power & Energy Society Innovative Smart Grid Technologies Conference (ISGT), Minneapolis, MN, USA, 6–9 September 2016. [Google Scholar]
- Rönnberg, S.; Gil de Castro, A.; Espin Delgado, A. Variations in Supraharmonic Levels in Low Voltage Networks. In Proceedings of the 25th International Conference on Electricity Distribution, Madrid, Spain, 3–6 June 2019. [Google Scholar]
- Available online: http://map.pqube.com (accessed on 30 June 2020).
- Available online: http://map.pqube.com/glasgow/2020/Month%2006/Day%2029/T%2015-00-00-010%20Snapshot/FilesList.htm (accessed on 30 June 2020).
- Available online: http://map.pqube.com/glasgow/2020/Month%2006/Day%2027/T%2004-59-51-987%20Voltage%20Sag/FilesList.htm (accessed on 30 June 2020).
© 2020 by the authors. Licensee MDPI, Basel, Switzerland. This article is an open access article distributed under the terms and conditions of the Creative Commons Attribution (CC BY) license (http://creativecommons.org/licenses/by/4.0/).