Article

Performance Enhancement of Nitrogen Dual Expander and Single Mixed Refrigerant LNG Processes Using Jaya Optimization Approach

1
School of Energy & Environmental Engineering, University of Science & Technology Beijing, Beijing 100083, China
2
School of Chemical Engineering, Yeungnam University, Gyeongsan 712-749, Korea
3
Department of Computer Science, COMSATS University Islamabad (CUI), Lahore Campus 54000, Pakistan
4
Department of Mechanical Mechatronics & Manufacturing Engineering, University of Engineering & Technology, New Campus, Lahore 54890, Pakistan
*
Authors to whom correspondence should be addressed.
These authors contributed equally.
Energies 2020, 13(12), 3278; https://doi.org/10.3390/en13123278
Submission received: 16 April 2020 / Revised: 12 June 2020 / Accepted: 15 June 2020 / Published: 25 June 2020
(This article belongs to the Special Issue Exergy Analysis and Optimization of Energy Systems and Processes)

Abstract

:
The nitrogen (N2) expander and single mixed refrigerant (SMR) liquefaction processes are recognized as the most favorable options to produce liquefied natural gas (LNG) at small-scale and offshore sites. These processes have a simple and compact design that make them efficient with respect to their capital costs. Nevertheless, huge operating costs, mainly due to their lower energy efficiency, remains an ongoing issue. Utilization of design variables having non-optimal values is the primary cause for the lower energy efficiency; which, in turn, leads to exergy destruction (i.e., entropy generation), and ultimately the overall energy consumption is increased. The optimal execution of the design variables of LNG processes can be obtained through effective design optimization. However, the complex and highly non-linear interactions between design variables (refrigerant flowrates and operating pressures) and objective function (overall energy consumption) make the design optimization a difficult and challenging task. In this context, this study examines a new optimization algorithm, named “Jaya”, to reduce the operating costs of nitrogen dual expander and SMR LNG processes. The Jaya approach is an algorithm-specific parameter-less optimization methodology. It was found that by using the Jaya algorithm, the energy efficiency of the SMR process and nitrogen dual expander natural gas (NG) liquefaction process can be enhanced up to 14.3% and 11.6%, respectively, as compared to their respective base cases. Using the Jaya approach, significant improved results were observed even compared to other previously used optimization approaches for design optimization. Results of conventional exergy analysis revealed that the exergy destruction of SMR and N2 dual expander process can be reduced by 17.4% and 14%, respectively. Moreover, economic analysis identified the 13.3% and 11.6% relative operating costs savings for SMR and N2 dual expander LNG processes, respectively.

1. Introduction

It is a universally acknowledged fact that energy plays a key role in the performance of different operations in all strata of life. Due to global population growth and the increasing trend of energy consumption, it is estimated that demand of energy will rise by 33% by 2030 [1]. In this scenario, fossils fuels such as coal, natural gas, and oil will be consumed in vast quantities to fulfil energy demand. Consumption of fossils fuels at such a level is causing a disturbance in the global energy–environment equilibrium, as shown by the issue of climate change [2]. As a result of the current situation regarding energy consumption and its effects, efforts to develop clean energy resources have been increased. The importance of climate change awareness can be gauged with the instance that, in 2016, 196 nations became signatories of the Paris Climate Accord, which concerns the adaptation and mitigation of the emission of greenhouse gases (GHGs) [3]. Considering environmental issues such as climate change, natural gas (NG) has been identified as one of the most promising eco-friendly fossil fuels, with lower air pollutant emissions than oil and coal [4]. Table 1 compares the air-pollutant emissions by natural gas, coal, and oil. NG emits lower levels of pollutants, such as carbon dioxide, sulfur dioxide, and nitrogen oxide, compared to other fossil fuels.
In this scenario, the importance of natural gas exploitation as a fuel has emerged globally. In addition to the unfavorable environmental effects associated with oil and coal [6,7], energy security and exploration of new natural gas reserves [8] are the key factors in the global attraction to utilizing NG. Global reserves of natural gas have increased over time and the threat of an immediate diminution of reserves is negligible. In 1995, the estimated global reserves of NG were 120 trillion cubic feet (TCF) and this soared to 186.1 TCF in 2014 [9]. It is established that energy conversion efficiencies of natural gas are significantly higher than for other fuels regarding power generation purposes. However, reserves of natural gas are presently at remote onshore and offshore locations. The multiform distribution of NG reserves creates multiple challenges for international trade of natural gas, and transportation of NG to remote locations is thus a difficult task. Given these factors, the introduction of technologies such as liquefied natural gas (LNG) has recharged the global NG trade [10]. Thus, it is estimated that LNG production and transportation will exhibit a positive trend in coming decades.
However, NG liquefaction is a highly energy- and cost-intensive process, especially when refrigeration and compression processes of NG are considered. 42% of the overall cost of an LNG project is associated solely with the liquefaction and refrigeration stages, as can be seen in Figure 1 [11,12,13]. Therefore, of the key issues related to LNG projects, low energy efficiency, or large energy consumption, is a primary associated challenge.
Consumption of energy to produce LNG does not only depend on the corresponding liquefaction technology, but also the site conditions for onshore and offshore facilities. In this regard, floating production, storage, and offloading (FPSO) facilities for LNG (liquefied natural gas) production are designed with entirely different criteria compared to onshore LNG units. Several important design factors, such as small footprint, equipment compactness, easy start-up/shut-down, and process safety in terms of flammable materials handling, are considered during the design of an offshore LNG production unit. Among all LNG processes, single mixed refrigerant (SMR) and nitrogen (N2) expansion-based processes are categorized as the most suitable choices for offshore-based LNG plants considering their low deck space requirement, simple design, and lower capital investment [14]. However, these benefits associated with SMR and nitrogen expander-based LNG processes are countered by high operating costs. To date, high operating costs, which are mainly related to the compression power requirement in the refrigeration cycle, remain a major challenge.
Design optimization has proven to be one of the most suitable approaches to identify performance enhancement opportunities for LNG processes. Many researchers have improved the performance of SMR and N2 expander LNG processes using design optimization only. Multiple design optimization studies relevant to performance enhancement of SMR and nitrogen expander-based LNG processes are listed in Table 2.
In the research studies listed in Table 2, power consumption by SMR and N2 expander LNG processes was taken as a main objective function. For instance, Khan et al. [18] endeavored to enhance the energy efficiency of SMR process using non-linear programming (NLP) and obtained 0.4244 kWh/kg-LNG specific energy consumption. Khan et al. [24] executed a customized knowledge inspired based algorithm for design optimization of N2 dual expander LNG process, and as a result, a specific energy requirement of 0.5007 kWh/kg-LNG was obtained. The reason behind this significant low value of specific energy consumption is the outlet temperature of inter-stage coolers used in [24]. Outlet temperature used in this study was set at 30 °C for each inter-stage cooler, while it is 40 °C in other cases. In simulation, keeping the outlet temperature of coolers at lower values decreases the specific energy consumption of that process. In addition, Qyyum et al. [27] used the vortex search optimization (VSO) approach for process improvement of the SMR LNG process, obtaining energy consumption of 0.369 kWh per kilogram of LNG. It has been reported [14,28,29] that LNG processes, particularly SMR and N2 dual expander-based processes, are still energy intensive, mainly due to the non-optimal design variables such as flowrates of refrigerant and condensation, and evaporation pressures of the refrigeration cycles. Therefore, it is imperative to pursue opportunities for the sake of energy savings in small-scale and offshore LNG processes, and particular for SMR and N2 dual expander processes. However, enhancement of energy efficiency for offshore LNG projects via exclusive optimization is nonetheless a difficult job. This is due to the fact that highly nonlinear and complex thermodynamic interactions are present between the energy efficiency (objective function) and the constrained design variables. In this context, the design optimization of the LNG processes is still an ongoing issue.
Since different optimization algorithms (either population based or single-solution based) have been used and evaluated for the effective design optimization of LNG processes [14]. The algorithms based on swarm intelligence and having evolutionary characteristics are usually probabilistic algorithms. To execute these algorithms, multiple controlling parameters are required, for instance, number of generations, size of population, and size of elite. Different algorithms usually need multiple specific control parameters despite having common control parameters [30]. For instance, Particle Swarm Optimization (PSO) utilizes cognitive parameters and inertia weight; parameters such as selection operator and mutation probability are used by GA; and different bees, such as scout, employed, and onlooker are used by the Artificial Bee Colony (ABC) approach. In the same manner, many different algorithms, such as Differential Evolution (DE), Shuffled Frog Leaping (SFL), Cat Swarm Optimization (CSO), Biogeography-Based Optimization (BBO), and Invasive Weed Optimization (IWO), require the tuning of their corresponding specific parameters. Performance of these algorithms can be compromised if adequate protocols for the tuning of the specific parameters are not followed. The inappropriate tuning of these specific parameters produces local optimal solutions or computational effort can be increased. Taking into account this scenario, Rao et al. [30] developed an optimization approach named “Jaya”, which does not need any algorithm-specific parameters. In this algorithm, derivation of a final solution aims at two fundamental entities: moving towards the best solutions and avoiding the worst solution. In addition to this crucial advantage, another reason for selecting the Jaya algorithm optimization approach for this study is that it has not previously been used for the optimization of LNG processes. Significant effects of this approach on the performance enhancement of LNG process will also be explored.
In this article, for process modeling and analysis, the commercial simulation software tool Aspen HYSYS® v10 (https://www.aspentech.com/) is employed, and rigorous models of SMR and N2 expansion processed are produced that are interlinked with the Jaya optimization algorithm, which is coded in MATLAB. The Peng-Robinson equation of state were used to calculate the binary interactions and Lee-Kesler equations were used to determine the calculations regarding entropies and enthalpies. This article is organized in the following manner: 
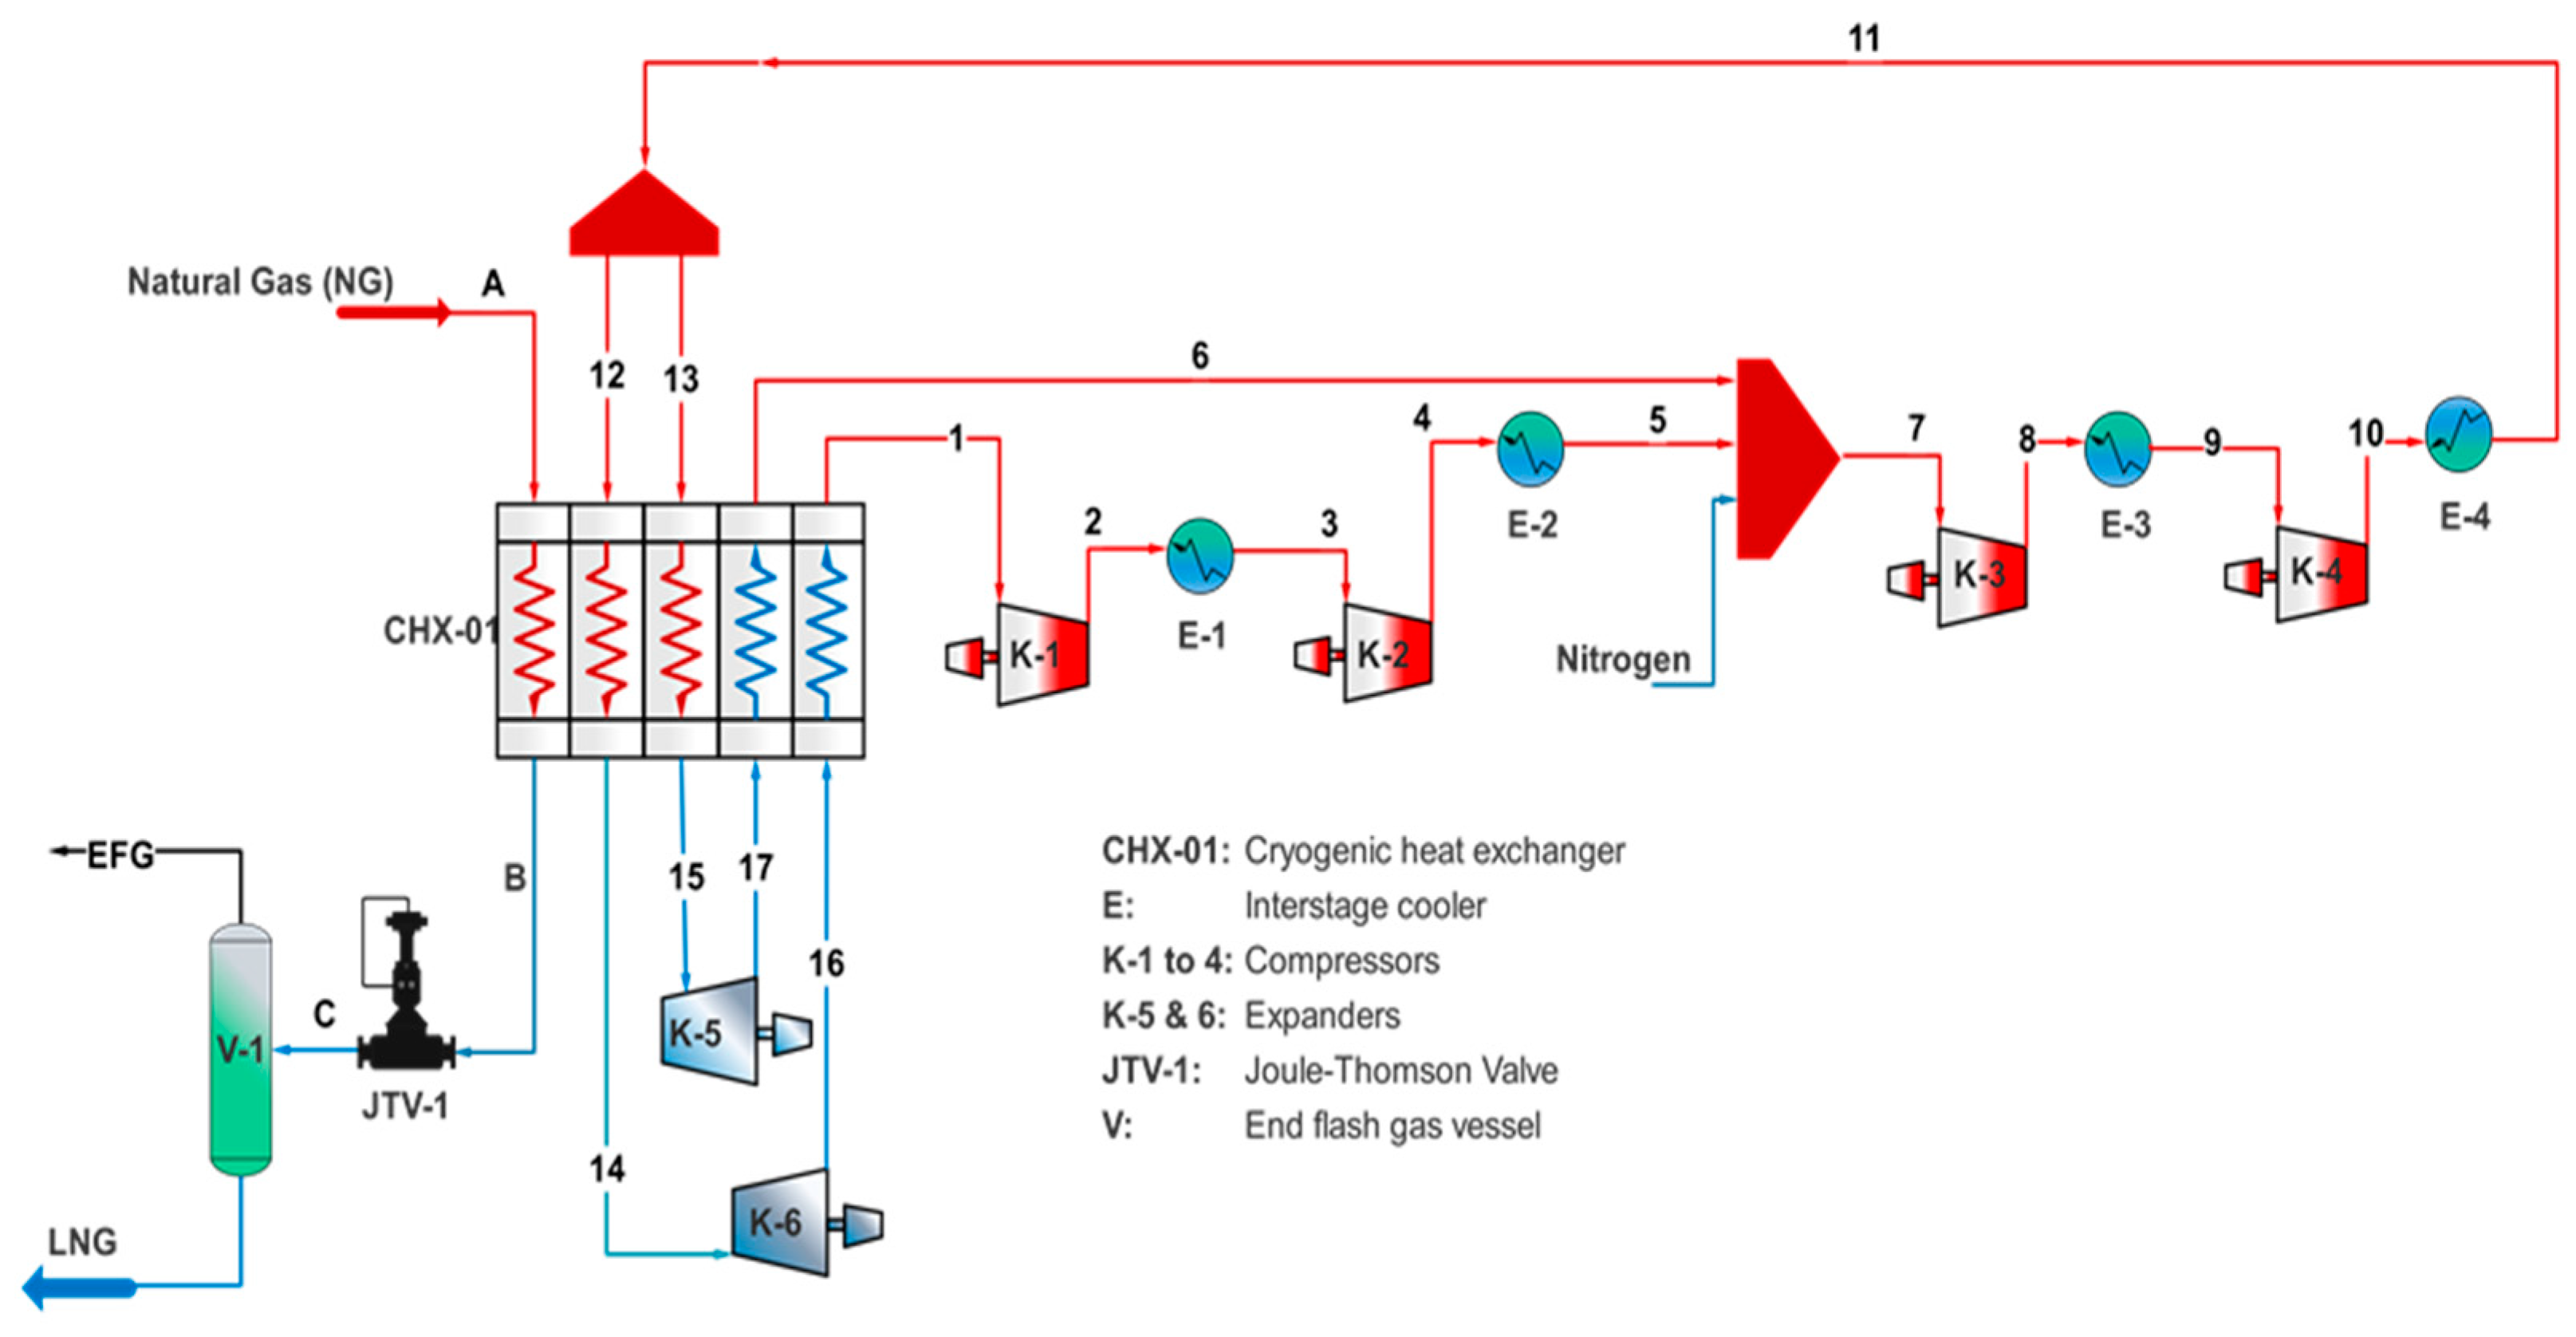
Section 2 emphasizes the simulation basis and description for offshore LNG processes such as SMR and N2 dual expander processes. Section 3 provides the detailed conditions and assumptions for processes modeling and optimization. Section 4 describes the Jaya algorithm and its major advantages and limitations with respect to offshore LNG processes. Section 5 deals with the multiple process analyses involved in this research. Section 5.1 explores the energy saving opportunities as a result of design optimization. 
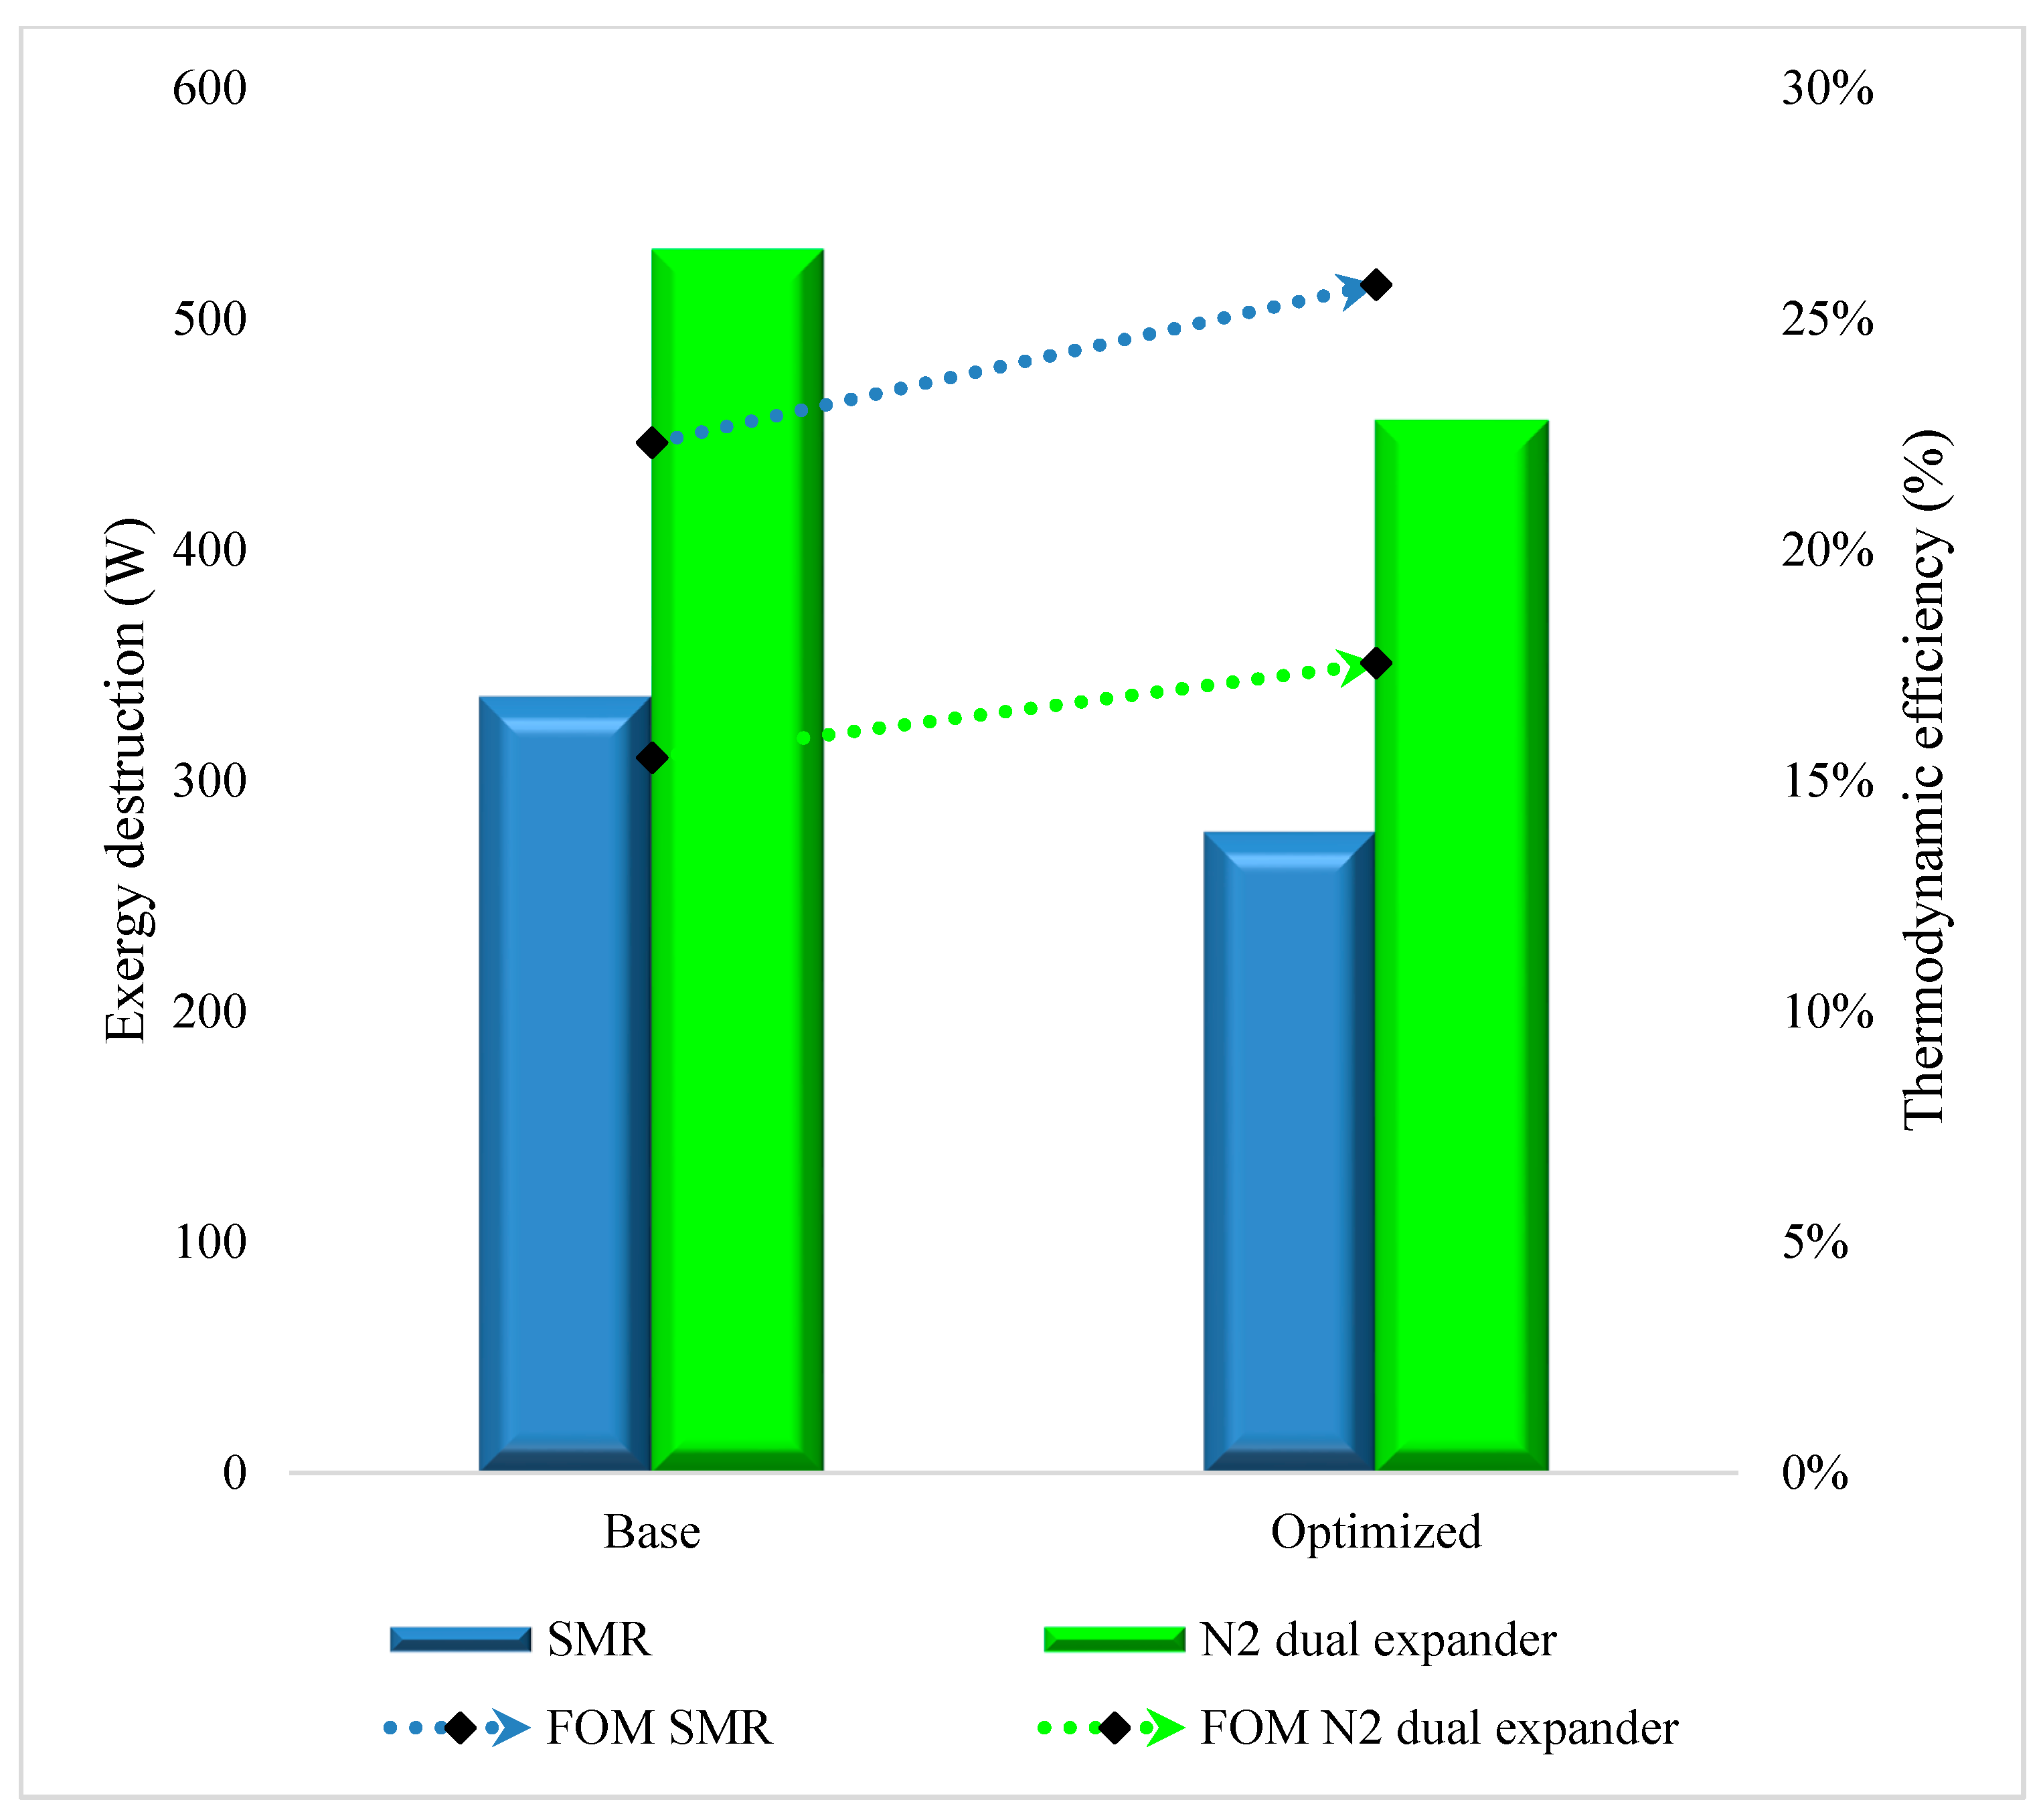
Section 5.2 reveals the detailed results of conventional exergy analysis applied to base and optimized cases of SMR and N2 dual expander LNG processes. Section 5.3 depicts the effects of the Jaya algorithm, based on composite curves analysis, on the performance of an LNG heat exchanger involved in the SMR and N2 dual expander processes. 
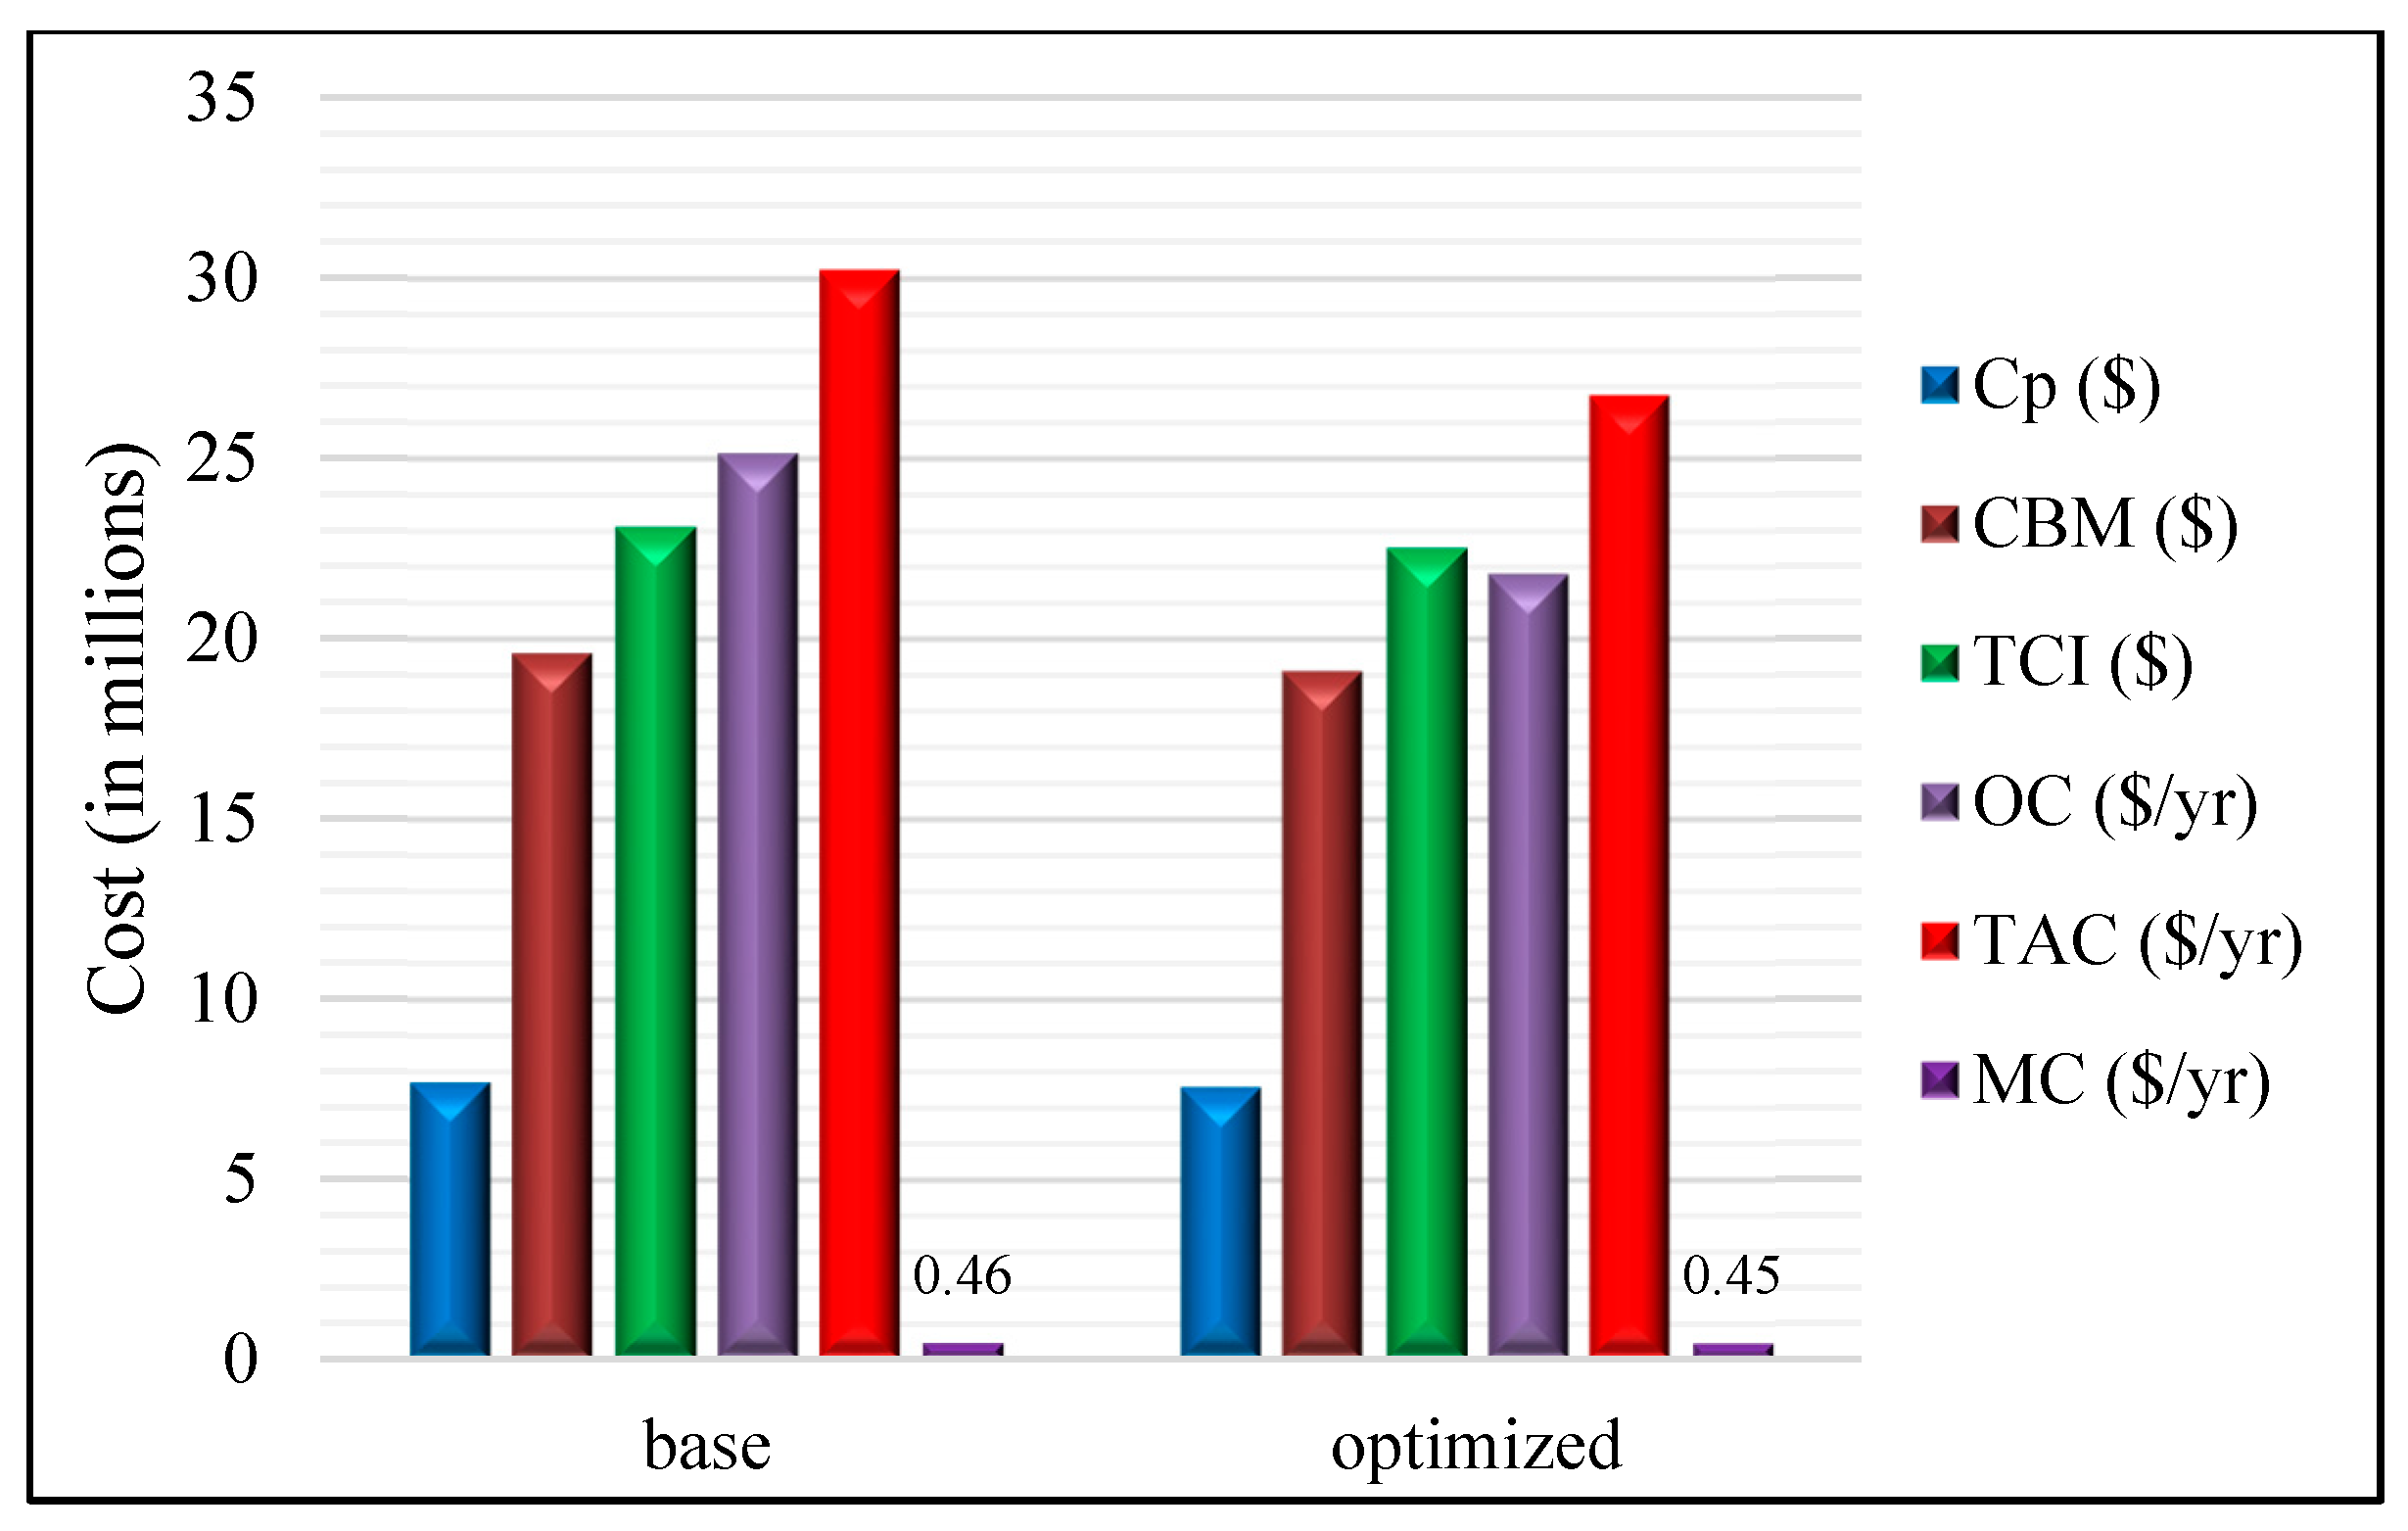
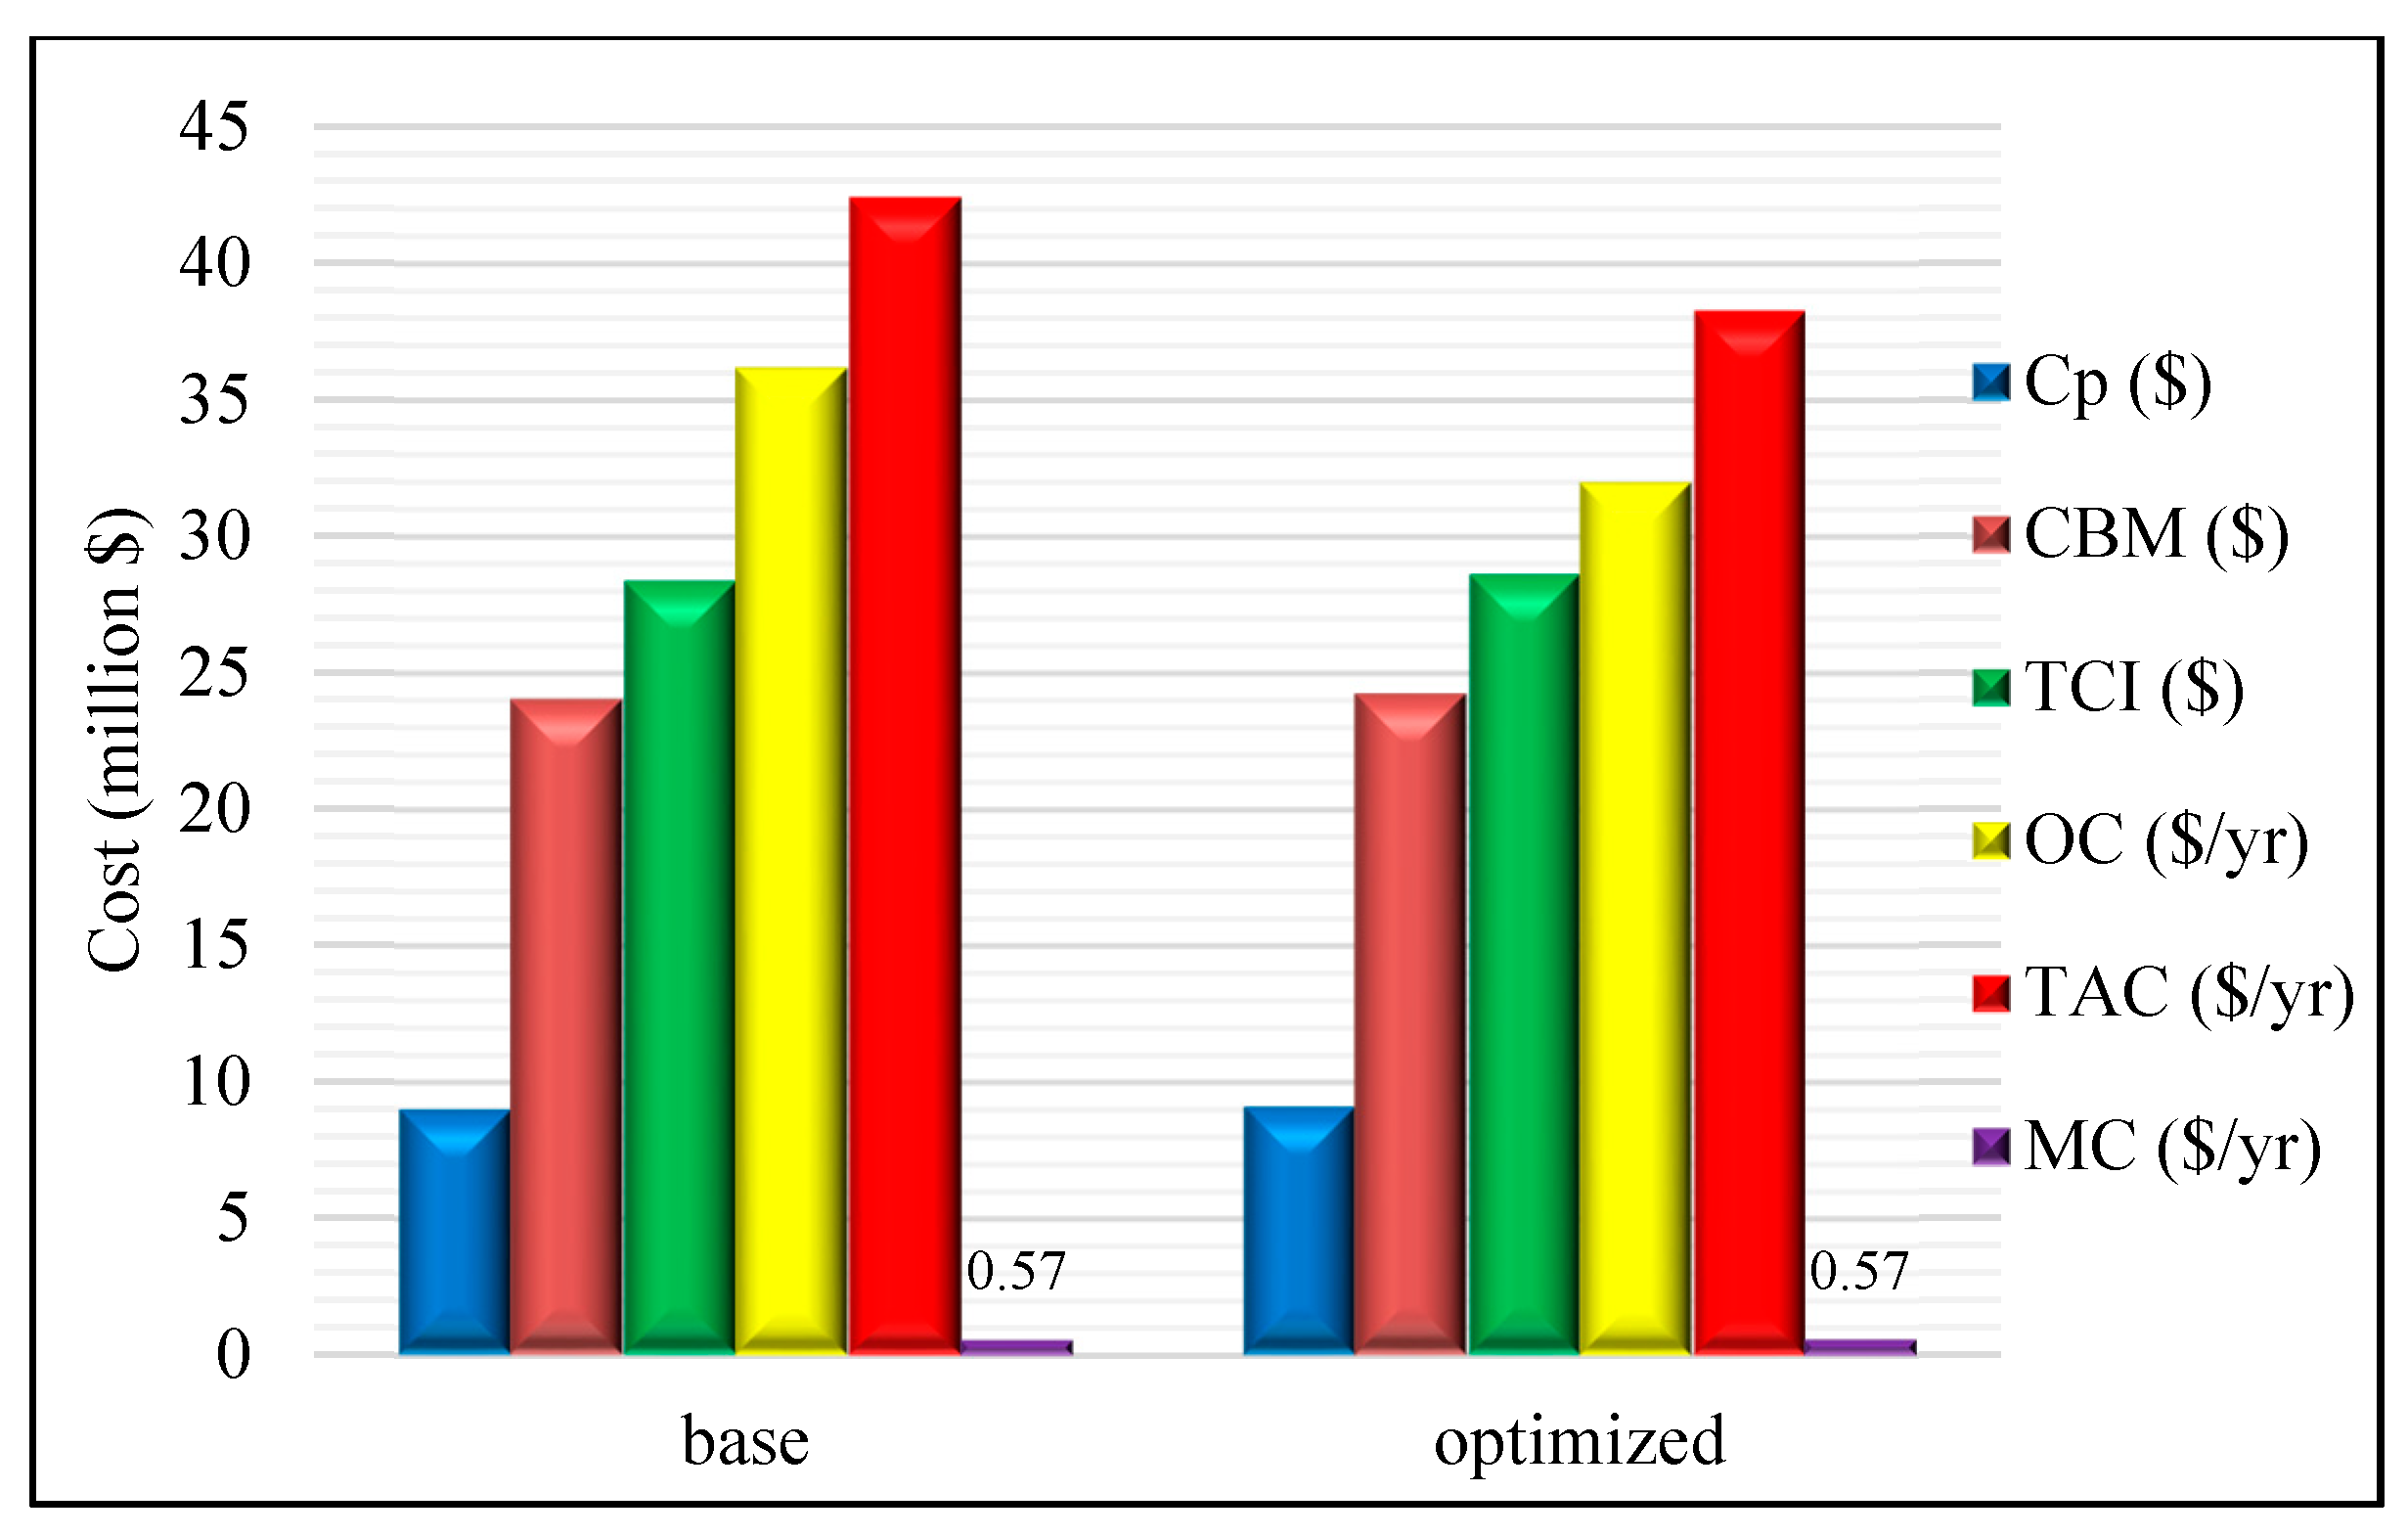
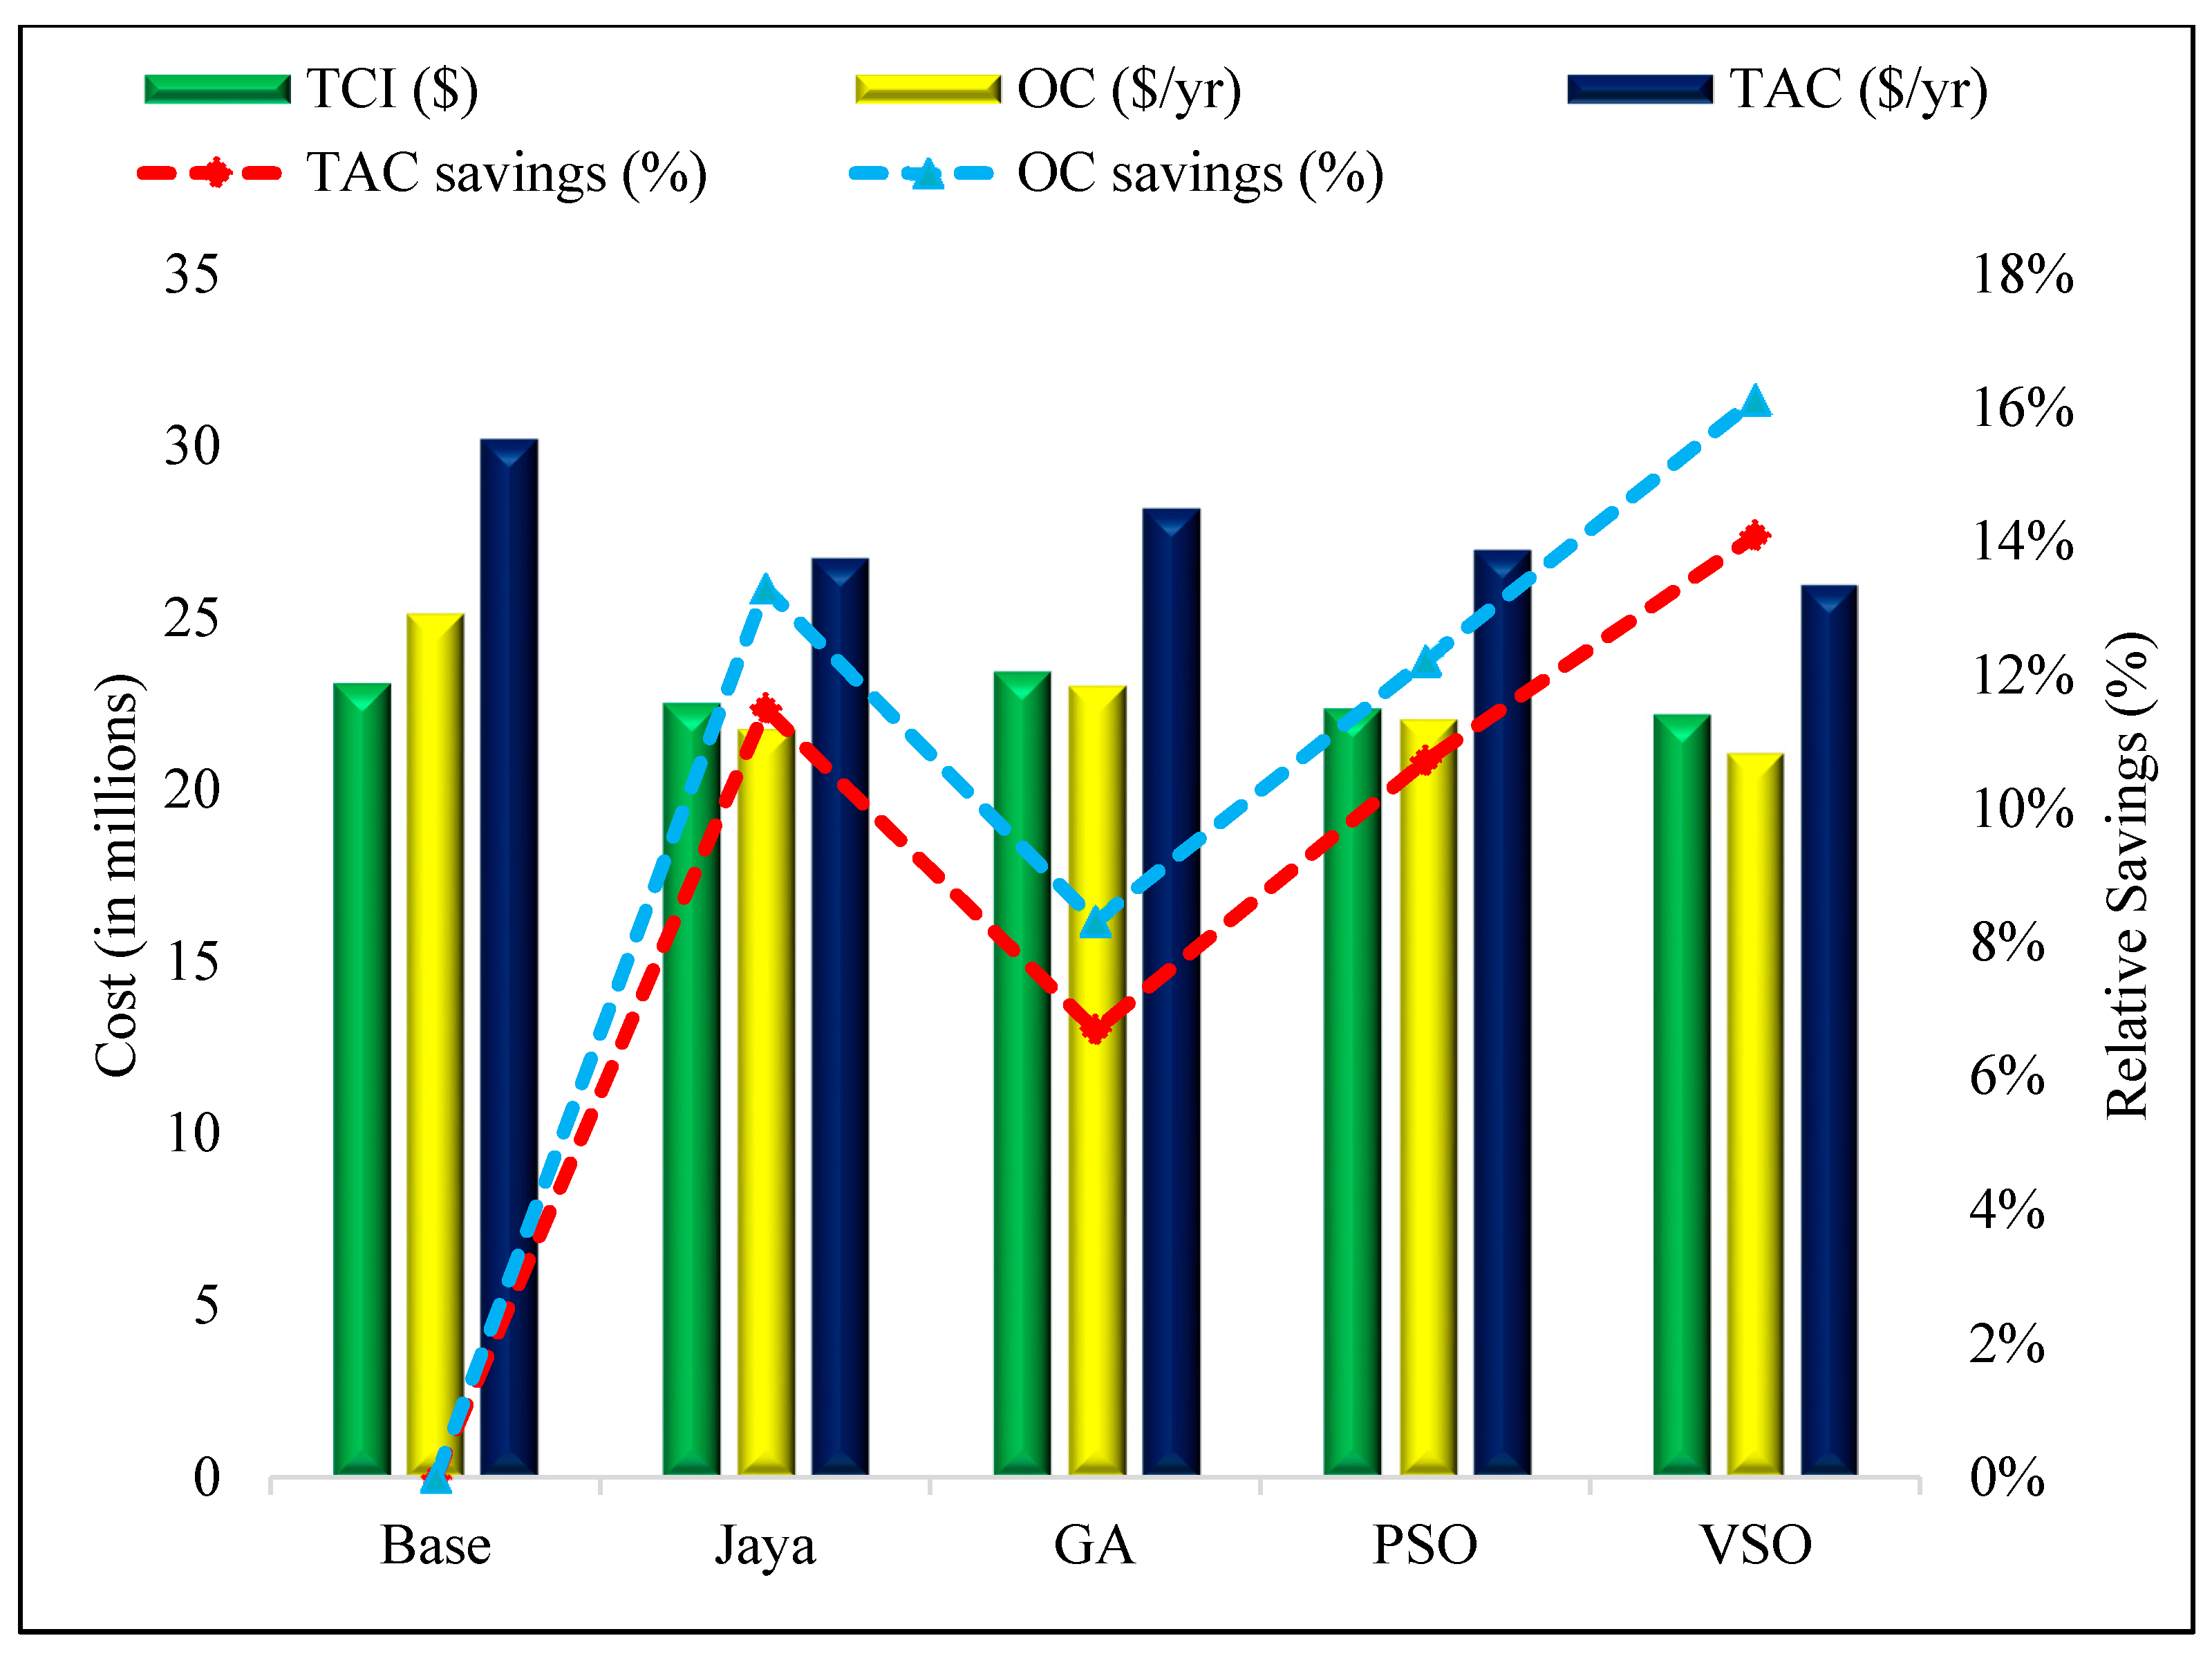
Section 5.4 describes the different types of costs and relative cost savings for SMR and N2 dual expander LNG processes based on economic analysis. Finally, the conclusions extracted from this research work are presented in Section 6.

2. LNG Processes: Nitrogen Dual Expander and Single Mixed Refrigerant

The nitrogen dual expander process (see Figure 2) and single mixed refrigerant process (see Figure 3) are taken promising candidates for offshore NG liquefaction project. Their corresponding process description and simulation are described in the following sub-sections.

2.1. Nitrogen Dual Expander LNG Process: Description and Simulation

In a typical N2 dual expander LNG process, a single refrigeration cycle consists of N2 as a refrigerant, which is employed to produce liquid natural gas. Due to a single (gaseous) phase throughout the refrigeration cycle, a turbo expander (single or dual) is used to produce sufficient cold energy upon isentropic expansion. The N2 expansion LNG process uses multistage compression, which is equipped with water/air based inter-stage cooling. In this study, the nitrogen expansion process used is a dual turbo expander. The major reason behind the dual expander is that an expansion of nitrogen refrigerant takes place at two different (low and high) pressure levels, which ultimately reduces the generation of entropy within the multi-stream cryogenic LNG heat exchanger. Although dual expansion adds to the capital cost, it results in a significant reduction in operating cost [14,27]. In Figure 2, natural gas (stream-A) passes through the main cryogenic heat exchanger (LNG-1) at high pressure (50.0 bar) and ambient temperature. The latent heat of vaporization of natural gas is exchanged with the working fluid nitrogen (stream-16 and stream-17) in the LNG heat exchanger (LNG-1). The resultant stream-B is obtained as subcooled LNG, which is expanded by a Joule-Thomson (JT) valve (JTV-1) to produce liquefied natural gas after passing through a vessel (V-1). In this process, expanders (K-5 and K-6) are used for isentropic expansion, which are preferable to JT valves in terms of thermodynamic efficiency. Stream-1 and -6 exit from LNG-1, and are recycled to complete the refrigeration loop.

2.2. Single Mixed Refrigerant LNG Process: Description and Simulation

The classical SMR process uses mixed refrigerant (MR) including methane, ethane, propane, and nitrogen. This process also uses a single refrigeration cycle but with two phases (gas-liquid), where two-phase mixed refrigerant is expanded through Joule-Thomson (JT) valve. The JT valve has several advantages over an expander, such as simple design, compactness, and significantly lower capital cost. Nevertheless, JT valves lead to isenthalpic expansion rather than isentropic expansion, which makes the SMR process less attractive thermodynamically. Figure 3 presents a simple schematic of the conventional SMR process. Accordingly, natural gas (stream-1) goes to the main cryogenic heat exchanger (usually plate-fin) at ambient temperature and high pressure (i.e., 40.0–80.0 bar). The SMR process deals with both type of heat i.e., sensible and latent. The latent heat of the vaporization of natural gas is exchanged with the MR (stream-5), and the resultant stream-2 is obtained as subcooled LNG. In contrast, stream-6 exits as a superheated mixed gas refrigerant from the LNG heat exchanger which is recycled to complete the refrigeration loop.

3. Processes Simulation

NG feed assumptions and conditions are listed in Table 3. The key assumptions taken into account during the modeling (through Aspen Hysys® v10) of the SMR and N2 expansion LNG processes are given as:
  • Loss of heat to the surroundings is negligible.
  • 75% isentropic efficiency was fixed for each compressor.
  • 75% isentropic efficiency was considered for each involved expander.
  • The outlet temperature of refrigerant was set at 40 °C for each inter-stage cooler.
  • Across each inter-stage cooler, there is no pressure drop [31,32,33].
  • Across the main LNG heat exchanger (CHX-01), there is no pressure drop [31,32,33].
  • The minimum internal temperature approach (MITA) value of heat exchanger CHX-01 for both (SMR and N2 dual expander) LNG processes was set at 3 °C.
  • The fraction of end flash gas was fixed at 8.0%.
Details of heat exchanger model used for SMR and N2 dual expander LNG processes are described in Table 4.

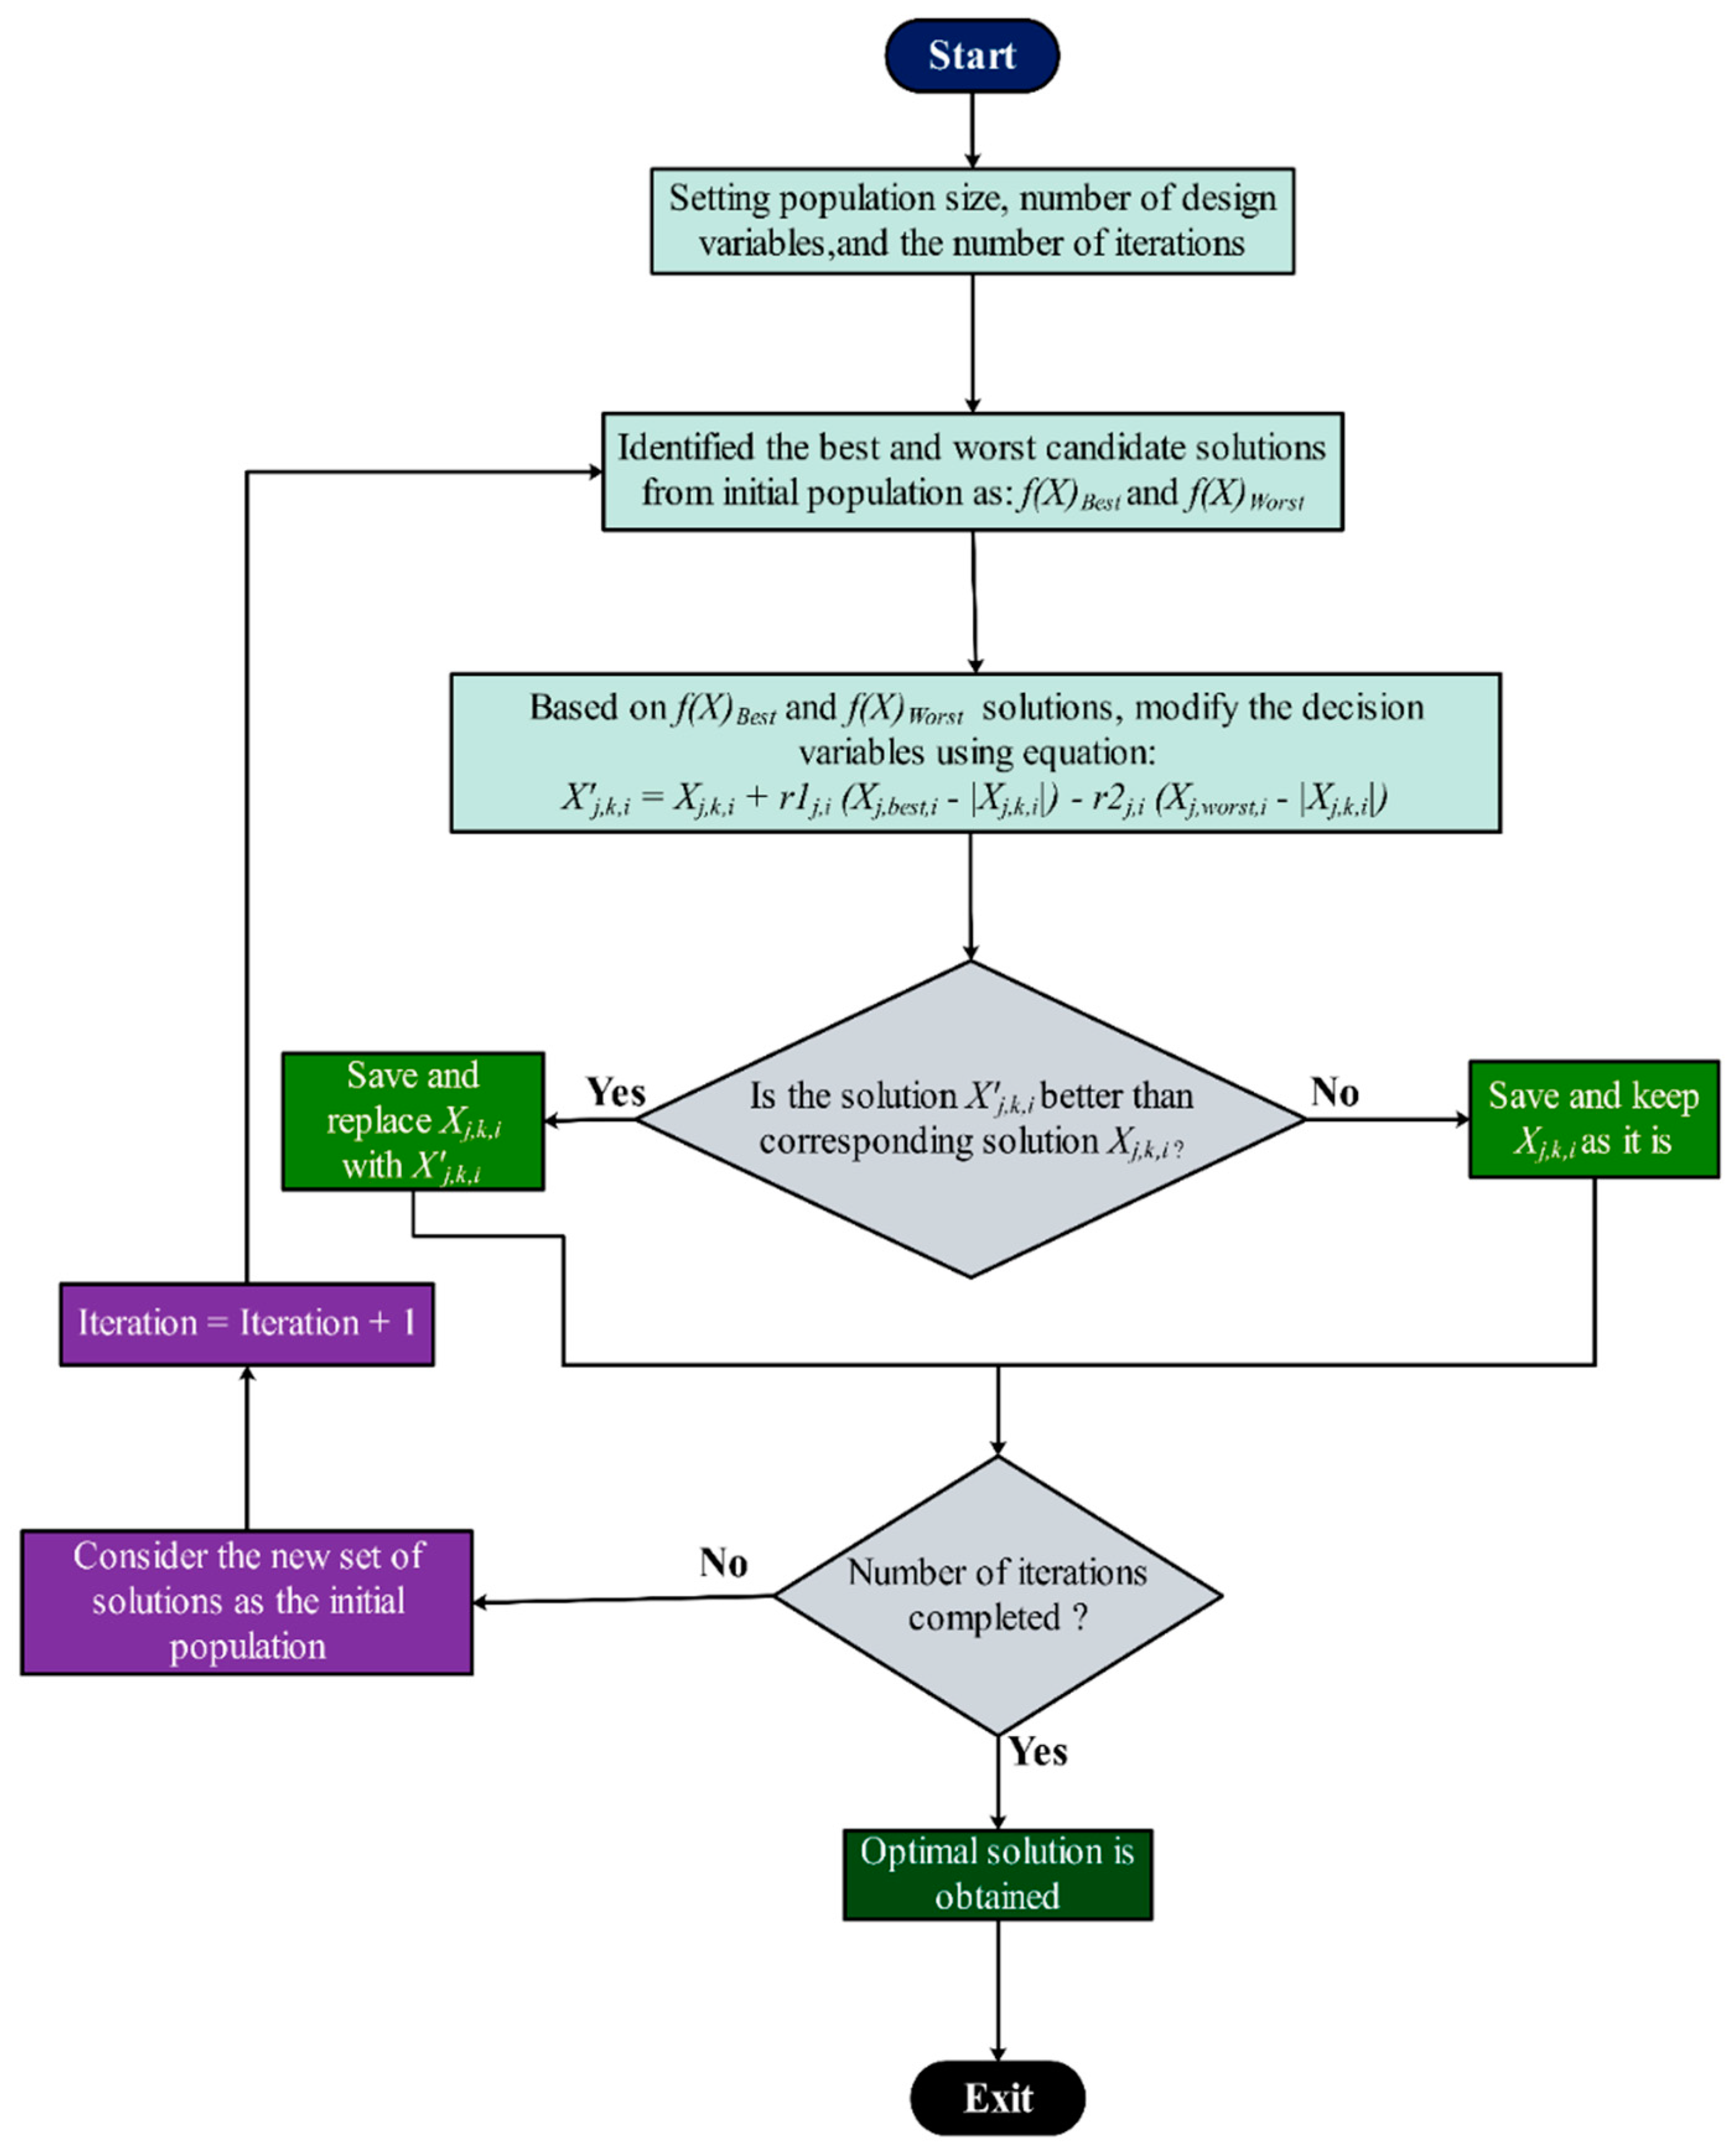
4. Jaya Optimization Algorithm

The Jaya algorithm solves constrained and unconstrained problems with a lesser number of evaluations compared to other algorithms and is simple to implement and modify. The general searching (working) flowchart of the Jaya algorithm is shown in Figure 4. A generic explanation of the Jaya algorithm is given as follows:
Let us suppose that the objective function to be optimized is f(x). Assume that at any iteration i the design variables number is m (i.e., j = 1, 2, …, m), and the number of candidate solutions or population size is n (i.e., k = 1, 2, …, n). The worst candidate solution f(x)worst and the best candidate solution f(x)best are acquired by selecting the worst and the best values from the whole population size, respectively. If at the ith iteration, the current value of the jth variable for the kth candidate solution is Xj,k,i, the modification of this value to new values X′j,k,i for moving towards the optimized solution is carried out according to the following mathematical equation:
X j , k , i = X j , k , i + r 1 j , i ( X j , b e s t , i | X j , k , i | ) r 2 j , i ( X j , w o r s t , i | X j , k , i | ) ,
where X′j,k,i is the updated value of Xj,k,i, and Xj,best,i and Xj,worst,i are best and worst values of jth variable for the best and worst candidate solutions f(x)best and f(x)worst respectively. r 1 j , i and r 2 j , i are selected as two random numbers having range from 0 to 1 for the j t h variable and during the i t h iteration. The term r 1 j , i ( X j , b e s t , i | X j , k , i | ) tends to push the solution towards the best solution whereas the term r 2 j , i ( X j , w o r s t , i | X j , k , i | ) tends to move the solution away from the worst solution.
In this study, the N2 dual expander and the SMR LNG processes were optimized using the Jaya algorithm. The specific compression power was considered as an objective function that was constrained with the MITA. Table 5 lists the objective function, constraint, and design variables for both studied LNG processes.
To handle the constraint, the exterior penalty function (EPF) method has been utilized to incorporate the constraint (i.e., MITA) into the objective function. This approach has been exercised in many recent research works [13,17,20,34] relevant to design optimization of the LNG processes. Hence, the objective function with the incorporation of constraint is given below in Equation (2):
Minimize   f ( X ) = Min ( i = 1 k W i / m LNG + r ( max { 0 , ( 3.0 MITA ( X ) } )
The purpose of the objective function given in Equation (2) was to minimize the energy needed for LNG process. Next, an example of the SMR process, to demonstrate the working of the Jaya algorithm, is given. For this, the objective function given in Equation (2) is considered. There are six design variables (i.e., m C 3 ,   m C 2 ,   m C 1 ,   m N 2 ,   P 2   ,   and   P 1 ) in the SMR process. Five candidate solutions (i.e., initial population size) and two iterations as the termination criteria are assumed for this demonstration. The initial population was generated by choosing the values of design variables randomly from within the given ranges of the variables’ values, and then the respective objective function values were calculated using the Aspen HYSYS simulator, as shown in Table 6.
Because it is a minimization function, the lowest and highest values of f(x) were taken as the best and the worst solutions, respectively. From Table 6, it can be seen that best and the worst solutions correspond to the second and first candidate solutions, respectively. Then, assuming two random numbers r1 = 0.58 and r2 = 0.81, the new values of each design variable ( m C 3 ,   m C 2 ,   m C 1 ,   m N 2 ,   P 2   ,   and   P 1 ), were calculated using Equation (1) and are shown in Table 6. For instance, the new values of the three variables for the first candidate solution and for the first iteration were calculated as shown from Equations (3)–(6):
X 1 , 1 , 1 = X 1 , 1 , 1 + r 1 1 , 1 ( X 1 , 4 , 1 | X 1 , 1 , 1 | ) r 2 1 , 1 ( X 1 , 3 , 1 | X 1 , 1 , 1 | ) , = 37 + 0.58 ( 62 | 37 | ) 0.81 ( 57 | 37 | ) = 35.3
X 2 , 1 , 1 = X 2 , 1 , 1 + r 1 1 , 1 ( X 2 , 4 , 1 | X 2 , 1 , 1 | ) r 2 1 , 1 ( X 2 , 3 , 1 | X 2 , 1 , 1 | ) , = 1.2 + 0.58 ( 3.3 | 1.2 | ) 0.81 ( 2.3 | 1.2 | ) = 1.52
X 3 , 1 , 1 = X 3 , 1 , 1 + r 1 1 , 1 ( X 3 , 4 , 1 | X 2 , 1 , 1 | ) r 2 1 , 1 ( X 3 , 3 , 1 | X 3 , 1 , 1 | ) , = 0.21 + 0.58 ( 0.44 | 0.21 | ) 0.81 ( 0.34 | 0.21 | ) = 0.24
X 4 , 1 , 1 = X 4 , 1 , 1 + r 1 1 , 1 ( X 4 , 4 , 1 | X 4 , 1 , 1 | ) r 2 1 , 1 ( X 4 , 3 , 1 | X 4 , 1 , 1 | ) , = 0.28 + 0.58 ( 0.67 | 0.28 | ) 0.81 ( 0.45 | 0.28 | ) = 0.36
Similarly, the new values of other variables were calculated. Then, each corresponding candidate solution from Table 6 and Table 7 were compared and the best solution was chosen. For example, candidate solutions 1, 2, 4, and 5 were the best in Table 7, whereas solution 3 was the best in Table 6. Thus, Table 8 shows the best candidate solutions obtained by comparing Table 6 and Table 7. The best and worst solutions are identified again in Table 8. Candidate solutions 2 and 3 were identified as the best and the worst solutions, respectively. Thus, this completes the first iteration. Then, the second iteration started by choosing new values of random variables r1 and r2. The process of updating the decision variable values was repeated again. For the second iteration, the values of r1 and r2 were assumed as r1 = 0.21 and r2 = 0.29. New values of all decision variables were calculated using Equation (1). Table 9 shows the new values of decision variables and their relevant values of the objective function. Now the optimal values of objective function of Table 8 and Table 9 are compared, best value of objective function is chosen, and placed in Table 10. Table 10 shows the optimal solution after second iteration. It is obvious from Table 10 the best solution obtained corresponds to 2nd candidate solution and the worst solution corresponds to 1st candidate solution. The value of objective function is reduced from 0.437 to 0.3906 in just two iterations. The above demonstration is for constraint problem of minimizing overall power of SMR process. Similarly, a demonstration could be made for N2 dual expender process. The difference lies only in the number of variables and their lower and upper bounds.
The demonstration of the Jaya algorithm for the design optimization of the SMR process does not include any effect of the constraints. This can be handled simply by using a penalty function to take care of the constraint’s violation by activating the penalty on the objective function.

5. Process Analysis

5.1. Optimization Results and Discussion

The energy saving opportunities in SMR and nitrogen dual expander processes for an offshore facility were found successfully by executing the Jaya optimization algorithm. Table 11 summarizes the results for both base and optimized cases of the N2 dual expander process and SMR process. In the base case of the nitrogen expansion process and SMR process, minimum internal temperature approach (MITA) values were 4.95 and 5.4 °C, respectively. These higher values of MITA provided an opportunity to save energy. It has been reported [35] that to make feasible, economical, and efficient transfer of heat, the MITA value must be in the range of 1.0–3.0 °C. Hence, after optimization, the MITA value reached 3.0 °C, which led to the reduction in the entropy generation within the main cryogenic heat exchanger. The entropy reduction provides a significant decrease in exergy losses and enhances the overall energy efficiency of the liquefaction process.

5.2. Composite Curves Analysis

In the main multi-stream LNG heat exchanger of LNG process, opportunities for exergy saving can be interpreted physically using composite curves analysis [36]. Composite curves analyses, in addition to exergy analysis, plays a vital role for the evaluation of the exergy contents in the process streams. In composite curves analysis, the maximum hot stream temperature is in agreement with the maximum cold stream temperature, and vice versa. In the temperature and heat-flow composite curves (THCCs), the arrangement of the process data is done in such manner that the energy streams containing heat flow (W) function is in correspondence with temperature (°C) [37]. On the other hand, the temperature difference composite curves (TDCCs) provide the opportunity to determine the peak of the minimum internal temperature approach (MITA) value within cryogenic heat exchangers. The value of MITA between 1.0 and 3.0 °C inside the cryogenic heat exchangers is taken as more feasible range for efficient heat transfer. Approach temperature values approaching 3.0 °C in TDCCs implies efficient heat transfer, and the values receding 3.0 °C implies exergy destruction within the cryogenic heat exchanger [37].
Figure 5 shows the THCCs of cryogenic heat exchanger CHX-01 of the base and the optimized cases for SMR and N2 dual expander LNG processes. The exergy destruction within cryogenic heat exchangers (CHX) is analyzed by computing the gap margin of cold and hot composite curves. It can be observed in Figure 5a,b that the application of optimal decision variables, derived through optimization using the Jaya algorithm, leads to a reduction in exergy destruction. The margin between cold composite curves (CCC) and hot composite curves (HCC) of optimized cases is significantly less than their corresponding base cases. This scenario implies the overall performance improvement of the LNG heat exchanger (CHX-01) because of the application of the Jaya algorithm.
Figure 6 shows the TDCCs for base and optimized cases for SMR and N2 dual expander LNG processes. The MITA values for ideal heat transfer inside the heat exchanger range between 1.0 and 3.0 °C. The high-temperature approach inside the LNG heat exchanger (>20 °C) is mainly because of the existence of MR high boiling point components, e.g., propane. The high-temperature approach tends to cause the generation of entropy inside the LNG heat exchangers, and this approach can usually be observed in the central area of the composite curves [38]. High energy performance of the LNG heat exchanger could be obtained by increasing mass flow rates of high boiling point components like propane, which will force the high-temperature approach to move towards a warmer section of the cryogenic exchanger. This scheme, however, could produce liquid fractions at the inlet of compressors if the flow rate of propane is increased. Therefore, flow rates of refrigerant are adjusted to ensure the zero fraction of liquid at the compressor inlet. High energy efficiency of an LNG heat exchanger can be achieved by reducing the peak value of MITA. In Figure 6a, it is observed that the peak value of MITA for CCC and HCC in the base case is 63 °C, however, due to the application of Jaya algorithm, the MITA peak value drops to 51 °C in the optimized case. On the other hand, in Figure 6b, the peak value of MITA in the N2 dual expander base case is 28 °C, while it drops to 25 °C in the optimized case. Reduction in peak values of MITA in both processes due to implementation of the Jaya algorithm leads to the overall improvement in efficiency.

5.3. Exergy Analysis

The exergy of any system can be stated as the maximum attainable useful work when the system undergoes interactions to reach a state of equilibrium. To perform exergy analysis in these processes, the following assumptions were taken into account [39]:
  • The outer surface of all equipment involved in the process are at constant reference temperature, hence, the rate of exergy destruction is neglected.
  • The whole system, including each involved equipment, is assumed at rest by taking into account the environment making the rates of kinetic and potential exergies negligible.
Conventional exergy analysis is performed to find out the exergy destruction in each equipment involved in the NG liquefaction process. Methods are taken into account from the literature [39] to compute the destruction of exergy in different equipment of the system. As a chemical reaction was not involved in this process, only physical exergy has been taken into account. Equation (7) expresses the physical exergy of the kth equipment:
e ˙ k = ( m ˙ ) × { ( h k h 0 ) T 0 × ( s k s 0 ) }
where e ˙ k , h, T, and s represent the rate of exergy of the kth equipment, enthalpy, temperature, and entropy, respectively. The subscripts 0 and k express the ambient conditions and the concerned equipment, respectively. Here, t 0 = 25.0   ° C and atmospheric pressure value of 1.013 bar were used as ambient conditions to perform exergy analysis. Equations of exergy balance are used to evaluate the total destruction of exergy in each involved equipment, as shown in Equation (8) [39].
E ˙ F = E ˙ D + E ˙ P
where E ˙ F , E ˙ P , and E ˙ D express the rate of fuel exergy, rate of product exergy, and the rate of exergy destruction, respectively.
Table 12 provides the details of results of conventional exergy analysis applied to SMR and N2 dual expander LNG processes. Details of exergy destruction in the equipment of the base and optimized cases are demonstrated.
On the basis of Table 12, Figure 7 shows the comparison of exergy destruction between base and optimized cases of SMR LNG processes. Due to the application of the Jaya algorithm, a significant reduction in exergy destruction in the optimized case can be observed. It can be seen that the maximum exergy destruction for each case is associated with the heat exchanger (CHX-01). This is due to the fact that, in the LNG process, heat transfer between the cold and hot fluids, and exchange of heat between the environment and the exchanger, plays a vital role in increasing the generation of entropy [40]. In addition, movement of hot and cold fluids through the exchanger also contributes to the increase of exergy destruction. Figure 8 shows the exergy destruction comparison between the base and optimized cases associated with each item of equipment of the N2 dual expander LNG process. In this process, the maximum destruction of exergy is associated with compression units (K1–4). The percentage share of exergy destruction related to each equipment in the optimized cases of the SMR and N2 dual expander LNG processes was elaborated in Figure 9 and Figure 10, respectively. These results were extracted on the basis of the values given in Table 12.
Figure 9 provides useful details for process engineers and information about the influence of each type of equipment on the exergy efficiency of the SMR process. It can be observed that the CHX-01 and compressors play the vital roles in decreasing the exergy efficiency of the overall SMR process. Process engineers can further improve the system via more competent design optimization approach or retrofitting. On the other hand, Figure 10 shows the details of the impact of each piece of equipment on the exergy efficiency of the N2 dual expander LNG process. It can be observed that compressors (K3 and K4), the expander (K5), and coolers (E3 and E4) are the leading equipment producing maximum exergy destruction. Improving these pieces of equipment alone can significantly enhance the exergy efficiency of the overall process.
Due to the implementation of the Jaya algorithm, exergy destruction in the optimized cases of both SMR and N2 dual expander processes was reduced by 17.4% and 14%, respectively, compared to their corresponding base cases (Figure 11). Thermodynamic efficiency of the overall process of liquefaction can be determined considering figure of merit (FOM) [26]. Having utilized the Carnot refrigeration cycle with respect to energy consumption for liquefaction, the thermodynamic efficiency of a liquefaction process can be determined. This could be described as the ratio of ideal work Wi to actual required work Wr for liquefaction, as given in Equation (9):
F O M = W i W r
Exergy efficiency, thermodynamic limit, percent Carnot, and FOM are the key indicators to assess the thermodynamic efficiency of any liquefaction process [41,42,43]. In terms of thermodynamics, ideal or minimum work is associated with the ideal process of liquefaction, while actual work is the actual consumption of energy utilized in the real process of liquefaction. From the fluid, which undergoes reversible processes to reach equilibrium with its surroundings, the maximum work which could be obtained for the liquefaction process can be described by Equation (10):
W ˙ i = m ˙ L N G × ( E ˙ L N G ) m ˙ N G × ( E ˙ N G )
Table 13 shows actual power and thermodynamic efficiencies of both SMR and N2 dual expander processes with their corresponding base and optimized cases. It implies that actual work required for the base cases of LNG and N2 dual expander processes are 0.44 and 0.63 kW, leading to thermodynamic efficiency of 22% and 15%, respectively. With the application of the Jaya algorithm actual power for the LNG and N2 dual expander processes is reduced to 0.38 kW and 0.55 kW, respectively, which leads to an enhancement in thermodynamic efficiency of 26% and 17%, respectively. This scenario of thermodynamic efficiency improvement is also illustrated in the Figure 11.

5.4. Economic Analysis

The annual capital charge ratio (ACCR) is a widely used method in the economic analysis of industrial plants, and is based on interest rates and the life time of plant. Nevertheless, due to certain limitations regarding the selection of adequate assumptions for plant life and interest rates, a simpler method to calculate total annualized cost (TAC) was adopted from the literature [44]. This method is based on the payback period. In this study, 5 years was taken as the period for the overall investment return. Using this method, a rigorous comparison between conventional and proposed schemes can be undertaken to demonstrate the economic feasibility of the proposed work. In addition, the handbooks of Turton and Luyben [44,45] were utilized to obtain additional details regarding economic analysis of different LNG processes. To execute the economic analysis, equations to calculate different types of costings involved in the LNG process are enlisted in the Table 14 [44].
To estimate the economic and commercial feasibility of SMR and N2 dual expander LNG processes, 1 million tons per annum (MTPA) NG feed capacity was assumed. In this article, economic differences between the base and optimized cases of the SMR and N2 dual expander LNG processes were highlighted. In this way, the significant impact of design optimization on the economic performance was identified. Considering operating costs (OC), electricity generated on floating LNG power station (FLPS) was considered. So, the price of electricity was taken as $0.057/kWh [46] for the cost estimation of OC. which mainly reflect the cost of operation of compression units. For economic analysis, 8760 working hours per year have been taken into account which makes the cost of electricity $500.2/yr. Utilizing the equations given in Table 14, the cost of multiple equipment involved in the SMR and N2 dual expander LNG processes, such as inter-stage air coolers, compression units, heat exchangers, and expanders, was calculated. In order to estimate the cost of compressors and expanders, the capacity factors related to work duty (kW) were acquired by Aspen HYSYS. To evaluate the costs of air coolers and multi-stream LNG heat exchangers, the capacity factor was related to the area (A) of the coolers and heat exchangers. However, the area (A) of coolers and heat exchangers cannot be obtained from Aspen HYSYS. Thus, the value of UA (the product of the area of exchanger and the overall heat transfer coefficient) was utilized in this regard. Table 15 provides the values of UA and capacity factors for the compressors and the expanders.
Figure 12 illustrates that the operating cost of the base case of the SMR LNG process can be reduced by 13%. The reason behind the operating cost savings is the high energy efficiency of the optimized SMR LNG process. In addition to achieving operating cost savings, total capital investment (TCI) is also decreased in the optimized case by 2.6%. Moreover, the TAC of optimized case decreased to the value of $26.3 million/year, leading to 11.6% TAC savings. Figure 13 demonstrates the 11.6% relative operating cost savings in the N2 dual expander LNG process. In this regard, a tradeoff between the capital investment/increment and the operating costs is observed, leading to a 0.9% increment of TCI for the optimized case. However, 9.9% TAC relative savings are obtained and the TAC value decreased to $37.9 million/year from $41.8 million/yr.
In addition, in order to identify the potential of Jaya algorithm, economics of the SMR LNG process using the Jaya approach was compared with approaches such as the GA, PSO, and vortex search optimization (VSO) approaches. In the recent study, Qyyum et al. [20] used the GA, PSO, and VSO approaches for design optimization of the SMR LNG process. Economic analysis of these three optimized processes were performed and results were compared with the Jaya approach which can be seen in Figure 14. Figure 14 shows the significant benefit of Jaya approach over GA and PSO approaches in terms of TCI, OC, and TAC while these values are 1.5%, 3.5%, and 2.9% higher as compared to the VSO approach, respectively. Relative savings of annual costs i.e., TAC ($/yr) and OC ($/yr) were also elaborated in the Figure 14. Relative TAC savings using Jaya approach was found 11.50% while it was 6.7%, 10.7%, and 14.1% for the GA, PSO, and VSO approaches, respectively. On the other hand, relative OC savings exploiting Jaya approach was observed 13.3% while it was 8.3%, 12.2%, and 16.1% for the GA, PSO and VSO approaches, respectively.

6. Conclusions

A newly created algorithm-specific parameter-less Jaya algorithm was executed to identify the energy saving opportunities for offshore NG liquefaction processes, and results were compared with previously used algorithms identifying the significant advantage of Jaya algorithm over others. The SMR and N2 dual expander processes were chosen as promising candidates for offshore-based LNG production projects. During the implementation of the Jaya algorithm, it was observed that its application for the design optimization of non-linear and complex LNG processes is simple, mainly due to its less algorithm-specific parameters. The constraints were handled using a penalty function approach incorporated into the objective function. So, the Jaya algorithm was applied to deduce the optimal values of key design variables and to insure a feasible temperature approach (i.e., 3 °C) inside the LNG cryogenic exchanger of both the SMR and N2 dual expander processes. A significant performance improvement in whole LNG process was observed as compared to other previously used optimization approaches. On the basis of exergy analysis, it was deduced that application of the Jaya algorithm reduced the exergy destruction in the SMR and N2 dual expander significantly and enhanced the respective thermodynamic efficiency of these processes. The outcome of composite curves analysis identified that the overall performance of the LNG heat exchanger involved in the SMR and N2 dual expander processes can be improved through implementation of the Jaya algorithm. Results of economic analysis revealed that total annualized cost (TAC) savings of 11.6% and 9.9% can be obtained in the SMR and N2 dual expander processes. Moreover, some useful results have been obtained by comparing the economic analysis results using Jaya approach with the genetic approach (GA), Particle Swarm Optimization (PSO), and the vortex search optimization (VSO) approaches.

Author Contributions

Conceptualization, A.R. and M.A.Q.; methodology, A.A.; software, M.A.Q.; formal analysis, A.R. and M.A.Q.; investigation, M.A.Q. and A.A.; data curation, M.A.Q.; writing—original draft preparation, A.R., M.A.Q., and A.A.; writing—review and editing, S.N.; supervision, M.L. and L.W. All authors have read and agreed to the published version of the manuscript.

Funding

This work was supported by the 2020 Yeungnam University Research Grant, and the Priority Research Centers Program through the National Research Foundation (NRF) of Korea funded by the Ministry of Education (2014R1A6A1031189).

Conflicts of Interest

The authors declare no conflict of interest.

Nomenclature

Variables
N2Nitrogen
C1Methane
C2Ethane
C3Propane
PPressure (bar)
TTemperature (°C)
hEnthalpy (kJ/kg)
sEntropy (kJ/kg-°C)
m ˙ Mass flow rate (kg/s)
E ˙ k Exergy rate
W ˙ Work duty (W)
$US Dollars
Subscripts
Ddestruction
Ffuel
kkth equipment
Pproduct
o ambient conditions
Acronyms
LNGLiquefied natural gas
SMRSingle mixed refrigerant
NGNatural gas
TDCCTemperature difference composite curves
THCCTemperature-heat flow composite curves
MITAMinimum internal temperature approach
FPSOFloating Production Storage and Offloading
TCFtrillion cubic feet
CBMBare module cost ($)
TCITotal capital investment ($)
OCOperating cost ($/yr)
MCMaintenance cost ($/yr)
TACTotal annualized cost ($/yr)
FLPSFloating LNG power station

References

  1. Hong, W.; Shen, S.; Huizhu, Y.; Erfeng, C.; Cai, W. Experimental investigation of Cold Energy Recovery from Cryogenic Liquid Gasification Processes. In Proceedings of the 2018 13th IEEE Conference on Industrial Electronics and Applications, Wuhan, China, 31 May–2 June 2018; pp. 1709–1714. [Google Scholar]
  2. Lozano, S.; Gutiérrez, E. Non-parametric frontier approach to modelling the relationships among population, GDP, energy consumption and CO2 emissions. Ecol. Econ. 2008, 66, 687–699. [Google Scholar] [CrossRef]
  3. United Nations. Paris Agreement; United Nations Treaty Collection 8 July 2016, Arch. 2016; UN: New York, NY, USA, 2016. [Google Scholar]
  4. Rehman, A.; Qyyum, M.; Qadeer, K.; Zakir, F.; Lee, M.; Wang, L. Integrated biomethane liquefaction using exergy from the discharging end of a liquid air energy storage system. Appl. Energy 2020, 260, 114260. [Google Scholar] [CrossRef]
  5. Althuluth, M.A.M. Natural Gas Sweetening Using Ionic Liquids. Ph.D. Thesis, Eindhoven University of Technology, Eindhoven, The Netherlands, 2014. [Google Scholar]
  6. Wang, J.; Jiang, H.; Zhou, Q.; Wu, J.; Qin, S. China’s natural gas production and consumption analysis based on the multicycle Hubbert model and rolling Grey model. Renew. Sustain. Energy Rev. 2016, 53, 1149–1167. [Google Scholar] [CrossRef]
  7. Vivoda, V. LNG import diversification in Asia. Energy Strateg. Rev. 2014, 2, 289–297. [Google Scholar] [CrossRef]
  8. Perego, C.; Bortolo, R.; Zennaro, R. Gas to liquids technologies for natural gas reserves valorization: The Eni experience. Catal. Today 2009, 142, 9–16. [Google Scholar] [CrossRef]
  9. Abas, N.; Kalair, A.; Khan, N. Review of fossil fuels and future energy technologies. Futures 2015, 69, 31–49. [Google Scholar] [CrossRef]
  10. He, T.; Chong, Z.R.; Zheng, J.; Ju, Y.; Linga, P. LNG cold energy utilization: Prospects and challenges. Energy 2019, 170, 557–568. [Google Scholar] [CrossRef]
  11. Maxwell, D.; Zhu, Z. Natural gas prices, LNG transport costs, and the dynamics of LNG imports. Energy Econ. 2011, 33, 217–226. [Google Scholar] [CrossRef]
  12. International Gas Union. 2019 World LNG Report; IGU: Barcelona, Spain, 2019; p. 126. [Google Scholar]
  13. Qyyum, M.; Qadeer, K.; Minh, L.Q.; Haider, J.; Lee, M. Nitrogen self-recuperation expansion-based process for offshore coproduction of liquefied natural gas, liquefied petroleum gas, and pentane plus. Appl. Energy 2019, 235, 247–257. [Google Scholar] [CrossRef]
  14. Qyyum, M.; Qadeer, K.; Lee, M. Comprehensive Review of the Design Optimization of Natural Gas Liquefaction Processes: Current Status and Perspectives. Ind. Eng. Chem. Res. 2018, 57, 5819–5844. [Google Scholar] [CrossRef]
  15. Shah, N.M.; Hoadley, A.F.A.; Rangaiah, G.P. Inherent Safety Analysis of a Propane Precooled Gas-Phase Liquified Natural Gas Process. Ind. Eng. Chem. Res. 2009, 48, 4917–4927. [Google Scholar] [CrossRef]
  16. Gao, T.; Lin, W.; Gu, A.; Gu, M. Coalbed methane liquefaction adopting a nitrogen expansion process with propane pre-cooling. Appl. Energy 2010, 87, 2142–2147. [Google Scholar] [CrossRef]
  17. Aspelund, A.; Gundersen, T.; Myklebust, J.; Nowak, M.P.; Tomasgard, A. An optimization-simulation model for a simple LNG process. Comput. Chem. Eng. 2010, 34, 1606–1617. [Google Scholar] [CrossRef]
  18. Khan, M.S.; Lee, S.; Lee, M. Optimization of single mixed refrigerant natural gas liquefaction plant with nonlinear programming. Asia Pac. J. Chem. Eng. 2012, 7, S62–S70. [Google Scholar] [CrossRef]
  19. Khan, M.S.; Lee, M. Design optimization of single mixed refrigerant natural gas liquefaction process using the particle swarm paradigm with nonlinear constraints. Energy 2013, 49, 146–155. [Google Scholar] [CrossRef]
  20. Wahl, P.E.; Løvseth, S.W.; Mølnvik, M.J. Optimization of a simple LNG process using sequential quadratic programming. Comput. Chem. Eng. 2013, 56, 27–36. [Google Scholar] [CrossRef] [Green Version]
  21. He, T.; Ju, Y. A novel conceptual design of parallel nitrogen expansion liquefaction process for small-scale LNG (liquefied natural gas) plant in skid-mount packages. Energy 2011, 31, 1091–1098. [Google Scholar] [CrossRef]
  22. Khan, M.S.; Lee, S.; Hasan, M.; Lee, M. Process knowledge based opportunistic optimization of the N2−CO2 expander cycle for the economic development of stranded offshore fields. J. Nat. Gas Sci. Eng. 2014, 18, 263–273. [Google Scholar] [CrossRef]
  23. Song, K.; Lee, S.; Shin, S.; Lee, H.J.; Han, C. Simulation-Based Optimization Methodology for Offshore Natural Gas Liquefaction Process Design. Ind. Eng. Chem. Res. 2014, 51, 5539–5544. [Google Scholar] [CrossRef]
  24. Khan, M.S.; Lee, S.; Getu, M.; Lee, M. Knowledge inspired investigation of selected parameters on energy consumption in nitrogen single and dual expander processes of natural gas liquefaction. J. Nat. Gas Sci. Eng. 2015, 23, 324–337. [Google Scholar] [CrossRef]
  25. Khan, M.S.; Karimi, I.A.; Bahadori, A.; Lee, M. Sequential coordinate random search for optimal operation of LNG (liquefied natural gas) plant. Energy 2015, 89, 757–767. [Google Scholar] [CrossRef]
  26. He, T.; Ju, Y. Optimal synthesis of expansion liquefaction cycle for distributed-scale LNG (liquefied natural gas) plant. Energy 2015, 88, 268–280. [Google Scholar] [CrossRef]
  27. Qyyum, M.; Yasin, M.; Nawaz, A.; He, T.; Ali, W.; Haider, J.; Qadeer, K.; Nizami, A.; Moustakas, K.; Lee, M. Single-Solution-Based Vortex Search Strategy for Optimal Design of Off shore and Onshore Natural Gas Liquefaction Processes. Energies 2020, 13, 1732. [Google Scholar] [CrossRef] [Green Version]
  28. He, T.; Karimi, I.A.; Ju, Y. Review on the design and optimization of natural gas liquefaction processes for onshore and offshore applications. Chem. Eng. Res. Des. 2018, 132, 89–114. [Google Scholar] [CrossRef]
  29. Khan, M.S.; Karimi, I.A.; Wood, D.A. Retrospective and future perspective of natural gas liquefaction and optimization technologies contributing to efficient LNG supply: A review. J. Nat. Gas Sci. Eng. 2017, 45, 165–188. [Google Scholar] [CrossRef]
  30. Venkata Rao, R. Jaya: An Advanced Optimization Algorithm and its Engineering Applications; Springer: Berlin, Germany, 2009; ISBN 978-3-319-78922-4. [Google Scholar]
  31. Shi, X.; Che, D. A combined power cycle utilizing low-temperature waste heat and LNG cold energy. Energy Convers. Manag. 2010, 50, 567–575. [Google Scholar] [CrossRef]
  32. Wang, J.; Wang, J.; Dai, Y.; Zhao, P. Thermodynamic analysis and optimization of a transcritical CO2 geothermal power generation system based on the cold energy utilization of LNG. Appl. Therm. Eng. 2014, 70, 531–540. [Google Scholar] [CrossRef]
  33. Tak, K.; Lim, W.; Choi, K.; Ko, D.; Moon, I. Optimization of Mixed-Refrigerant System in LNG Liquefaction Process; Elsevier: Amsterdam, The Netherlands, 2011; Volume 29. [Google Scholar]
  34. Majeed, K.; Qyyum, M.A.; Nawaz, A.; Ahmad, A.; Naqvi, M.; He, T.; Lee, M. Shuffled Complex Evolution-Based Performance Enhancement and Analysis of Cascade Liquefaction Process for Large-Scale LNG Production. Energies 2020, 13, 2511. [Google Scholar] [CrossRef]
  35. Qyyum, M.; Lee, M. Hydrofluoroolefin-based novel mixed refrigerant for energy efficient and ecological LNG production. Energy 2018, 157, 483–492. [Google Scholar] [CrossRef]
  36. Remeljej, C.W.; Hoadley, A.F.A. An exergy analysis of small-scale liquefied natural gas (LNG) liquefaction processes. Energy 2006, 31, 2005–2019. [Google Scholar] [CrossRef]
  37. Linnhoff, B.; Szargut, J.; Tsatsaronis, G.; Kolenda, Z.; Ziebik, A. Pinch analysis and exergy—A comparison. In Proceedings of the Energy Systems and Ecology, International Conference, Krakow, Poland, 5–9 July 1993. [Google Scholar]
  38. Anantharaman, A.; Abbas, O.S.; Gundersen, T. Energy level composite curves—A new graphical methodology for the integration of energy intensive processes. Appl. Therm. Eng. 2006, 26, 1378–1384. [Google Scholar] [CrossRef]
  39. Bejan, A.; Tsatsaronis, G.; Moran, M. Thermal Design and Optimization; John Wiley & Sons, Ltd.: Hoboken, NJ, USA, 1996. [Google Scholar]
  40. Ansarinasab, H.; Mehrpooya, M.; Mohammadi, A. Advanced exergy and exergoeconomic analyses of a hydrogen liquefaction plant equipped with mixed refrigerant system. J. Clean. Prod. 2017, 144, 248–259. [Google Scholar] [CrossRef]
  41. Wood, M.E.; Potter, W.H. General analysis of magnetic refrigeration and its optimization using a new concept: Maximization of refrigerant capacity. Cryogenics 1985, 25, 667–683. [Google Scholar] [CrossRef]
  42. Iwasaki, W. Magnetic refrigeration technology for an international clean energy network using hydrogen energy (WE-NET). Int. J. Hydrog. Energy 2003, 28, 559–567. [Google Scholar] [CrossRef]
  43. Venkatarathnam, G.; Timmerhaus, K.D. Cryogenic Mixed Refrigerant Processes; Springer: New York, NY, USA, 2008. [Google Scholar]
  44. Luyben, W.; Chien, I. Design and Control of Distillation Systems for Separating Azeotropes; John Wiley & Sons, Ltd.: Hoboken, NJ, USA, 2011; ISBN 9780132618120. [Google Scholar]
  45. Turton, R.; Bailie, R.C.; Whiting, W.B.; Shaeiwitz, J.A. Analysis, Synthesis and Design of Chemical Processes; Pearson Education: London, UK, 2008. [Google Scholar]
  46. Nomura Research Institute, Ltd. Feasibility Study on Floating LNG Power Station in Thailand; IHI Corporation: Tokyo, Japan, 2019. [Google Scholar]
Figure 1. Breakdown of liquefied natural gas (LNG) project cost by relative expenditure [13].
Energies 13 03278 g001
Figure 2. Schematic diagram of the N2 dual expander LNG process.
Energies 13 03278 g002
Figure 3. Schematic diagram of the single mixed refrigerant (SMR) LNG process [20].
Energies 13 03278 g003
Figure 4. Flowchart of the Jaya algorithm.
Energies 13 03278 g004
Figure 5. Temperature and heat-flow curves (THCCs) of base and optimized cases for CHX-01 of (a) SMR and (b) N2 dual expander LNG processes.
Energies 13 03278 g005
Figure 6. Temperature difference composite curves (TDCCs) of base and optimized cases for CHX-01 of (a) SMR and (b) N2 dual expander LNG processes.
Energies 13 03278 g006
Figure 7. Exergy destruction comparison in SMR LNG process (base and optimized cases).
Energies 13 03278 g007
Figure 8. Exergy destruction comparison in N2 dual expander LNG process (base and optimized cases).
Energies 13 03278 g008
Figure 9. Percentage of exergy destruction by each equipment in the optimized case of the SMR LNG process.
Energies 13 03278 g009
Figure 10. Percentage of exergy destruction by each equipment in the optimized case of the N2 dual expander LNG process.
Energies 13 03278 g010
Figure 11. Net exergy destruction comparison in SMR and N2 dual expander LNG processes and corresponding thermodynamic efficiency.
Energies 13 03278 g011
Figure 12. Economic analysis of SMR LNG process.
Energies 13 03278 g012
Figure 13. Economic analysis of N2 dual expander process LNG process.
Energies 13 03278 g013
Figure 14. Economic analysis comparison for SMR processes using Jaya, Genetic Algorithm (GA), Particle Swarm Optimization (PSO), and vortex search optimization (VSO) approaches.
Energies 13 03278 g014
Table 1. Air pollutants emission per billion kJ energy production (in kg) [5].
PollutantsNGOilCoal
Nitrous oxide41203207
Sulfur dioxide0.275041175
Carbon dioxide53,07074,38994,347
Carbon monoxide181594
Mercury0.00.0030.007
Formaldehyde0.340.10.1
Particulates3381245
Table 2. Literature survey on design optimization of single mixed refrigerant (SMR) and N2 expander LNG processes.
ProcessConditions [T, P, m] Simulator/EOSLNG Liquid Fraction (%)/Temp (°C)Isentropic Efficiency (%) Compressor/ExpanderMITA (C)Optimization AlgorithmValue of Objective FunctionRef. Year
Propane precooled dual N2(30 °C, 55 bar, 22.6 kg/s)HYSYS, PRN.G/−16080.0/80.0>2.0non-dominated sorting genetic algorithm (NSGA-II)25.5 MW Shah et al., 2009 [15]
Propane precooled N2 expander(35 °C, 1.0 bar, 1 kmol/h)HYSYS, PR95/N.G80.0/85.03HYSYS optimizer0.75 kWh/Nm3Gao et al., 2010 [16]
SMR(20 °C, 60 bar, 360,000 kg/h)HYSYS/NG100/NG80/NA2.93Tabu search (TS) and Nelder–Mead Downhill Simplex (NMDS)144,500 kWAspelund et al., 2010 [17]
SMR(32 °C, 50 bar, 1.0 kg/h)HYSYS/PR92/N.G75/NA3Non-linear programming (NLP)0.4244 kWKhan et al., 2011 [18]
SMR(32 °C, 50 bar, 1.0 kg/h)Unisim, PR92/N.G75/NA3.01Knowledge-Based Optimization (KBO)0.432 kWKhan and Lee 2013 [19]
SMR(20 °C, 60 bar, 100 kg/s)HYSYS/SRK100/NG80/NA2.6SQP143 MWWahl et al., 2013 [20]
Parallel N2 expander process(32 °C, 5 bar, 1812 kg/h)HYSYS/PR95.5/NG80/80>3Genetic Algorithm (GA)0.5163 kWh/Nm3He et al., 2014 [21]
N2-CO2 expander(32 °C, 50 bar, 1 kg/h)HYSYS/PR and LK92/N.G75/753Knowledge-Based Optimization (KBO)0.4945 kWKhan et al., 2014 [22]
N2 dual expander(32 °C, 50 bar, 1 MTPA = 114,155 kg/h)HYSYS/PRNG/−155NG3Empirical Modeling45,938 kWSong et al., 2014 [23]
N2 dual expander(30 °C, 50 bar, 1 kg/h)HYSYS/PR92/−158.575/753Knowledge Inspired0.5007 kWh/kg-LNGKhan et al., 2014 [24]
SMR(32 °C, 50 bar, 1 kg/h)HYSYS/PR and LK92/NG75/NA3Sequential Coordinate Random Search (SCRS)0.440 kWKhan et al., 2015 [25]
R410a precooled parallel nitrogen expansion(20 °C, 50 bar, 1633 kg/h)HYSYS/PR97.8/−158.280/853Genetic Algorithm (GA)0.376 kWh/Nm3He et al., 2015 [26]
SMR(32 °C, 50 bar, 1 kg/h)HYSYS/PR92/−158.575/NA3Genetic Algorithm (GA)0.403 kWh/kg-LNGQyyum et al., 2020 [27]
SMR(32 °C, 50 bar, 1 kg/h)HYSYS/PR92/−158.575/NA3Particle Swarm Optimization (PSO)0.386 kWh/kg-LNGQyyum et al., 2020 [27]
SMR(32 °C, 50 bar, 1 kg/h)HYSYS/PR92/−158.575/NA3Vortex Search
Optimization (VSO)
0.369 kWh/kg-LNGQyyum et al., 2020 [27]
NG: not given, NA: not applicable.
Table 3. Natural gas feed conditions and assumptions adapted from [25].
PropertyConditions
NG Feed Condition
Flow rate1.0 kg/h
Temperature32.0 °C
Pressure50 bar
NG Feed CompositionMole Fraction
Methane0.9133
Ethane0.0536
Propane0.0214
n-Butane0.0047
i-Butane0.0046
n-Pentane, i-Pentane0.0001
Nitrogen0.0022
Table 4. Heat exchanger model for SMR and N2 dual expander LNG process.
CharacteristicsFor Heat Exchanger (CHX-01)For Coolers (E-1 to E-4)
Heat exchanger typeLNG-100Air cooler simple design
ConfigurationPlate fin heat exchangerOne tube row, one pass
Flow alignmentConcurrent for streams 1 and 14; Countercurrent for streams 1 and 5 in SMR process;
Concurrent for streams A and 12, 13; Countercurrent for streams A and 16, 17 in N2 dual expander process
Crossflow
Cooling medium-Air
Air intake temperature, pressure-25.0 °C, 1.0132 bar
Table 5. Objective function, constraint, and design variables for N2 dual expander and SMR processes.
Objective function
Specific compression power M i n i m i z e   f ( X ) = M i n . ( i = 0 n W i m N G )
Design constraint
Minimum internal approach temperature (°C) M I T A ( X ) C H X - 01 3.0
where,
X l o w e r < X < X u p p e r
and X is a vector of the decision variables.
Decision variablesLower boundUpper bound
Design variables for SMR Process
MR high pressure, P2 (bar)35.070.0
Evaporation pressure, P4 (bar)1.14.0
Nitrogen flow rate, m N 2 (kg/h)0.10.65
Methane flow rate, m C 1 (kg/h)0.250.85
Ethane flow rate, m C 2 (kg/h)0.451.15
Propane flow rate, m C 3 (kg/h)2.03.5
Design variables for N2 dual expander process
N2 Low P (bar)820
N2 mid P (bar)1830
N2 high P (bar)70120
Mid expansion T (°C)−130−70
N2 split fraction0.52
High pressure expander inlet temperature (°C)−110−60
N2 mass flow (kg/h)1020
Table 6. Initial population generated over decision variables of the SMR process.
Candidate SolutionsmC3 (k/h)mC2 (kg/h)mC1 (kg/h)mN2 (kg/h)P2 (bar)P1 (bar)MITAf(x) Using Equation (2)f(x) Using Equation (3)Status
12.50.87220.67070.349660.441.313−2.6956.2415701.2Worst
22.6330.8690.67070.35612.324.6870.4370.437Best
32.70.960.660.287131.5911.8151410.8
42.91.20.710.32652.891.9871.4621014.5
53.322.27.31.5583.331.4853.3911518.4
Table 7. New values of decision variables and corresponding energy during the first iteration.
Candidate SolutionsmC3 (kg/h)mC2 (kg/h)mC1 (kg/h)mN2 (kg/h)P2 (bar)P1 (bar)MITAf(x) Using Equation (2)f(x) Using Equation (3)Status
12.57710.87030.67070.349860.76481.89711.6661.81341.8
22.74070.86640.67070.350361.45363.13573.1390.39440.3944Best
32.82310.97830.65750.264273.75363.9721−0.67654.0423680.5Worst
43.071.27350.7190.313466.37363.83683.6510.55210.5521
53.58572.50358.821.764857.764.3782.4032.58599.58
Table 8. Updated candidate solutions for the SMR process after comparing Table 5 and Table 6 (first iteration completed).
Candidate SolutionsmC3 (kg/h)mC2 (kg/h)mC1 (kg/h)mN2 (kg/h)P2 (bar)P1 (bar)MITAf(x) Using Equation (2)f(x) Using Equation (3)Status
12.57710.87030.67070.349860.76481.89711.6661.81341.8
22.74070.86640.67070.350361.45363.13573.1390.39440.3944Best
32.70.960.660.287131.5911.8151410.8Worst
43.071.27350.7190.313466.37363.83683.6510.55210.5521
53.58572.50358.821.764857.764.3782.4032.58599.58
Table 9. New values of decision variables and the corresponding energy for the SMR process during the second iteration.
Candidate SolutionsmC3 (kg/h)mC2 (kg/h)mC1 (kg/h)mN2 (kg/h)P2 (bar)P1 (bar)MITAf(x) Using Equation (2)f(x) Using Equation (3)Status
12.57580.84350.67380.370157.94121.8374−5.2338.701824,107Worst
22.75250.83930.67380.370758.68213.17513.3370.39060.3906Best
32.70850.94030.66220.294868.99533.0281.9251.4791076.5
43.10811.27890.72600.330863.99873.93220.67152.7412331.2
53.66512.60739.47501.898354.69614.51672.2322.810770.81
Table 10. Updated candidate solutions of the SMR process after comparing Table 6 and Table 7 (second iteration completed).
Candidate SolutionsmC3 (kg/h)mC2 (kg/h)mC1 (kg/h)mN2 (kg/h)P2 (bar)P1 (bar)MITAf(x) Using Equation (2)f(x) Using Equation (3)Status
12.57710.87030.67070.349860.76481.89711.6661.81341.8Worst
22.75250.83930.67380.370758.68213.17513.3370.39060.3906Best
32.70850.94030.66220.294868.99533.0281.9251.4791076.5
43.071.27350.7190.313466.37363.83683.6510.55210.5521
53.58572.50358.821.764857.764.3782.4032.58599.58
Table 11. Optimization results: summary and comparison.
ParametersN2 Dual Expander ProcessSMR Process
Base CaseOptimizedBase CaseOptimized
High pressure of refrigerant (bar)90.0105.048.060.44
Low Pressure of refrigerant (bar)12.09.91.33.31
Mid pressure of refrigerant (bar)22.4328.5--
Refrigerant splitting ratio 0.76230.8072--
Nitrogen flow rate, m ˙ N 2 (kg/h)14.4313.280.26900.3496
Methane flow rate, m ˙ C 1 (kg/h)--0.52900.6707
Ethane flow rate, m ˙ C 2 (kg/h)--0.61900.8722
Propane flow rate, m ˙ C 3 (kg/h)--2.9502.633
MITA ( ) 4.933.05.43.0
Liquefaction rate (%)92.092.092.092.0
Required specific power (kWh/kg-NG)0.63370.55990.44520.3815
Relative energy saving (%)-11.64-14.30
Table 12. Exergy destruction values for SMR and N2 dual expander LNG processes (values in W).
EquipmentSMRN2 Dual Expander
BaseOptimizedBaseOptimized
Compressors
K12422810
K22421810
K323207363
K420177364
Water coolers
E1131125
E2151347
E317156051
E432276857
Expanders
K5--10192
K6--3938
Heat exchanger
CHX-01129938551
Valve
VLV-1313088
VLV-288--
Total337278530456
Table 13. Actual work and thermodynamic efficiency of LNG and N2 dual expander processes.
Process CasesActual Power (kW)Thermodynamic Efficiency (%)
SMRBase0.4422.32
Optimized0.3825.74
N2 dual expanderBase0.6315.50
Optimized0.5517.54
Table 14. Types of cost along with corresponding equations for cost estimation.
Cost Types Equations
Equipment purchase costCp ($) log 10 ( C p ) = k 1 + k 2 log 10 A + k 3 ( log 10 A ) 2
Bare module costCBM ($) C BM =   C P F BM
Total capital investmentTCI ($) TCI   = 1.18   i n C BM , i
Operating costOC ($/yr) OC   =   cos t   of   electricity ( $ kW   per   8760   hr ) × ( total   compression   power )
Maintenance costMC ($/yr) MC   =   TCI × 0.02
Total annualized costTAC ($/yr) T A C = ( T C I   ( $ ) P a y b a c k   p e r i o d   ( y r ) ) + OC   ( $ / yr ) + MC ($/yr)
Table 15. Equipment parameters used for economic analysis.
EquipmentN2 Dual Expander Process SMR Process
BaseOptimizedBaseOptimized
Compressors work duty (kW)
K14213549013,21611,655
K24409575013,13811,487
K343,22837,27212,61710,877
K444,20338,08711,2589528
Expanders work duty (kW)
K518,97218,029--
K647434649--
Coolers UA values (W/°C)
E1337,088904,12313,494,41814,013,510
E23,202,3492,815,12120,245,2995,565,554
E325,565,11641,316,8058,371,2379,354,074
E432,099,74122,653,12423,418,76221,242,648
Main exchanger UA values (W/°C)
CHX-014,831,5375,700,1907,823,25013,567,172

