1. Introduction
Floating offshore wind turbines (FOWTs) are large and complex structural systems exposed to a variety of simultaneous environmental actions. A reliable prediction of the dynamic behaviour of a FOWT, and the associated loads, requires a proper modelling of the multiple fluid–structure interaction problems involved. Moreover, the design of very large wind turbines (WTs) (10 MW and more), with significantly taller tower and slender rotor blades compared to the average sizes of the currently installed machines, calls for new optimal design techniques of the supporting platforms. Past studies addressing medium-size WT platforms (3–5 MW) focused on different platform stability classes. In [
1], Wayman and Sclavounos investigated the stability and the response of a barge-like platform and a Tension Leg Platform (TLP). They provided useful information to assess static stability and developed a simplified frequency domain (FD) model to evaluate the interaction between the wind turbine and the floating system. Robertson and Jonkman [
2] compared results from different 5 MW FOWT concepts with a land-based turbine in terms of both ultimate and fatigue loads. They found that for barge-like platforms, the land-to-sea load amplification was unsustainable. Key aspects, such as fatigue loads, ringing phenomena and wind-wave misalignment for different kind of FOWTs have been investigated in [
3,
4,
5], respectively. Nonlinear wave kinematics and higher-order effects have been studied in [
6,
7,
8,
9]. Effects that the interaction between the platform oscillations and the turbulent aerodynamic loads may have on the performance of a WT are analysed in [
6,
10] and [
11].
Compared to on-land installations, the design of FOWTs involves a larger number of design variables, which require design optimisation procedures capable of considering the coupled hydro-aero-servo-elastic behaviour of the whole system. Sclavounos et al. [
12] optimised different FOWT concepts by using a simplified FD model. Brommundt et al. [
13] performed a design optimisation of mooring lines for a 5 MW FOWT under two targeted environmental conditions. Karimi et al. [
14] performed an FD multi-objective design optimization of a 5 MW WT supported by a semisubmersible platform and a TLP considering both cost and structural performance as objective functions.
With increasing rotor diameters, above 200 m and 10 MW rated power, rational upscaling techniques [
15] based on power ratios have been proposed to directly design platforms for large turbines. Liu et al. [
16] evaluated the short-term and long-term dynamic response of an upscaled 13.2 MW wind turbine platform by means of time-domain stochastic simulations. New mooring lines configurations, suitable for such large FOWTs, were investigated in [
17], considering wind-wave misalignment. In [
18], Hsu et al. incorporated the effects of snap loads in the mooring lines dynamic tension probability distribution. They found that neglecting snap effects could lead to an underestimation of the maximum tension. Additionally, new typologies of platform shapes, such as the tri-spar floater, were studied [
19]. Experimental studies of different platforms were also conducted in [
20,
21] for medium-size wind turbines and in [
22] for a 10 MW WT.
Although several critical aspects for very large FOWTs have been addressed to date, the design of optimal platforms supporting 10 MW + WTs is still an open problem. The question we attempt to answer in this work is whether, after a rational upscaling process (see e.g., [
15,
16]), there is still room for improving the platform dimensions. To answer this question, in the present work, an optimal semisubmersible platform is sought, considering two geometry variables, namely the diameter of the outer cylinders and their radial distance from the platform centre. The goal is to identify a platform configuration able to most efficiently contrast the combined wind-wave action, keeping the platform dimensions as small as possible. Our assumption is that the upscaling techniques may lead to overdesigned platforms, resulting in unnecessary material (and cost) for the supporting system. Since the present paper is the first contribution to a wider project aimed at providing guidance for the optimal design of large semisubmersible platforms involving many design variables, a trade-off between accuracy and computational efficiency is a fundamental requirement. For this reason, we perform simulations in the FD. We consider both radiation/diffraction forces as well as viscous forces from the Morison equation [
23]. Mooring lines and wind turbine contributions to the equation of motion are computed as additional mass, damping and stiffness matrices resulting from a linearisation analysis performed with FAST [
24] around operational points.
To verify our computational model, first, the OC4 5 MW National Renewable Energy Laboratory (NREL) semisubmersible floating wind turbine [
25,
26,
27] is studied and the results are compared with the results available in [
26]. Then, a parametric study of a semisubmersible platform suitable for a 10 MW wind turbine is performed. The amplitude of the RAOs peaks and the area of the RAOs over the excited band of frequencies for the heave and pitch degrees of freedom (DoFs) are chosen as targets to be minimised. The first gives information directly related to the eigenfrequencies, while the latter provides information on the dynamic behaviour of the platform outside the natural frequencies. The results are discussed and compared with an upscaled 10 MW wind turbine model [
28].
2. Frequency Domain Model
In this study, coupled hydro-aero-servo-elastic simulations are performed with FAST [
24], an open source code developed at the National Renewable Energy Laboratory (NREL). FAST is capable of performing time domain simulations of the dynamic response of a WT in a stochastic wind and wave environment by coupling aerodynamic, hydrodynamic, control and structural models. In FAST, flexible elements, such as rotor blades and towers, are modelled as Bernoulli–Euler beams; the aerodynamic model is based on the Blade Element Momentum theory [
29]; the hydrodynamic model permits considering both first and second order hydrodynamic loads [
30], evaluated by external codes (e.g., WAMIT or ANSYS AQWA), as well as Morison forces for slender elements.
FD models neglect or approximate non-linear effects and are restricted to steady load conditions. Several important nonlinear and transient effects on fixed-bottom WTs have been observed in [
28,
29,
30,
31,
32,
33,
34]. For floating platforms, slow-drift and mean-drift force [
7], third-order hydrodynamic contributions [
8], and fully nonlinear wave kinematics [
9] have been recently investigated, and it was found that nonlinearities significantly affect fatigue damage, as well as mooring line tension at high sea states. Nonlinear effects are important for a safe platform design and must be considered in the actual design process. Uzunoglu and Guedes Soares [
35] compared the results obtained by OC5 Project Phase II [
27] and demonstrated that the difference in the hydrodynamic modelling has a significant effect on the results. Nevertheless, FD-based approaches, thanks to their efficiency, may offer a guidance in the pre-screening phase of an optimisation-based design. Most of the proposed FD approaches superimpose the turbine contribution in terms of mass, damping and stiffness matrices to the hydrodynamic contribution due to the floating platform. Philippe et al. [
36] coupled an in-house radiation/diffraction potential solver with FAST. Wang et al. [
37] proposed an alternative FD model which adopts ANSYS AQWA [
38] to evaluate hydrodynamics contributions and simplified the formulas to consider the rotor thrust forces and the gyroscopic effects.
The model used in this paper is similar to the one proposed in [
36] coupled with ANSYS AQWA as in [
37], but incorporates approximated nonlinear effects due to quadratic drag and heave plate damping [
14]. The wind turbine and its aerodynamics, as well as the mooring lines, are modelled as mass, damping and stiffness matrices. They are evaluated trough a linearisation analysis in FAST_v7 around the operating point. The dynamics of the system are linearised, neglecting phase shifting. The periodic response amplitude at each wave frequency is calculated and then superimposed.
2.1. Hydrodynamic Model
For the sake of completeness, in this section, we briefly summarise the standard theories [
39,
40] we used to model the fluid–structure interaction problem.
The platform hydrodynamic model requires a potential flow solver to calculate the frequency-dependent added mass, radiation damping and diffraction forces; the first and the second do not depend on the wave heading direction and amplitude, while the third does. Assuming an inviscid and incompressible fluid, a velocity potential
exists. Under the hypothesis of small displacements and rotations, the body boundary condition and the free surface conditions can be linearised, isolating the time dependency of the potential, as follows:
where ω is the circular frequency, g is the gravity acceleration, z is the vertical coordinates and φ is the time-independent part of the velocity potential
. Considering a steady-state condition, the velocity potential can be rewritten, isolating the time dependence and splitting into three contributions:
where φ
D is the diffraction potential, which collects the incident wave and scattering potential, and φ
R is the radiation potential. The dynamic pressure p at the wetted body surface is then calculated by means of the linearised Bernoulli equation:
where
ρ is the water density. Integrating the dynamic pressure on the wetted surface, the added mass (Equation (4)), radiation damping (Equation (5)), and diffraction forces (Equation (6)) are evaluated, respectively, as follows:
These three contributions are dominant on bluff bodies, such as barge-like elements or cylinders where λ/D < 5, λ being the wavelength and D, the cylinder diameter. When dealing with slender elements, such as cross braces of a semisubmersible platform, inertia and viscous drag forces due to flow separation become dominant. On such elements, the wave-induced force per unit-length can be expressed by Morison equation as
where
u is the wave velocity component normal to the member axis,
,
are the cylinder velocity and acceleration, C
M is the inertial coefficient, C
A is the added-mass mass coefficient and
CD is the viscous drag coefficient. The last two terms of the right-hand side of Equation (7) are expressed as a function of the six DoFs of the platform regarded as a rigid body. The viscous drag term being quadratic requires a linearization. The Borgman linearisation [
41] is herein adopted, namely, the nonlinear drag term is approximated with an equivalent linear term written as
where σ
u is the standard deviation of the relative velocity. As a first approximation, in this study, σ
u is replaced by the standard deviation of the exciting wave. Denoting with
η the vector of the six rigid platform DoFs
—referring to surge, sway, heave, roll, pitch and yaw, respectively—the linearised Morison force can be rewritten as a function of
η as follows:
where
T is a transport matrix, which permits expressing the velocity of the members as a function of the six platform DoFs.
The hydrodynamic loads on the heave plates are described with a modified Morison equation [
25], able to take into account inertial, viscous and dynamic effects:
where C
Az = 1 is the added mass coefficient in the heave direction; C
Dz is the drag coefficient in the heave direction, equal to 4.8 according to [
25]; w is the vertical component of the wave particle velocity;
is the heave velocity of the heave plates; D
h is the diameter of the heave plates; D
c is the diameter of the upper column; and p
b and p
t are respectively the dynamic pressures, projected in the direction of the normal vectors, at the bottom and at the top of the heave plates. V
R is the reference volume, i.e., the volume of fluid that is displaced by the oscillations of the heave plates, calculated as
where A
33(0) is the zero-frequency added mass coefficient in the heave direction. The viscous drag term is linearised according to [
42] as follows:
where ω is the wave frequency and a is the heave plate oscillation amplitude. By expressing the velocity and the acceleration of the heave plates as a function of the six platform DoFs, the contributions of the heave plates to the mass and damping matrices are calculated.
2.2. Equation of Motion
The equation of motion of the FOWT is
where
is the complex amplitude displacement vector of the platform.
is the added mass matrix,
is the radiation damping matrix,
CHydrostatic is the hydrostatic stiffness matrix,
Cmooring is the linearised mooring lines matrix,
FD is the diffraction force acting on bluff cylinders and
FMorison is the Morison force acting on slender cylinders. Considering Equation (14), the equation of motion can be rewritten as
By solving the above linear system for
, the Response Amplitude Operator (RAO), i.e., the linear transfer function of the dynamic system, is evaluated as follows:
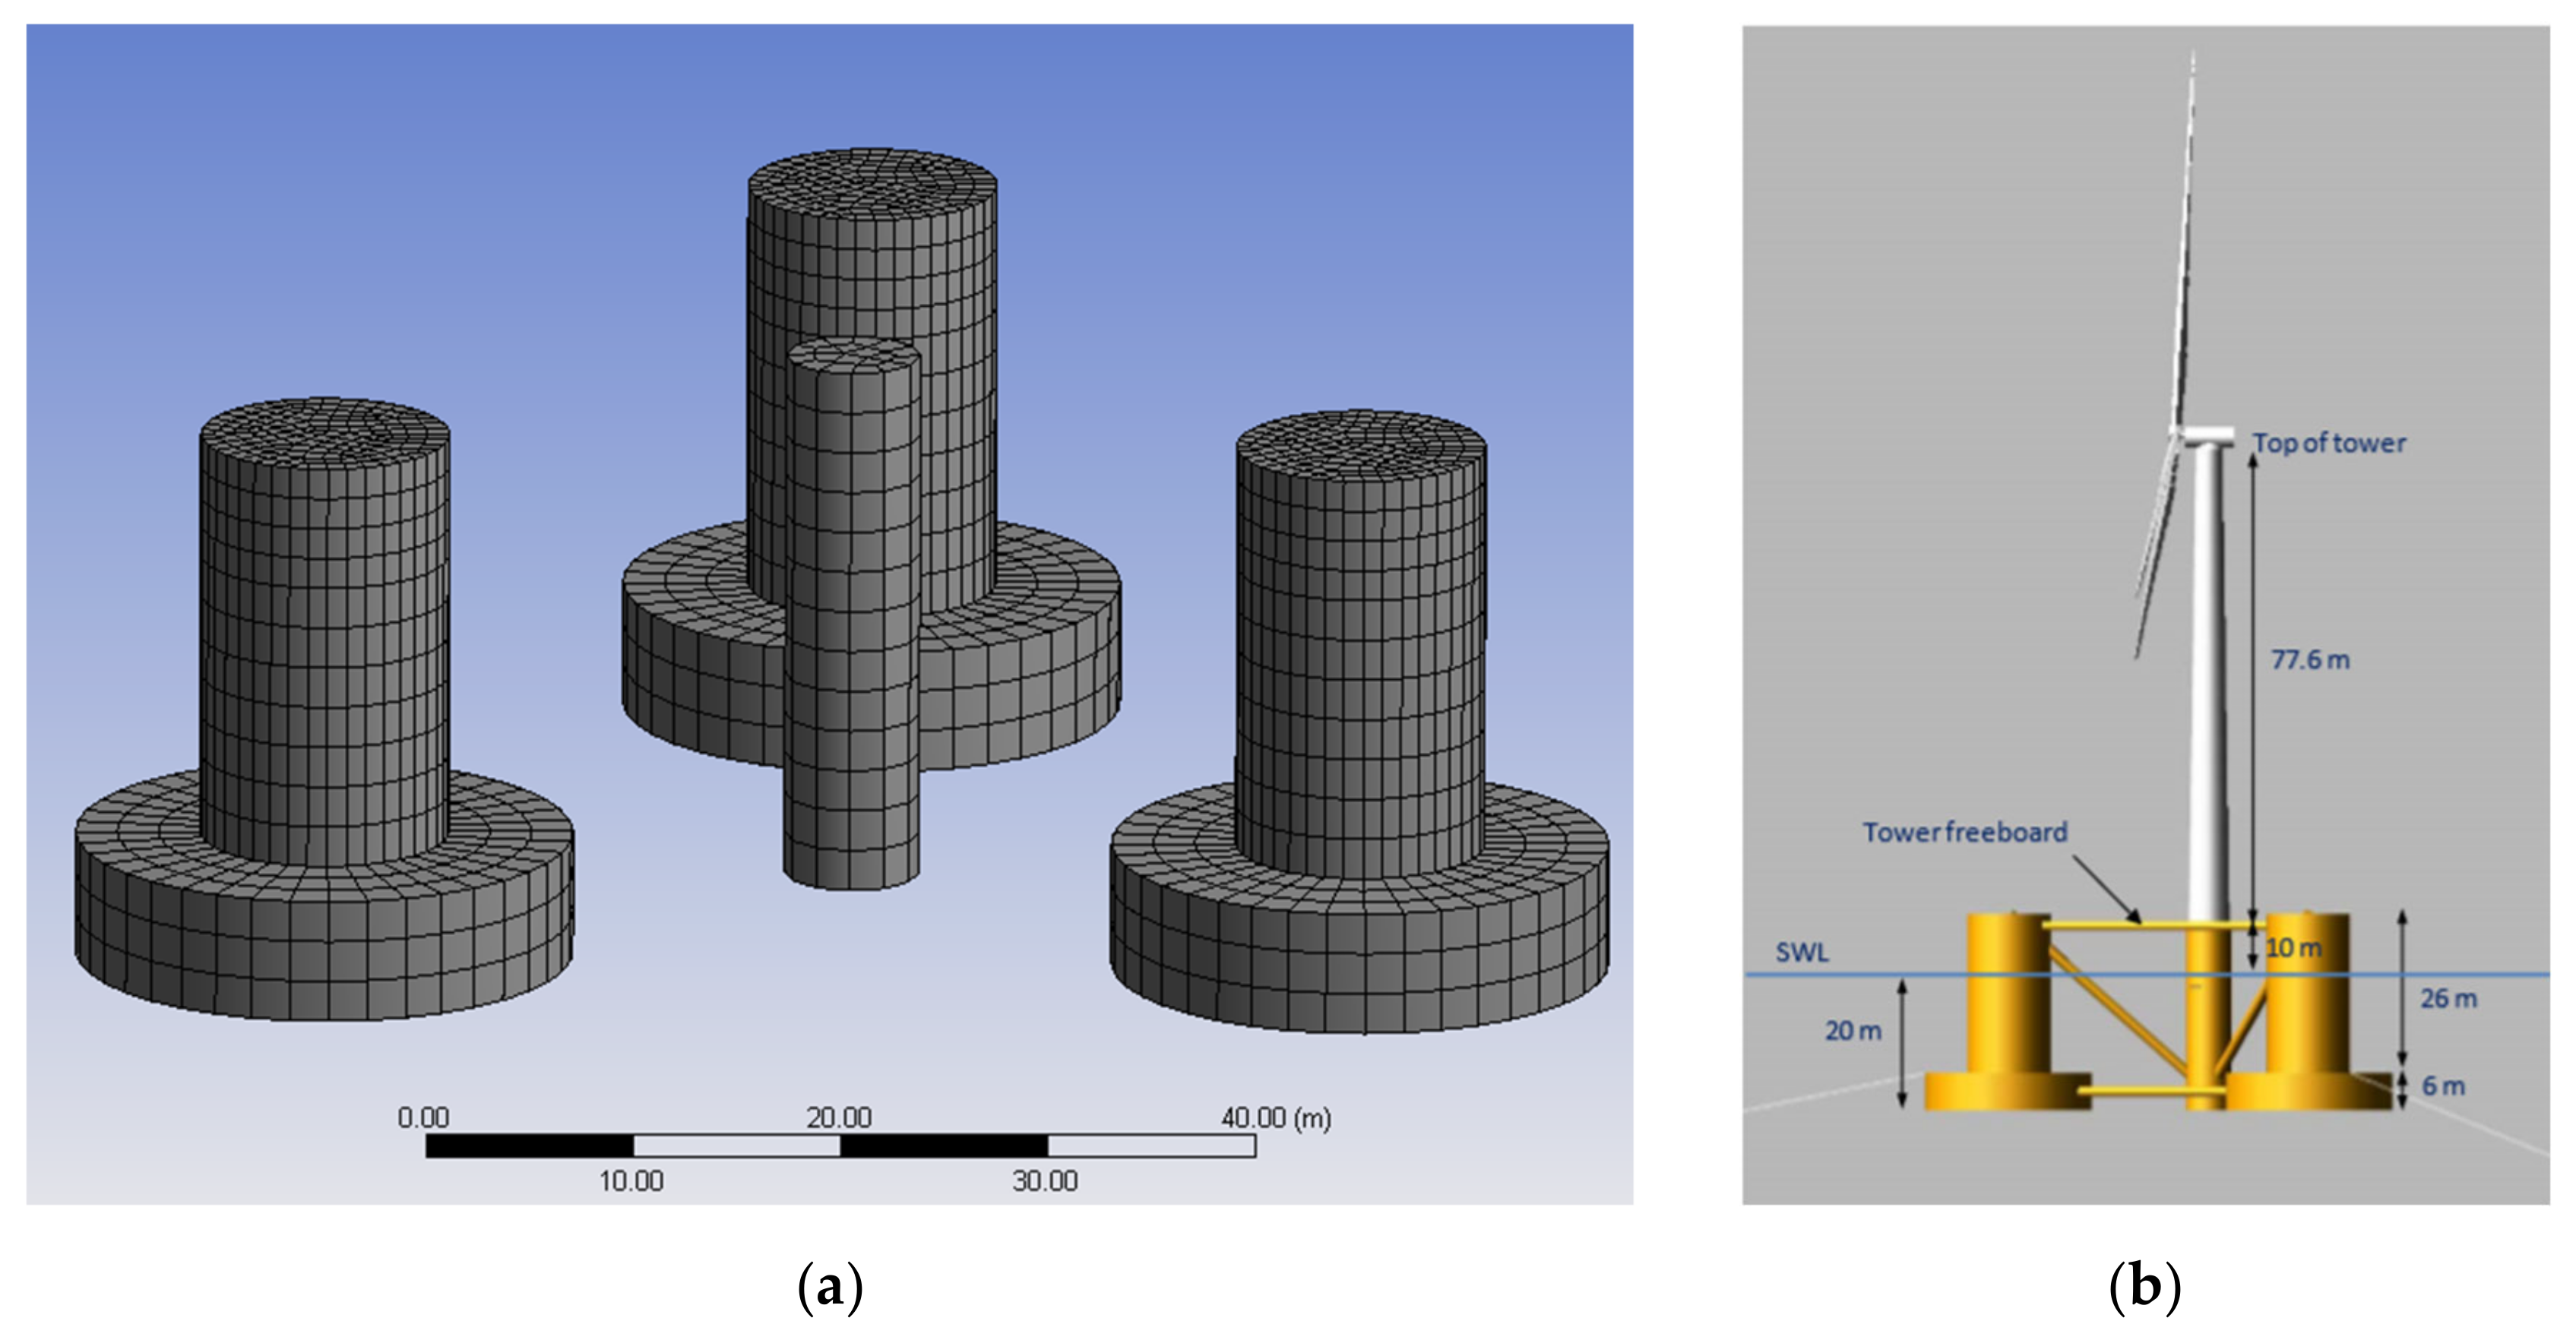
2.3. Verification with the 5 MW DeepCwind Semisubmersible Platform
To verify our FD model, in this section, we compare our results with those available in the literature referring to the 5MW OC4 DeepCwind [
25] semisubmersible platform (see
Table 1 and
Figure 1).
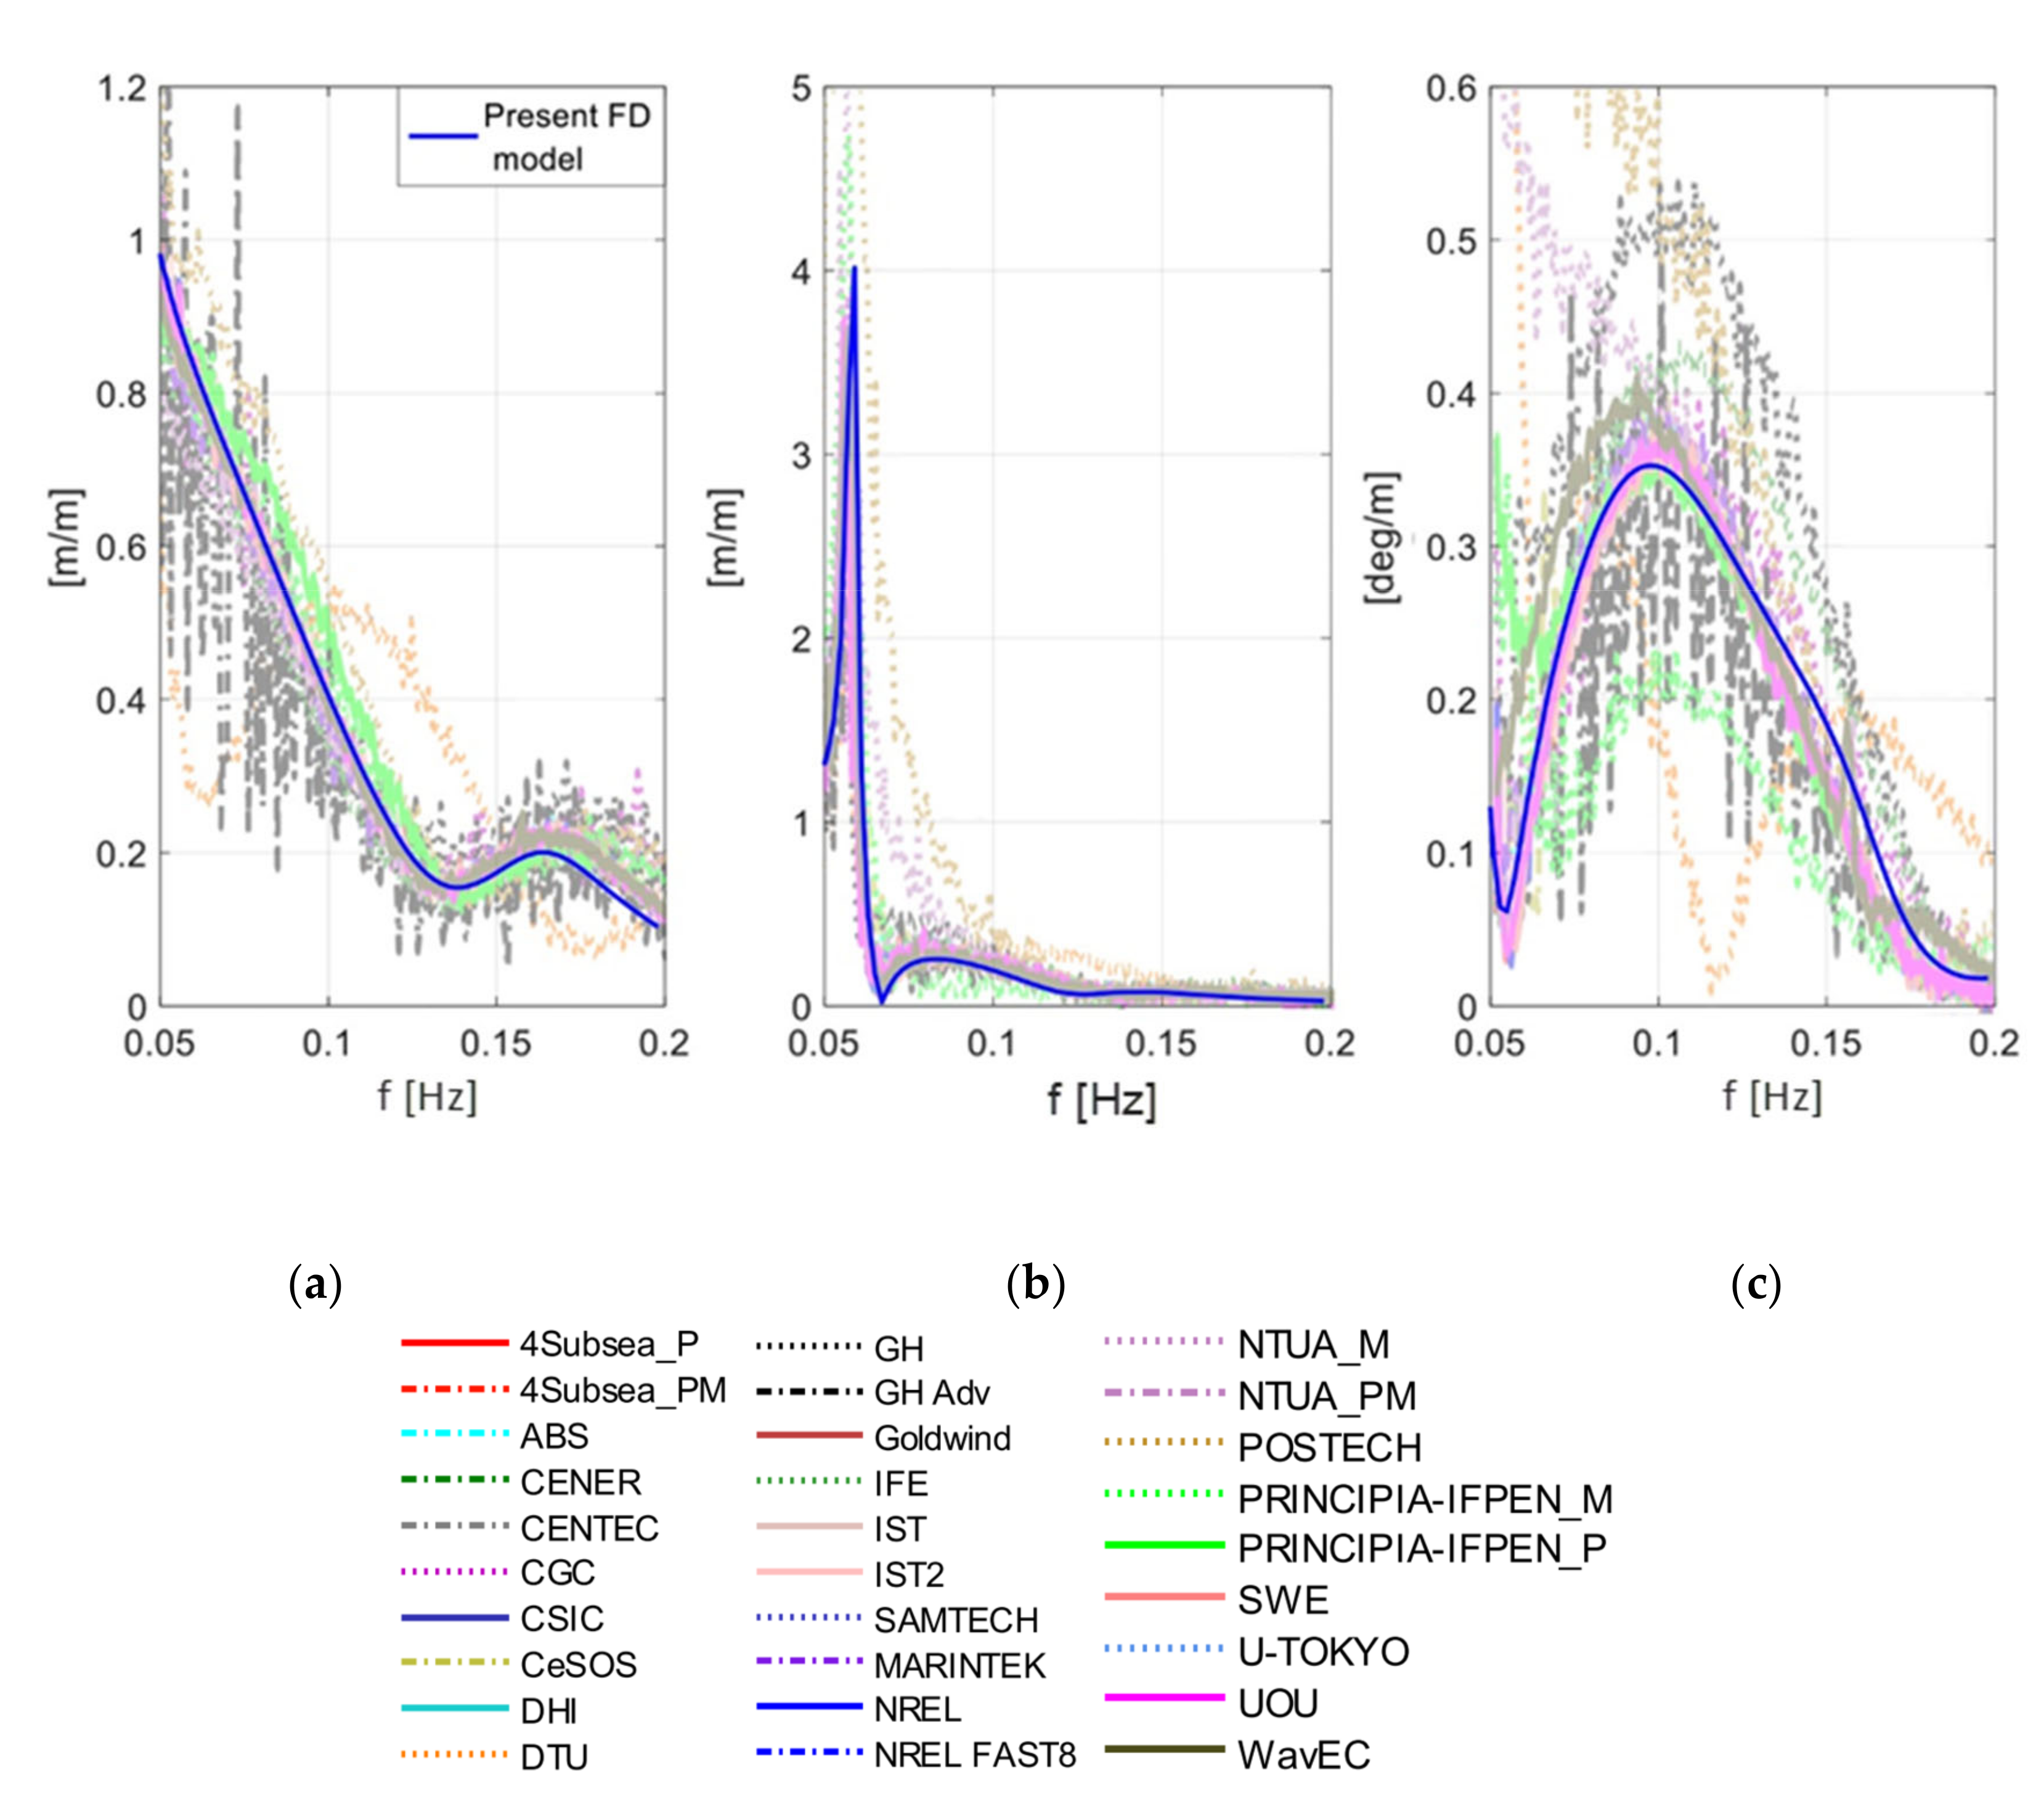
A mesh-independence study was carried out to evaluate mesh sensitivity. The wetted surface is discretized with 2 m × 2 m panels (2173 elements). Morison forces acting on slender members and heave plates, added mass and viscous drag matrices are computed with an in-house algorithm developed in MATLAB based on the following procedure: each member is divided in 1 m-wide strips. A banded white noise spectrum between 0.05 and 0.25 Hz is applied to the system in the surge direction, i.e., 0°. RAOs, and the power spectral densities (PSDs) in surge, heave and pitch are calculated and compared with results presented in [
26] (see
Figure 2 and
Figure 3).
Figure 2 shows a very good agreement of our FD model with the majority of the results reported in the wide code-to-code comparison campaign available in [
26]. Given the large number of results available in [
26], to facilitate the comparison, in
Figure 2, Figure 14 (top row) of [
26] has been placed in the background with the colours slightly faded, whereas our results are plotted in the foreground with a more vivid colour (blue solid line). Underneath the figure, we report the original legend that associates each background line to a specific model/institution. The goal of this graphical presentation is not to make clearly distinguishable each single background line, which can be much better interpreted directly in [
26], but rather to provide an at-a-glance overall assessment of our formulation. It is pointed out that the reference results in [
26] are obtained from time domain simulations based on different coupled FOWT dynamic solvers employing different theories and models, ranging from Morison and potential flow only to second-order formulations. For a detailed description of each formulation, we refer to [
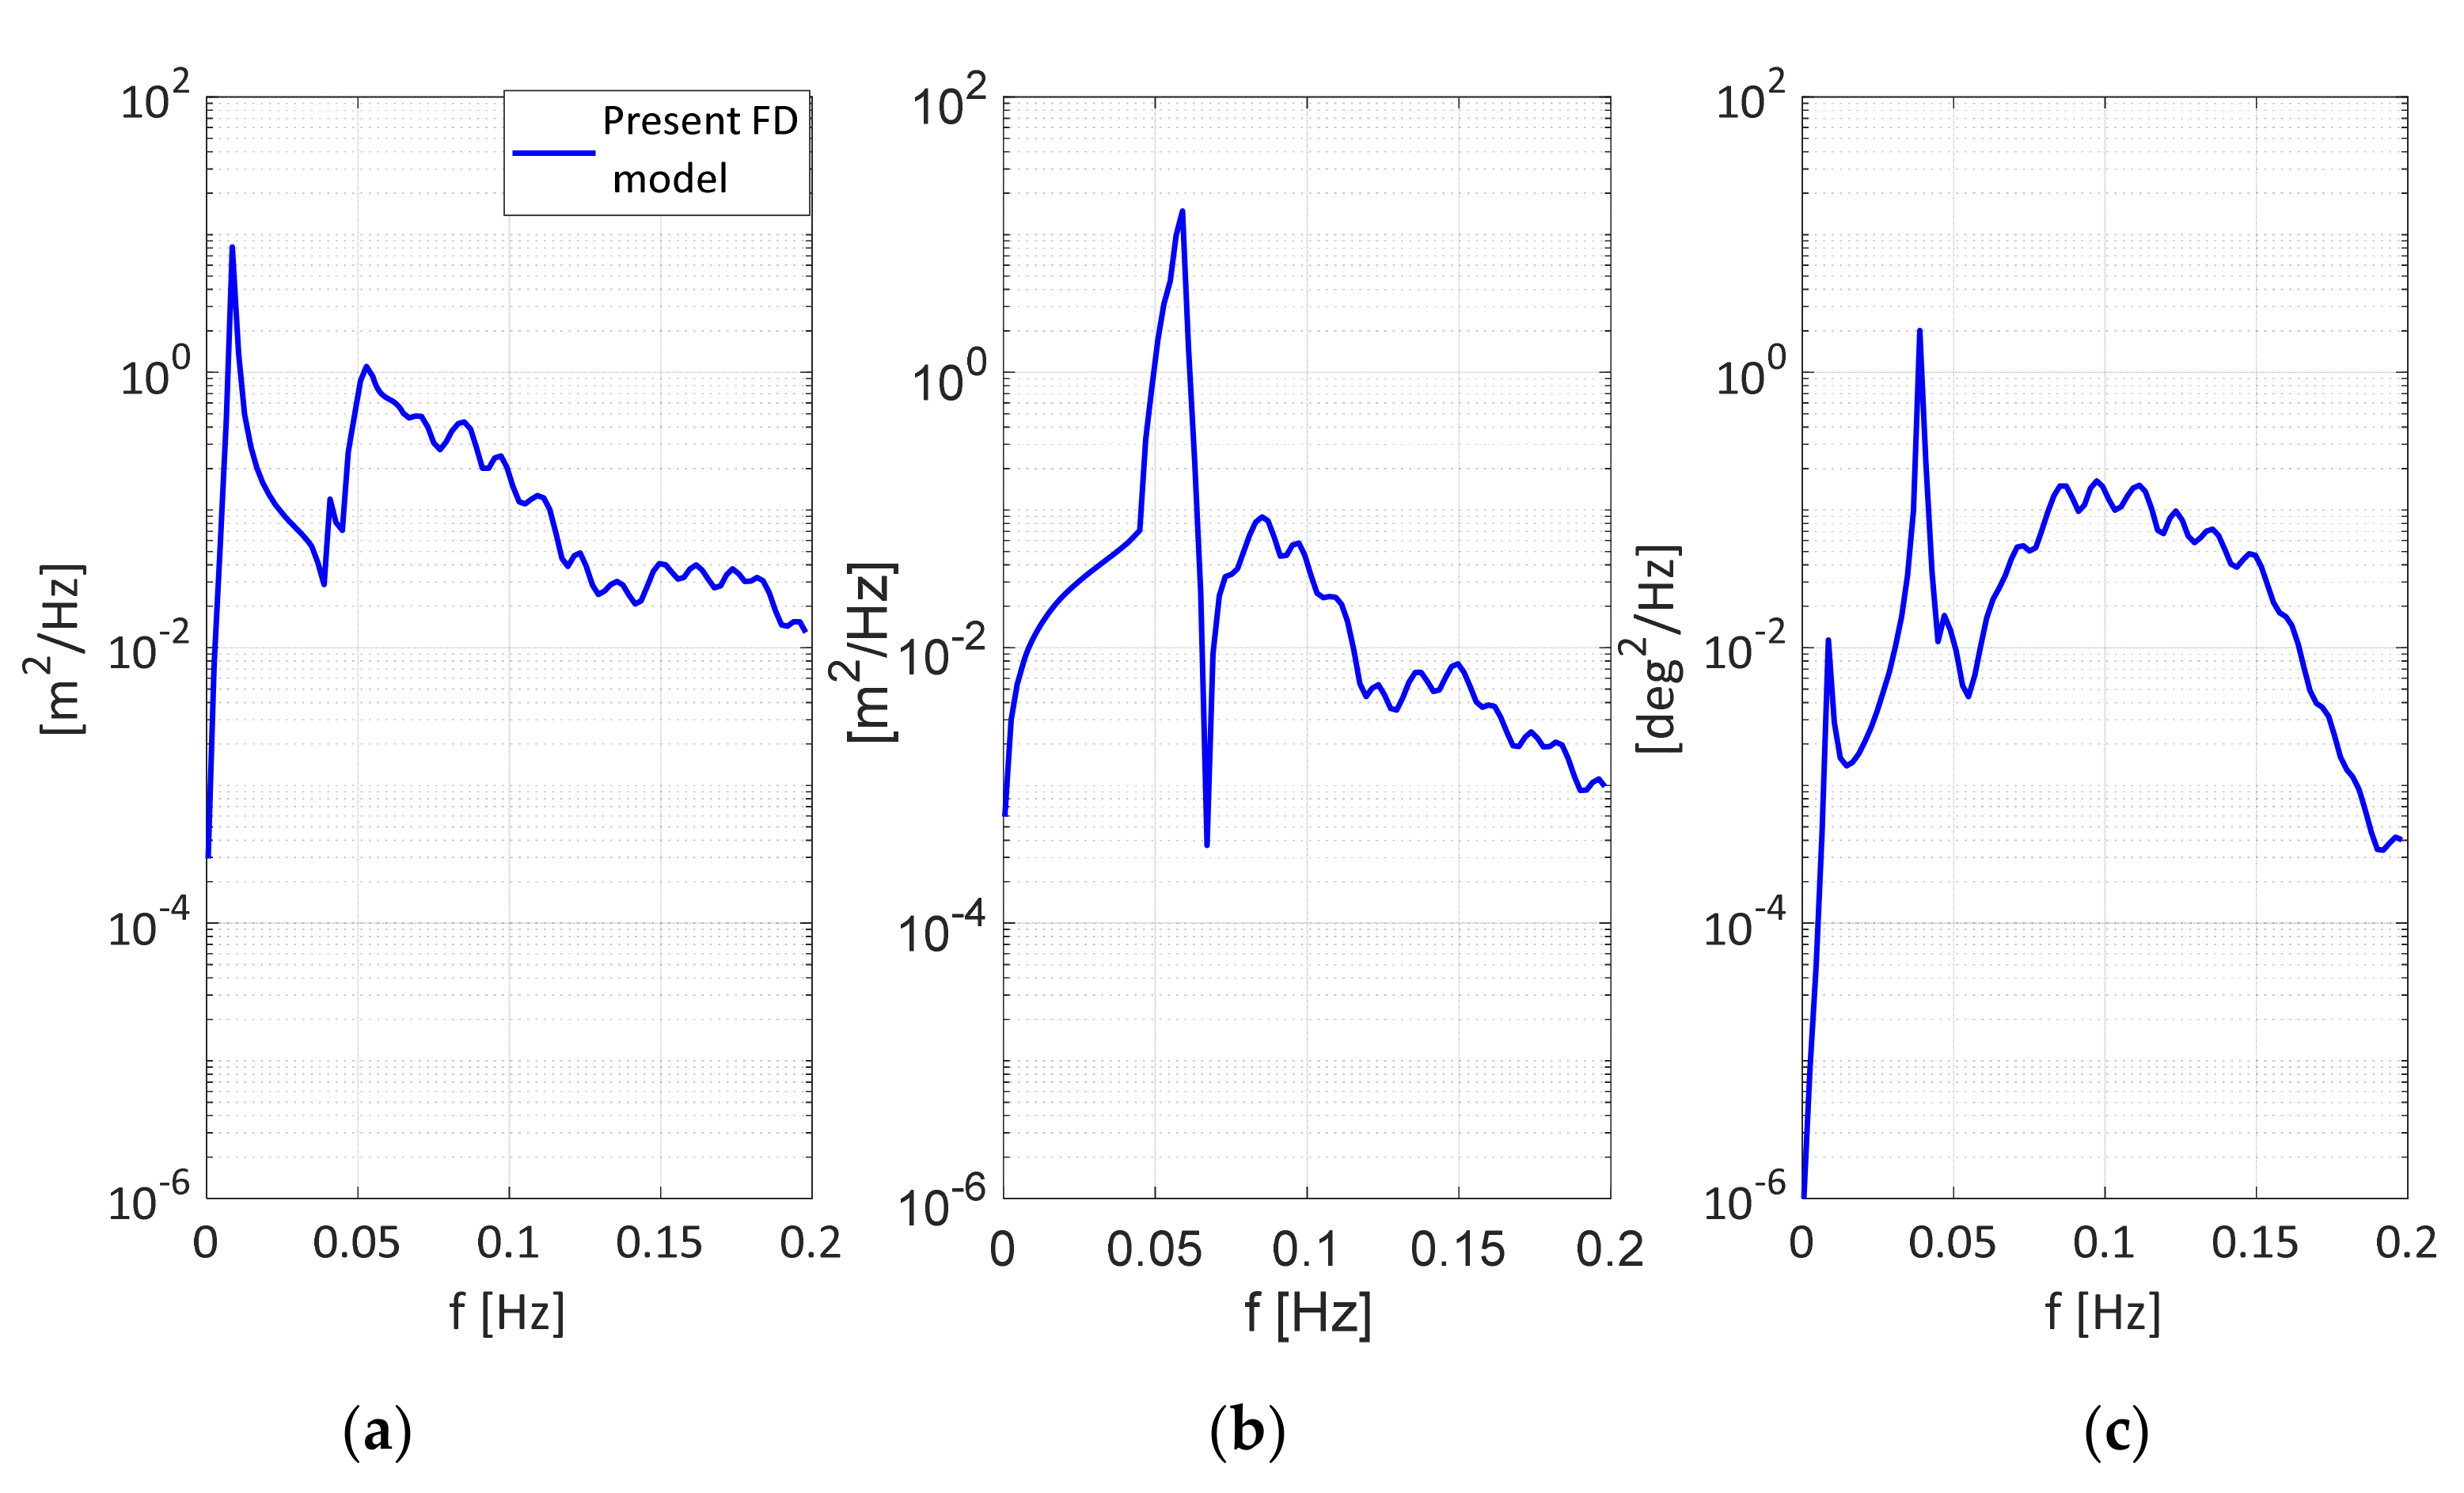
26]. Eigenfrequencies of the system are well captured in the PSDs shown in
Figure 3, which are also in good agreement with the reference results of [
26] (not shown here). The surge eigenfrequency is 0.00856 Hz, the pitch eigenfrequency is 0.0408 Hz, and the heave eigenfrequency is 0.056 Hz. The second peak of the PSD in surge is the pitch eigenfrequency, and vice versa for the PSD in pitch. This is due to the coupling between these two DoFs. The PSD results are influenced in terms of amplitude by the shape of the white noise spectrum as the PSD is calculated as
where
is the input wave spectrum. Thus, considering
Figure 2b and
Figure 3b, we note that as the heave RAO approaches 1 when the frequency tends to 0, the heave spectrum shape is completely determined by the shape of the wave spectrum, namely by how the white noise spectrum goes to 0, as outside the excited frequency range (below 0.05 Hz), its value must be close to 0. This is not true for surge and pitch spectra as they are coupled. RAOs below 0.05 Hz do not approach 1 or a constant value because of such coupling effects.
4. Optimal Column Diameter and Platform Radius for the 10 MW Wind Turbine
In this section, we investigate the effects of two key design variables, namely the outer column diameter d and platform radius r, on the dynamic response of a semisubmersible platform supporting a 10 MW wind turbine. By the platform radius is meant the distance from the central column to the outer columns. The ratio between the heave plates and the column diameter is set to 2, keeping the same ratio of the platform for the 5 MW WT. The heave plate height is fixed to 6 m. The draft is kept constant at 28 m for all the combinations analysed by modifying the concrete ballast.
Eight different column diameters and platform radii are chosen in order to create a grid of 32 combinations. The grid spacing for d and r are 1 m and 5 m, respectively. The results for all 32 combinations are then interpolated using spline surfaces.
To assess the dynamic response of the system, heave and pitch response have been considered. The surge RAO is not considered as a control quantity because the surge eigenfrequency is usually very low (0.004 to 0.008 Hz). Both heave and pitch are indicators of turbine performance. From the heave and pitch response, the difference between the platform draft windward and the local free surface wave elevation can be evaluated according to [
12]. This is a fundamental quantity that must be considered to prevent bottom-slamming and, therefore, to reduce fatigue loads on mooring lines and turbine tower. Pitch response is also related to another indicator of wind turbine performance, nacelle acceleration. Nacelle acceleration has been widely used to estimate wind turbine performance in the frequency domain from platform performance ([
9,
11]). It can be calculated as
where
is the circular frequency,
is the surge RAO,
is the pitch RAO and
is the nacelle height with respect to the sea water level.
Two scalar quantities, one local and one global, are considered for the two DoFs of pitch and heave. The first quantity is the peak of the RAO, and the second is the integral of the RAO in the range of frequencies from 0 to 0.2 Hz excited by a constant 1 m2/Hz white noise.
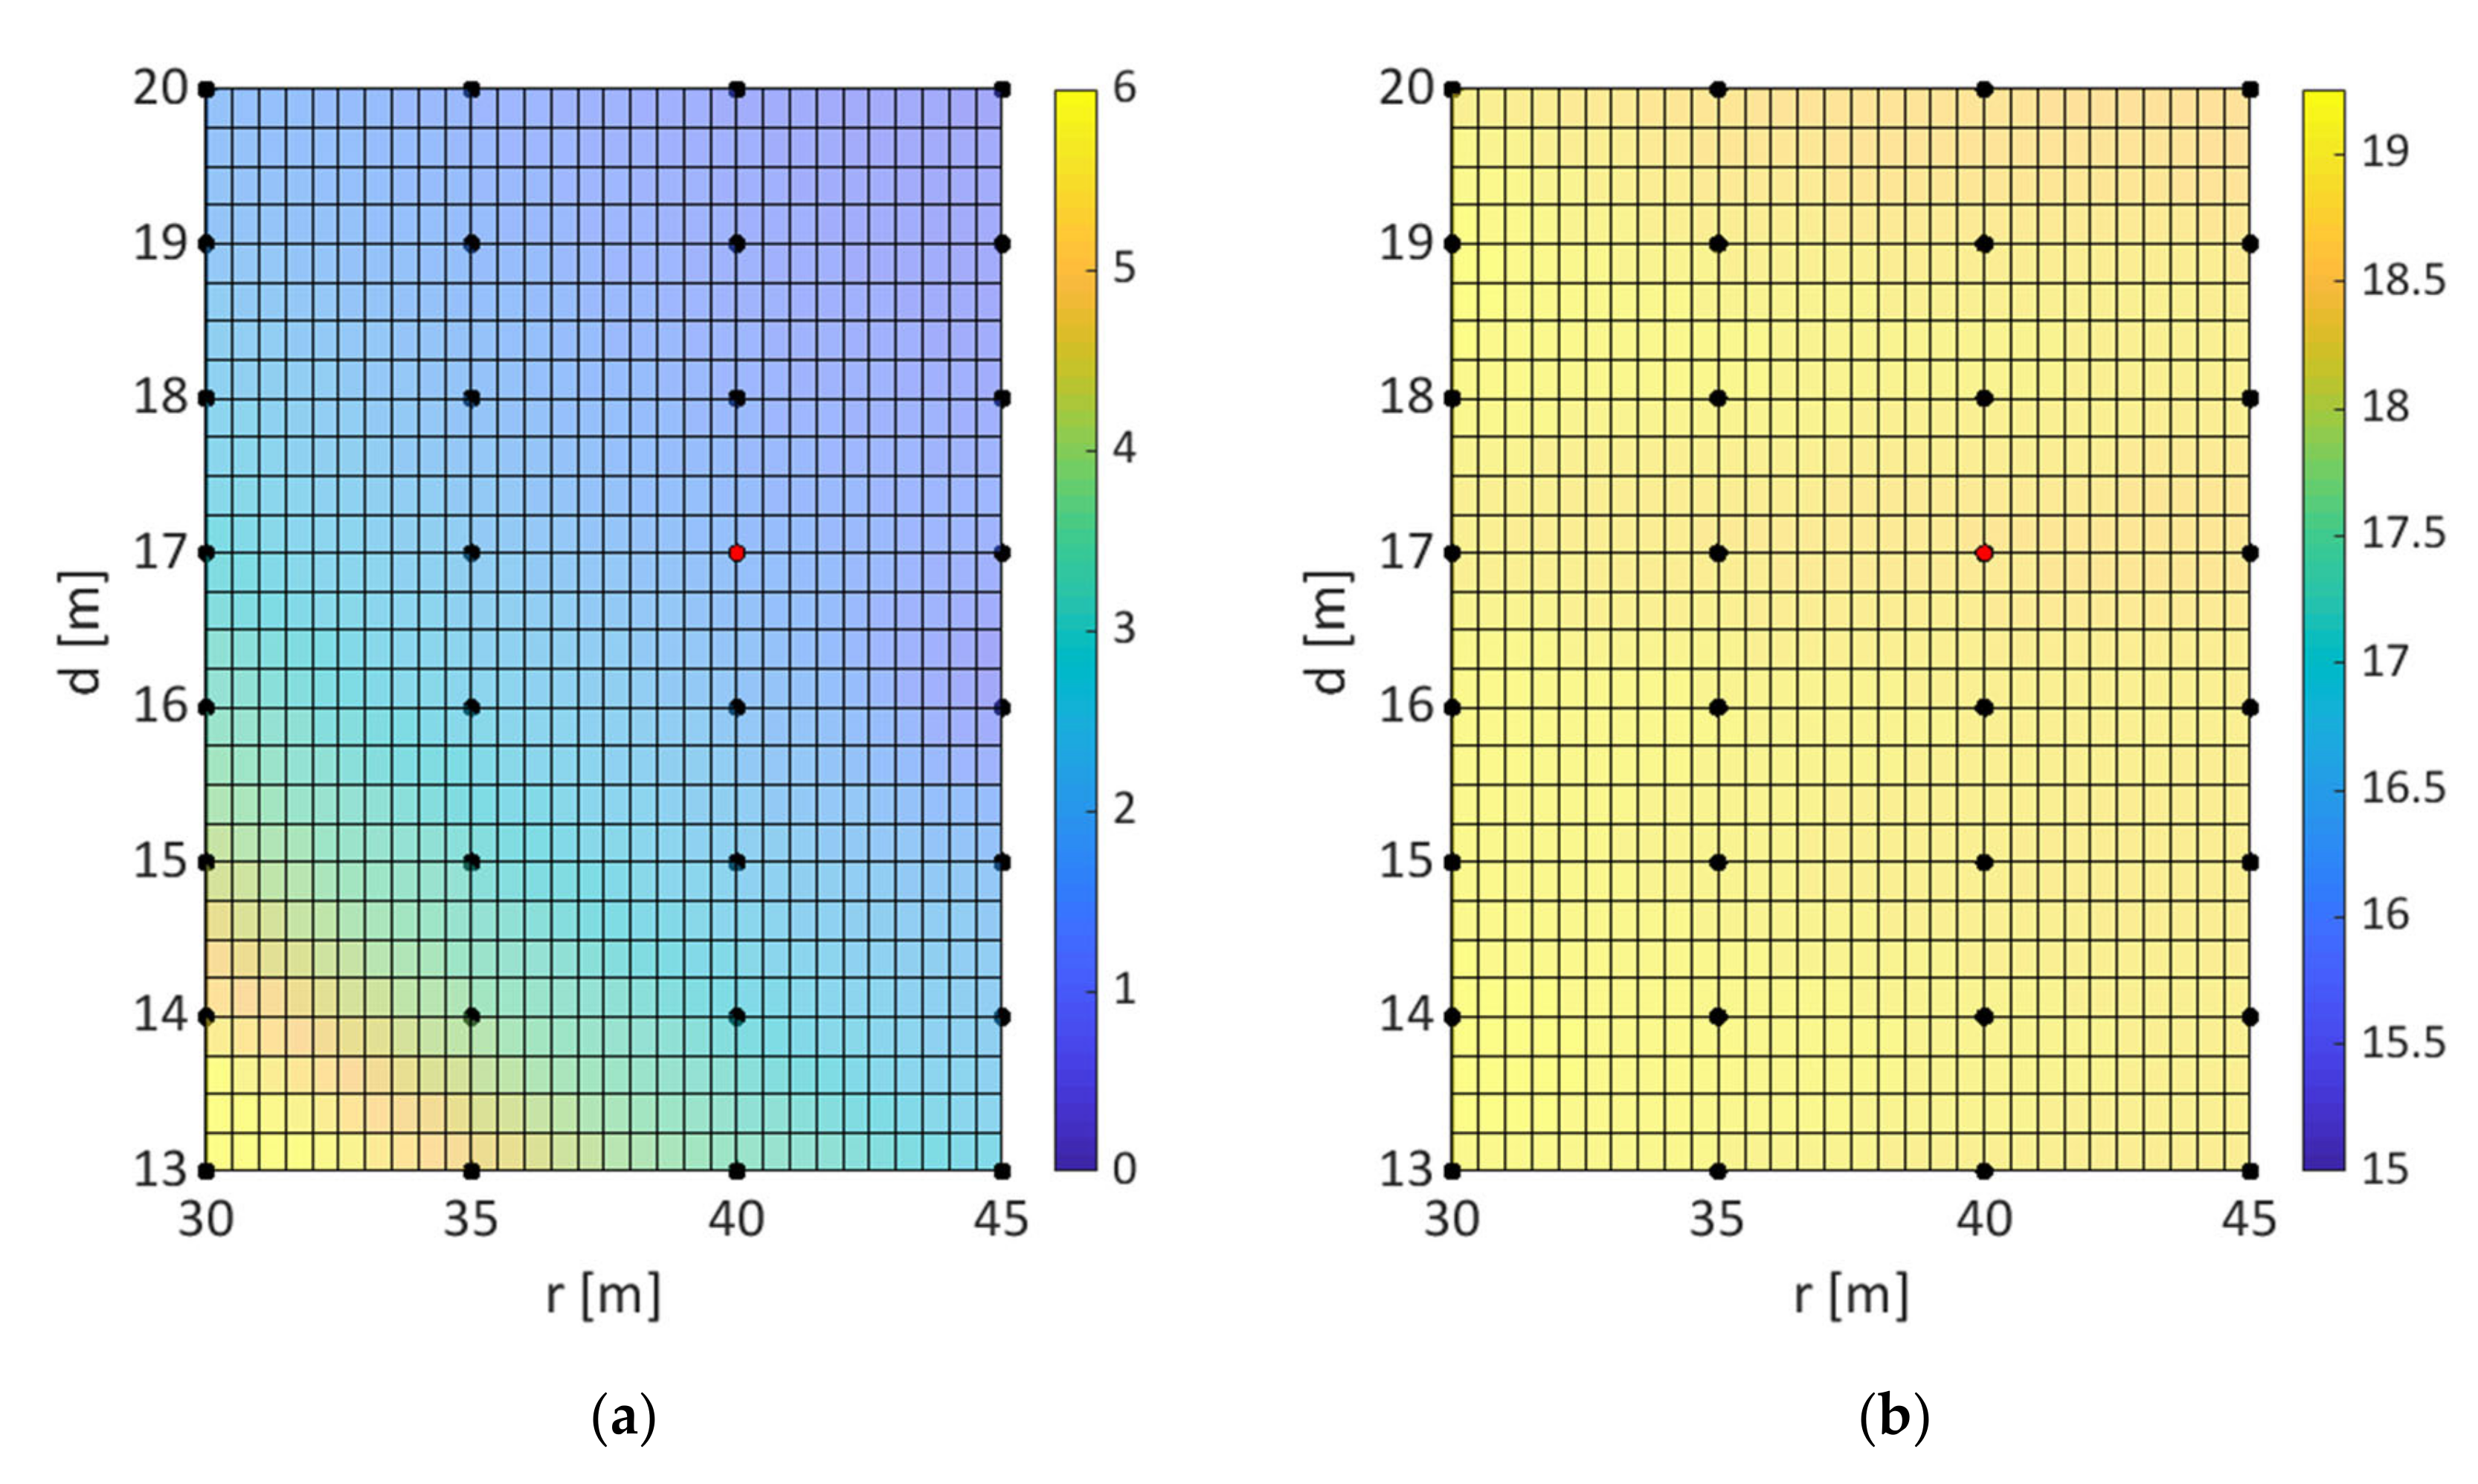
First, for each combination pair (d, r), the mean pitch rotation angle and the mean surge displacement are checked as to whether they are suitable for a power production state (see
Figure 5). As it is possible to observe from
Figure 5a, a rather high average operating pitch angle of 5° is reached for the semisubmersible platform with column diameters of 13 m to 14 m and a radius equal to 30 m. This is mainly due to the lightness of the platform and to its reduced hydrostatic stiffness in roll and pitch DoFs. Such angles may not be compatible with the power production state; therefore, they are discarded in the following analyses (note that 5° is chosen as the maximum allowable value of the average operating pitch angle [
1]). The surge operating displacement (
Figure 5b) is almost constant for all the platforms considered. This confirms that by varying the unstretched cable length it is possible to keep constant the translational stiffness of the mooring lines.
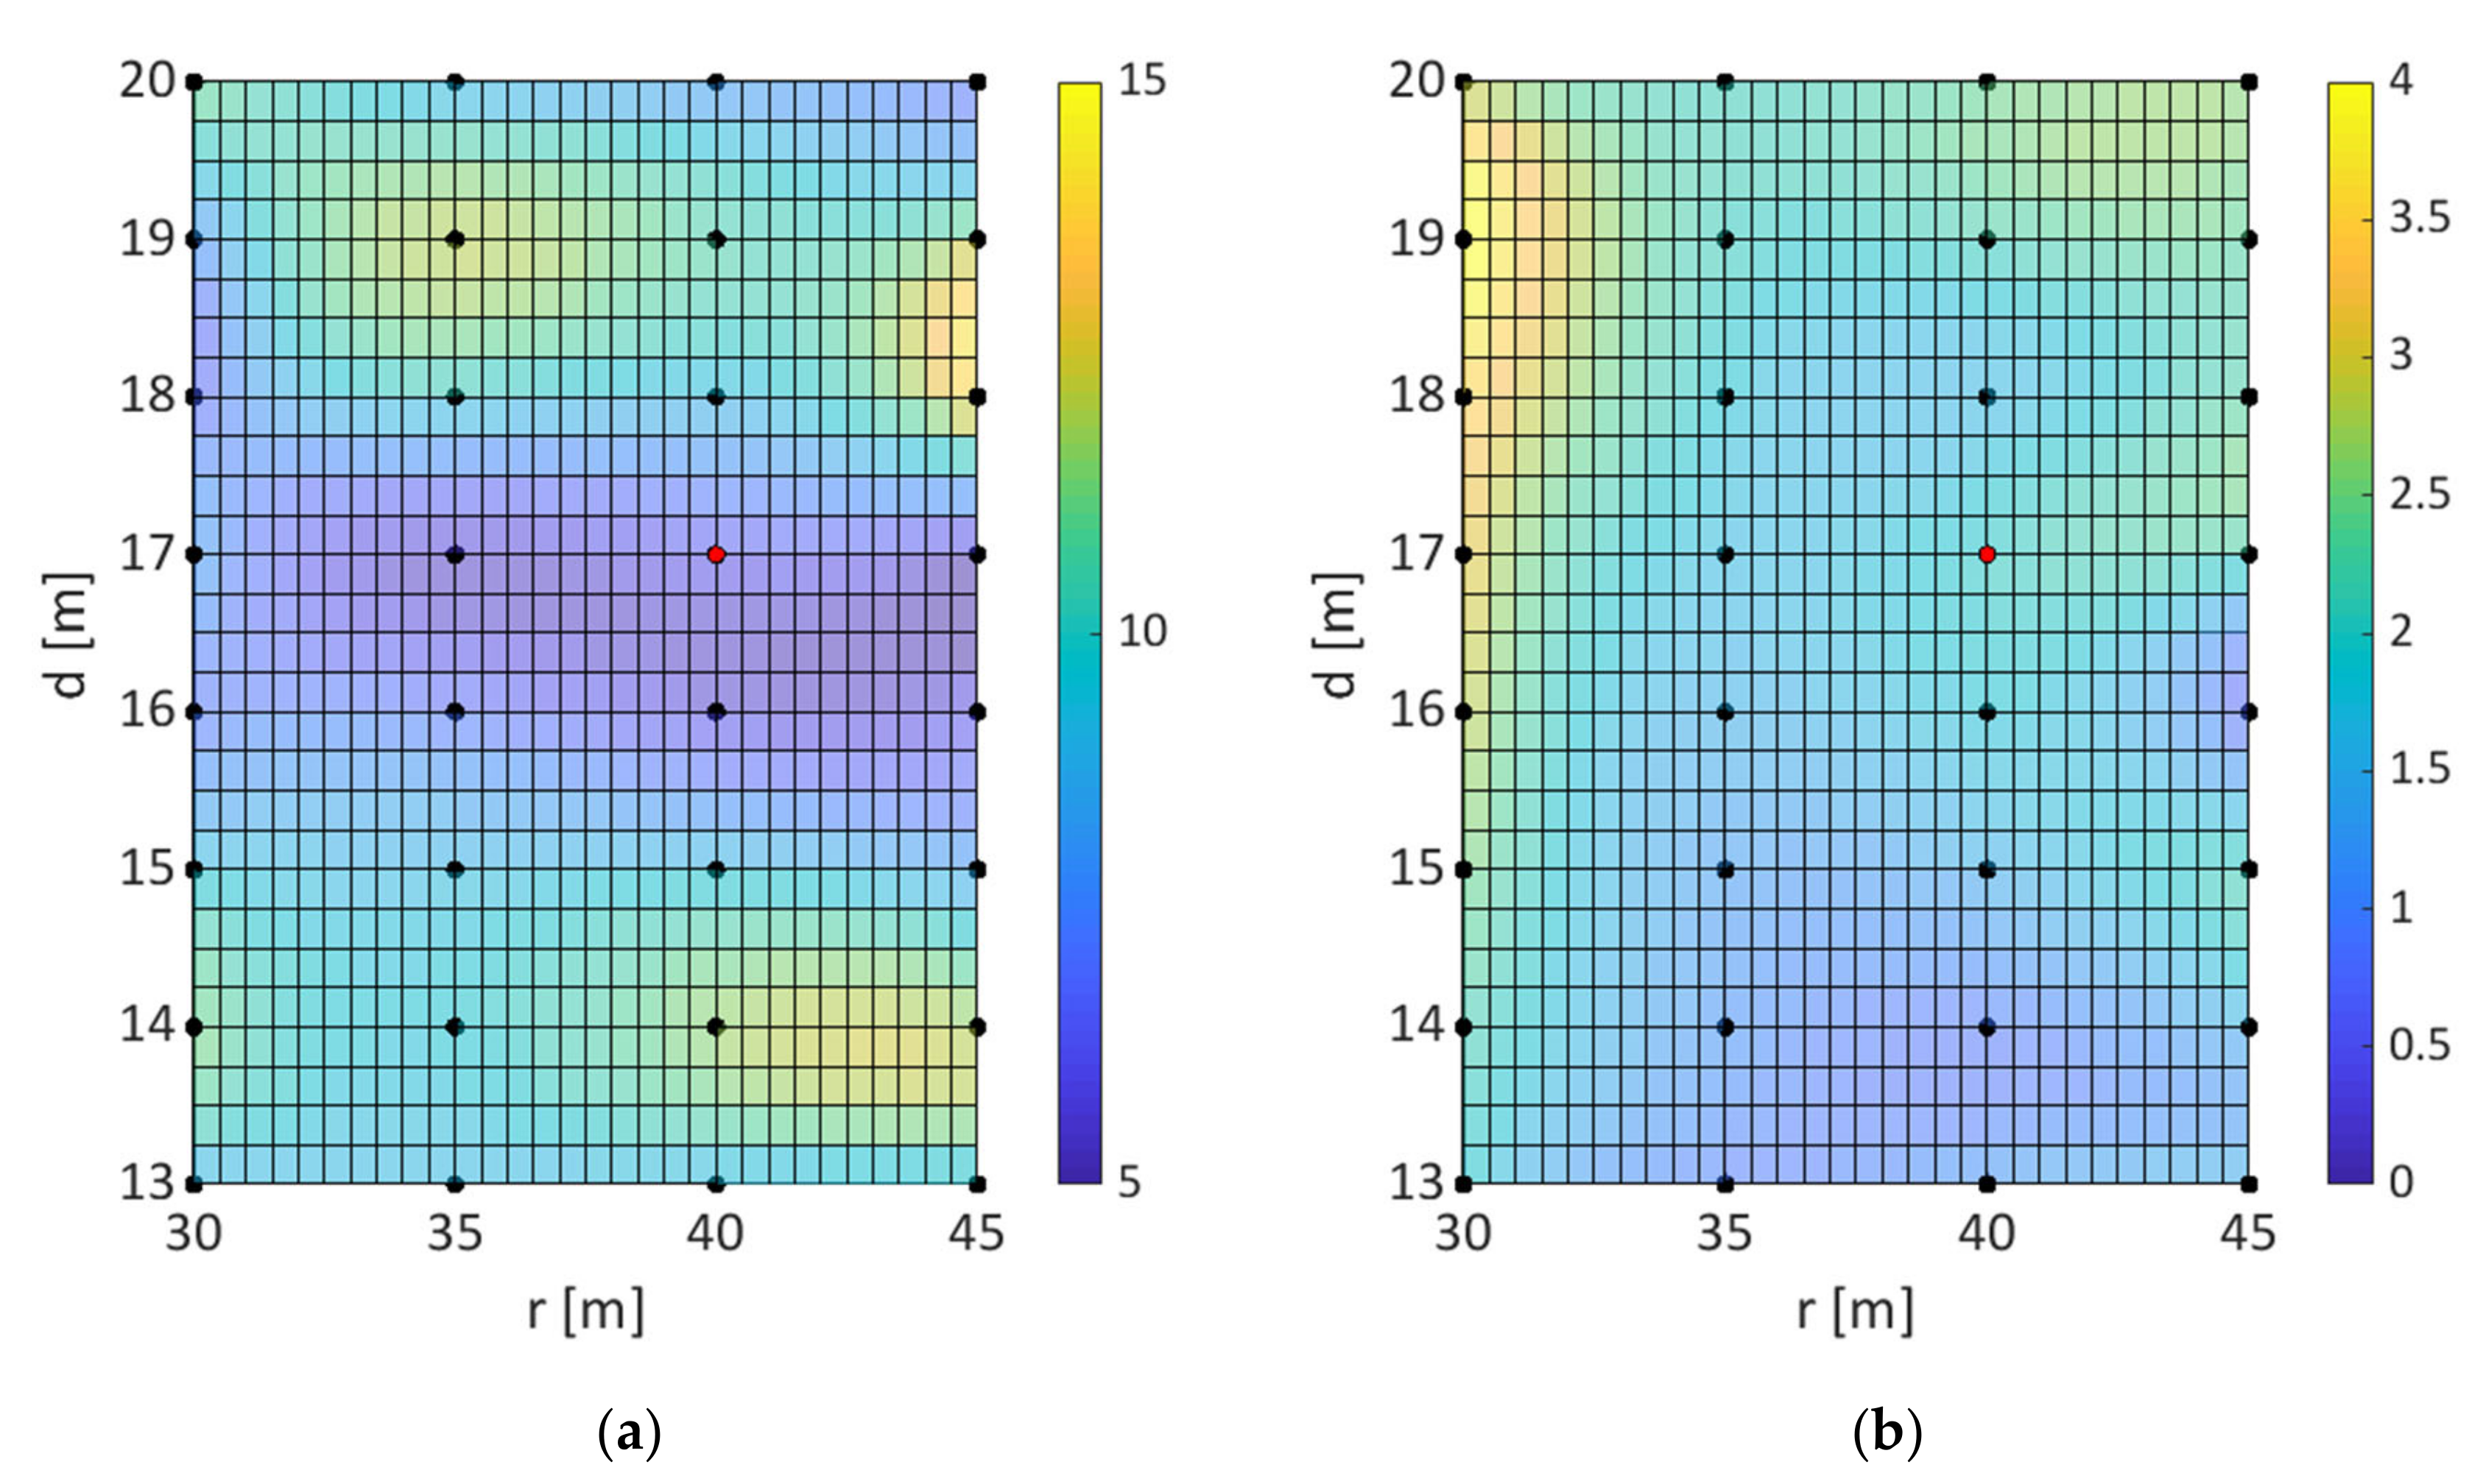
In
Figure 6 and
Figure 7, heave and pitch RAO peaks for the whole set of platforms are presented. The heave peak does not vary significantly between parked (
Figure 6) and power production (
Figure 7). Focusing on the parked condition, a region of minimum values for the heave peak of the RAO (see
Figure 6a) can be identified between 16 m and 17 m for the outer columns’ diameter, and for almost all the platform radii analysed. An optimal candidate appears to be 16/17 m for the column diameter and 35 m for the platform radius. Parked state pitch minimum RAO peaks (
Figure 6b) compatible with power production can be identified in four regions: between 13 m and 14 m for the column diameter and a platform radius of 35 m, between 16 m and 17 m for the column diameter and a platform radius of 35 m, between 18 m and 19 m for the column diameter and 40–45 m for the platform radius, and between 19 m and 20 m for the column diameter and 33–40 m for the platform radius. The last two minimum points are reached with heavier and larger solutions than the upscaled platform (marked as a red dot in the figures), so they are discarded. Platforms with 16–17 m column diameters and 35 m platform radii appear to be the best choice, which minimises both heave and pitch peaks; moreover, they offer a relatively lower mean pitch angle (around 3°) than the 13–14 m column diameter and 35 m radius solutions (around 4°) (see
Figure 5a). Heave peaks (
Figure 7a) remain almost unchanged with respect to the parked state condition, the minimum region appears to be again around 16–17 m for the column diameter, and no significant influence of the platform radius can be noticed. Pitch peak, instead (
Figure 7b), is strongly influenced by the damping effect stemming from the rotor blades, which is capable of drastically reducing the corresponding pitch peak in the parked state. We emphasise the importance of examining not only the power production but also the parked or low rotational speed conditions. During the shut-down or parked state with severe sea state conditions, the rotor drastically reduces its rotation speed, and thus its damping effects on the platform are significantly reduced.
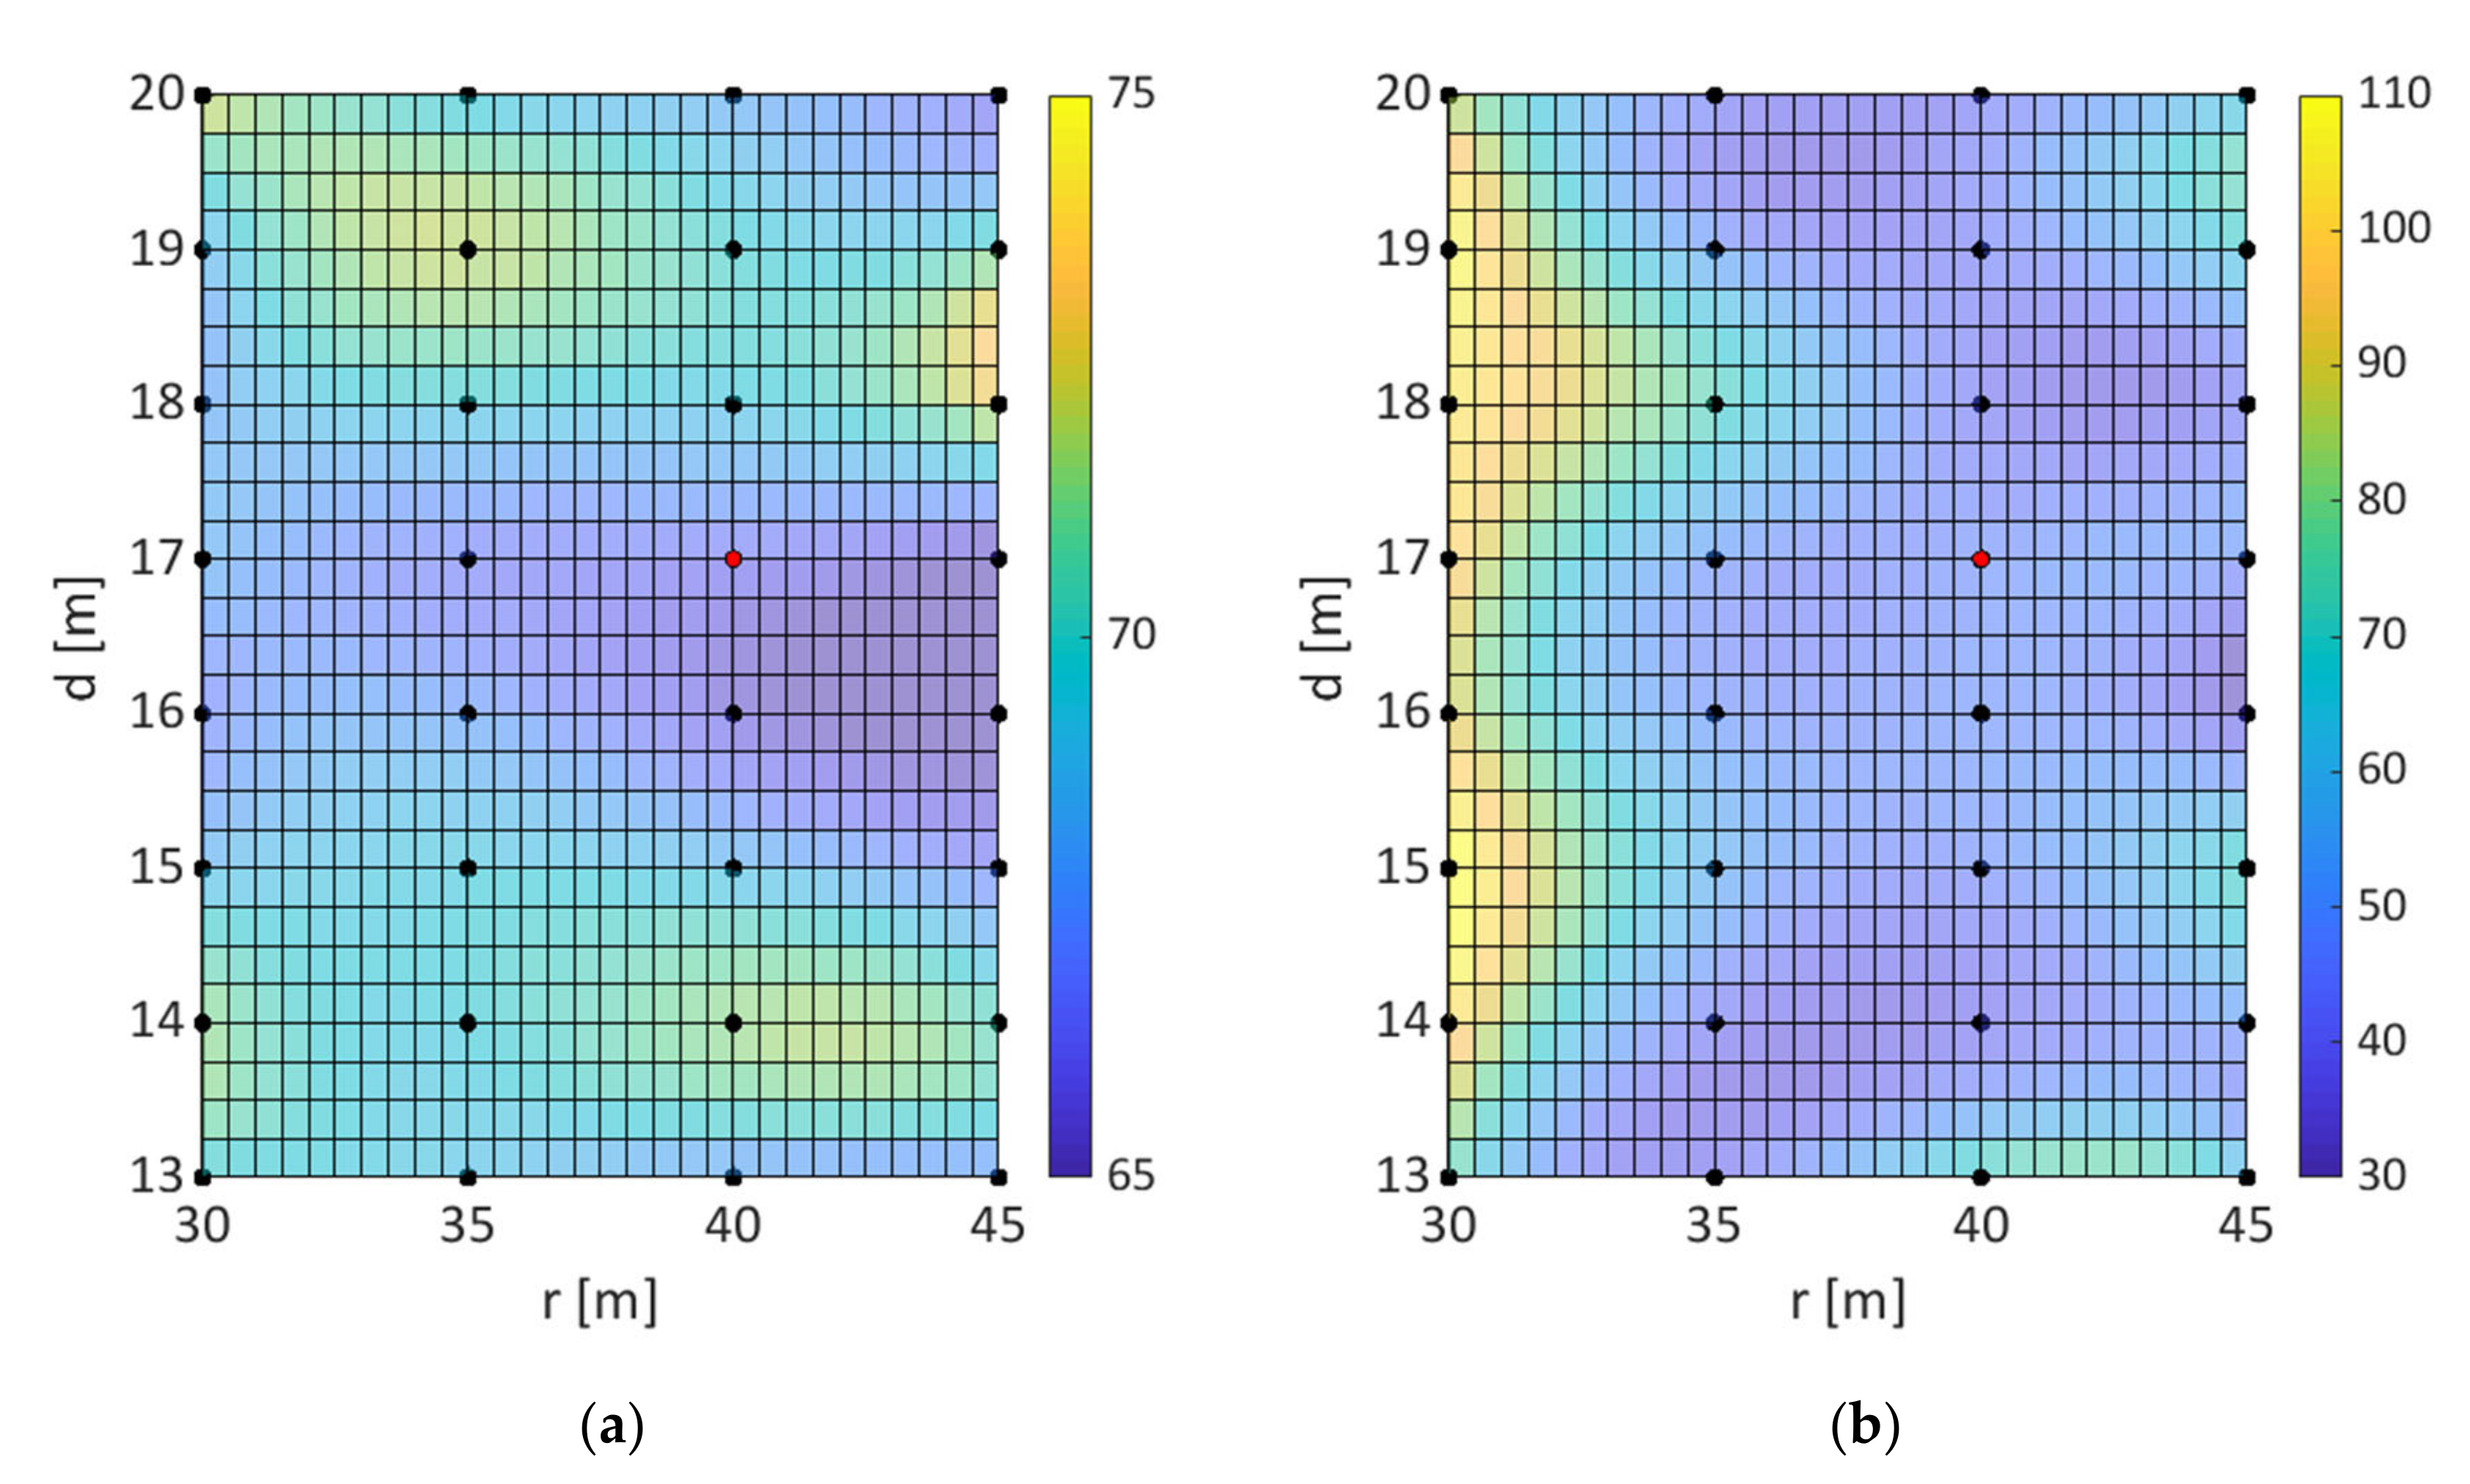
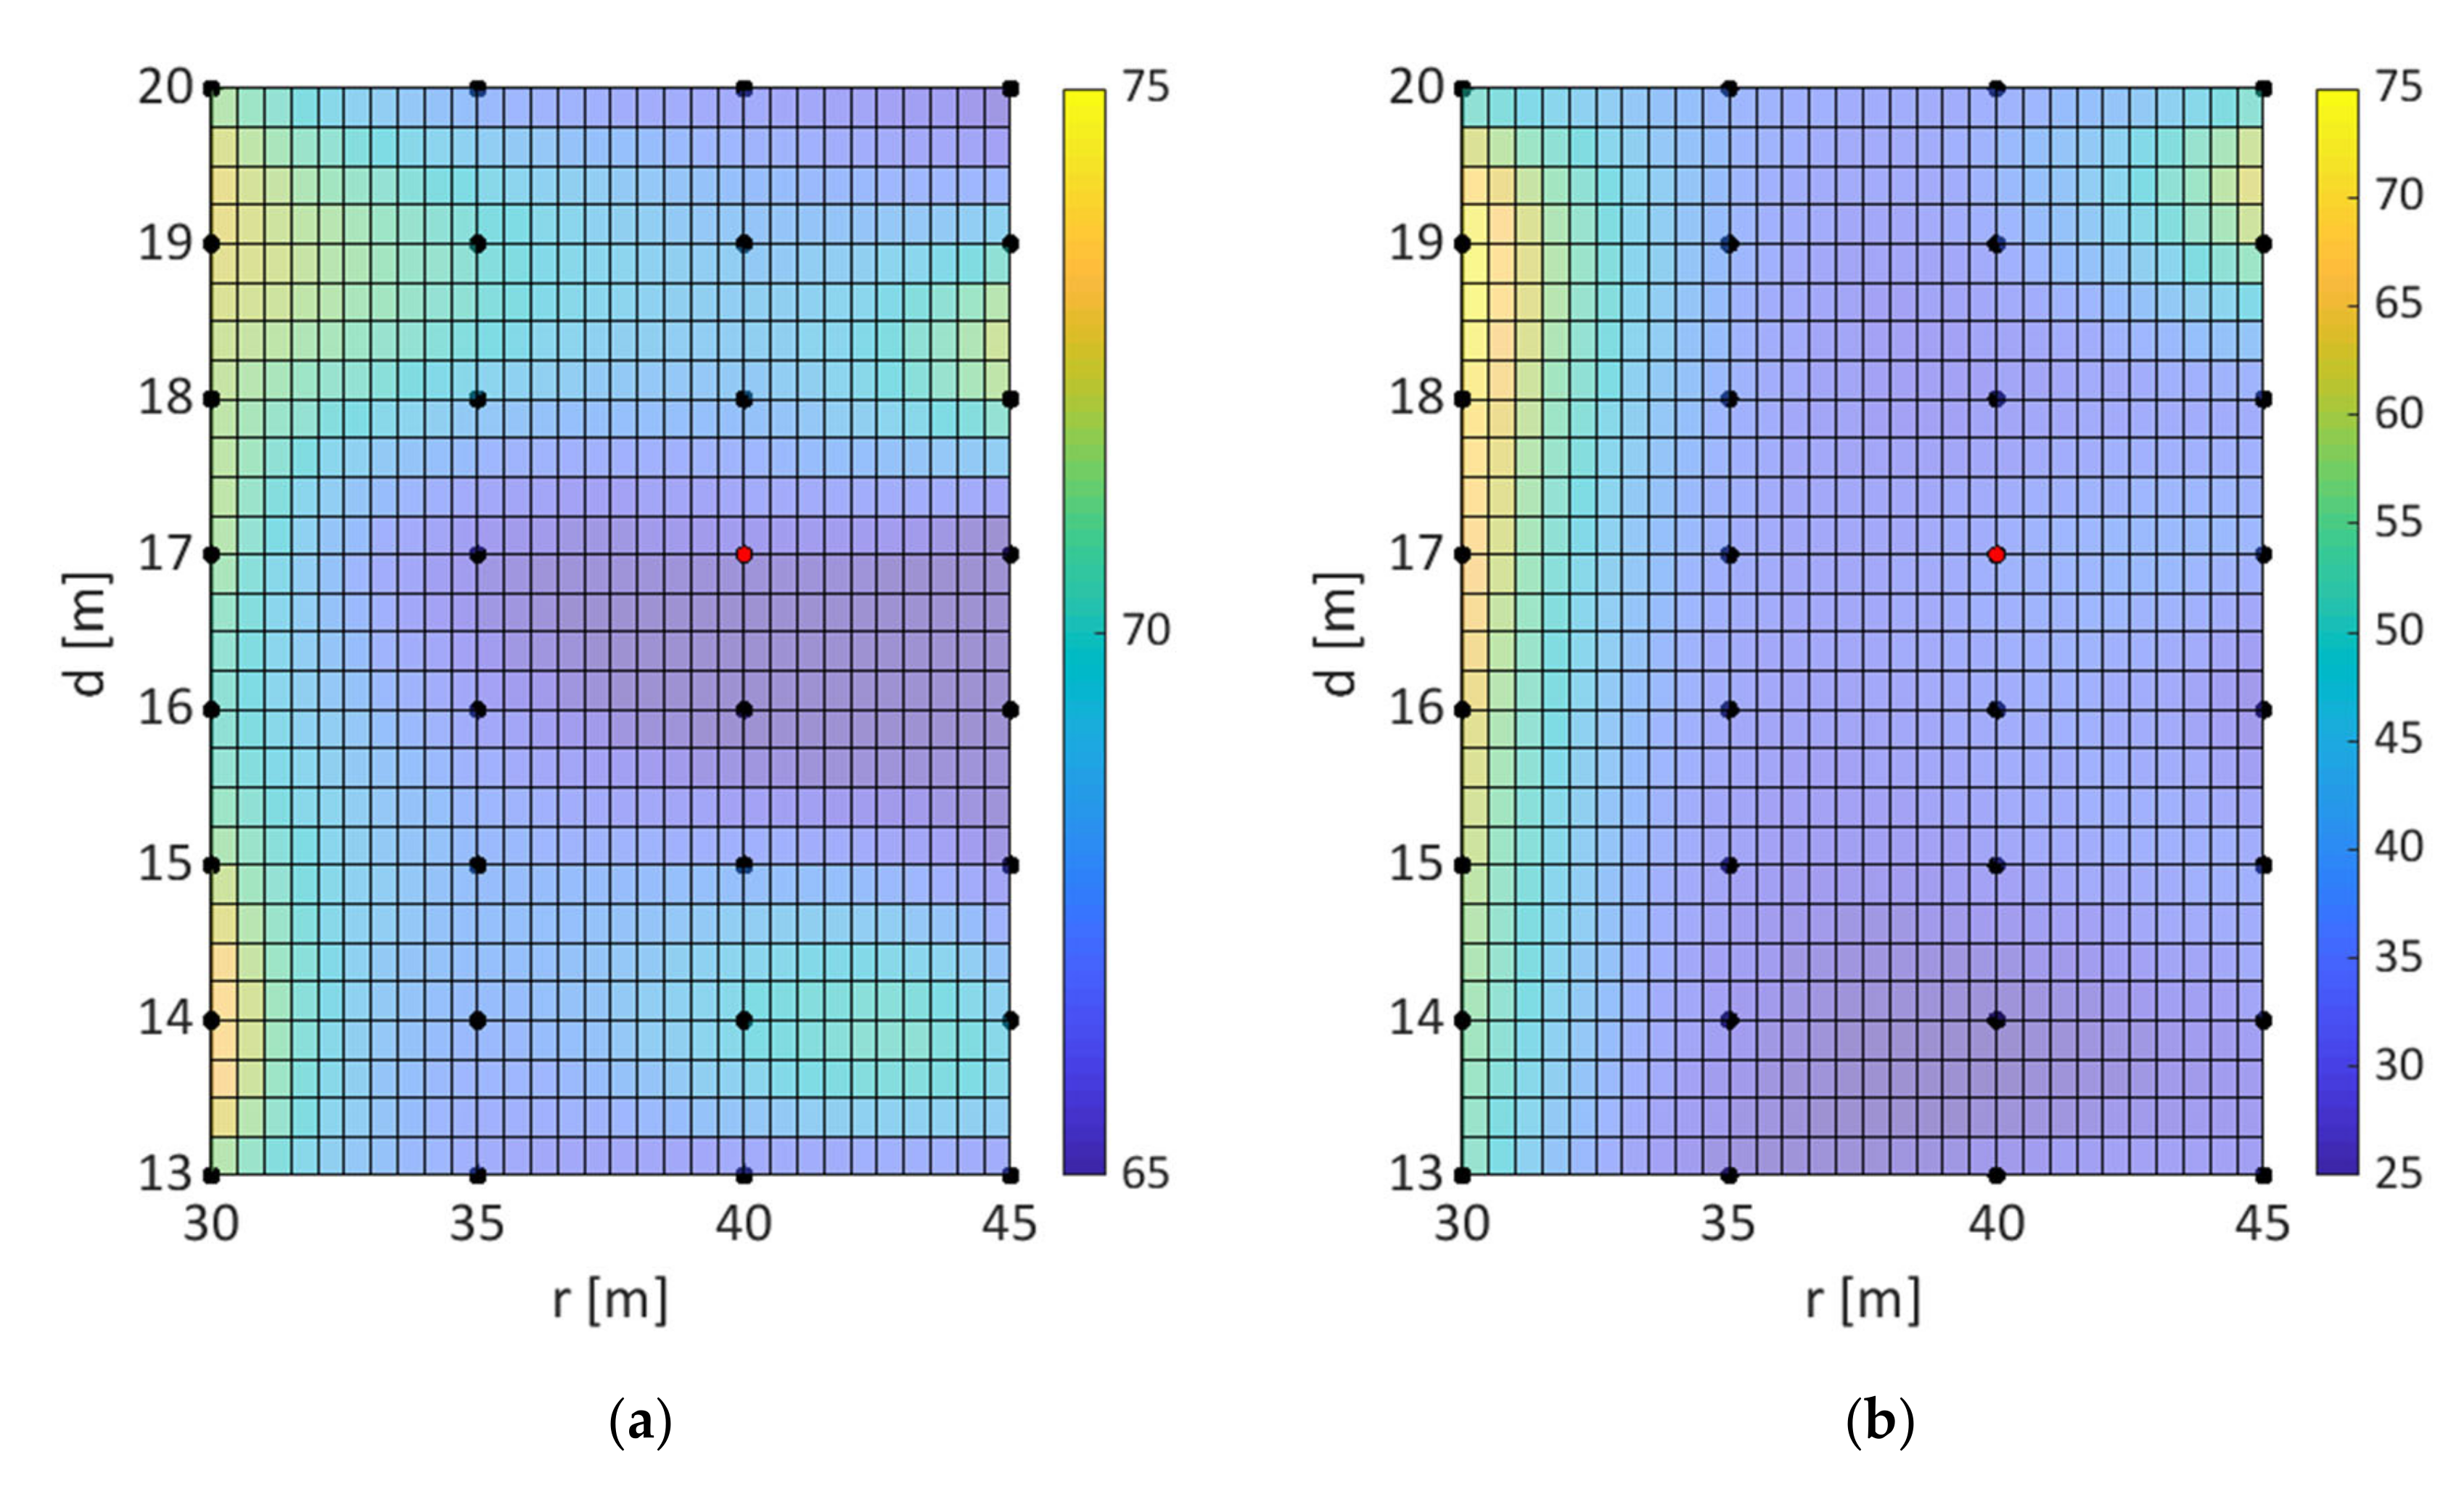
In
Figure 8 and
Figure 9, RAO integrals of heave and pitch DOFs are presented.
Figure 8a and
Figure 9a reveal a lower minimum region between 16 m and 17 m for the outer column diameter. Local maxima in the bottom and upper part of the domain are caused by an increasing of the eigenfrequency peak and by heave–pitch coupling. Rotor damping contribution does not have an appreciable effect as heave plate damping dominates. The pitch RAO integral is again influenced positively by the rotating blades so that the parked RAO integral is almost always higher than the power production one (compare
Figure 8b and
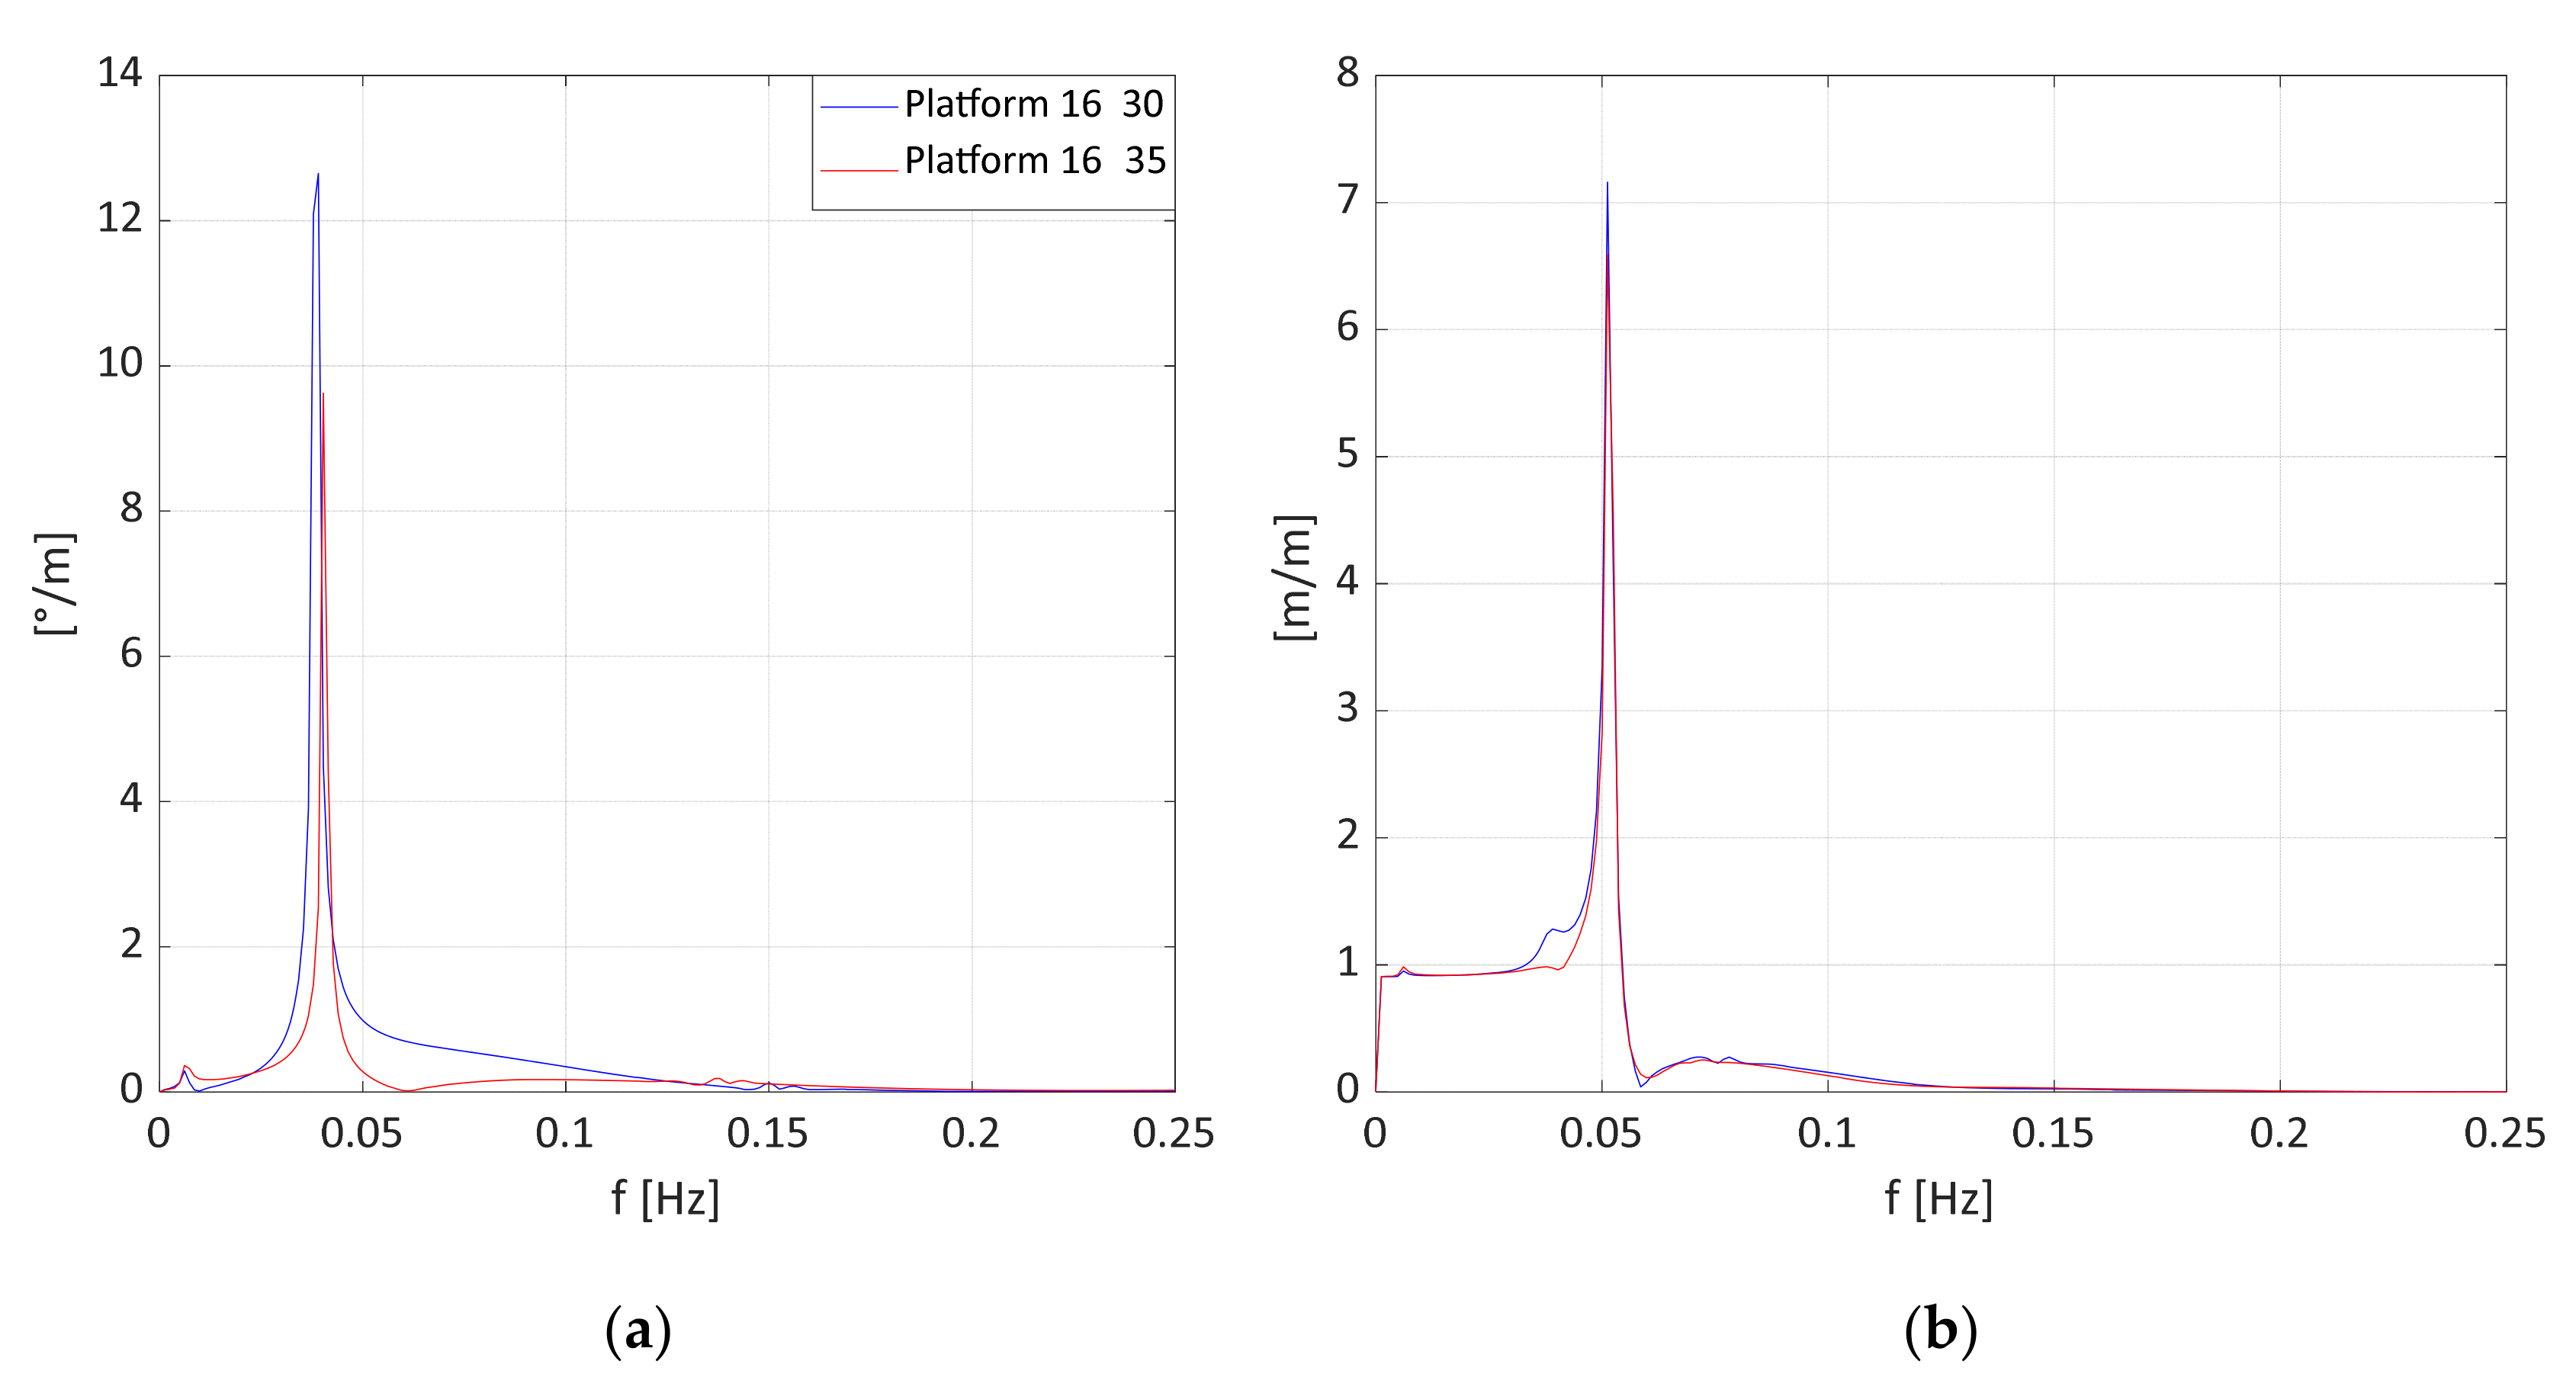
Figure 9b and note that the two colour bars have different bounds). A smaller platform radius appears to produce a negative effect, making the pitch RAO integrals increase both in parked and operating conditions. This is related to both the increasing of the RAO pitch peaks and to the change of the shape of the RAO immediately outside the pitch eigenfrequency. This can be observed in
Figure 9a where the RAO of the pitch DoF for combinations (d, r) (16, 30) and (16, 35) are compared. A small increase in the heave RAO integral in power production for a 30 m radius platform is due to a stronger coupling effect between heave and pitch degrees of freedom (
Figure 10b).
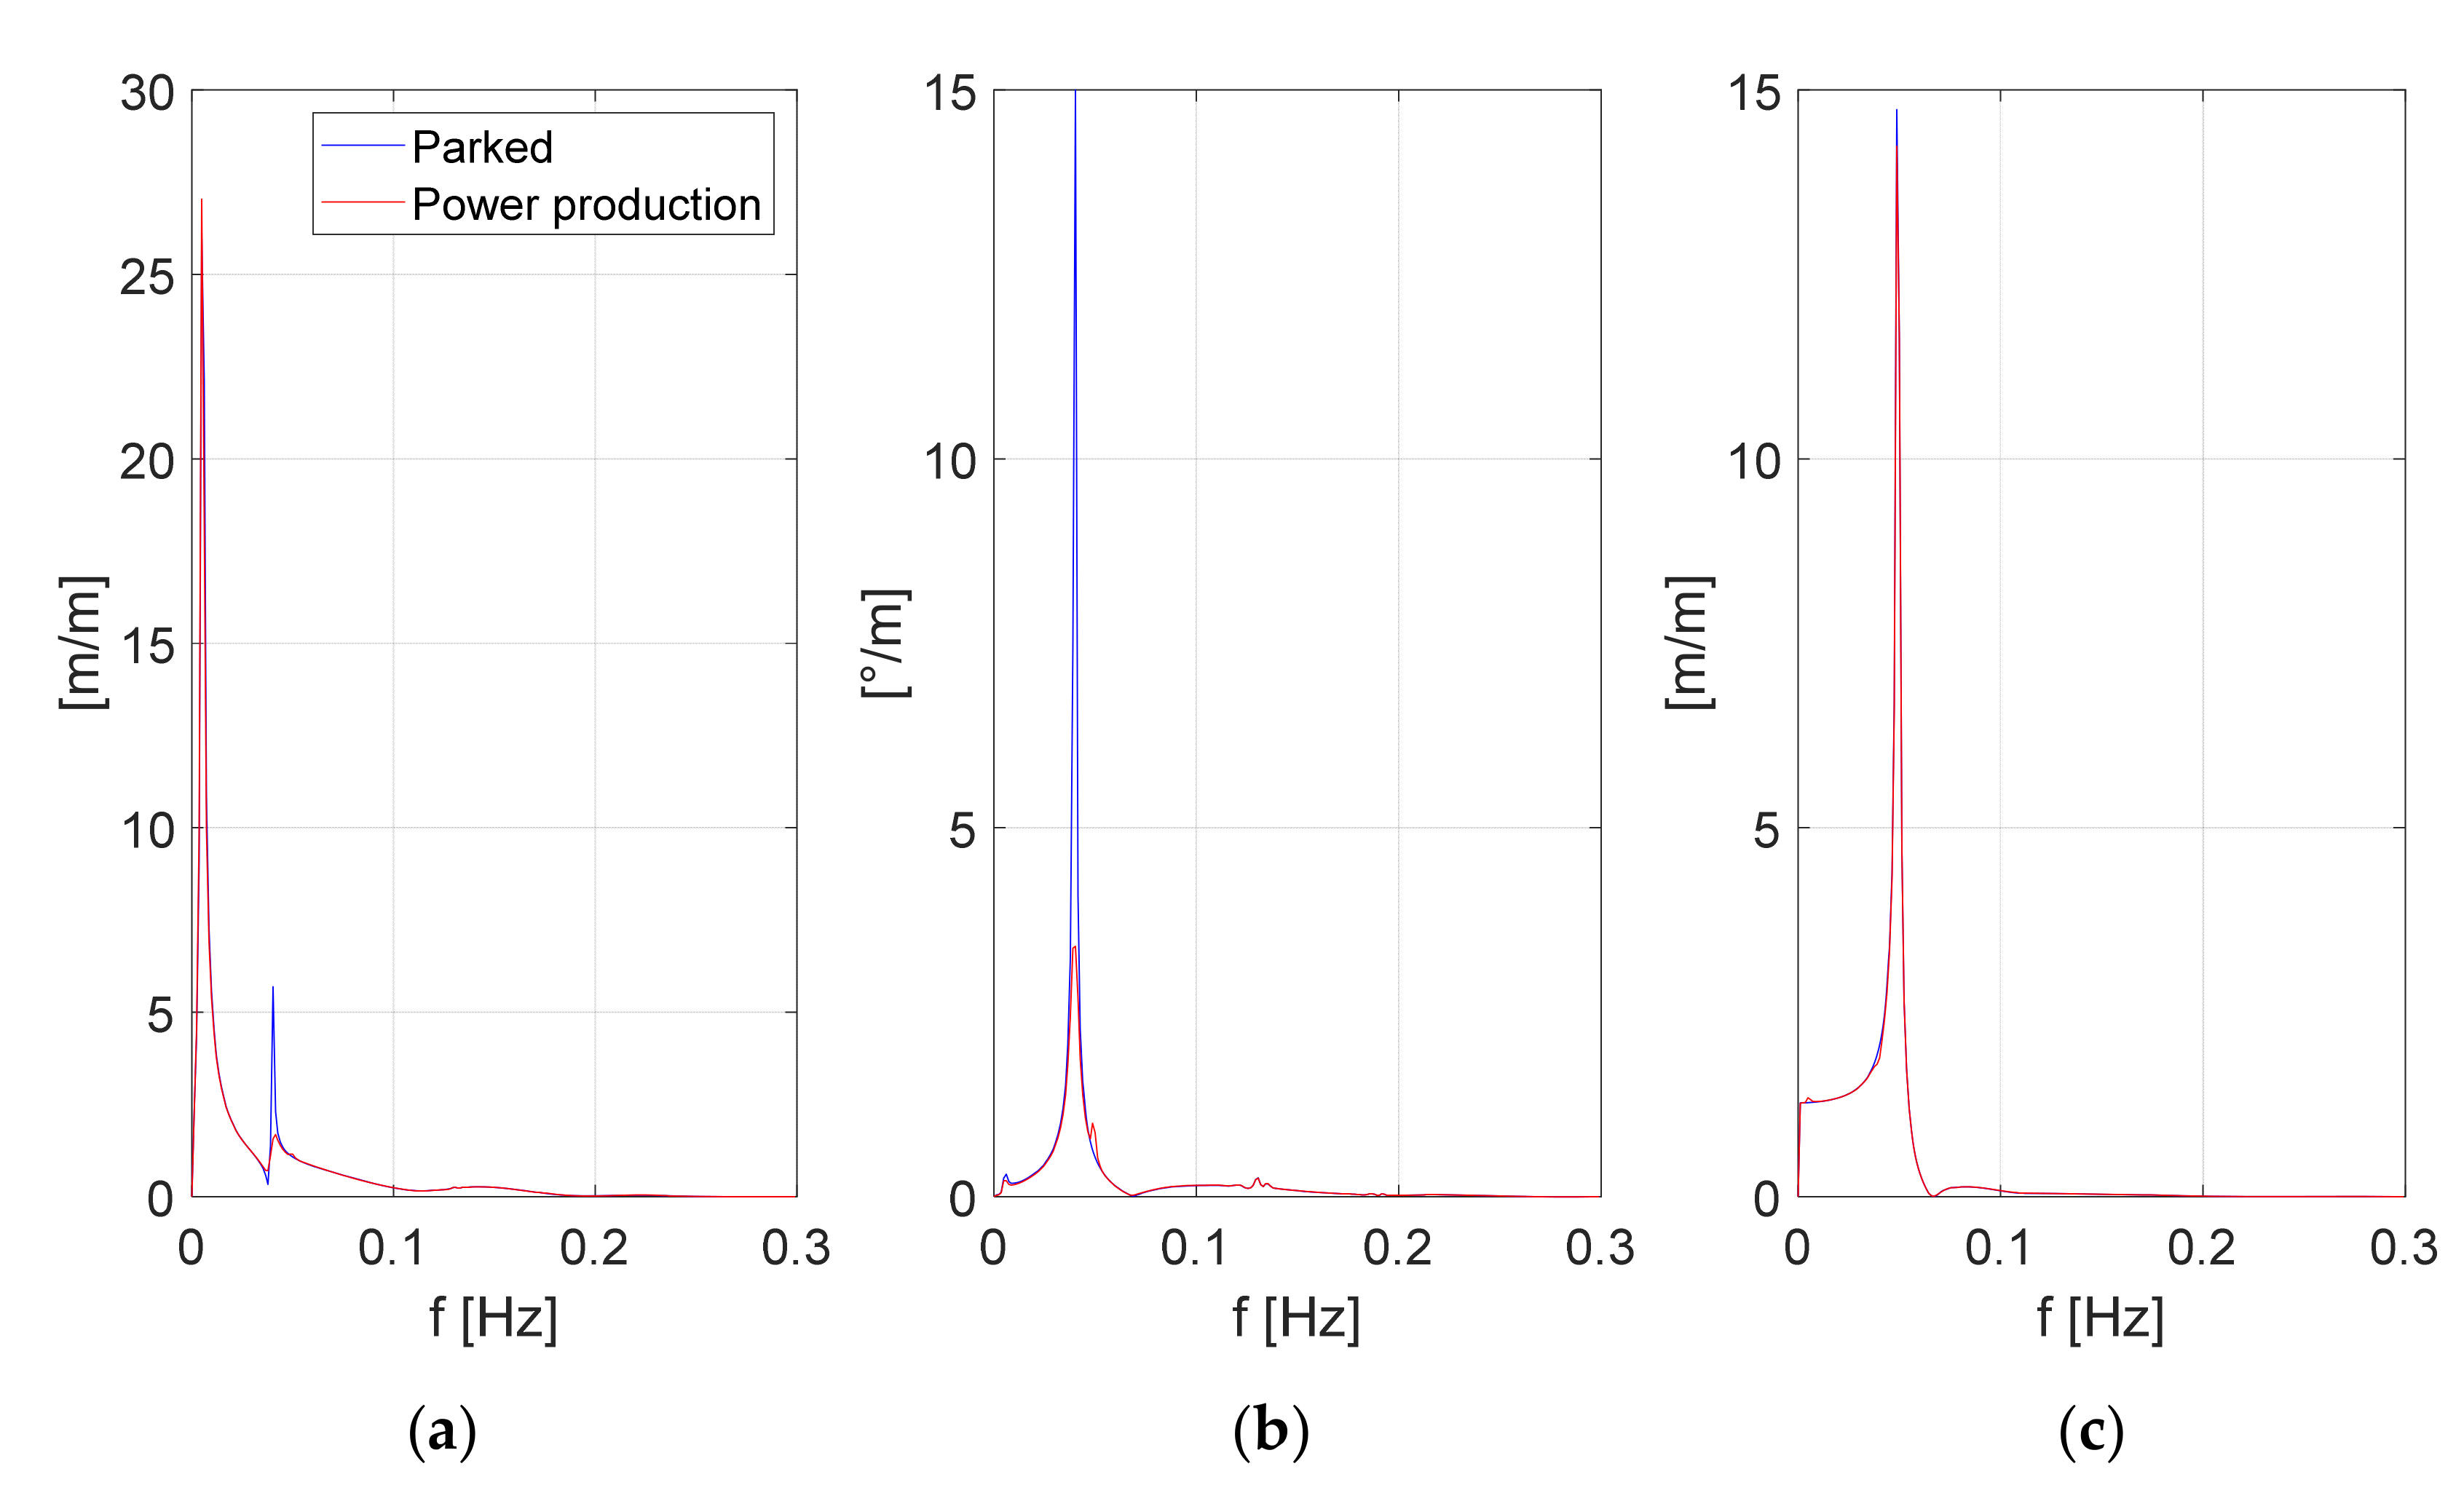
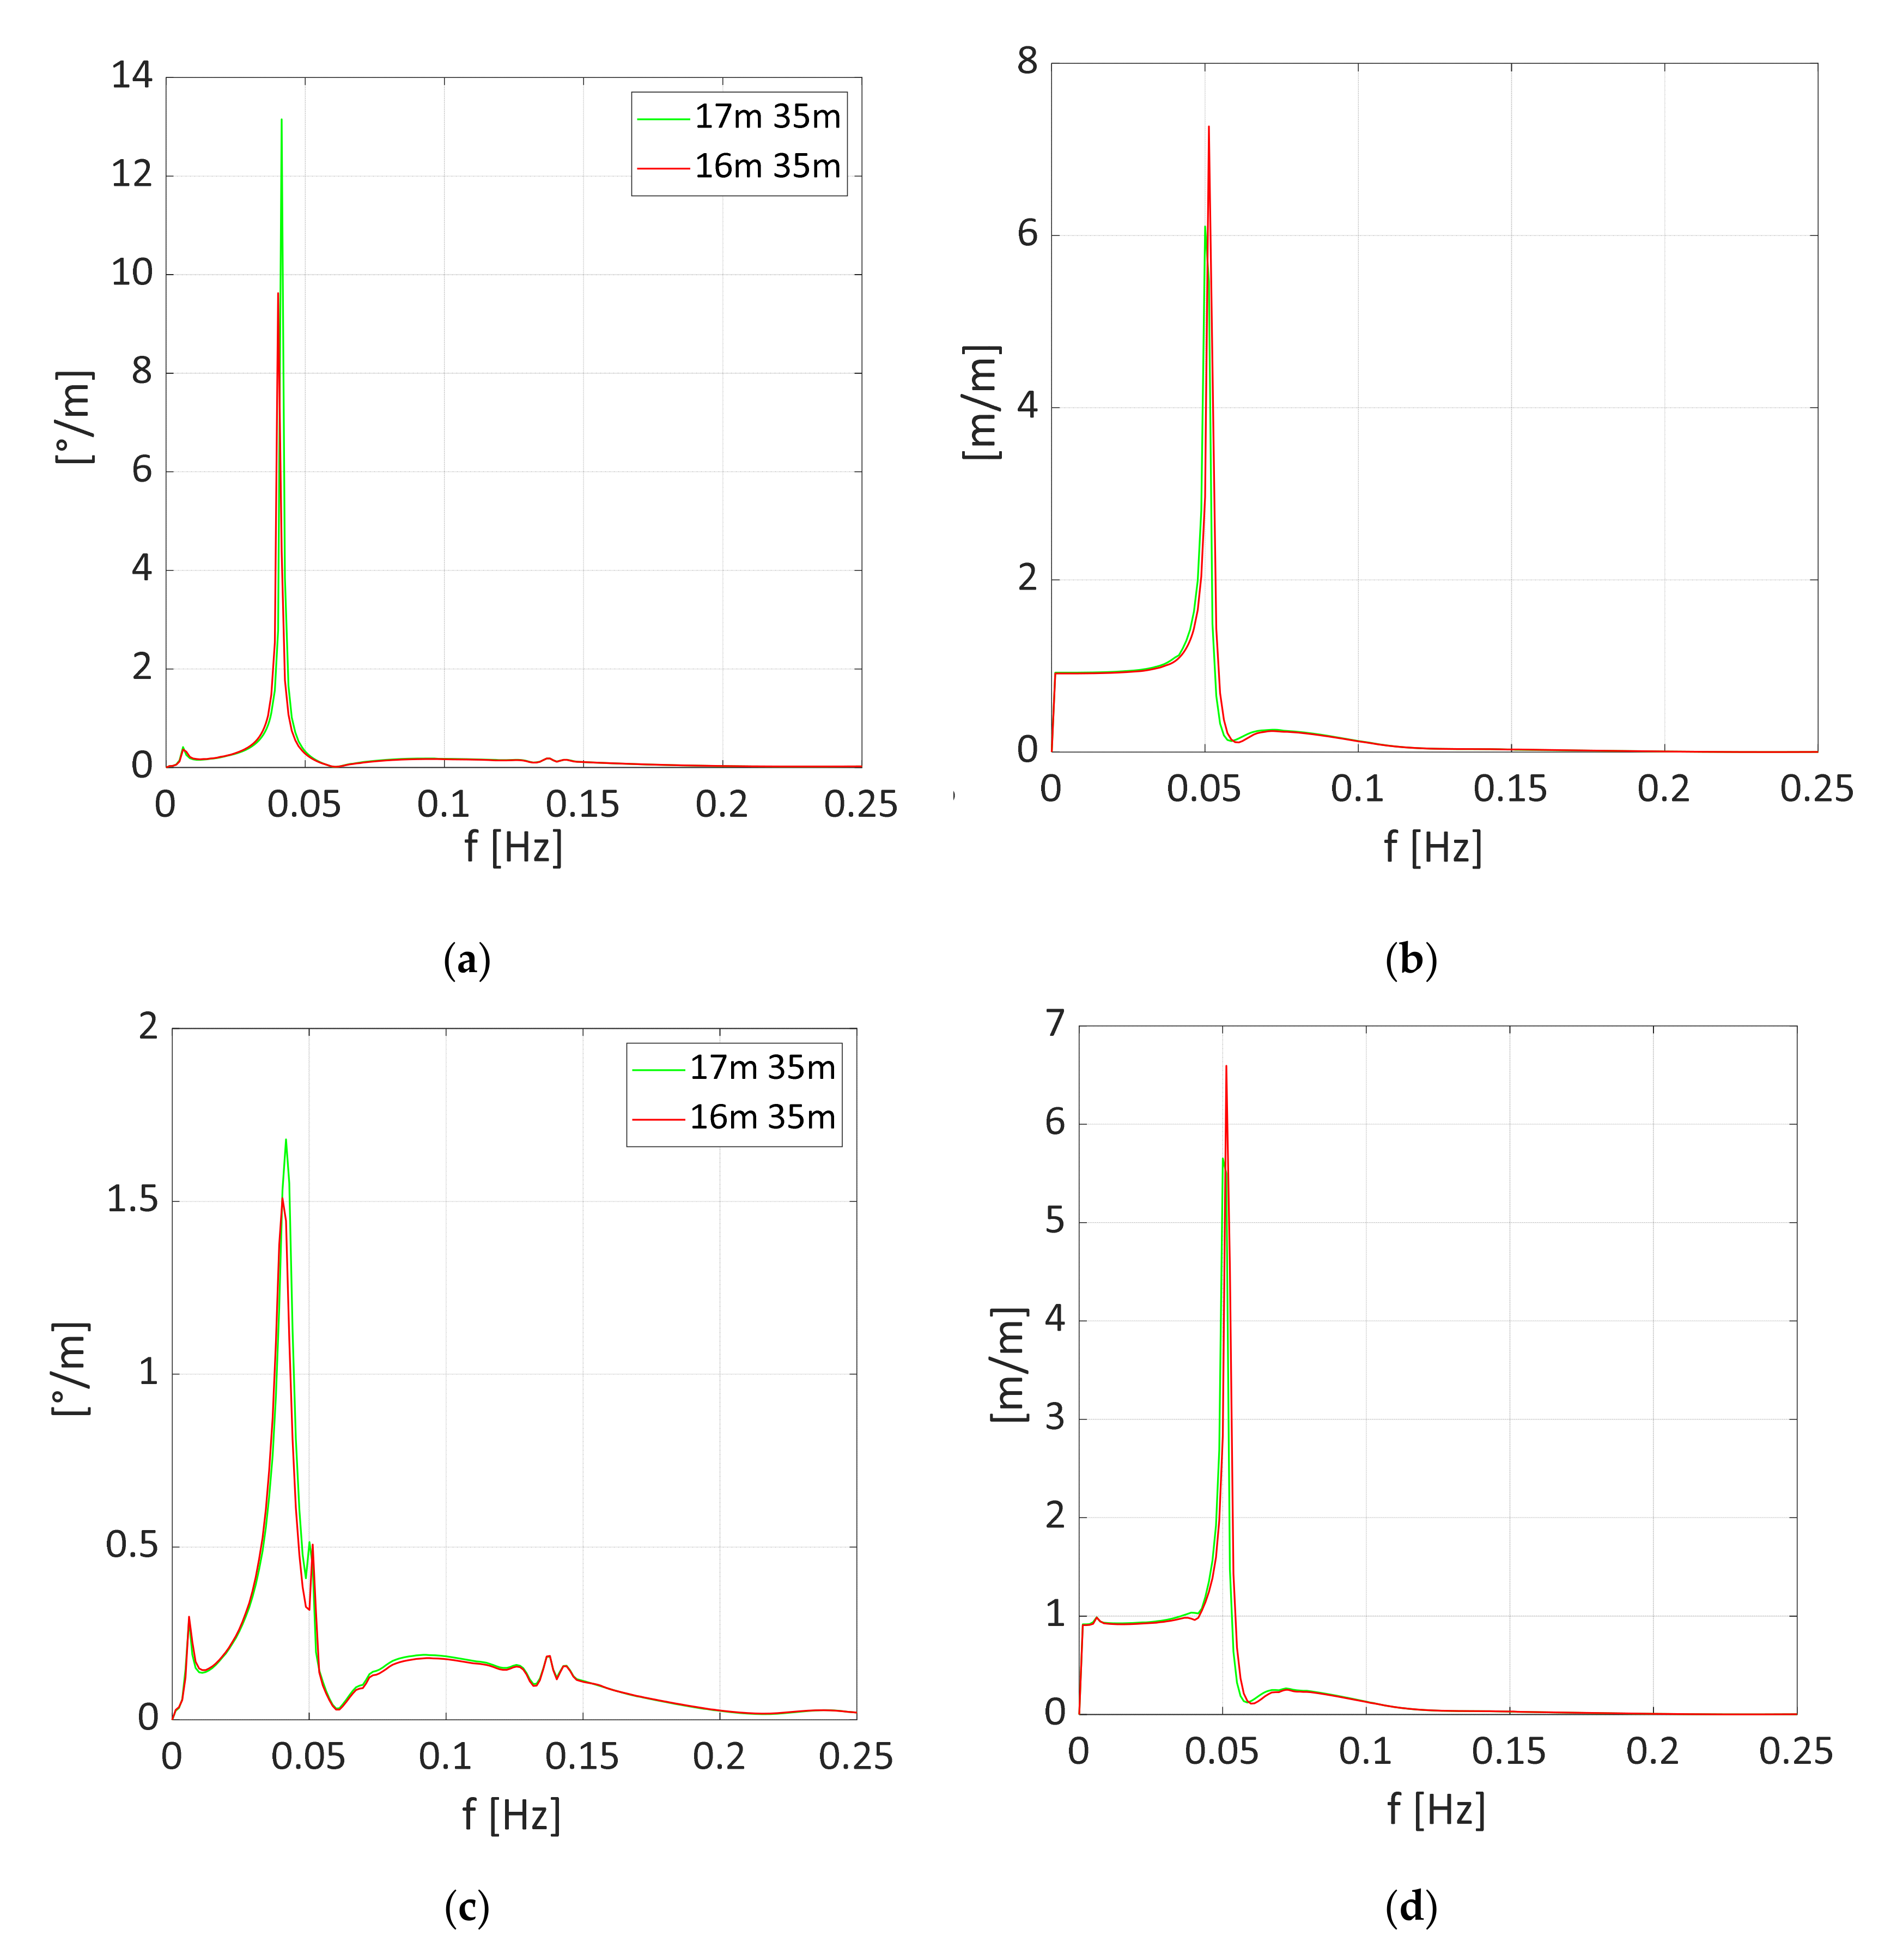
Considering all the platforms analysed, the optimal solution that presents a low heave response in the parked state and a low pitch peak in both parked and power production states (although not the lowest values) lies between 16 m and 17 m for the column diameter and 35 m for the radius of the platform. These two configurations are compared in
Figure 11. We observe that in the parked state for the combination (16 m, 35 m), the peak in pitch is reduced by about 25% with respect to the configuration (17 m, 35 m) (see
Figure 11a), whereas the heave peak is increased by 18% (
Figure 11b). In power production, the reduction of the pitch peak (see
Figure 11c) is about 10%. The smaller reduction compared to the parked case is associated with the reduced sensitivity to the platform geometry caused by damping effects stemming from the rotor, which is now relevant. On the contrary, the increase in the heave peak (see
Figure 11d) remains almost constant at 18%.
Considering that the platform response in pitch would affect more the fatigue behaviour of both turbine tower and mooring lines than the response in heave, the configuration with a 16 m column diameter and 35 m platform radius is preferred to the other option (17 m, 35 m).
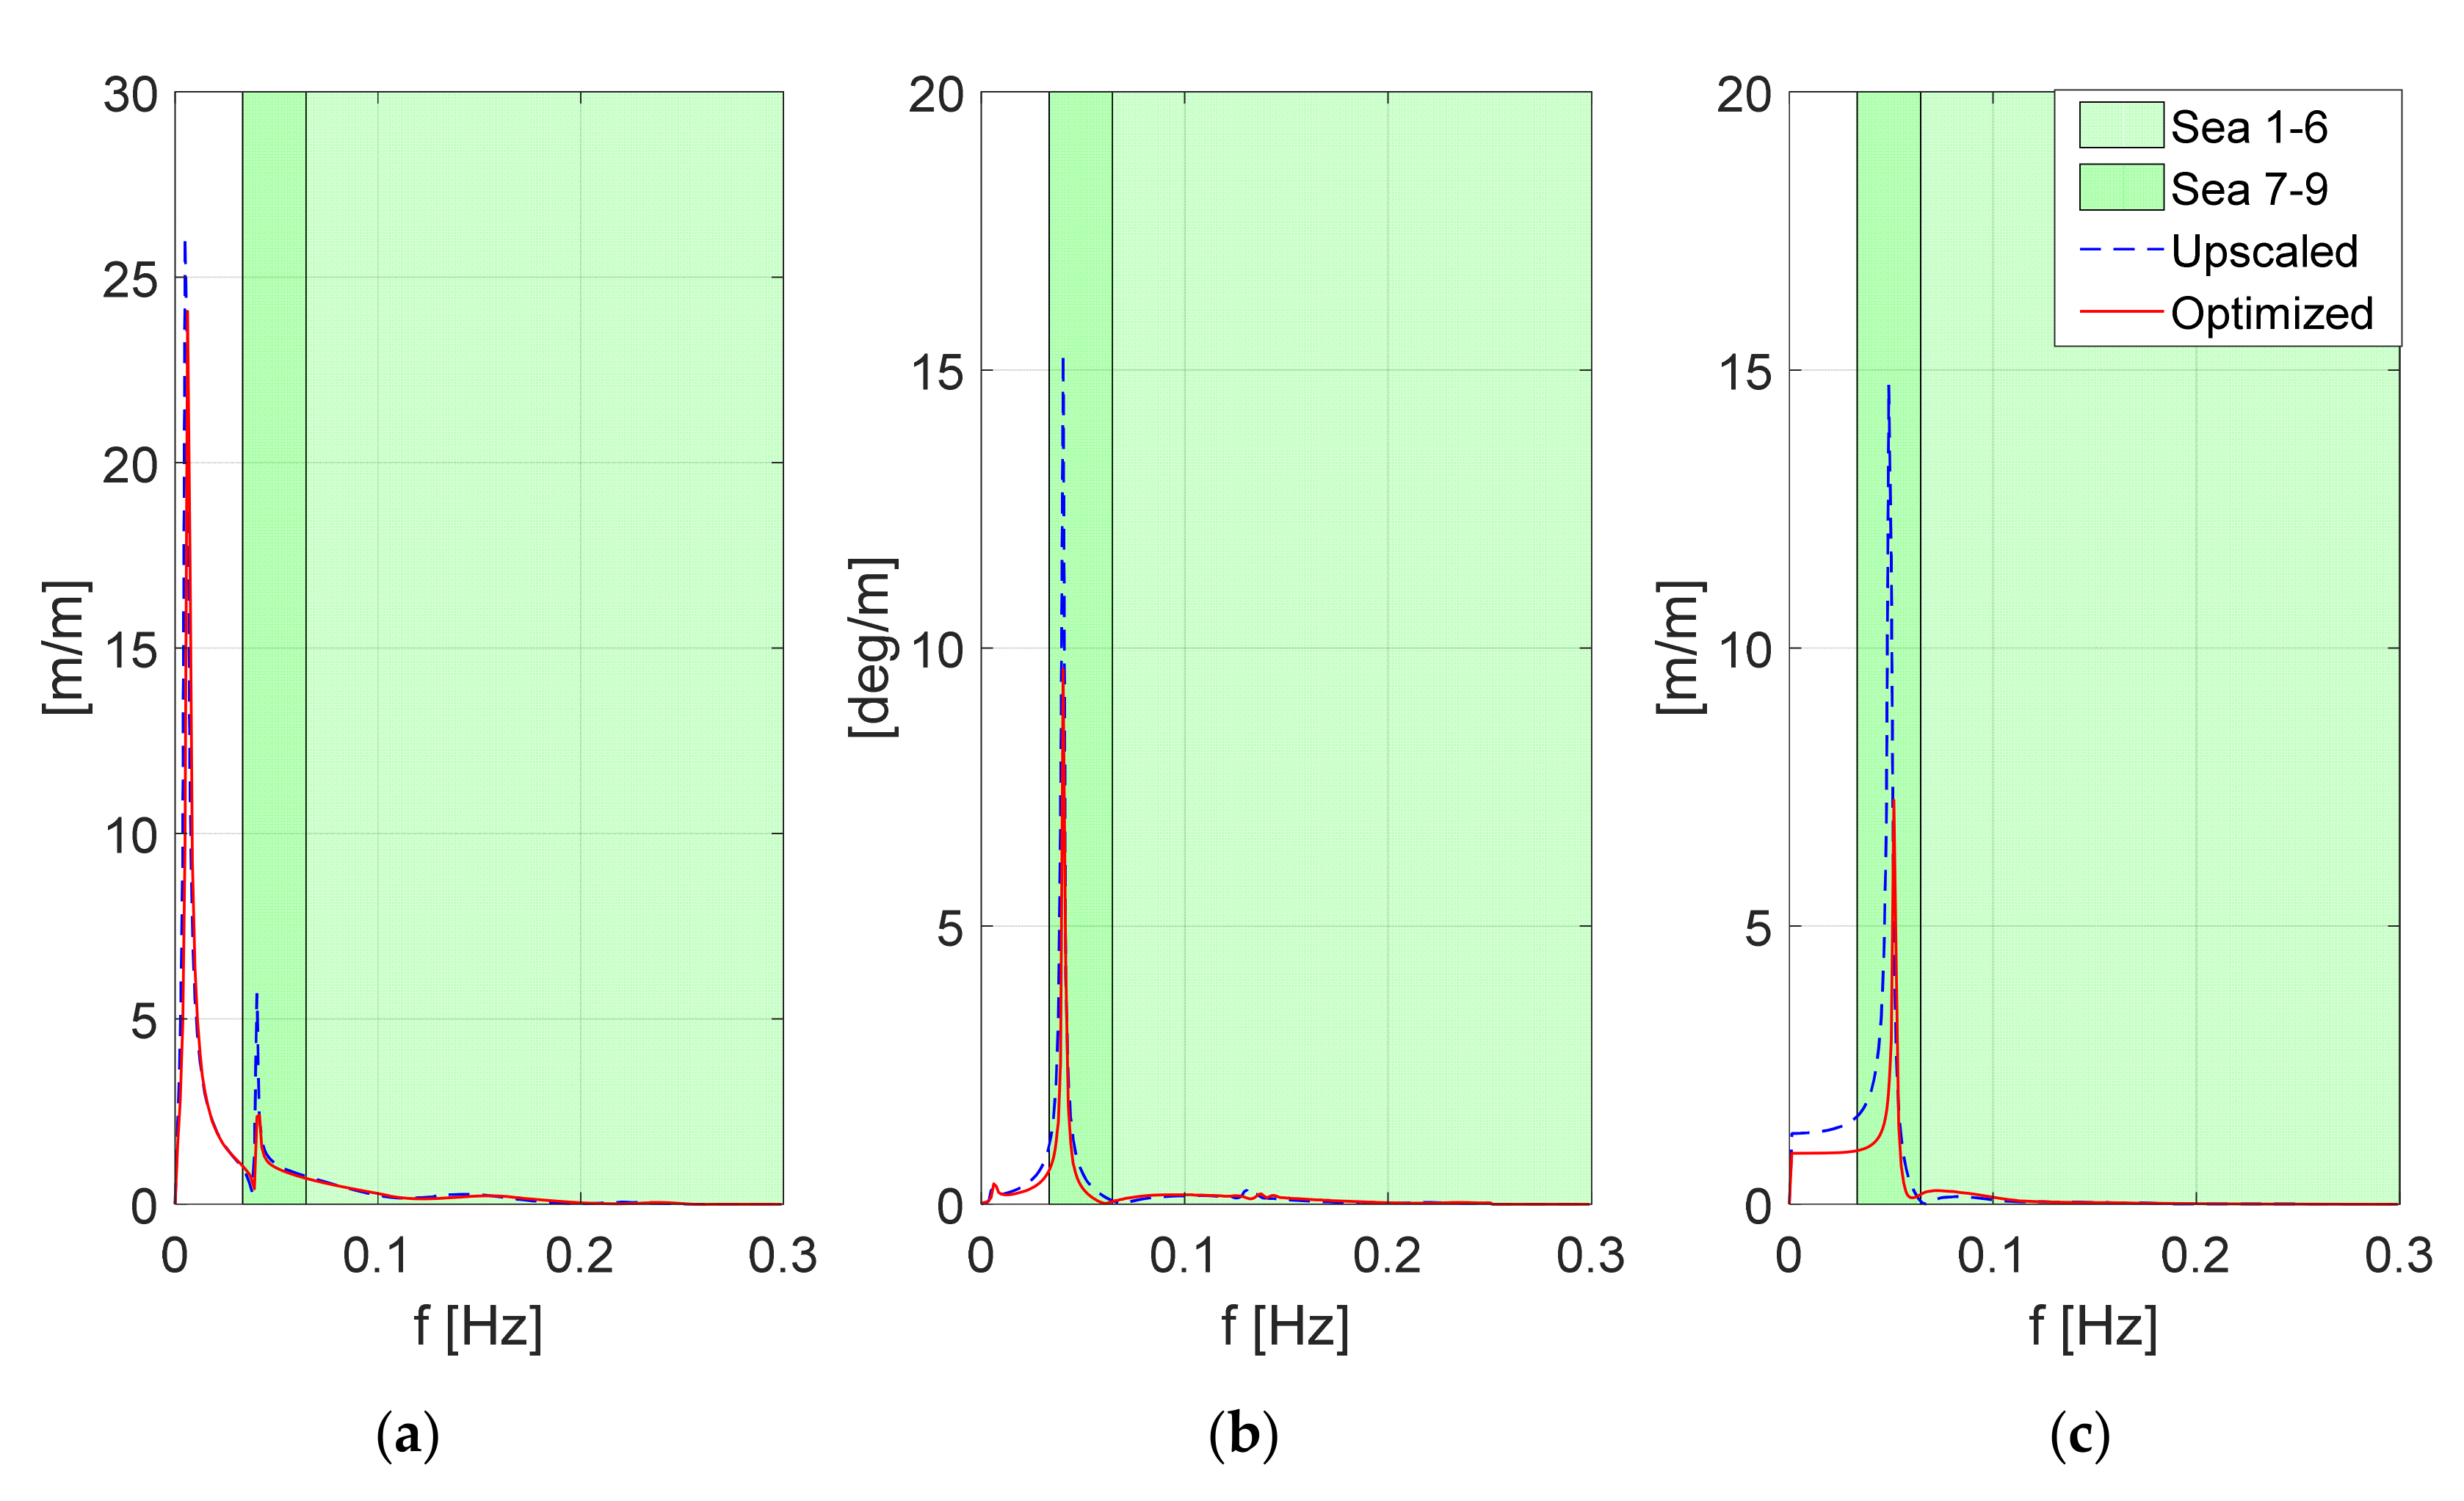
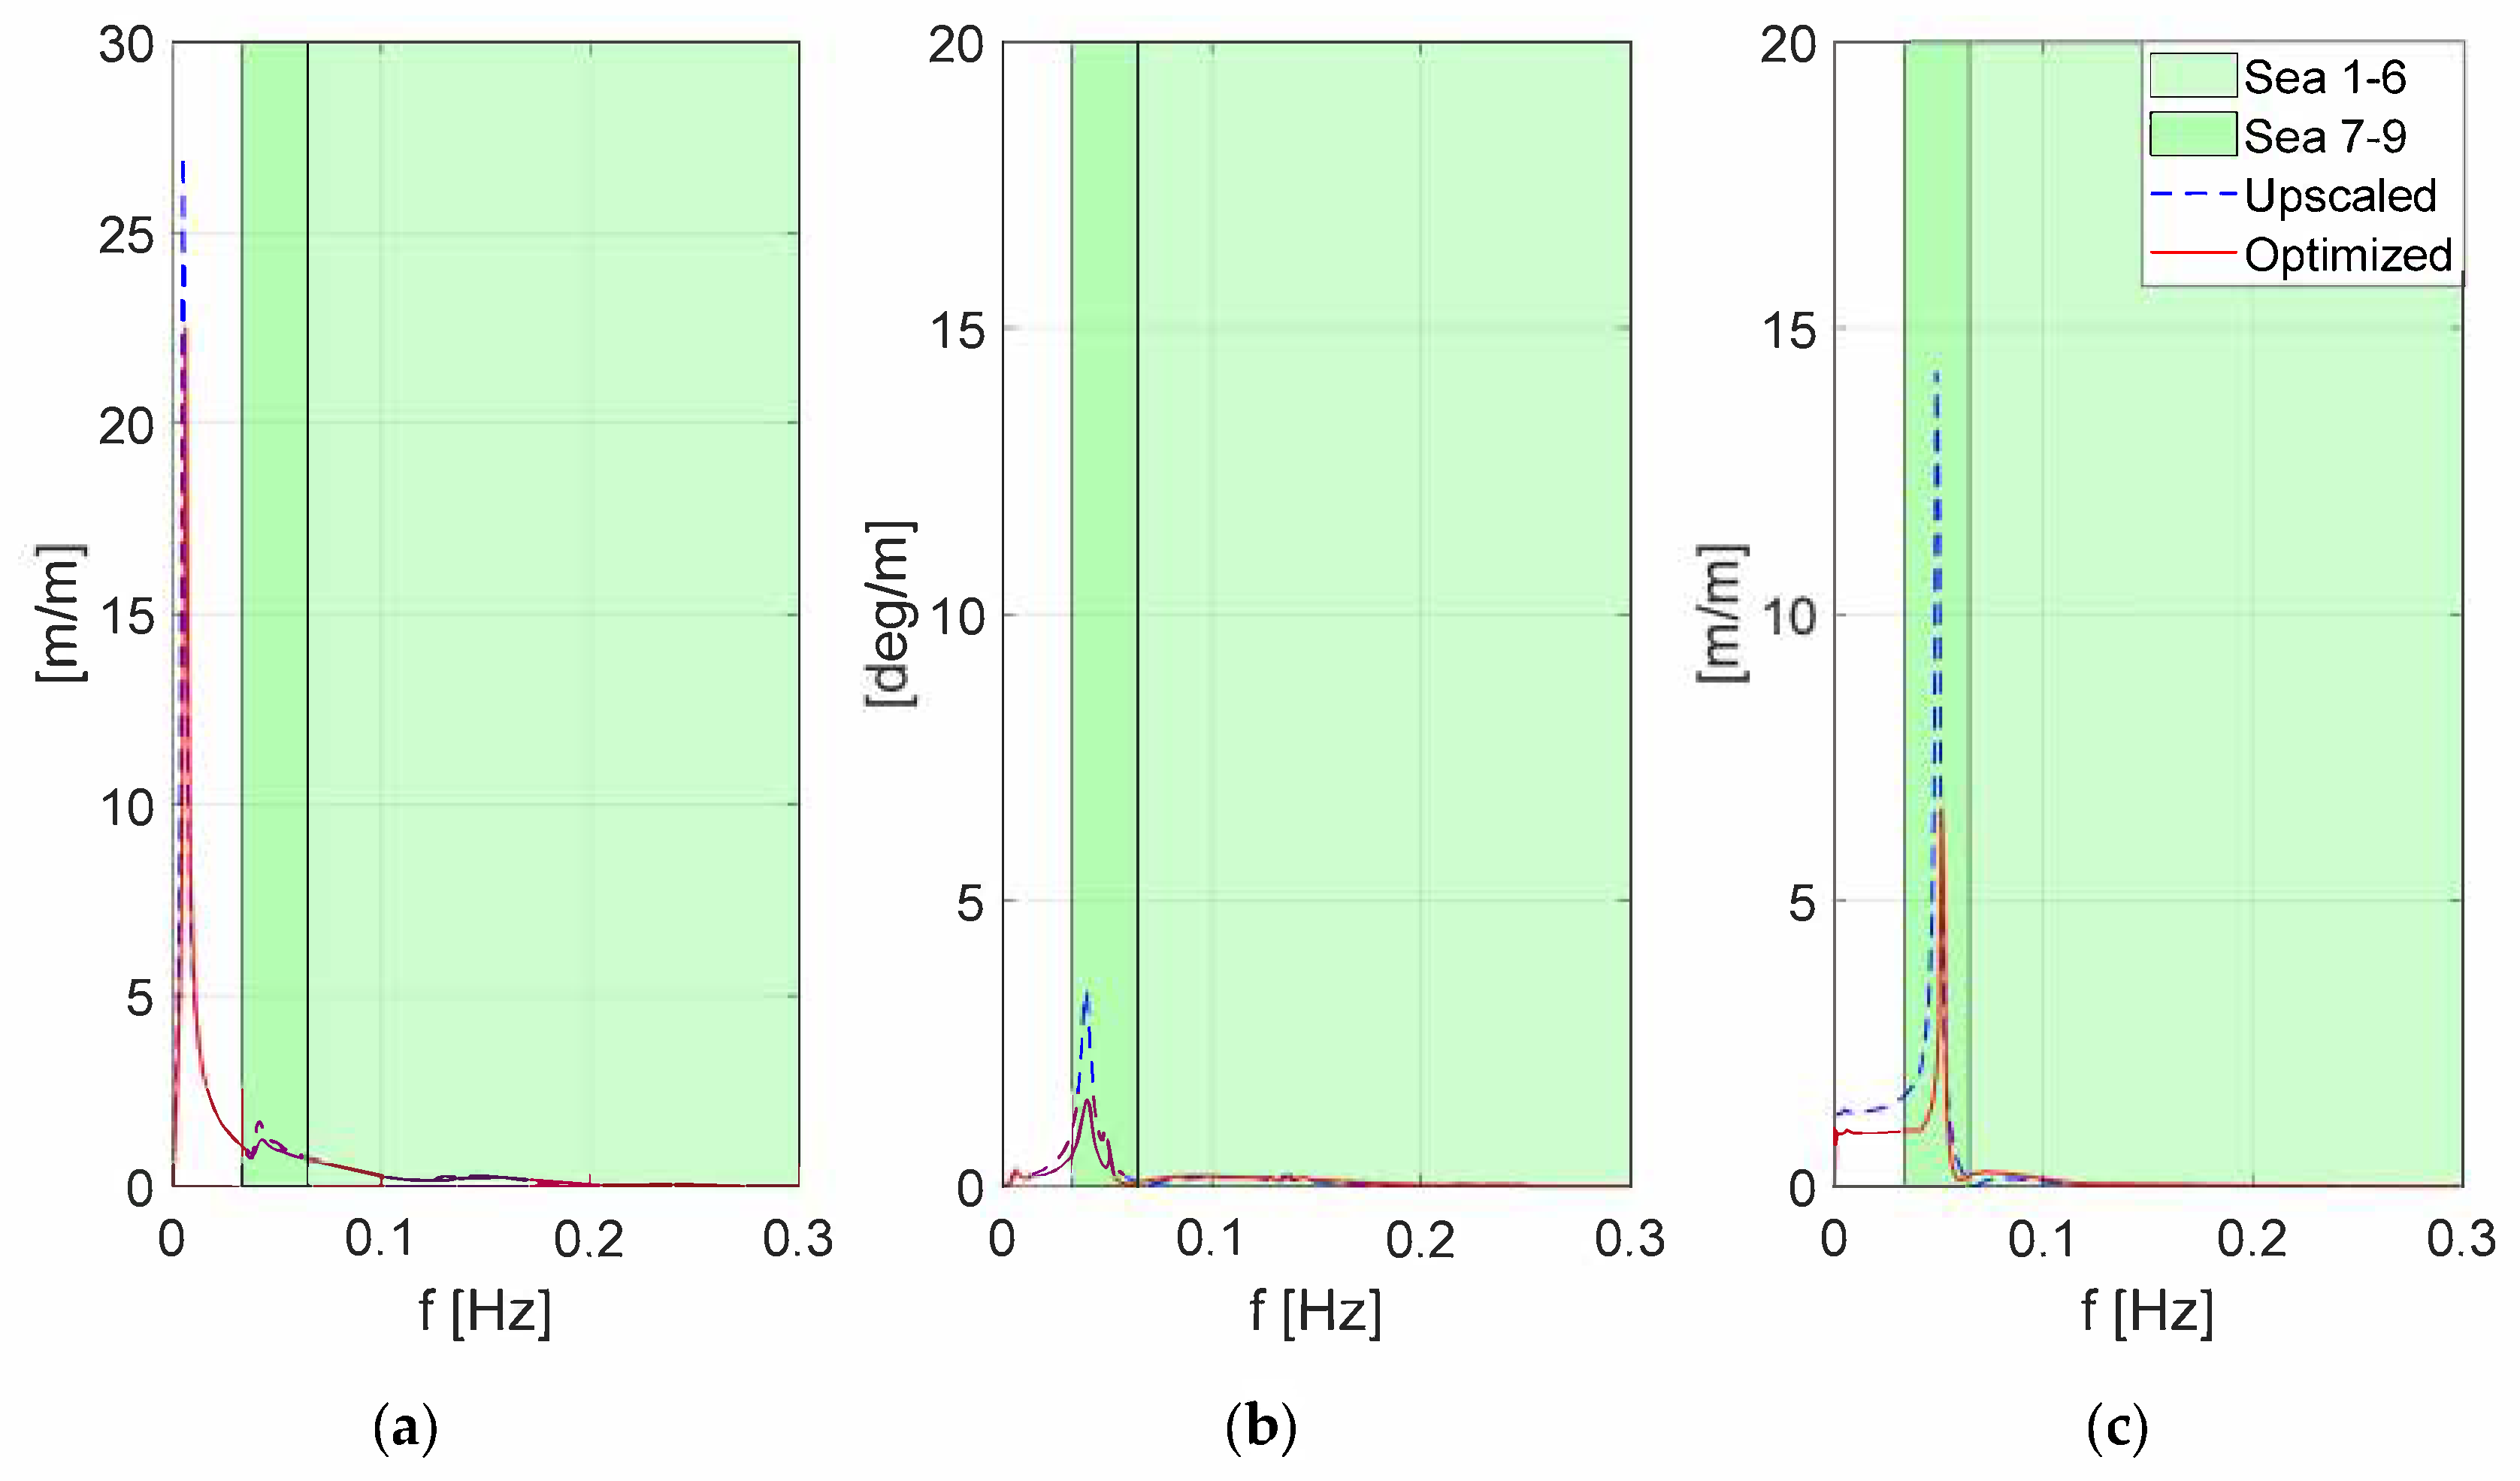
In
Figure 12 and
Figure 13, the RAOs in the surge, pitch and heave of the configuration chosen as optimal (16 m, 35 m) are compared with the RAOs of the upscaled platform (17 m, 40 m). In the figures, also shown are the ranges of typical exciting frequencies of the sea states 1–6 and 7–9. Only very severe sea states can excite the pitch and heave of both the upscaled and optimised platforms, but for the optimised one, a higher damping is achieved, both in heave and pitch in the neighbourhood of the natural frequency.
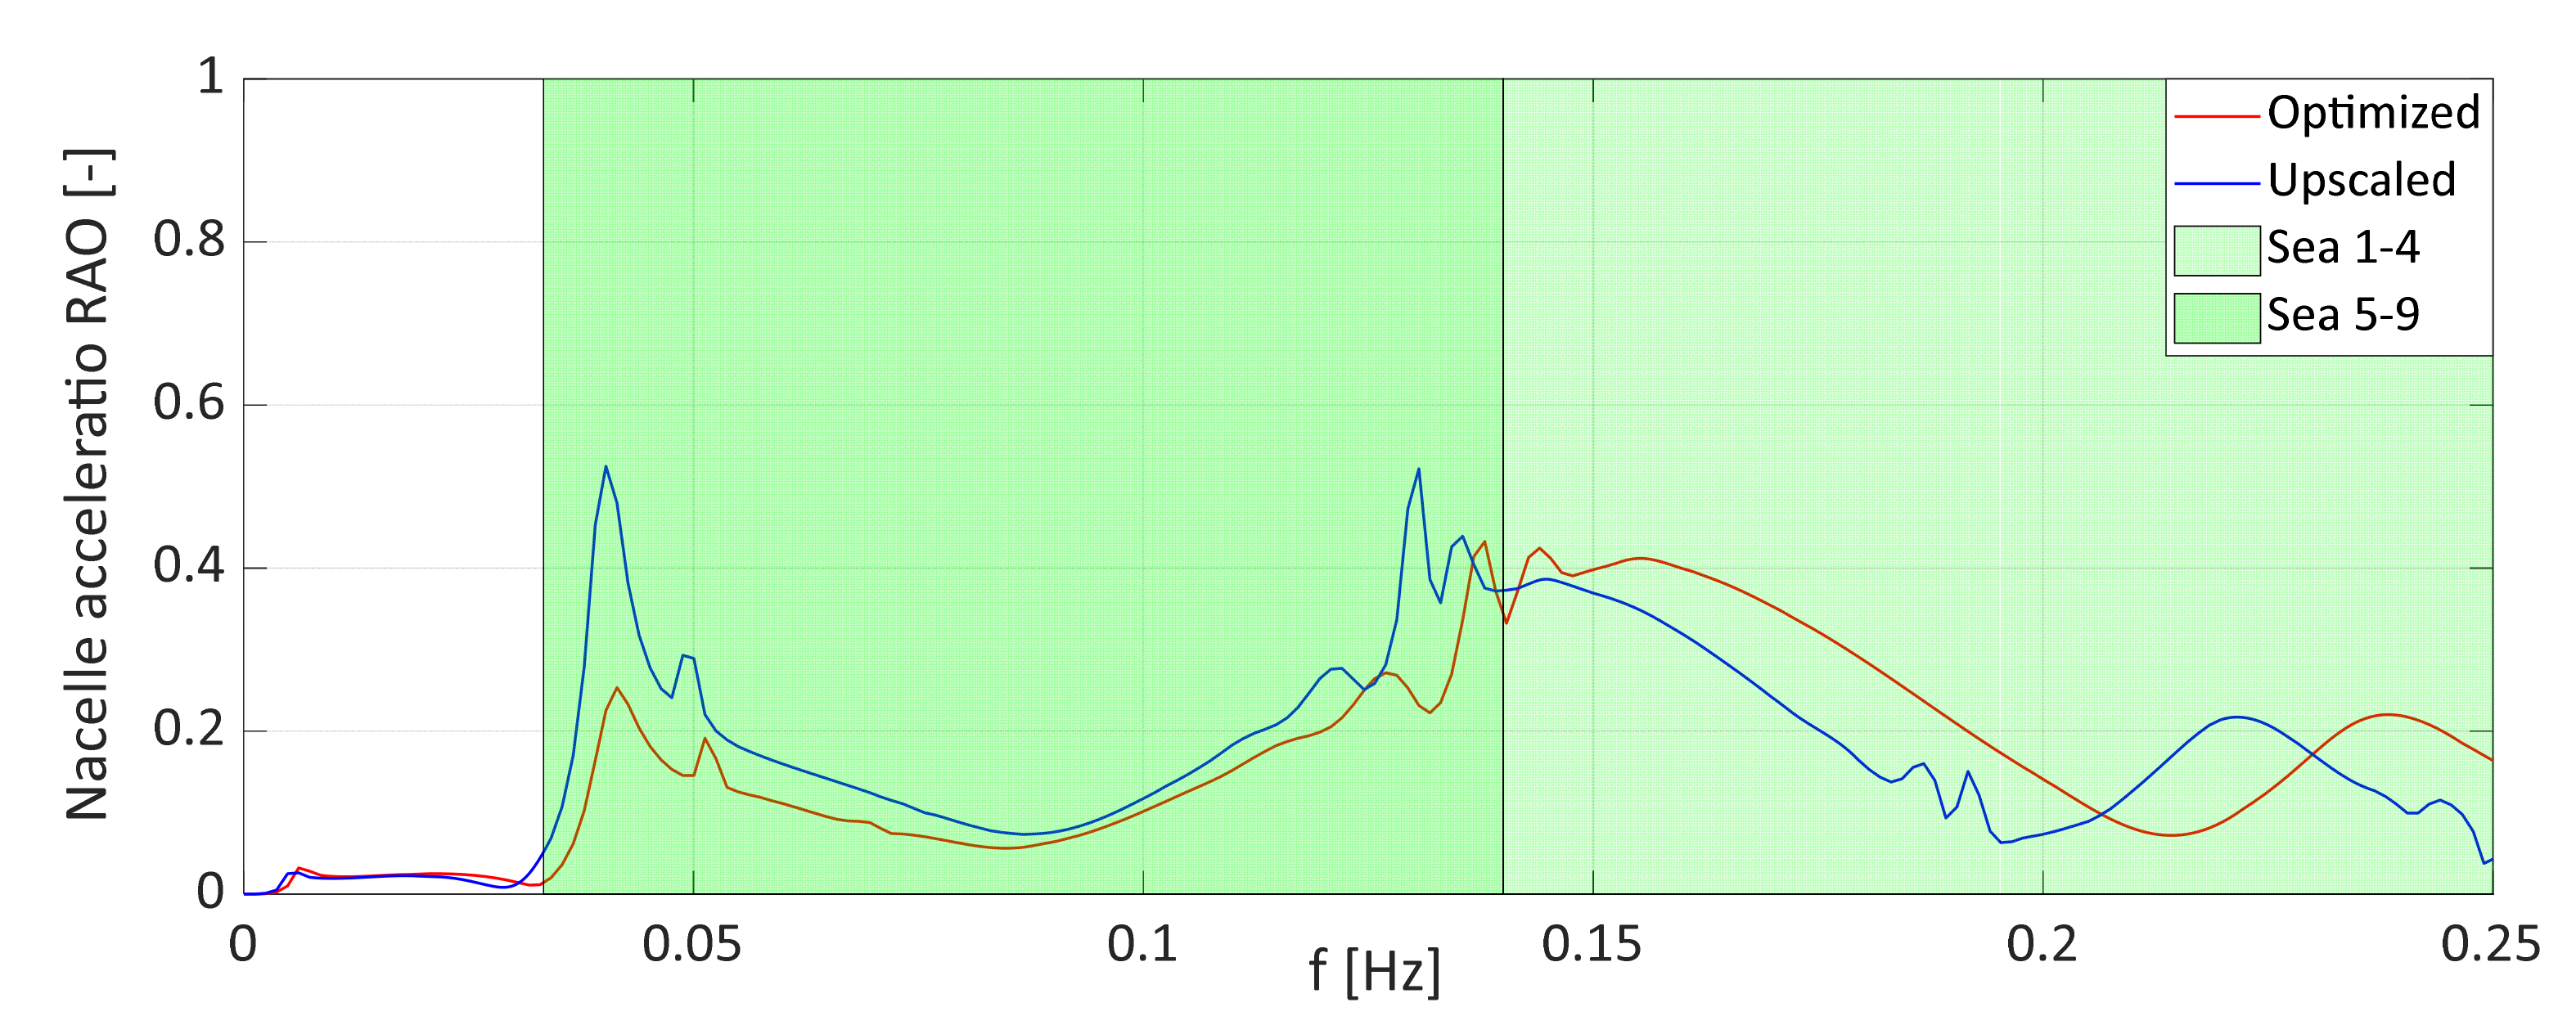
In order to assure a better performance of the wind turbine, the nacelle acceleration RAO has been evaluated for the optimised platform and compared to the one obtained for the upscaled one.
The results are presented in
Figure 14 for the case of power production. In the figure, also shown are the ranges of the typical exciting frequencies of the sea states 1–4 and 5–9. As it is possible to observe, in a wide band of realistic seas (Sea 5 to 9) compatible with power production wind speeds, better turbine performance is achieved with the optimised platform. On the contrary, the upscaled solution provides better turbine performance for mild sea states associated with low wind speeds where the optimisation process is less relevant compared with sea states from 5 to 9.
In
Table 4, the numerical values of the RAO peaks of the upscaled and the optimised platform are compared. As it is possible to observe, a low reduction is achieved in surge because the dynamic behaviour is mainly dominated by mooring lines, which are not optimised in this study.
Considering the main differences between the upscaled and the optimised platforms, heave plate thickness appears not to produce a significant benefit in the heave and pitch responses (for the upscaled platform, the heave plate thickness is equal to 8.48 m, while for the optimised ones, it is 6 m).
5. Conclusions
In the present work, a frequency domain based-investigation aimed at finding the optimal configuration of a semisubmersible platform for a 10 MW WT is presented. Firstly, a frequency domain model is formulated and verified through comparisons with benchmark results available in the literature. Then, the frequency domain model is applied to an upscaled platform designed to support the DTU 10 MW wind turbine. Both parked and power production states are simulated. Two design variables are considered, namely, the diameter of the outer columns and the platform radius. The quality of the dynamic response is assessed through selected RAO peaks and RAO integral areas over a prescribed frequency range. The results show that an optimal configuration is achieved for a diameter of the outer columns d = 16 m and a platform radius r = 35 m. Such a configuration is lighter and smaller than the upscaled one (d = 17 m and r = 40 m) and presents significantly better performances in surge, pitch and heave. Moreover, it is found that for a certain combination of diameter and radius, a coupling of heave and pitch motion arises; likewise, for spar-like platforms. The results also highlight how in the operating state, aerodynamic damping can reduce the pitch excitation. On the other hand, in the parked state, high sensitivity to pitch excitation is observed. The absence of rotor damping makes the peak in pitch about five times higher than that in power production.
We remark that the present study is purely linear and cannot capture important nonlinear effects. However, due to its efficiency, the approach proposed in this work can be of valuable support in the pre-screening phase of the optimisation-based design of very large wind turbine platforms. Moreover, the present study is limited to two design variables. A forthcoming study will extend the optimisation process to more design variables, such as platform draft and mooring line geometry.


