Abstract
A linear focus Concentrator Photovoltaic and Thermal (CPV/T) system can match the thermal demands of a user. The evaluation of the cooling fluid temperature levels of a CPV/T system is fundamental to understand if this system is capable of satisfying the typical thermal requirements of a residential user (heating, cooling and domestic hot water). First, an experimental line-focus CPV/T system, realized in the Laboratory of Applied Thermodynamics of the University of Salerno (Italy), has allowed to determine the cooling fluid temperature at the CPV/T system outlet. Successively, the cooling fluid temperatures, experimentally obtained, have been compared with the same temperatures calculated by means of a theoretical model under the same operation conditions. A deviation in terms of the percentage relative error between theoretical and experimental results included between about 0.5% and 5%, has been found. The goodness of the theoretical–experimental comparison in terms of the temperature of the operation fluid at the CPV/T system outlet has represented a fundamental point to evaluate theoretically, by means of the TRNSYS software, the other levels of temperature of an integrated system, constituted by CPV/T system, thermal tank and user, for different temporal scenarios (hourly, weekly, monthly and yearly). The input data of the TRNSYS model are: Direct Normal Irradiance (DNI), Triple-Junction (TJ) cell temperature and environmental conditions. A tank model is also adopted to satisfy the thermal energy demand peaks, and the temperature stratification in the tank linked to the CPV/T system, as function of the height, is obtained in winter and summer. It is important to define these thermal levels to verify if a CPV/T system is capable to satisfy the residential user energy demands or a thermal energy integration is necessary in some periods of the year. A good stratification has been noted in the summer season, with temperature values that are variable between about 40 and 90 °C. From April to October, the tank average temperature is generally resulted about 10 °C higher than the temperature required by the fluid sent to the residential user, and a very low integration is then necessary. It has been verified that the CPV/T system covers a large part of the thermal energy needs of the residential user during the year; the coverage is limited only in the winter months.
1. Introduction
The Concentrator Photovoltaic (CPV) systems adopt an optics to focus solar radiation onto Triple-Junction (TJ) cells with a consequent increase in the electrical performances of the CPV system and the TJ cell temperatures. The Concentrator Photovoltaic and Thermal (CPV/T) systems allow instead to produce both electrical and thermal energy [1]. Hence, the CPV/T systems have a high potential both in residential and industrial applications. For example, the thermal and electrical performances of a CPV/T cogeneration system applied to a textile industry, are analyzed in [2]. A CPV/T system is used for a residential user in [3].
In the literature, there is not a standard configuration of a CPV/T system capable to obtain both electrical and thermal energy, but there are several solutions, also depending on the optics [4]. The performances of a parabolic concentrator are studied in [5] in electrical and thermal terms. A CPV/T system which uses a Fresnel optics is studied in [6].
The electrical and thermal performances of a CPV/T system depend above all on the TJ cell temperatures. A review of the different methodologies adopted to calculate the TJ cell temperature in high-concentration systems is reported in [7]. There are methods that use direct measurements on the module and indirect methods based on atmospheric parameters. The study shows which the methods that adopt direct measurements are the best, but the methods based on atmospheric parameters are useful when direct measurements are not feasible. A Random Forest model capable to calculate the TJ cells temperature in a CPV system, is presented in [8]. The TJ cell temperature has been evaluated for two typologies of TJ cells, referring to different concentration factor values and environmental conditions. Hence, in the literature, many studies show that the solar concentration causes an increase in the electrical performances of the CPV system and of the TJ cell temperatures [9]. The temperature of TJ cells under concentration affects the cooling fluid temperature of a CPV/T system. Hence, by varying the mass flow-rate of the cooling fluid, it is possible to obtain different fluid temperatures, and consequently the thermal energy can be supplied in many thermal processes [10]. A line-focus CPV/T system that adopts an active cooling is presented in [11]. A concentration factor optimized value capable to give a fluid outlet temperature that matches the thermal and cooling requirements, decreasing the CPV/T system size, is determined in [12] in different working conditions. The dynamic model of a CPV/T system is studied in [13] to calculate the cooling fluid temperature.
There are not papers in the literature that determine, in each operation condition, all levels of temperature of a CPV/T system when it is adopted to supply thermal energy to a user during the year. Hence, it is first of all fundamental to define the temperature levels reached by the CPV/T systems to understand if this typology of system is able to meet, totally or partially, the residential user thermal needs during the year. Therefore, the main purpose in this paper is the accurate determination of the temperature levels reached in a line-focus CPV/T system, when it is used to satisfy the thermal energy demands of a residential user (heating, cooling, domestic hot water). For this purpose, in this paper a further in-depth of the model studied in [14] is presented, determining an accurate tool capable to calculate the cooling fluid temperatures of the CPV/T system, the temperature stratification of the thermal tank and the temperatures of the user for different temporal scenarios. First, an experimental apparatus, built in the Laboratory of Applied Thermodynamics of the University of Salerno (Italy), can determine the cooling fluid temperature at the CPV/T system outlet according to same operation conditions of the theoretical model in terms of TJ cell temperature, Direct Normal Irradiation (DNI), environmental temperature, water mass flow-rate and temporal period. The good theoretical–experimental comparison in terms of the temperature of the working fluid at the CPV/T system outlet, is a basic aspect to calculate theoretically, by means of the TRNSYS 16 software [15], the other levels of temperature of the CPV/T system for different temporal scenarios (hourly, weekly, monthly and yearly), such as the temperature stratification in the thermal tank and the temperatures of the user. Hence, it is possible to establish if a CPV/T system is able to satisfy the thermal loads of a residential user, or a thermal energy integration is necessary in some periods of the year.
2. Description of the Linear Focus CPV/T System
The experimental CPV/T system, realized in the Laboratory of Applied Thermodynamics of the University of Salerno (Italy), presents a linear optics that focuses the solar radiation on a tube where the Triple-Junction (TJ) cells are arranged in series and the cooling fluid flows (Figure 1); the TJ cells are oriented downwards in the direction of the reflective surface. The number of cells depends on the electrical load. The optics is reflective and is realized by parabolic trough concentrator. The solar cells consist of InGaP/InGaAs/Ge and have an area of 1.0 cm2 (Table 1).
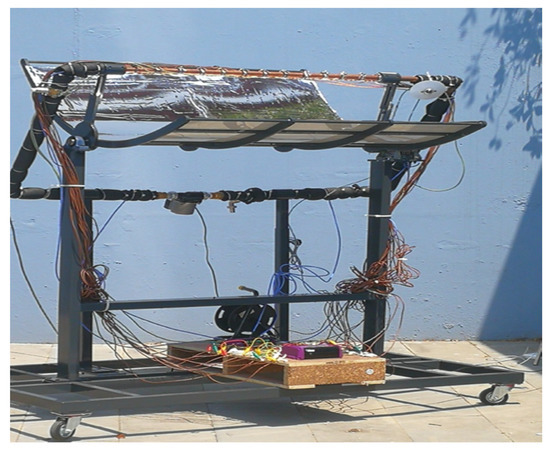
Figure 1.
Linear focus experimental Concentrator Photovoltaic and Thermal (CPV/T) plant.

Table 1.
Characteristics of the Triple-Junction (TJ) solar cells.
The experimental system also adopts a tracker capable of focusing the maximum solar radiation on the TJ cells. The freedom degrees of the system allow its movement in the north-south and east-west directions, and to modify the focal length in order to always have the maximum concentration. The first two freedom degrees allow the solar tracking by means of a rotation both in the horizontal plane to follow the sun in the azimuth direction and in the vertical plane to follow the sun in the zenithal direction. Moreover, the TJ solar cells are located at a variable distance from the primary optics, and then the focal length is considered as a further degree of freedom in the experimental tests. Hence, the parabolic optics is moved on a vertical axis and its distance is modified compared to the cells; the solar radiation that reaches the TJ cells and the concentration factor (C) can be then varied. A C value of about 100 is obtainable by the experimental CPV/T system corresponding to an optimum focal length.
A pyrheliometer (accuracy of 2%) is used to measure the solar radiation. PT100 thermo-resistances (accuracy of ±0.2 K) are adopted to measure the TJ cell, working fluid and environmental temperatures. In particular, in addition to the environmental temperature, the temperature of five TJ cells in different points of the tube and of the cooling fluid at the inlet and outlet of the tube subjected to the solar radiation, have been measured. All measures have been monitored by a data logger (accuracy 2%).
In the modeling, a cooling circuit is considered to preserve the TJ cells’ electric efficiency [16] and to produce thermal energy (Figure 2); a water tank is necessary to store the thermal energy. A thermostat that controls an automatic valve is adopted, and the cooling fluid, once it has reached the set-point temperature, is sent to the tank, and the cold fluid enters again the circuit. A CPV/T system with modules of sixty cells has been used in the model to match the residential user energy needs.
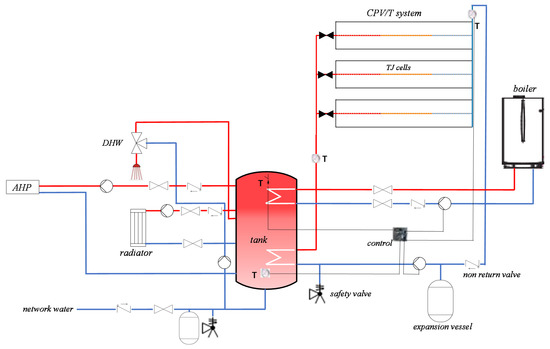
Figure 2.
Scheme of the CPV/T system subjected to a residential user.
3. Modeling of the CPV/T System
A linear focus CPV/T system can satisfy, totally or partially, the electrical and thermal loads of a residential user [17]. The evaluation of the cooling fluid temperatures is fundamental to understanding if a CPV/T system is able to match the typical thermal demands of a residential user (heating, cooling and Domestic Hot Water (DHW)).
Hence, the dynamic behavior of a linear focus CPV/T system is modeled in this paper by means of TRNSYS software [15]. It can simulate in transient regime a system that presents a modular structure linking different subprograms; each subprogram generates an input for the next module. Therefore, the CPV/T system is modeled in TRNSYS by a built-in components library, considering several components such as mixers, pumps, diverters and valves. [15].
DNI and TJ cell temperature represent the model input data and have been included in TRNSYS as generated functions, respectively evaluated in [18] and experimentally in [3,4,5,6,7,8], as well as the energy needs of the residential user. On the contrary, the operation of CPV/T system, water tank and control strategy are modelled by means of the TRNSYS modules [15], as shown in Figure 3 and Figure 4.
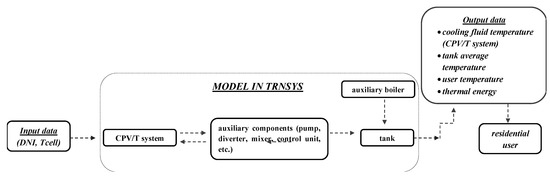
Figure 3.
Integrated model of the CPV/T system.
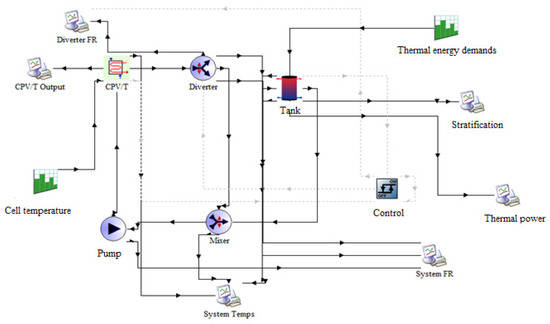
Figure 4.
Scheme of the TRNSYS model.
The thermal model of the CPV/T system considers the link between the water tank and the residential user demands adopting a proper control. The cooling fluid flows by the CPV/T system (Figure 2) to the thermal tank, when the set-point temperature is reached: 50 °C (DHW), 60 °C (heating) and 90 °C (solar cooling). The cold fluid returns to the CPV/T system, and the hot fluid in the upper part of the tank can be used to satisfy the thermal needs of the user; an auxiliary boiler is used, if necessary.
Corresponding to every time step, the fluid temperature values at inlet and at the tank bottom are fixed, while the temperature of the fluid that flows by the CPV/T module to the tank is evaluated by means of the model. The TRNSYS module [15] evaluates, for every time step, the fluid temperature and, operating together with the tank module, sends it to the user once it has reached the temperature value able to satisfy, according to the control system, the thermal demands of the residential user. Hence, the thermal tank model by means of the Type 4 module of TRNSYS, is also considered. A multi-node model is adopted to study the tank stratification [19]. The tank has been subdivided in twenty nodes, spaced from each other by 0.18 m, and the hypothesis of perfect diffusion is considered.
The integrated TRNSYS model also presents a diverter, a pump and a mixer that link all the components of the CPV/T system and ensure its operation according to the control system (Figure 4). In the CPV/T system cooling circuit, the pump, which presents an efficiency equal to 0.7, allows to cool the TJ cells and to recover thermal energy. Moreover, a two-way valve is also used at the CPV/T system outlet. An Absorption Heat Pump (COP = 0.9) is considered to satisfy the cooling load. Other fundamental parameters of the model have been defined: global heat transfer coefficient (2.1 W/K), CPV/T system inlet temperature (15 °C), boiler temperature difference (6 K), heat loss coefficient of the tank (8.0 × 10⁻³ W/m2K), etc. The capacity of the tank considered is 4500 L; the height and diameter of the tank are respectively equal to 1.5 and 0.5 m. The internal and external diameters of the tube are respectively equal to 32 and 35 mm, the fluid speed is 0.38 m/s; the volumetric flow-rate in the circuit is 1100 L/h.
Hence, the integrated model evaluates, in all the operation conditions and what was once known the TJ cell temperature, the cooling fluid temperature of the CPV/T system, the temperatures stratification in the tank and the temperatures of the user. The thermal model in TRNSYS of the CPV/T system adopts as an input the TJ cell temperature values obtained experimentally in [3,4,5,6,7,8].
The thermal energy obtained corresponds to the solar radiation incident on the TJ cells not converted into electric energy. The electrical production of a CPV system depends on DNI, concentration factor, optical efficiency and TJ cell temperature. The optical performances significantly affect the energy efficiency of a CPV system. In fact, only a well-sized optical system can adequately concentrate the solar radiation on the TJ cells ensuring a high electric producibility [20]. The geometrical concentration factor (Cgeo) is equal to the ratio between solar concentrator area () and TJ cell area ()
and results constant once fixed the optics dimensions. According to the typology of optics, not all the power incident on the concentrator reaches the TJ cell, due to several losses. Hence, a more accurate measurement is given by the optical concentration factor (Copt), defined as the ratio between the solar radiation concentrated on the TJ cell (Ic) and the DNI that represents the incident power flow on the optical system:
Copt depends only on the system optical performances and not on the TJ cell electrical performances. The relationship between the two different definitions of concentration factor is the following
where is the system optical efficiency equal to the ratio between the incident powers, respectively, on receiver and concentrator. The possibility of the experimental CPV plant varying the distance between optics and the TJ cell allows one to experimentally evaluate the optimal distance and the performances in the not focused positions.
Once the temporal level (hourly, daily, monthly) of the DNI is defined, the TJ cell electric energy is equal to [21].
where Ac is the cell area, ηopt the optical efficiency [21] and ηc the cell efficiency equal to:
The values of σt (temperature coefficient), Tref (reference temperature) and ηref (reference efficiency) are reported in Table 1 according to the TJ cell manufacturer indications [22].
Therefore, referring to the CPV system constituted by a variable number of cells subdivided in several modules, the CPV system electrical energy is calculated in this way
where nc is the number of cells considered, ηmod is the module efficiency that until 100 cells is equal to 0.95 [4], and ηinv is the inverter efficiency.
As said above, the thermal energy obtained by the TJ cells corresponds to radiation incident on the cells not converted into electric energy:
The CPV/T system electric efficiency (ηe,CPVT) depends on the TJ cells and module efficiencies
where ppar is a loss factor depending on the solar radiation and linked to parasitic power consumption for tracking motors and coolant pump. It is assumed to be 2.3% of the intercepted radiation power [23].
The solar radiation incident on the TJ cell causes its heating, but also thermal energy losses due to radiative and convective transfer heat.
where εc (0.85) is the cell emissivity [23]. The actual thermal energy is equal to the difference between total thermal energy and radiative and convective losses. Hence, considering the global thermal power and the TJ cell temperature values, the cooling fluid temperature in the CPV/T system is determinable by the equation.
where the values of the mass flow-rate and specific heat of the fluid are fixed in the TRNSYS module.
4. Results and Discussion
It is important to define the thermal levels reached by the CPV/T system and by thermal energy tank. This is the only way to understand if the operation fluid temperatures reach the average values necessary to match the thermal demands of a residential user (50 °C for domestic hot water, 60 °C for heating and 90 °C for solar cooling). Hence, in this paper, these thermal levels have been determined for different temporal scenarios: hourly, weekly, monthly and yearly. A TRNSYS model of the integrated CPV/T system is adopted, considering also the thermal tank model.
4.1. Evaluation of the Model Input Data
The main model inputs are the DNI and the TJ cell temperature that have been previously evaluated, together with related uncertainties, in [18] and [3,4,5,6,7,8], once concentration factor and environmental conditions are known. Moreover, it is necessary to determine the thermal demands of the residential user to evaluate the model results and to obtain the dynamic simulation of the CPV/T system. It is necessary to know, in the CPV/T system model, the DHW, heating and cooling needs of the residential user. A house of 110 m2 with four people has been considered. The annual energy requirements [24] are related to the city of Salerno (Italy), as shown in Table 2.
Table 2.
Energy demands of the user during the year.
The thermal performances of the CPV/T system have been evaluated by the integrated model during the year considering standard weeks. Periods with the same climatic conditions and thermal loads, and related to many years, have been considered for the city of Salerno (Italy) [25]. A clustering algorithm has been adopted to study the same periods of the year. The algorithm is the k-means clustering of Matlab [26], that divides a set of objects in k groups. Four different weekly clusters, different from the climatic and energy point of view, have been obtained (Cluster 1 (C1): April, May, June, September, October; Cluster 2 (C2): January, February, December; Cluster 3 (C3): March, November; Cluster 4 (C4): July, August). The clustering follows above all the heating and cooling requirements [27], because the DHW demands are constant during the year. Moreover, three typical days (sunny day, cloudy day, variable day) are considered (Table 3), using values of over 30 years [28].
Table 3.
Number of cloudy, variable and sunny days.
As for the input data, the weekly trends of the simulated values of DNI and TJ cell temperature for the four clusters are shown in Figure 5 and Figure 6; the values of Figure 5 follow the cloudiness. For example, in C4 all days are sunny, showing high values of DNI; on the contrary, in the other three clusters, the sunny days decrease. Considering the data of Figure 5, Table 3 and a concentration factor value equal to 100 for the linear focus CPV/T system previously described, the model described in [8] and the experimental data obtained in [3] have been adopted to calculate the TJ cell temperature during the year. Hence, in Figure 6, the weekly trend of the TJ cell temperature of the CPV/T system is shown for the four clusters. In the winter season, the average TJ cell temperature is about 40 °C, while in summer its average value is about 80 °C.
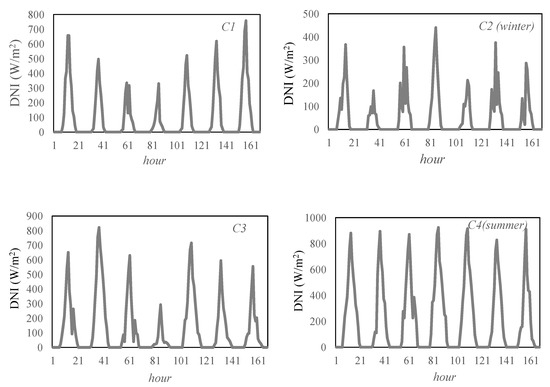
Figure 5.
Direct Normal Irradiation (DNI) weekly distribution for the four clusters.
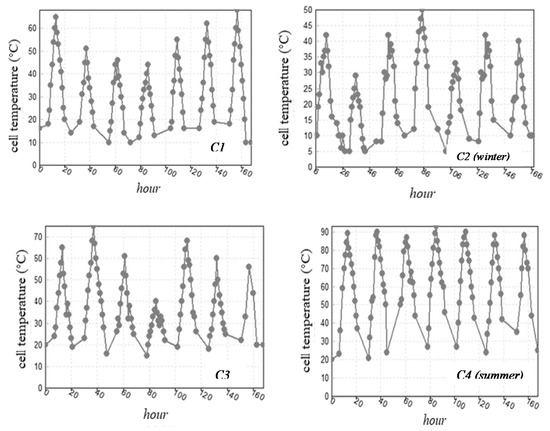
Figure 6.
TJ cell temperature weekly distribution for the four clusters.
4.2. Evaluation of the Thermal Levels
In order to verify the goodness of the theoretical results obtained by the TRNSYS model presented in this paper, first of all a comparison between the results of the model in terms of the outlet temperature of the cooling fluid [29], that flows in the CPV/T system and the same temperature experimentally evaluated by the experimental system reported in Section 2, is presented in Figure 7. The theoretical-experimental comparison has been carried out under the same operation conditions corresponding to the specific experimental data and not considering standard load and weather profiles. For example, considering the experimental data measured in a sunny day for two hours from 10.00 to noon in the city of Salerno with an environmental temperature of about 30 °C and with an average value of DNI of about 900 W/m2, it can be noted in Figure 7 that the percentage relative error between the theoretical and experimental results varies, in the same operation conditions, between about 0.5% and 5%. Two hours from 10.00 h to noon have been generally considered, referring to the experimental tests. It is a sufficient time to verify the goodness of the model because the regime conditions are quickly reached for this typology of system. Moreover, the DNI values in a cloudy day and the cooling fluid outlet temperature have been also experimentally determined in this study, as shown in Figure 8.
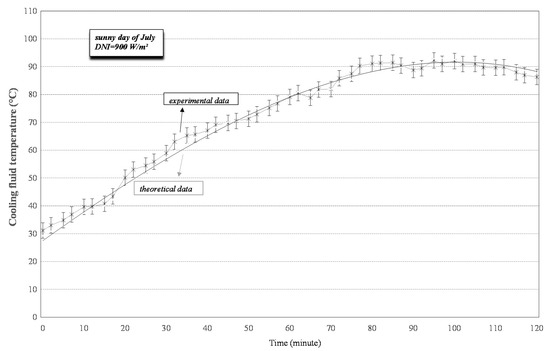
Figure 7.
Experimental and theoretical comparison in terms of the cooling fluid outlet temperature of the CPV/T system in a sunny day.
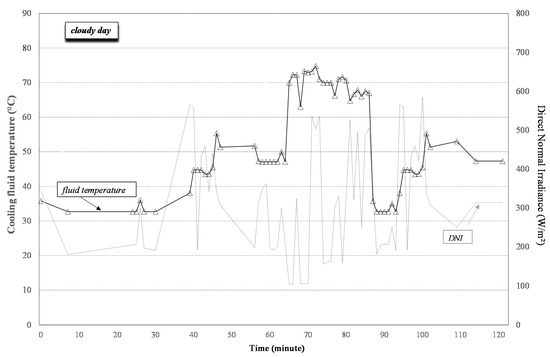
Figure 8.
Experimental values of the cooling fluid outlet temperature of the CPV/T system in a cloudy day.
The goodness of the theoretical–experimental comparison in terms of the cooling fluid [30] temperature at the CPV/T system outlet has represented a fundamental point to calculate theoretically, by means of the TRNSYS model, the other levels of temperature of the system, presented in this paper, for different temporal scenarios (hourly, weekly, monthly and yearly), such as temperature stratification in the thermal tank and user temperatures. Once daily DNI is known, TJ cell temperature and thermal loads, several TRNSYS simulations have been conducted according to different temporal scenarios (hourly, weekly, monthly and yearly).
In the Figure 9 and Figure 10, the hourly results of the model in terms of the temperature levels in the tank are shown for the winter (C2) and summer (C4) seasons. The temperature stratification in the tank of the CPV/T system as function of the height is shown. In Figure 9, referring to the winter season, the cloudy days determine a low thermal level with temperature values variable and included between 28 and 56 °C; hence, the energy demands are matched by the boiler. In Figure 10, a good stratification is noted for the summer season, with temperature values variable between 40 and 90 °C and a low integration of thermal energy is necessary. It can be noted that the temperature stratification from 0 to 14 hours is different compared to other hours because the use of the auxiliary boiler is prevalent in the first hours of the day in order to increase the temperature in the upper zone of the tank to the required value. During the hours in which the CPV/T is working, the contribution of the boiler decreases strongly, above all in the central part of the day.
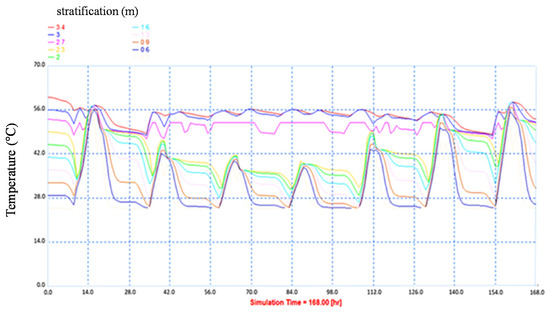
Figure 9.
TRNSYS simulation for the winter season of the temperature stratification in the tank.
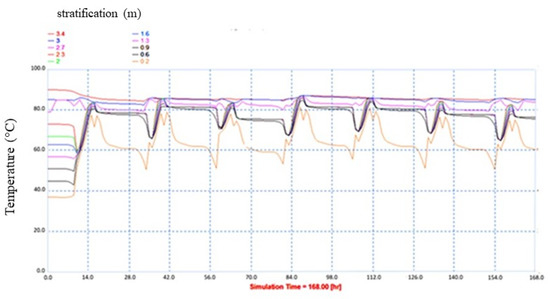
Figure 10.
TRNSYS simulation for the summer season of the temperature stratification in the tank.
Moreover, the TRNSYS model is also able to simulate, considering the four clusters above mentioned, the TJ cell and user temperatures weekly, to verify if a CPV/T system is able to satisfy the residential user’s thermal needs or if a thermal energy integration is necessary. A high difference can be noted in Figure 11, of about 30 K, between the user and TJ cell temperatures in the winter season; hence, the thermal energy cover percentage of the CPV/T system will be lower. On the contrary, the difference between the user and TJ cell temperatures is less evident in the other clusters and the energy coverage level increases. In summer, high values of DNI allow high tank temperatures close to the set-point fixed by the residential user. Hence, in Figure 11 (where V = variable, C = cloudy, S = sunny), it is possible to evaluate if the integration by means of the boiler is necessary; a low value of the TJ cell temperature determines a low tank temperature and a high difference between the user and TJ cell temperatures, and then an energy integration is necessary. Moreover, in Figure 12 the mass flow-rate of the cooling fluid is also reported under the same conditions.
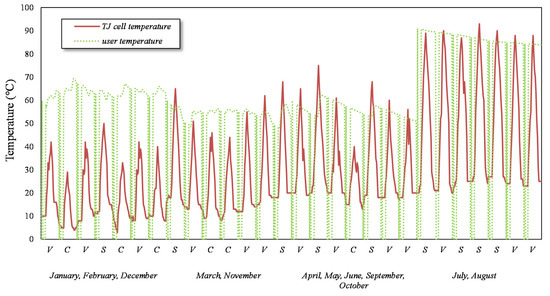
Figure 11.
Comparison between TJ cell and user temperatures.
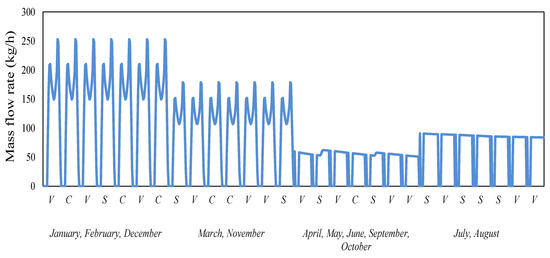
Figure 12.
Mass flow-rate of the cooling fluid.
In order to have a monthly comparison of TJ cell temperature, temperature required by the user and tank average temperature, together with the thermal energy integration that is necessary during the year, further analysis has been successively realized. First of all, it was easy to calculate the difference between the TJ cell temperature during hours of light and the TJ cell temperature during all the day, that are reported monthly in Figure 13. In the months from April to October, the difference between the two temperatures increases up to 20 K. The situation is different in the winter season, where the temperature difference decreases. In recent years, the reliability of the TJ cells in varying the operation temperature is improved, as discussed by the authors in [31].
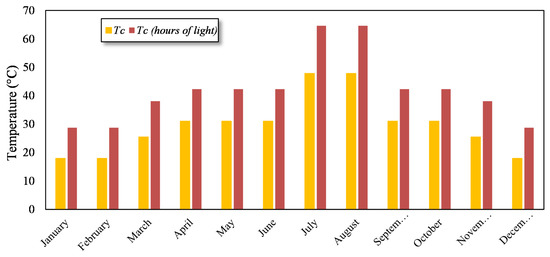
Figure 13.
Monthly values of TJ cell temperature during the hours of light and all the day.
In Figure 14, the TJ cell temperature during the hours of light, the average temperature of the tank and the temperatures of the user, are also evaluated monthly. The Figure 14 shows that the average temperature of the tank can be also higher than the average temperature requested by the residential user. The TJ cell temperature of the CPV/T system and the temperature of the fluid sent to the user are characterized, during the hours of the day, by high or null values, for example when there is no demand or production of thermal energy. On the contrary, the tank has to present the highest and stable temperature to satisfy even peaks in thermal energy demand. Generally, a stable temperature occurs in the months from April to October, when integration is not necessary because the tank’s average temperature is about 10 K higher than the temperature required by the fluid sent to the residential user. Hence, in Figure 14 it is clear that, when it is possible to have a thermal tank characterized by a stable and high temperature [32], the integration is not necessary if the CPV/T system provides thermal energy able to satisfy the demand in the hours without sun. The situation is different in periods where there is integration. In fact, despite the fact that tank temperature can always satisfy the user by means of the auxiliary boiler, the tank average temperature is 10 K lower than the temperatures of the user, because there is not a continuous energy contribution from the CPV/T system. The thermal energy demand is satisfied only by the auxiliary boiler, which increases the temperature when necessary.
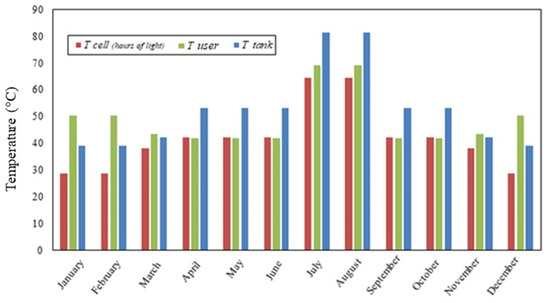
Figure 14.
Monthly values of TJ cell temperature (hours of light), temperature of user and tank average temperature.
The CPV system has been sized to satisfy all the electric requirements of a residential user reported in Table 2; about 700 TJ cells, with an average electrical power of 5 W each, are necessary. Subsequently, the thermal energy coverage was evaluated for each month of the year, as shown in Table 4.
Table 4.
Cover level of the thermal energy.
It is possible to observe that the coverage level is limited in the winter months (January, February, March and December) where the demand of thermal energy for heating is only partially satisfied by the CPV/T system, and an integration by means of an auxiliary boiler is necessary [33]. In all other months of the year, the coverage level of thermal energy is 100% and then the system CPV/T is able to satisfy not only all the electrical demand of a residential user, but also the thermal demand of DHW and the cooling energy requests are satisfied, as mentioned above, by a thermally powered AHP. Finally, the CPV/T system can cover during the year, in addition to the electrical demand, a large part of the thermal energy load of a residential user. Hence, the CPV/T systems can allow advantages in comparison with other technical solutions from the energy and economical point of view, as shown in [12].
5. Conclusions
In this paper, the performances of a line-focus CPV/T system applied to a residential user have been studied. An integrated model has been realized in TRNSYS, where DNI, TJ cell temperature and the thermal needs of a residential user are the input data. Different temporal scenarios have been considered (hourly, weekly, monthly, yearly) to study the thermal performances of the CPV/T system during the year. The model results have been obtained in terms of the cooling fluid temperatures of the CPV/T system, temperature stratification in the tank in winter and in summer, and the temperatures of user.
In order to verify the goodness of the theoretical results obtained by the model, first of all a comparison between the results of the model in terms of the outlet temperature of the working fluid that flows in the CPV/T system and the same temperature, experimentally obtained in in the same working condition, has been realized. For example, on a sunny day, related to an average value of DNI of about 900 W/m2, a deviation from the theoretical and experimental results in terms of the percentage relative error varies, in the same operation conditions, by between about 0.5% and 5%.
The goodness of the theoretical–experimental comparison has represented a fundamental point to calculate theoretically, by means of the TRNSYS software, the temperature stratification in the thermal tank and the temperatures of the user. The temperature stratification in the tank of the CPV/T system, as a function of the height of the tank, has been obtained. Related to the winter season, the cloudy days determine a low thermal level with fluid temperature values variable between 28 and 56 °C according to the height; hence, the energy demands are matched by the boiler. A good stratification has instead been noted for the summer season, with temperature values variable between about 40 and 90 °C, and a very low integration is necessary.
In the winter season, the average TJ cell temperature is about 40 °C, while in summer its value is about 80 °C. The difference between the average values of the TJ cell temperature during hours of light and not during hours of light, can increase by up to 20 K.
Moreover, the TJ cell temperature during the hours of light, the average temperature of the tank and the temperatures of the user, have been also compared. From April to October, the tank average temperature is about 10 K higher than the temperature required by the fluid sent to the residential user and, generally, integration is not necessary. The situation is different in winter, where thermal integration by means of an auxiliary boiler is often necessary, because there is not a continuous energy contribution by the CPV/T system.
Finally, the TJ cell, cooling fluid, user and tank temperatures have been compared hourly, weekly, monthly and yearly to verify if a CPV/T system is able to satisfy the thermal loads of a residential user, or, if necessary, a thermal energy integration in some periods of the year when the TJ cell temperature is lower than the set-points fixed to satisfy the thermal loads. It has been verified that the CPV/T system covers a large part of the thermal demands of the residential user during the year; the thermal energy coverage is limited only in the winter months.
Funding
This research received no external funding.
Conflicts of Interest
The author declares no conflicts of interest.
Abbreviation
| A | area (m2) |
| AHP | Absorption Heat Pump |
| C | concentration factor |
| c | specific heat (kJ/kg K) |
| CPV | Concentrator Photovoltaic |
| CPV/T | Concentrator Photovoltaic and thermal |
| DHW | Domestic Hot Water |
| DNI | Direct Normal Irradiance (W/m2) |
| E | energy (Wh) |
| I | solar radiation (W/m2) |
| InGaP/InGaAs/Ge | indium-gallium-phosphide/indium-gallium-arsenide/germanium |
| convective heat transfer coefficient (W/m2 K) | |
| mass flow-rate (kg/s) | |
| n | number |
| PV | photovoltaic |
| T | temperature (°C) |
| TJ | Triple-Junction |
Greek symbol
| εc | emissivity |
| η | efficiency |
| Stefan–Boltzmann costant (W/m2 K4) | |
| σt | temperature coefficient (%/K) |
Subscripts
| c | cell |
| conc | concentrator |
| e | electric |
| f | fluid |
| geo | geometrical |
| in | inlet |
| loss | losses |
| mod | module |
| opt | optical |
| out | outlet |
| ref | reference |
| th | thermal |
References
- Sharaf, O.Z.; Orhan, M.F. Concentrated photovoltaic thermal (CPVT) solar collector systems: Part II-Implemented systems, performance assessment and future directions. Renew. Sustain. Energy Rev. 2015, 50, 1566–1633. [Google Scholar] [CrossRef]
- Ben Youssefa, W.; Maatallaha, T.; Menezo, C.; Ben Nasrallaha, S. Assessment viability of a concentrating photovoltaic/thermal-energy cogeneration system (CPV/T) with storage for a textile industry application. Sol. Energy 2018, 159, 841–851. [Google Scholar] [CrossRef]
- Renno, C. Experimental and Theoretical Analysis of a Linear Focus CPV/T System for Cogeneration Purposes. Energies 2018, 11, 2960. [Google Scholar] [CrossRef]
- Renno, C.; Petito, F.; Landi, G.; Neitzert, H.C. Experimental characterization of a concentrating photovoltaic system varying the light concentration. Energy Convers. Manag. 2017, 138, 119–130. [Google Scholar] [CrossRef]
- Meng, X.; Sellami, N.; Knox, A.R.; Montecucco, A.; Siviter, J.; Mullen, P.; Ashraf, A.; Samarelli, A.; Lin, L.F.; Paul, D.J.; et al. A novel absorptive/reflective solar concentrator for heat and electricity generation: An optical and thermal analysis. Energy Convers. Manag. 2016, 114, 142–153. [Google Scholar] [CrossRef]
- Chaoqing, F.; Hongfei, Z.; Rui, W.; Xinglong, M. Performance investigation of a concentrating photovoltaic/thermal system with transmissive Fresnel solar concentrator. Energy Convers. Manag. 2016, 111, 401–408. [Google Scholar] [CrossRef]
- Fernández, E.F.; Almonacid, F.; Rodrigo, P.; Pérez-Higueras, P. Calculation of the cell temperature of a high concentrator photovoltaic (HCPV) module: A study and comparison of different methods. Sol. Energy Mater. Sol. Cells 2014, 121, 144–151. [Google Scholar] [CrossRef]
- Renno, C.; Petito, F. Triple-junction cell temperature evaluation in a CPV system by means of a Random-Forest model. Energy Convers. Manag. 2018, 169, 124–136. [Google Scholar] [CrossRef]
- Rodíguez, D.M.; Horley, P.P.; Gonzalez-Hernandez, J.; Vorobiev, Y.V.; Gorley, P.N. Photovoltaic solar cells performance at elevated temperatures. Sol. Energy 2005, 78, 243–250. [Google Scholar] [CrossRef]
- Nishioka, K.; Takamoto, T.; Agui, T.; Kaneiwa, M.; Uraoka, Y.; Fuyuki, T. Annual output estimation of concentrator photovoltaic systems using high-efficiency InGaP/InGaAs/Ge triple-junction solar cells based on experimental solar cell’s characteristics and field-test meteorological data. Sol. Energy Mater. Sol. Cells 2006, 90, 57–67. [Google Scholar] [CrossRef]
- Kerzman, T.; Schaefer, L. System simulation of a linear concentrating photovoltaic system with an active cooling system. Renew. Energy 2012, 41, 254–261. [Google Scholar] [CrossRef]
- Renno, C. Optimization of a concentrating photovoltaic thermal (CPV/T) system used for a domestic application. Appl. Therm. Eng. 2014, 67, 396–408. [Google Scholar] [CrossRef]
- Renno, C.; De Giacomo, M. Dynamic Simulation of a CPV/T System Using the Finite Element Method. Energies 2014, 7, 7395–7414. [Google Scholar] [CrossRef]
- Renno, C.; Petito, F. Modelling of a linear focus concentrating photovoltaic and thermal system for different load scenarios of a residential user. Energy Convers. Manag. 2019, 188, 214–229. [Google Scholar] [CrossRef]
- Klein, S.A.; Beckman, W.A.; Mitchell, J.W.; Duffie, J.A.; Duffie, N.A.; Freeman, T.L.; MItchell, J.C.; Braun, J.E.; Evans, B.L.; Kummer, J.P.; et al. TRNSYS. 16-A Transient System Simulation Program; University of Wisconsin: Madison, WI, USA, 2006; Available online: https://sel.me.wisc.edu/trnsys/ (accessed on 23 September 2019).
- Jakha, S.; Soni, M.S.; Gakkhar, N. Modelling and simulation of concentrating photovoltaic system with earth water heat exchanger cooling. Energy Procedia 2017, 109, 78–85. [Google Scholar] [CrossRef]
- Renno, C.; Petito, F. Experimental and theoretical model of a concentrating photovoltaic and thermal system. Energy Convers. Manag. 2016, 126, 516–525. [Google Scholar] [CrossRef]
- Renno, C.; Petito, F.; Gatto, A. ANN model for predicting the direct normal irradiance and the global radiation for a solar application to a residential building. J. Clean. Prod. 2016, 35, 1298–1316. [Google Scholar] [CrossRef]
- Klein, S.A.; Beckman, W.A.; Mitchell, J.W.; Duffie, J.A.; Duffie, N.A.; Freeman, T.L.; Mitchell, J.C.; Braun, J.E.; Evans, B.L.; Kummer, J.P.; et al. TRNSYS 17 A Transient System Simulation Program. Solar Energy Laboratory, University of Wisconsin-Madison. 2012. Available online: http://web.mit.edu/parmstr/Public/TRNSYS/04-MathematicalReference.pdf (accessed on 23 September 2019).
- Karathanassis, K.; Papanicolaou, E.; Belessiotis, V.; Bergeles, G.C. Dynamic simulation and exergetic optimization of a Concentrating Photovoltaic/ Thermal (CPVT) system. Renew. Energy 2019, 135, 1035–1047. [Google Scholar] [CrossRef]
- Chemisana, D.; Rosell, J.I. Design and optical performance of a nonimaging Fresnel transmissive concentrator for building integration applications. Energy Convers. Manag. 2011, 52, 3241–3248. [Google Scholar] [CrossRef]
- Triple-Junction Solar Cell for Terrestrial Applications. CTJ photovoltaic cell, Datasheets Emcore September 2012. EmcoreCorporation. Available online: https://assets.componentsense.com/images/pdfs/89821_2_7da3431c2dc0e81925db4c73523bf624.pdf (accessed on 24 September 2019).
- Mittelman, G.; Kribus, A.; Dayan, A. Solar cooling with concentrating pho-tovoltaic/ thermal (CPVT) systems. Energy Convers. Manag. 2007, 48, 2481–2490. [Google Scholar] [CrossRef]
- Aprea, C.; Renno, C. Experimental model of a variable capacity compressor. Int. J. Energy Res. 2009, 33, 29–37. [Google Scholar] [CrossRef]
- Energy Autorithy, Italy. Available online: http://www.autorita.energia.it/it/dati/eep35.htm (accessed on 24 September 2019).
- Matlab R2007b; The MathWorks: Natick, MA, USA. Available online: https://www.mathworks.com/ (accessed on 4 November 2019).
- Aprea, C.; Renno, C. An air cooled tube-fin evaporator model for an expansion valve control law. Math. Comput. Model. 1999, 30, 135–146. [Google Scholar] [CrossRef]
- Meteoblu, Italy. Available online: https://www.meteoblue.com/it/tempo/previsioni/modelclimate/salerno_italia_3168673 (accessed on 24 September 2019).
- Aprea, C.; Renno, C. A numerical approach to a very fast thermal transient in an air cooling evaporator. Appl. Therm. Eng. 2002, 22, 219–228. [Google Scholar] [CrossRef]
- Aprea, C.; Renno, C. An experimental analysis of a thermodynamic model of a vapour compression refrigeration plant on varying the compressor speed. Int. J. Energy Res. 2004, 28, 537–549. [Google Scholar] [CrossRef]
- Renno, C.; Landi, G.; Petito, F.; Neitzert, H.C. Influence of a degraded triple-junction solar cell on the CPV system performances. Energy Convers. Manag. 2018, 160, 326–340. [Google Scholar] [CrossRef]
- Cholewa, T. Improving Energy Efficiency of Hot Water Storage Tank by Use of Obstacles. Annu. Set Environ. Prot. 2013, 15, 392–404. Available online: https://www.researchgate.net/publication/261508161_Improving_Energy_Efficiency_of_Hot_Water_Storage_Tank_by_Use_of_Obstacles (accessed on 4 November 2019).
- Gong, X.; Li, F.; Sun, B.; Liu, D. Collaborative Optimization of Multi-Energy Complementary Combined Cooling, Heating, and Power Systems Considering Schedulable Loads. Energies 2020, 13, 918. [Google Scholar] [CrossRef]
© 2020 by the author. Licensee MDPI, Basel, Switzerland. This article is an open access article distributed under the terms and conditions of the Creative Commons Attribution (CC BY) license (http://creativecommons.org/licenses/by/4.0/).