Article

What Motivates Behavior Change? Analyzing User Intentions to Adopt Clean Technologies in Low-Resource Settings Using the Theory of Planned Behavior

by
Mohammad H. Pakravan
and
Nordica MacCarty
*
School of Mechanical, Industrial, and Manufacturing Engineering, Oregon State University, Corvallis, OR 97331, USA
*
Author to whom correspondence should be addressed.
Energies 2020, 13(11), 3021; https://doi.org/10.3390/en13113021
Submission received: 3 May 2020 / Revised: 8 June 2020 / Accepted: 9 June 2020 / Published: 11 June 2020

Abstract

:
Understanding and integrating the user’s decision-making process into product design and distribution strategies is likely to lead to higher adoption rates and ultimately increased impacts, particularly for those products that require a change in habit or behavior such as clean energy technologies. This study applies the Theory of Planned Behavior (TPB) in design for global development, where understanding the tendency to adopt beneficial technologies based on parsimonious approaches is critical to programmatic impact. To investigate robustness and applicability of behavioral models in a data scarce setting, this study applies TPB to the adoption of biomass cookstoves in a sample size of two remote communities in Honduras and Uganda before and after a trial period. Using multiple ordinal logistic regressions, the intention to adopt the technology was modeled. Results quantify the influence of these factors on households’ intentions to cook their main meals with improved cookstoves. For example, the intention of participants with slightly stronger beliefs regarding the importance of reducing smoke emissions was 3.3 times higher than average to cook more main meals with clean cookstoves. The quantitative method of this study enables technology designers to design and develop clean technologies that better suit user behavior, needs, and priorities. In addition, the data driven approach of this study provides insights for policy makers to design policies such as subsidies, information campaigns, and supply chains that reflect behavioral attributes for culturally tailored clean technology adoption initiatives. Furthermore, this work discusses potential sources of bias and statistical challenges in data-scarce regions, and outlines methods to address them.

1. Introduction

Examining and quantifying drivers of users’ intentions for adopting clean technologies can provide insight and inform models for design, marketing strategies, and policies to maximize product effectiveness and uptake. For energy-efficiency and other products aimed at generating positive environmental and health impacts, increased and sustained adoption of the product in lieu of traditional alternatives is the key objective [1]. Understanding user intentions for adoption is especially important in design for development, where cultural barriers and unfamiliarity with usage contexts in diverse communities renders design of appropriate technologies a challenging task. Many technologies have been developed and disseminated to address basic human needs and reduce extreme poverty, however, despite such efforts, there is significant room to improve rates of sustained use. Designing policies to promote population scale adoption of clean technologies could benefit from systematic integration of dominant user perspectives, priorities and behavioral attributes for increased efficacy of clean technology adoption for improved public health and environment. For this purpose, comprehensive approaches are required to include energy services that bind user needs, culture, and social norms along with supply side challenges such as efficiency [2] and policies that create an enabling environment.
Improved cookstoves (ICS) are a key example of a technology that must be adopted and effectively displace traditional counterparts at scale in order to reach environmental, health, and social goals because a technology that does not generate adoption and sustained use does not generate impacts [3,4]. Even today, traditional cooking practices relying on solid fuels and open fires have significant negative consequences on the health and livelihoods for people in low- and middle-income countries (LMICs), where solid fuels are the main source of energy for 2.7 billion people [5,6]. Due to poor combustion quality associated with inefficient traditional cooking practices and their frequent indoor use, household air pollution from cooking is attributed to 3.5–4 million premature deaths every year [7,8]. In addition, products of incomplete combustion such as black carbon contribute to climate change, with recent estimates indicating that traditional biomass cooking contributes 34–45% of the warming due to black carbon and up to 8% of global warming overall [9,10,11]. Furthermore, increasing population in LMICs has pushed the firewood harvest rates to unsustainable rates that is estimated to threaten livelihood of 275 million people who live in firewood depletion hotspots [10].
To contribute to addressing these challenges, many types of ICS have been designed to improve heat transfer and combustion efficiency and therefore lower the carbon footprint, negative health impacts, and firewood consumption rates. However, despite the potentially significant benefits and more than three decades of ICS distribution, low adoption rates are observed in many projects [12,13,14], and low adoption and displacement rates lead to diminished impacts [1]. A recurring theme of studies that evaluate ICS adoption is the notion that systematic integration of users in design and implementation process is needed to improve real-world performance and adoption [7,15,16]. To support the ability to modify the technology design to better align with user attitudes, behaviors, and social norms toward decision-making and adoption, an effective method is needed.
Design and implementation of ICS demands comprehensive integration of engineering design attributes along with user-centered design attributes. Lack of comprehensive inclusion of all contributing engineering attributes are likely to reduce the positive impacts of using the ICS for public health and indoor air pollution reduction. For instance, a randomized control-trial study on 10,750 children in rural Malawi could not find a meaningful relationship between using an ICS and reduced risk of pneumonia or skin burns [17]. A review of 42 studies that reported household air pollution from solid fuel stoves suggested that while majority of the stoves were able to reduce the carbon monoxide emissions below WHO’s guidelines, there were no stove among reviewed studies that could improve PM2.5 concentrations to below WHO guidelines [18]. This finding suggests that engineering design of ICS should be carefully carried out to contribute to improved household air quality and public health through effective reduction of all hazardous pollutants. For example, a study in Honduras found that using an ICS in a trial group was associated with 73% reduction in level of indoor PM2.5 and 87% less CO concentration, which translated to less reported health symptoms among women in trial group [19]. While engineering attributes are important for effectiveness of adopting an ICS to lead to improved public health impact, this study is focused on the issue of adoption of ICS from a user perspective. The objective of this work is to introduce a methodology for technology designers, policy makers, and implementers to systematically analyze user behavior and preferences that, along with optimized engineered ICS design, could lead to population scale continuous use of ICS instead of inefficient traditional methods for improved public health.
Users of products face a number of competing preferences and objectives when making choices to meet their needs. Therefore, it is important to formulate product design and implementation strategies based on a holistic understanding of user priorities. In the case of clean energy technologies such as solar panels, electric vehicles, or clean biomass cookstoves, understanding such priorities and preferences should play a critical role in design because the technology must be aligned with the user’s needs and motivations to create an intention to change current behaviors. According to the diffusion of innovations theory, diffusion occurs through a process of communication of a specific innovation through social channels over time between members of a community [1]. Based on perceptions of relative advantage, compatibility, complexity, trialability, and observability, the user decides whether or not to adopt a technology [20]. Therefore, technology adoption is highly dependent on user’s perceptions.
Several studies have identified the importance of the community and user perspective (demand side) on cookstove adoption. Along with the importance of demand-side attributes that influence adoption of clean energy technologies, accessibility of the products is a necessary condition for higher adoption rates. However, if accessibility is not a barrier, adoptability and usability may be [21]. For example, one study that ranked attributes that determined adoption of small scale household renewable energy technologies found that parameters such as ease of use could increase technology uptake [22]. Another study discussed how incorporating attributes of cooking as a social practice could inform policies for more effective technology adoption strategies [23]. The role of users has long been known as a key determinant for success or failure of ICS dissemination projects based on a survey of 137 of such programs, which found that incorporating the needs of the main users (female cooks in the majority of the cases) in early stages of ICS design is crucial for making a significant impact through increased adoption [24]. Despite the findings of studies that suggest understanding the users’ motivations and decision-making process is essential to successful ICS dissemination, systematic integration of user attributes in design and implementation process still poses a challenge.

1.1. Considerations for Residential Energy Technology Adoption

It is important to consider that in addition to the technology’s design, implementation strategies should also be systematically user oriented to translate users’ needs into demand [25]. The likelihood of adopting a new cooking device increases when households perceive the importance of changing their traditional cooking behavior. Since cooking is a repetitive daily process and associated with a basic human need, traditional cooking practices are deeply rooted in a culture. Therefore, rapid technology deployment in a community and short-term informational campaign without any background or follow-up assessment are not likely to result in sudden and pervasive change. One study monitored post-intervention stove adoption in a rural setting in India for four years and concluded that if households do not value the ICS, health and firewood use are not likely to be improved because stove use is too infrequent to displace traditional methods [26]. That study concluded that the goal of ICS implementation will not be achieved if users do not use the stove frequently and properly, skip regular maintenance, or do not update their beliefs about how to use it. Therefore, users’ attitude, beliefs, and knowledge about changing their cooking device should be addressed through medium- to long-term information campaigns. Another study in rural Bangladesh found that despite that 94% of respondents recognizing the smoke emitted by traditional stoves as unhealthy, there was low value placed on ICS due to the limited resources available to households to meet many other basic priorities such as electricity access, sanitary latrines, doctor consultations, and school attendance [16]. In these and similar situations, appropriate behavior change communications are likely to improve adoption rates.
Behavior change communication strategies such as information campaigns not only improve households’ awareness regarding the problems associated with traditional cooking practices, but also increase social influences in favor of ICS adoption. This is due to the social nature of choices and the contribution of society to individual’s decisions through social norms and widespread beliefs [27,28]. Such social influence can be measured as the strength of intra-communal links and bonding social capital for promoting the spread of information and ICS adoption, and can be evaluated systematically in a community [29]. Similarly, a review of three case studies of technology adoption in rural settings concluded that social network attributes including the social structure of the community, network of women, and influential community members are likely to play an influential role in ICS adoption [30]. Therefore, households are more likely to accept a technology if their peers have positive attitudes about the technology. Similarly, if their social ties are not satisfied with the technology, the likelihood for households to adopt it decreases.
The Global Alliance for Clean Cookstoves, now the Clean Cooking Alliance, has defined five important measurement areas of clean cookstove adoption along the value chain defined as distribution and uptake, promotion, policy and coverage, adoption, and sustained adoption [31]. In addition, the goal of ICS diffusion projects requires fulfillment of three conditions [32]. First, the individual should have the opportunity to adopt ICS which includes accessibility and supply side challenges. Second, the individual should be able to work with the technology. And third, the individual should be motivated to change their behavior. Thus, methods to promote these three conditions are needed. The first condition is fulfilled by financing and distribution mechanisms, while the second requires an approach that begins with design. Development of user manuals, accessible trainings, design for usability, and post intervention customer services should be implemented to improve impacts of the ICS diffusion projects [18]. For example, a case study that monitored user behavior in early stages of ICS adoption in urban settings in India for six weeks found that despite that users had interest in cooking with ICS, their early experiences led them to stop using the technology [33]. The users did not regularly remove the ashes from the stove, and only used one of the two available burners of ICS, causing the efficiency of the stove to be significantly reduced. In addition, they perceived the smoke reduction feature of the ICS as a drawback, because smoke keeps mosquitos away during cooking. These observations suggest that user’s attitude toward cooking and habits had not been reflected in the technology design, nor had their need for training in proper use. As a result, the ICS performance was not efficient and its usability was not desirable for users, leading to discontinued use. Therefore, it is important to address these attributes during design and distribution of clean technologies to increase adoption rates. To do so, an understanding of user needs and behaviors is needed early on in the design process.

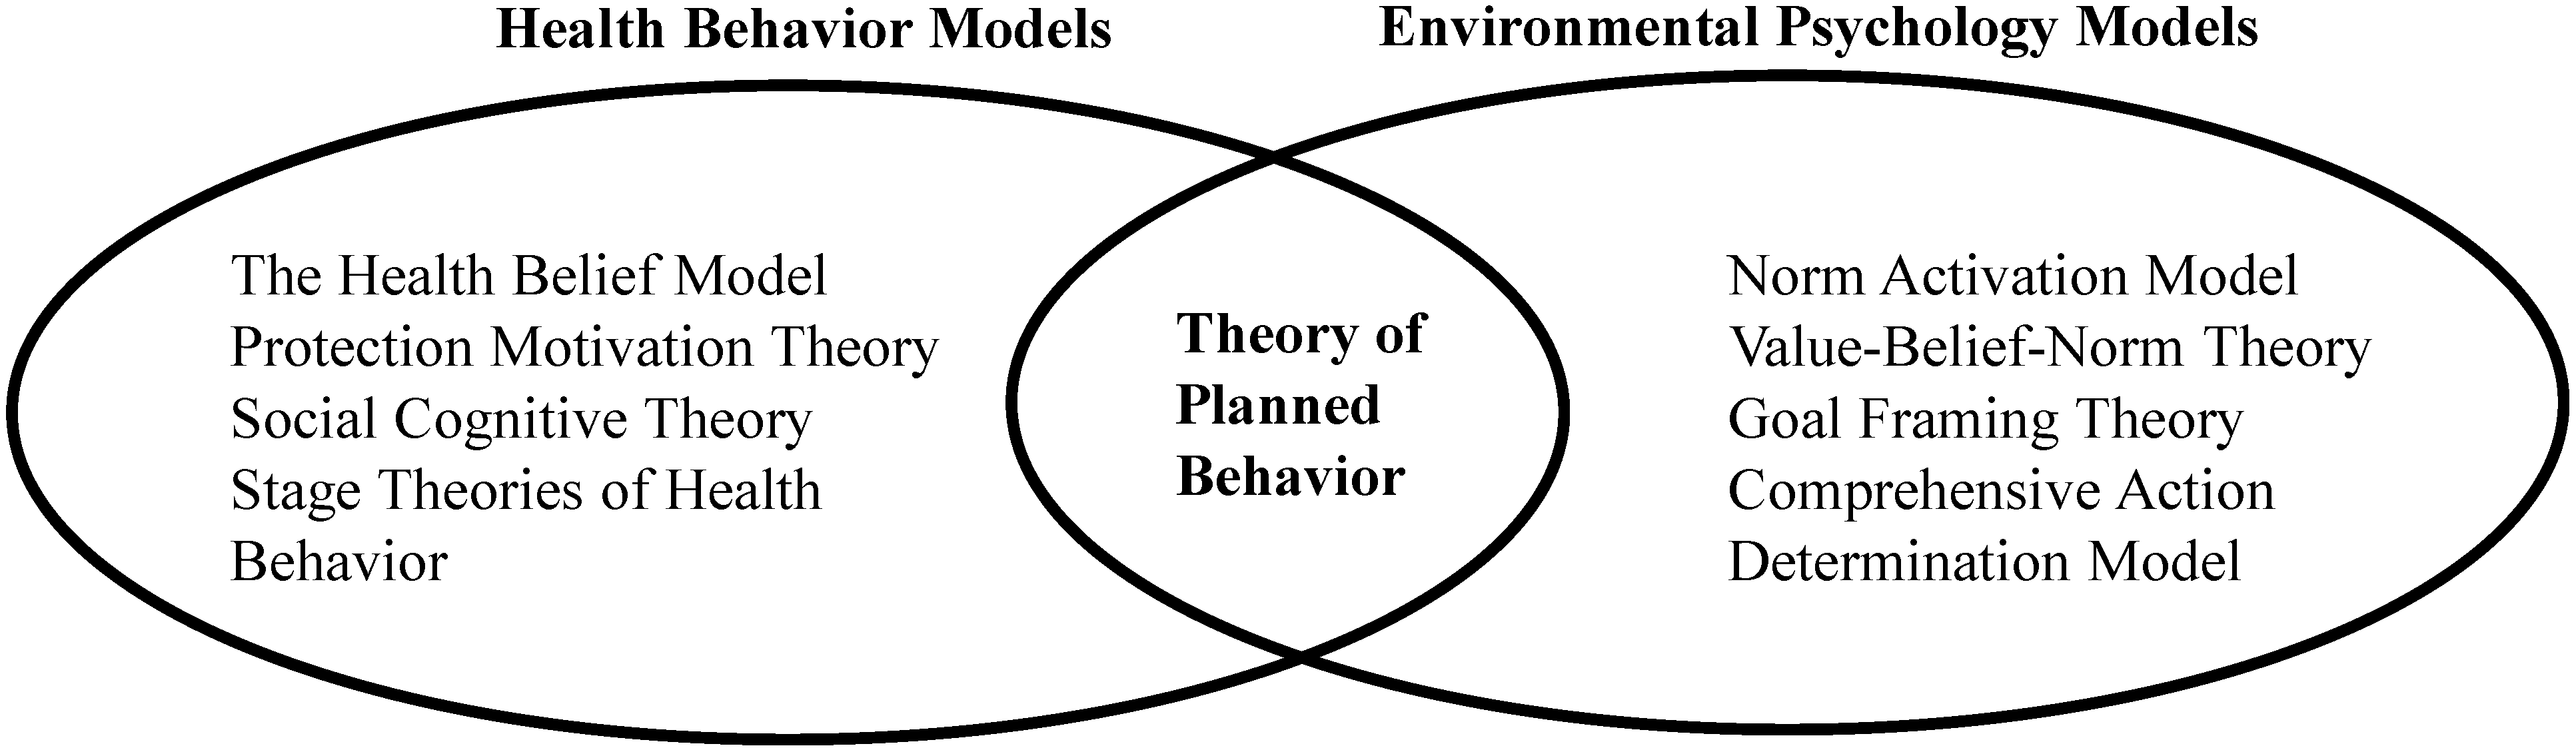
1.2. Models of Behavior

There are several validated approaches that investigate technology adoption, including the diffusion of innovations theory [1], technology acceptance model [34], social cognitive theory [35], Unified Theory of Acceptance and Use of Technology [36], and Theory of Planned Behavior (TPB) [37]. Reviewing these models suggest that certain attributes have been incorporated in more than one approach, suggesting that these attributes do play an important role in explaining technology adoption behavior. Such attributes include user attitudes, perceptions, evaluations, social influences, and hindrances [38].
Clean technologies perform tasks that are currently completed with conventional counterparts but do so in a way that is less harmful for environment and/or has improved health impacts. Therefore, it is important to apply a model that has been proven to predict pro-environmental and health behaviors. There have been a number of models that have been evaluated for performance and robustness in these areas throughout the literature, as shown in Figure 1. In the left circle, prominent methodologies for predicting health related behaviors are listed [39], while the right circle captures the dominant models that investigate interactions of individuals with the environment [40,41]. The overlapping area shows that a single model that covers the domains of both health and environment is the Theory of Planned Behavior (TPB). There are multiple reviews and meta-analyses of studies that have applied and validated TPB for the psychological decision-making process in the domains of both health and environment [42,43,44], health and environmental behaviors such as food consumption decisions [44], contribution of specific job factors and work-family conflicts on healthy work intention [45], recycling [46], and consumption of green products by youth [47]. These have been successful in terms of linking behavior to TPB constructs with statistical significance to suggest the causal relationship between behavior, intention, and three TPB constructs of intention. Others have developed theoretical models of clean cookstove adoption with no experimental evidence to support performance and reliability in terms of predicting behavior [48,49].
In addition, TPB is among the more parsimonious models of behavior analysis, which is particularly important in the domain of social studies in low resource settings where data is scarce. Since data collection in such settings demands significant logistical requirements and expenses, lean approaches with the strongest prediction power based on minimum data points and model attributes are best suited for such studies. Because of TPB’s robustness in domains of behavior that are attributable to clean technology adoption, as well as its’ efficiency, TPB was selected as the most appropriate model for the purpose of this study.
One key reason for the prominent application of TPB is because of the structural simplicity and universal applicability of the theory across behavioral domains [41]. Developed by Ajzen [37,50], TPB defines intention as the best predictor of behavior. Behavior intention represents readiness of an individual to conduct or avoid a particular behavior. The TPB assumption that intention is the main descriptor of behavior is validated by multiple studies that investigate causal relationship of beliefs with behavior in the literature [51,52,53]. In a meta-analysis of experimental studies, a medium-to-large intention change is found to lead to a small-to-medium behavior change [54]. According to this theory, intention is composed of three categories of attributes that form the behavior intention (Table 1).
According to this theory, intention is composed of three categories of attributes that form the behavior intention (Table 1). Although the structural simplicity and universal applicability of TPB contribute to its popularity [41], there are two major limitations to its use. First, the difference between values and expectancies is one of the main criticisms to TPB that is investigated by [55]. Value beliefs are an individual’s evaluation of desirability of a particular behavior, while expectancy beliefs refer to the likelihood of certain outcomes as the consequence of such behavior. Some applications of TPB add these two separate beliefs together without recognizing the differences in meaning of response range for each one. However, for two reasons this study is not likely to be affected by this issue. First, individuals’ beliefs and evaluations to be more reflective of community scale opinions rather than individual level judgements in low resource communities. This is referred to modally salient beliefs by [55]. Second, his study uses direct questions reflective of attitude toward cooking behavior instead of using the interactive measurement of attitude toward behavior through asking questions representing each category of value beliefs and evaluations separately. Therefore, this shortcoming is not likely to affect the influence of attitude toward behavior on intention, which is studied here. A second major criticism to TPB is based on a literature review that suggests TPB’s categorization and flow of behavior is not justifiable due to priority of beliefs over intention on influencing the behavior, as well as role of some attributes that are not described in the method but have strong correlation with behavior such as habits [56]. However, to address this, Ajzen explains that statistical reliance on a few questions to capture each attribute, as well as lack of accurate model development and implementation are the major reasons for insignificant practices cited in the previous study [57]. To avoid such problems, this study uses the standard guideline proposed by Ajzen to design the study [58].
Despite these criticisms, a meta-analysis of experimental evidence suggests that a medium-to-large intention change is still likely to lead to a small-to-medium behavior change [54], and the recommendations can address criticisms to ensure the model development and specifications are correct [55,58,59].

1.3. Objective and Novelty of the Paper

Recognizing that technology adoption in LMICs is a complex process involving a variety of critical factors including awareness, accessibility, usability, satisfaction, and motivation [60], this study focuses on the motivation piece by applying TPB to estimate user intentions to adopt ICS. It uses TPB as a quantitative methodology for comprehensive evaluation of multiple facets of user intentions to adopt clean energy technologies that seek to reduce the health burden, fuelwood consumption, and detrimental environmental impacts of traditional cooking practices. Through application of TPB in measuring behavioral attributes that influence intention to adopt clean cookstoves, insights may be gained for technology designers, international development programs, and policy makers to develop products and implementation strategies that are more tuned to user motivations and, therefore, more likely to effectively replace their traditional counterparts. Since TPB can be applied in a wide range of sectors, lessons learned here can then be applied to a variety of development projects.

2. Methodology

This study hypothesizes that when an ICS is affordable and accessible, a household’s intention to use available alternatives is the main determinant of her choice whether to adopt or not. Then, the causal relationship between the three TPB constructs presented in Table 1 and the intention to cook with ICS can be evaluated. As a result, intention is explained based on attitude toward behavior (ATB), social norms (SN), and perceived behavior control (PBC) which are quantified based on data collected through surveys in target communities.

2.1. Survey Design

Its conventional wisdom that the quality of the results directly depends on the quality of the survey and data collection procedure. Therefore, standard procedures to develop a reliable TPB survey from the literature were followed [57,61,62].
  • Consistency—Primarily, the questions related to each category of TPB attributes were designed for internal consistency, a measure of reliability that informs how observed variables describe the attributes of interest [63].
  • Efficiency—To ensure that survey questions reflected the dominant widespread beliefs and motivations in the target community, a pilot survey was used to narrow down questions. It included open-ended questions about cooking, food, firewood collection, and power dynamics from a small group of community members and local staff of partner NGOs. The answers to these open-ended questionnaires shed light into the main attributes that play role in cooking behavior in the target communities. Then survey instrument questions were designed based on these attributes to capture a wide array of responses regarding topics such as kitchen cleanness, safety, smoke emission, and firewood consumption.
  • Reliability and simplicity—Using a translation-back-translation procedure by the field staff who were native speakers of the local language, the validity of questions and their simplicity was evaluated.
  • Limited bias—In the second round of data collection, local staff were trained to conduct an unbiased data collection in the way to reduce the effect of surveyor bias and their feedback were integrated in the questionnaire to reduce the socially desirable biases.
Figure 2 presents an example of how different questions capture beliefs and evaluations under the umbrella of TPB constructs in this study. Three survey questions with different wordings were used to record the intention to cook principal meals with ICS, because the experiences of the authors suggest that asking about respondents’ willingness to cook their principal meals with ICS is a reasonable proxy to capture intention to adopt an ICS as opposed to casual or infrequent usage. The survey also includes three to five questions for each TPB construct to capture a multitude of beliefs related to that category.
Overall, the survey contained twenty-eight TPB questions in Honduras and eighteen questions in the Ugandan version. Questions are in a Likert scale with responses quantitatively coded as ‘1′ for ‘strongly disagree’ or equivalent to ‘5′ as ‘strongly agree’ or equivalent and a separate ‘I don’t know’ option. In addition to the TPB questions, the surveys included sections related to demographics, general impact assessment questions, and social networks. These served for the interests of NGO partners and also provided more background information to assess the reliability of TPB responses. The complete survey instrument is provided in the Appendix A.
Using the survey results, independent variables in an ordinal logistic regression represent ATB, SN, and PBC, while intention to cook with ICS serves as dependent variable (Equation (1)). These variables are based on the coded responses from the survey questions. Following statistical guidelines, multiple regression analyses were used to find the most relevant attributes with the highest model significance [59]. Structural Equation Modeling could not be used due to small sample size for such method and presence of separation in some datasets. Since ordinal logistic regression applies a mathematical transformation of Equation (1), coefficients are reported either as log odds or odds ratios. If the model does not violate the parallel regressions assumption, estimated coefficients can be interpreted quantitatively as odds ratios, indicating that one unit increase on the Likert scale in the explanatory variable is associated with the respective coefficient’s change in the levels of dependent variable, with all other variables held constant. For example, one unit increase in the individual’s attitude toward smoke reduction improves odds of higher levels of their intention to cook more meals with ICS β1 times:
I n t e n t i o n = β 0 + β 1 ( ATB ) + β 2 ( SN ) + β 3 ( PBC ) + ε

2.2. Data Collection

With human subjects oversight by the Oregon State University Institutional Review Board under study number 7257, a total of 549 households participated in data collection. This included 379 households in the Copan Ruinas region of Honduras, and 170 households in the Apac district of Uganda (Table 2). First, a subset of 7–10 households in each community was surveyed in the pilot study to identify the TPB attributes that were most likely to influence intentions. Based on the pilot study responses, the baseline survey was designed in collaboration with field staff. Next, the main cook of each household was surveyed at the baseline, prior to receiving the ICS. Then, households received their ICS. In Honduras, the ICS was fully subsidized, while in Uganda the stove price of 8000 to 10,000 Ugandan Shillings (~$2.20–$2.70 USD), was partially subsidized to be equivalent to 40% of the average weekly income of the head of household. After a trial phase of one month in Uganda and two months in Honduras, follow-up surveys were conducted in each household to capture how the experience of cooking with ICS altered any attributes. As a result, the baseline survey captured households’ experiences and opinions about traditional cookstoves and their impacts on livelihood, as well as their expectations for an ICS, while the follow-up survey captured their experiences and updated expectations for ICS.

3. Results and Discussion

Although applying TPB to quantify users’ experiences and expectations is a straightforward process, researchers must pay attention to the validity of models and data in addition to interpreting the results, particularly in data scarce settings such as those in this study. In this section, the two datasets are analyzed and lessons to improve quality of the data are discussed in detail.

3.1. Honduras

Table 3 and Table 4 show the means, standard deviations, and correlations between variables from the baseline and follow-up studies in Honduras, respectively. There were a variety of other variables in each category of attributes that were included in the surveys but omitted in the models. This is due to low internal consistency, incoherent translation, or lack of representation of every choice of the Likert scale. In addition, due to lack of representation of some categories of the dependent variables in the dataset, the parallel regression assumption could not be tested. As a result, reported coefficients are in log odds, instead of odds ratios hence should not be interpreted quantitatively for either the baseline or follow-up studies. Coefficients presented in log odd terms are values in mathematical formulas that describe likelihood of correlation between explanatory variable with explained variable. Such mathematical representations could be transformed to odds ratios hence interpretable only if the parallel regressions assumption holds true [64]. In the second round of data collection (in Uganda), such issues were addressed by improving the design of the study and data collection process.
The models that were developed are presented in Table 5, showing the variables for each TPB construct that were most significant to predicting intention as measured by the dependent variable in Honduras. Three models for the baseline study have high probabilities to reject the null hypothesis of Wald Chi square test that all estimated coefficients are equal to zero. Therefore, independent variables in the baseline models are likely to influence the intention. Baseline Model II and III show more promising results than Model I. These two models both have more significant measures to reject the hypothesis of Wald Chi square test, as well as relatively lower Akaike information criterion (AIC) and Bayesian information criterion (BIC) goodness-of-fit values. Baseline models suggest that reducing smoke emission is likely to have significant influence in households’ intention to use an ICS. A lower obligation to ask permission or consult with another family member to cook with ICS is also likely to have positive influence on intention. Having a higher perception regarding the feasibility to change long-term habits is correlated with an increased intention for cooking principal meals with ICS in all three models.
In the follow-up study, Model I fails to reject the null hypothesis of Wald Chi-square test, suggesting that all independent variables are likely to have no significant influence in describing intention. However, the significant and negative coefficient of smoke emission attribute in both models suggest that individuals with a stronger attitude toward reducing smoke emissions are less likely to cook main meals with ICS in a daily basis. This is an important finding indicating that households’ expectations regarding smoke emission reduction were likely unfulfilled during the trial. However, further interpretation and quantification of the change in users’ attitudes based on the baseline and follow-up study in Honduras is impossible due to biases.

3.1.1. Lessons Learned

Design of the study, implementation, and survey questions are among the key factors that determine quality and reliability of results. In the first study, some of the questions were biased in design and hence could not be interpreted. For example, one question asked, “How important is reducing fire smoke?” The word “important” in this question causes an inherent bias toward importance of less fire smoke. Therefore, the respondent was unintentionally directed to report higher levels of importance than what she may believe. The correct wording of survey questions should have no direction or inherent biases [65]. For example, the correct way to ask the question mentioned above could be: “On a scale of one to five (one not important at all, five very important), what do you think about reducing the smoke a cookstove emits?” In addition to potential biases in some of the survey questions, it was learned that the overall design of the study was associated with some bias. Due to the objectives of the project partner, the stoves that were used by households during the trial phase were distributed without any cost to the participants.
Since respondents were offered a free ICS, they reflected their gratitude through their answers to survey questions. This induces both the Hawthorne effect and socially desirable bias, in which respondents answer the survey questions in a way that they perceive the researcher wants to hear rather than expressing real opinions [66,67]. As a result, data leaned heavily toward the positive end of Likert scale questions. To avoid such biases researchers should design the study in a way that is more likely to capture respondents’ true opinions. Based on this, it is important to avoid promises or practices of free gifts in exchange for participation in surveys. Detailed discussion on how to remedy for these two biases are presented by [68,69].

3.1.2. Data Separation and Internal Consistency

Data screening is important to correct for potential violations of the assumptions of TPB and/or regression analysis. The observations in the first dataset of this study were suffering from quasi complete separation, and low internal consistency. When one or more levels of independent variables are not describing the outcome, such lack of representation is referred to as separation [70]. Complete separation causes estimated coefficients to approach infinity, while quasi complete separation causes inflated coefficients. In the follow-up dataset from Honduras, the dependent variable had no recorded observations for some levels of responses which led to invalid regression results and inflated coefficients. Several approaches that could be applied to address separation are discussed by [71], including omission of variables that have low or no variation and exact logistic regression. However, any approach has consequences that may influence the research hypotheses and invalidate conclusions from the analysis. The experience of researchers in this study suggests that the best way to address separation while conducting TPB analysis is by increasing sample size, careful design of the questions that yields heterogeneous recorded responses from participants, and parsimony in observed variables.
In the application of TPB, if questions intend to directly ask about particular constructs of the model such as ATB, SN, and PBC, the questions should have a high degree of internal consistency [58]. Therefore, it is important to select direct measures that show high reliability scores such as Cronbach alpha in the pilot study. For example, in the first study observed variable for change in taste of food did not show plausible internal consistency with other important variables such as smoke emission and firewood consumption. As a result, change in taste of food was removed in further analyses because of lack of consistency with the variables that are already established to be imperative attributes.
Learning from such errors, the second project in this study was able to predict the intention for cooking more meals with ICS based on TPB categories of attributes hence providing reliable results for future policy applications and design practices. In addition to controlling for discussed biases, robust standard errors were used to address potential existence of heteroscedasticity and models are corrected for parallel regression assumption to justify interpreting their coefficients in terms of odds ratios.

3.2. Uganda

In the second study in the Apac district of Uganda, the distributed ICS was partially subsidized to motivate respondents to participate in the study. Therefore, participants are more likely to report their opinions with less probability of occurrence of socially desirable bias. Results of the Uganda pilot test presented plausible internal consistency between smoke emission, firewood consumption and stove durability for the ATB attribute. While attributes including changing habits, the husband’s satisfaction of food, and self-confidence regarding change in kitchen equipment provided consistent measures of PBC. Questions designed based on these results were shared with a few non-participant community members identified by local staff before data collection to avoid potential biases and back translation procedure. Researchers also explained the purpose of the study and the method to collect data for behavior related Likert scale questions to the data collectors using a few videos to help avoid surveyor biases and elicit more granular responses from participants.
Table 6 and Table 7 show the means, standard deviations, and correlations between variables from the baseline and follow-up studies in Uganda, respectively. Results were used to develop two models for the baseline data and two models for the follow-up (Table 8). Model I in the baseline study violates the parallel regressions assumption so results are reported in log odds. Nevertheless, because the independent variables are statistically significant, they indicate a higher likelihood of influencing intention as the dependent variable. Therefore, Model I suggests that at the baseline and before users experience the clean cookstove, intention to cook with it is likely because of positive attitudes (ATB) toward less smoke emissions and less firewood consumption, with stronger correlation than other issues investigated. In terms of SN, the more individuals value opinion of their friends and family, they are more likely to cook with the improved cookstove. Both significant attributes that represent PBC are indicators of an individual’s power and perception of authority she exercises to change her cooking device and both show a statistically significant correlation with intention, but in contradictory ways. Estimated odds ratio related to variable PBC1 is greater than one, suggesting that the more individuals have authority to change their cooking device, the more likely they are to cook with improved cookstove. However, odds ratio of the variable PBC2 is less than one, suggesting the more respondents perceive themselves as independent decision makers, the less likely they are to change their cooking device. One potential explanation for this contradictory finding could be that the more independency households feel in making decisions for appliances, they tend to allocate available resources to the most pressing needs such as medicines and food instead of ICS.
In the follow-up Model II the results were corrected for the parallel regression assumption by removing the variables that were in violation. Therefore, results of Model II are presented in odds ratios and can be interpreted quantitatively. This model indicates households’ attitudes toward importance of reducing smoke emissions is the most important factor that influences their intention to adopt improved cookstoves.
On average, households with a slightly stronger belief about the importance of reducing smoke emission (one level on a scale of one to five) are 3.27 times more likely to cook two more meals with improved cookstoves. In addition, if households find their friends and family supportive of cooking meals with an improved cookstove, the number of meals they cook with improved cookstove is likely to increase. The odds of cooking two more meals with ICS during each week for a household that feels slightly higher encouragement from friends and family regarding cooking with ICS (one level on a scale of one to five) is 1.47 times as likely.
The study in Uganda was based on partially subsidized stoves. As a result, participants in the follow-up study represent only a subsample of baseline participants who were willing to pay for a subsidized improved cookstove. Therefore, the models in the follow-up study are based on a smaller sample size. The dependent variable in follow-up Model I contains data related to households’ intentions to cook all their meals with ICS. This model indicates that after a trial period, households’ intention to cook with ICS is not likely to be significantly influenced by their attitudes toward smoke emission and firewood consumption. This finding suggests that their expectations in terms of reducing smoke emissions and firewood consumption are likely to have been fulfilled by the stove. However, their intentions to cook all their meals with an improved cookstove or fully replacing their traditional stove(s) is likely to be influenced by their social norms and perception of the control they have over changing their behavior. In terms of SN, a household with slightly stronger (one level on a scale of one to five) feeling about the importance of friends and family’s opinion is 0.53 times as likely than average to cook all their meals with ICS. In contrast, a household with slightly more sensitivity (one level on a scale of one to five) about the type of stove that neighbors are using is 1.38 times as likely as average to fully adopt ICS. One potential explanation for this inconsistency could be the difference between experiences of friends and family versus neighbors. The study was conducted in a community where not necessarily every friend and family participated in the trial phase, yet many neighbors received offers to participate in the study. As a result, opinions of friends and family might be inconsistent with the experiences of participating neighbors. The most significant attribute that influences intention in Model I of the follow-up study is the perception of difficulty to replace the traditional practice with an ICS. Results suggest that a cook that perceives this transition as slightly easier (one level on a scale of one to five) than average is 2.72 times as likely to fully replace her traditional stove in favor of the ICS that she used in the trial phase. This finding presents the importance of habits and demonstrating the ease of using the ICS in determining successful transition of communities toward clean energy technology adoption.
In Model II of the follow up study in Uganda, the dependent variable captures the intention to cook main meals with ICS. While both questions capture the intention to cook principal meals with ICS as a proxy for full adoption, they are worded differently and placed randomly in the survey for purposes of cross validation and avoiding correlation biases with preceding questions. Results of Model II suggest that intentions are likely to be influenced by ATB variables related to smoke emissions and firewood consumption. Respectively, individuals with slightly stronger belief regarding importance of less firewood consumption and reducing smoke emissions are 2.67 and 2.13 times more likely than average to cook main meals with ICS. In addition, the ability to independently choose a cooking device is a significant determinant of intention to use ICS. Based on the results of Model II, odds for individuals who perceive slightly higher independence in making this decision are 2.51 times higher than average to cook main meals with ICS.

4. Conclusions and Future Work

This work focuses on the use of TPB as a quantitative methodology to predict users’ intentions to adopt clean cookstoves. This model focuses solely on the motivation to adopt, while other factors such as awareness, accessibility, affordability, and usability play a key role in adoption and sustained use, and therefore impact, as well. Findings are useful from two perspectives of engineering design of clean technologies and policy design for promoting long-term and consistent adoption of clean technologies. Both perspectives are further discussed below.
From an engineering design perspective, this approach provides a quantitative method to comprehensively capture important attributes of a technology that influence the intention of users to use the technology. Therefore, application of this method enables the technology designer to identify and prioritize attributes and the extent of influence of each attribute to inform the technology design for a systematic and data-driven user-centered design. For instance, the presented case study of this research sheds light that for the target population in the Ugandan sample size, a technology designer should focus on reducing the smoke emission over firewood consumption as both baseline models identify smoke emissions to be the more important attribute. Furthermore, this interpretation is also quantified in the study with odds ratios of 1.1 for smoke emission to 0.5 for firewood consumption in the baseline model I of Table 8. Therefore, the extent to which the smoke reduction should be prioritized to less firewood consumption is captured.
From a policy design perspective, the method applied in this study enables policy makers to design policies that are reflective of dominant behavioral attributes, widespread beliefs, cultural tendencies, and supply side barriers to promote population-scale adoption of clean technologies that are likely to improve public health and environmental impact in communities. For example, results of this study suggest that after a trial period, households’ intention to cook most of their principal meals with an ICS becomes positively correlated with individual’s evaluation of choice of stove and opinion of the neighbors’ (SN3 in follow-up model I in Table 8). One policy implication from this observation is that after introduction of a clean technology in a region, it is important to organize information campaigns that improve population-scale opinions about the clean technologies for an extended period of time so that likelihood of synergic adoption increases.
Furthermore, the results of this study suggest that households’ intentions to use a clean cookstove for cooking main meals change prior to and after a trial phase. In the Uganda study, participants’ intentions to use an improved cookstove in the baseline were highly influenced by their attitudes toward reducing smoke emissions and encouragement of their friends and families. While in Honduras, prior to trying ICS, households’ attitudes toward the importance of reducing smoke emissions influenced their intentions for using an ICS. In terms of perceived hindrances, seeking the permission of the head of the family is likely to be the most important attribute that constrains such intentions for the main cooks. In the follow-up studies, intentions to use the ICS were influenced by different attributes. In Uganda, participants with a stronger attitude toward reducing firewood consumption and those who placed more value on the experience of their neighbors were more likely to express higher intentions for cooking with the ICS.
This study also identified challenges to using TPB to predict behavior in low-resource communities where language, culture, and level of education can introduce biases and create uncertainty in the recorded data. Sources of bias that could negatively influence the validity of models were identified. In addition, the need to design of questions to minimize separation and increase internal consistency was highlighted. During the multiple phases of data collection required for this study, the research team was able to apply lessons learned to reduce many biases by training surveyors and updating survey designs to be more accurate in data scarce settings.
Applying TPB as a systematic approach to analyze users’ decision-making process for adopting clean technologies presents a comprehensive approach that highlights the technology uptake phase for designers, implementers, and policymakers. The method provides insight to optimize design attributes that could reasonably fulfill users’ expectations and priorities. Technology distribution policies could also benefit from this method by holding targeted information campaigns and behavior change communication strategies that lead users to realistic expectations of the technology performance, as well as customer support that reflect the dominant concerns of users. One of the key concepts of this study is that long lasting and consistent displacement of inefficient and unhealthy traditional practices is bound with user behavior-oriented technology design, as well as continuous policy and customer support as opposed to spontaneous and isolated practice.
An intention to adopt a technology alone does not always translate directly to the behavior due to barriers beyond control of households, such as lack of access to affordable clean alternatives. Future work to link measured long-term behavior to TPB attributes is needed. It is recommended that future work identify and avoid any further sources of bias and their influence on reliability of results and testing hypotheses. In addition, the use of TPB to inform utility functions and agent-based models in systems engineering and decision support tools should also be explored [72,73].

Author Contributions

Conceptualization, M.H.P. and N.M.; methodology, M.H.P. and N.M.; software, M.H.P.; validation, M.H.P.; formal analysis, M.H.P.; investigation, M.H.P.; resources, N.M.; data curation, M.H.P.; writing—original draft preparation, M.H.P.; writing—review and editing, N.M.; visualization, M.H.P.; supervision, N.M.; project administration, N.M.; funding acquisition, N.M. All authors have read and agreed to the published version of the manuscript.

Funding

This research was funded by NSF CMMI grant #1662485. Any opinions, findings, and conclusions or recommendations expressed in this material are those of the author(s) and do not necessarily reflect the views of the National Science Foundation.

Acknowledgments

The authors of this study would like to thank StoveTeam International and International Lifeline Fund and their field staff for their considerable efforts in executing this study. We also thank Elizabeth Schroeder and Allison Johnston for assistance with data analysis. We also appreciate the financial support of the School of Mechanical, Industrial, and Manufacturing Engineering at Oregon State University.

Conflicts of Interest

The authors declare no conflict of interest. The funders had no role in the design of the study; in the collection, analyses, or interpretation of data; in the writing of the manuscript, or in the decision to publish the results.

Appendix A

Appendix A.1. Survey Questions in Honduras, Baseline Study

[Intention] How many meals do you expect to cook each day with [ICS brand]?
  • None 1 2 3 4 5
[SN] How much do you value NGO/Government officials’ opinion about using [ICS brand]?
  • A lot, try to comply
  • I respect their opinion, but it doesn’t influence me
  • I don’t pay attention
  • I ignore them
  • I try the opposite
[ATT] Consuming less fuelwood is:_____________
  • Very important
  • Important
  • Doesn’t matter
  • Not important
  • Not important at all
[ATT] How much do you think less fire smoke is important?
  • Not important moderately important
  • I don’t know
  • Important
  • Very important
[ATT] How much do you think cooking meal with [ICS brand] changes the taste of the food?
  • No change a little bit
  • I don’t know considerably
  • A lot
[PBC] How difficult do you think it will be to not use your traditional stove?
  • Very hard
  • Hard
  • I don’t know
  • Easy
  • Very easy
[SN] How much do you value doctors’ opinion about using [ICS brand]?
  • A lot, try to comply
  • I respect their opinion, but it doesn’t influence me
  • I don’t pay attention
  • I ignore them
  • I try the opposite
[PBC] Can you decide to use [ICS brand] or do you need to consult someone?
  • I can decide myself
  • I feel I can decide by myself
  • I don’t know
  • I prefer to consult
  • I need to consult
[SN] doctors opinions are: __________
  • Important and correct
  • Good to consider
  • I don’t know
  • Not important
  • Incorrect
[ATT] How much do you think less fuelwood consumption is important?
  • Not important
  • Moderately important
  • I don’t know
  • Important
  • Very important
[SN] NGOs/government officials opinions are:____________
  • Important and correct
  • Good to consider
  • I don’t know
  • Not important
  • Incorrect
[SN] How much do you value the opinion of people that are important to you about your decision on using [ICS brand]?
  • Very much
  • A little bit
  • I don’t know
  • Not particularly
  • I don’t care what they think
[ATT] How much do you think [ICS brand] is designed to meet your needs?
  • Very good designed
  • Its OK
  • I don’t know
  • I’m not confident it’s a good design
  • Its not designed based on what I need
[SN] For the people who are important to you do you think that for them its important that you adopt [ICS brand]?
  • They discourage
  • They don’t feel good
  • Indifferent
  • They feel good
  • They encourage
[Intention] Do you think you will cook all of your meals with [ICS brand]?
  • Not at all
  • Not likely
  • Maybe
  • Most likely
  • Yes for sure
[SN] How much do you value teachers’ opinion about using [ICS brand]?
  • A lot, try to comply
  • I respect their opinion, but it doesn’t influence me
  • I don’t pay attention
  • I ignore them
  • I try the opposite
[ATT] How much do you think cooking meal with [ICS brand] is beneficial?
  • Detrimental
  • Somewhat harmful
  • Neutral
  • Somewhat beneficial
  • Beneficial
[PBC] Are you confident that you can use [ICS brand]?
  • Not at all
  • I’m not sure
  • I don’t know
  • I am confident
  • I’m very confident
[ATT] Spending less time for cooking is: __________
  • Very important
  • Important
  • Doesn’t matter
  • Not important
  • Not important at all
[SN] teachers opinions are:___________
  • Important and correct
  • Good to consider
  • I don’t know
  • Not important
  • Incorrect
[ATT] Emitting less smoke is:___________
  • Not important
  • Moderately important
  • I don’t know
  • Important
  • Very important
[Intention] Will you cook your principal meals mainly with the [ICS brand]?
  • Not at all
  • Not likely
  • Maybe
  • Most likely
  • Yes for sure
[PBC] How much do you think replacing your current stove with [ICS brand] is feasible?
  • Its very hard to change
  • It’s a little hard to change current stove
  • I don’t know
  • Its easy to change current stove
  • Its necessary to change current stove
[PBC] How much do you think cooking meal with [ICS brand] is easy?
  • Very easy
  • Somewhat easy
  • I don’t know
  • Hard
  • Very hard
[PBC] How much do you think the time it will take to learn how to use [ICS brand] is a problem?
  • Not a problem at all
  • Could be a problem
  • I don’t know
  • Challenging
  • Very problematic
[ATT] How much do you value cooking your meals faster?
  • Not important
  • Moderately important
  • I don’t know
  • Important
  • Very important

Appendix A.2. Survey Questions in Honduras, Follow-Up Study

[Intention] How many meals do you cook each day with [ICS brand]?
  • None 1 2 3 4
[SN] How much do you value NGO/Government officials’ opinion about using [ICS brand]?
  • I lot, try to comply
  • I respect their opinion, but it doesn’t influence me
  • I don’t pay attention
  • I ignore them
  • I try the opposite
[ATT] Consuming less fuelwood is:_____________
  • Very important
  • Important
  • Doesn’t matter
  • Not important
  • Not important at all
[PBC] When you want to cook for more people than usual, which stove is better for you?
[ICS brand] is much better
[ICS brand] is somewhat better
  • No difference
  • Traditional stove is somewhat better
  • Traditional stove is much better
[ATT] How much do you think cooking meal with [ICS brand] changes the taste of the food?
  • No change
  • A little bit
  • I don’t know
  • Considerably A lot
[SN] How much do you value doctors’ opinion about using [ICS brand]?
  • A lot, try to comply
  • I respect their opinion, but it doesn’t influence me
  • I don’t pay
  • Attention
  • I ignore them
  • I try the opposite
[ATT] How much do you think less fire smoke is important?
  • Very important
  • Important
  • Doesn’t matter
  • Not important
  • Not important at all
[PBC] Is it your decision to keep using your [ICS brand] or do you need to consult someone?
  • I can decide myself
  • I feel I can decide by myself
  • I don’t know
  • I prefer to consult
  • I need to consult
[PBC] When you have less fuelwood than usual cooking with [ICS brand] is:
  • Very difficult
  • Difficult
  • I don’t know
  • Easy
  • Very easy
[ATT] Doctors’ opinions are: __________
  • Important and correct
  • Good to consider
  • I don’t know
  • Not important
  • Incorrect
[PBC] When you have a low supply of fuelwood which cookstove is better for you?
[ICS brand] is much better
[ICS brand] is somewhat better
  • No difference
  • Traditional stove is somewhat better
  • Traditional stove is much better
[ATT] How much do you think less fuelwood consumption is important?
  • Very important
  • Important
  • Doesn’t matter
  • Not important
  • Not important at all
[SN] NGOs/government officials opinions are:____________
  • Important and correct
  • Good to consider
  • I don’t know
  • Not important
  • Incorrect
[SN] How much do you value the opinion of people that are important to you about your decision on using [ICS brand]?
  • Very much
  • A little bit
  • I don’t know
  • Not particularly
  • I don’t care what they think
[ATT] How much do you think [ICS brand] is designed to meet your needs?
  • Very well designed
  • Its fine
  • I don’t know
  • It’s not the best design for my need
  • It’s not designed based on what I need
[SN] For the people who are important to you do you think that for them it is important that you adopt [ICS brand]?
  • They discourage
  • They don’t feel good
  • Indifferent
  • They feel good
  • They encourage
[Intention] Do you think you will cook all of your meals with [ICS brand]?
  • Not at all
  • Not likely
  • Maybe
  • Most likely
  • Yes for sure
[SN] How much do you value teachers’ opinion about using [ICS brand]?
  • A lot, try to comply
  • I respect their opinion, but it doesn’t influence me
  • I don’t pay attention
  • I ignore them
  • I try the opposite
[ATT] How much do you think cooking meal with [ICS brand] is beneficial?
  • Detrimental
  • Somewhat harmful
  • Neutral
  • Somewhat beneficial
  • Beneficial
[PBC] Cooking a meal quickly with the [ICS brand] is: __________
  • Very difficult
  • Difficult
  • I don’t know
  • Easy
  • Very easy
[ATT] Spending less time for cooking is: __________
  • Very important
  • Important
  • Doesn’t matter
  • Not important
  • Not important at all
[SN] Teachers opinions are:___________
  • Important and correct
  • Good to consider
  • I don’t know
  • Not important
  • Incorrect
[ATT] Emitting less smoke is:___________
  • Very important
  • Important
  • Doesn’t matter
  • Not important
  • Not important at all
[Intention] Do you cook your principal meals mainly with the [ICS brand]?
  • Never
  • Rarely
  • Sometimes
  • Often
  • Always
[PBC] When you want to cook for more people than usual, using the [ICS brand] is: ___________
  • Very difficult
  • Difficult
  • I don’t know
  • Easy
  • Very easy
[SN] How much do you value other people’s experience using [ICS brand] over your experience?
  • Very much
  • A little bit
  • I don’t know
  • Not particularly
  • I don’t care what they think
[PBC] When you want to cook something fast which stove is better for you?
[ICS brand] is much better
[ICS brand] is somewhat better
  • No difference
  • Traditional stove is somewhat better
  • Traditional stove is much better
[ATT] How much do you value cooking your meals faster?
  • Very important
  • Important
  • Doesn’t matter
  • Not important
  • Not important at all

Appendix A.3. Survey Questions in Uganda, Baseline Study

[Intention] How many meals do you want to cook each day with your improved cookstove?
  • None 1 2 3 4
[Intention] If you buy an improved cookstove, how likely is it to cook your principal meals with it.
  • Very unlikely
  • A little unlikely
  • Neutral Somewhat likely
  • Very likely
[ATT] How much do you agree or disagree with the following sentence: I will use an improve cookstove more, if it looks beautiful.
  • Strongly disagree
  • Disagree
  • Neither agree or disagree
  • Agree
  • Strongly agree
[ATT] How much do you think cooking meals with an improved cookstove changes the fuelwood consumption?
  • Burns significantly more fuelwood
  • Burns a little more fuelwood
  • No difference
  • Burns a little less fuel wood
  • Burns significantly less fuelwood
[ATT] Compared to cooking with traditional stoves, how safe or dangerous is it to use an improved cookstove?
  • Improved cookstove is a lot more dangerous
  • Improved cookstove is a little more dangerous
  • No difference
  • Improved cookstove is a little more safe
  • Improved cookstove is a lot more safe
[PBC] How much do you think cooking meals with an improved cookstove is easy or hard?
  • It’s very hard
  • It’s a little difficult
  • No difference
  • It’s a little easy
  • It’s very easy
[ATT] What do you think about the smoke an improved cookstove emits?
  • Too much more than traditional stove
  • A little more than traditional stove
  • No difference
  • A little less than traditional stove
  • Significantly less than traditional stove
[SN] How many of your friends and family use an improved cookstove themselves?
  • None of them
  • Less than 4
  • Between 4 to 7
  • between 7 to 10
  • More than 10 (all of them)
[SN] If you use an improved cookstove, do you think your friends and family support you or discourage you?
  • Very discouraging
  • A little discouraging
  • Neither supportive or discouraging
  • A little supportive
  • Very supportive
[SN] How much do you agree or disagree with the following sentence: my friends and family expect me to use traditional stove.
  • Strongly disagree
  • Disagree
  • Neither agree or disagree
  • Agree
  • Strongly agree
[PBC] Do you need to ask permission or consult with someone for using an improved cookstove?
  • My husband decides about it
  • My husband decides after consulting with me
  • We consult and decide together
  • I decide after consulting with my husband
  • It’s completely up to me
[PBC] Overall, how easy or hard do you think it is to use an improved cookstove instead of your mud stove/metallic charcoal stove?
  • Very hard
  • A little difficult
  • Neither hard nor easy
  • Easy
  • Very easy
[PBC] How much do you agree or disagree with the following sentence: I am the only person who can decide whether to use an improved cookstove or not.
  • Strongly disagree
  • Disagree
  • Neither agree or disagree
  • Agree
  • Strongly agree
[Intention] How many meals do you think you will cook with the improved cookstove during each week?
  • Less than 3
  • Between 3 to 5 meals
  • Between 5 to 7 meals
  • Between 7 to 10
  • More than 10 meals
[ATT] How does an improved cookstove compare to your traditional stove in general?
  • Much worse
  • Somewhat worse
  • No difference
  • Somewhat better
  • Much better
[SN] How much do you value opinion of the people whom are important to you about your cookstove?
  • Not at all important
  • Neutral Slightly important
  • Important
  • Very important
[PBC] How much are you confident that you will use an improved cookstove regularly to cook your meals?
  • Very uncertain
  • Slightly uncertain
  • Neither confident nor uncertain
  • Slightly confident
  • Very confident
[ATT] Emitting less smoke is: ___________
  • Very bad
  • A little bad
  • Not a problem
  • A little good
  • Very good

Appendix A.4. Survey Questions in Uganda, Follow-Up Study

[Intention] Now that we are removing sensors and you have experienced ILF woodstove, how likely is it that you cook all your main meals with ILF woodstove?
  • Extremely unlikely
  • Unlikely
  • Neutral Likely
  • Extremely likely
[Intention] How often do you cook your main meals with your improved cookstove?
  • Never
  • Seldom
  • About half the time
  • Usually
  • Always
[ATT] How much do you agree or disagree with the following sentence: I will use an improved cookstove more, if it looks beautiful.
  • Strongly disagree
  • Disagree
  • Neither agree or disagree
  • Agree
  • Strongly agree
[ATT] How much do you agree or disagree with the following sentence: The most important reason that I use ILF woodstove because it uses less firewood.
  • Strongly disagree
  • Disagree
  • Neither agree or disagree
  • Agree
  • Strongly agree
[ATT] Compared to cooking with traditional stoves, how safe or dangerous is it to use ILF woodstove?
  • Improved cookstove is a lot more dangerous
  • Improved cookstove is a little more dangerous
  • No difference
  • Improved cookstove is a little more safe
  • Improved cookstove is a lot more safe
[PBC] How much do you think cooking meals with ILF woodstove is easy or hard?
  • It’s very hard
  • It’s a little difficult
  • No difference
  • It’s a little easy
  • It’s very easy
[ATT] How much do you agree or disagree with this sentence: Less smoke emission is the most important reason that you use improved cookstove
  • Strongly disagree
  • Disagree
  • Neither disagree or agree
  • Agree
  • Strongly agree
[SN] How many of your friends and family use an improved cookstove themselves?
  • None of them
  • Less than 4
  • Between 4 to 7
  • Between 7 to 10
  • More than 10 (all of them)
[SN] To what extend do you think your friends and family encourage or discourage you to cook main meals with ILF woodstove?
  • Very discouraging
  • A little discouraging
  • Neither supportive or discouraging
  • A little supportive
  • Very supportive
[SN] How much do you care or don’t care about the stove type that your neighbors use?
  • Not at all important
  • A little important
  • Slightly important Important
  • Very important
[PBC] Do you need to ask permission or consult with someone for using ILF woodstove?
  • My husband decides about it
  • My husband decides after consulting with me
  • We consult and decide together
  • I decide after consulting with my husband
  • It’s completely up to me
[PBC] How easy or hard do you think it is to use an improved cookstove instead of your traditional stove?
  • Very hard
  • A little difficult
  • Neither hard nor easy
  • Easy
  • Very easy
[PBC] How much do you agree or disagree with the following sentence: I am the only person who can decide whether to use an improved cookstove or not.
  • Strongly disagree
  • Disagree
  • Neither agree or disagree Agree
  • Strongly agree
[Intention] How often do you think you will use ILF woodstove in next few months to cook your main meals?
  • Never
  • Seldom
  • Sometimes
  • Usually
  • Almost always
[SN] How much do you value opinion of the people whom are important to you about your cookstove?
  • Not at all important
  • Neutral
  • Slightly important
  • Important
  • Very important
[PBC] How hard or easy is it to use improved cookstove instead of your traditional stove regularly?
  • Very hard
  • A little difficult
  • Neither hard nor easy
  • Somewhat easy
  • Very easy
[ATT] Generally what do you think about emission of less smoke?
  • Very bad
  • A little bad
  • Not a problem
  • A little good
  • Very good
[ATT] Less firewood burning is: What do you think about less firewood burning
  • Not important at all
  • A little important
  • Fairly important
  • Important
  • Very important

References

  1. Rogers, E.M. Diffusion of Innovations, 4th ed.; Simon and Schuster: New York, NY, USA, 1995. [Google Scholar]
  2. Bouzarovski, S.; Petrova, S. A global perspective on domestic energy deprivation: Overcoming the energy poverty-fuel poverty binary. Energy Res. Soc. Sci. 2015, 10, 31–40. [Google Scholar] [CrossRef]
  3. MacCarty, N.A.; Bryden, K.M. Costs and impacts of potential energy strategies for rural households in developing communities. Energy 2017, 138, 1157–1174. [Google Scholar] [CrossRef]
  4. Shankar, A.; Johnson, M.; Kay, E.; Pannu, R.; Beltramo, T.; Derby, E.; Harrell, S.; Davis, C.; Petach, H. Maximizing the benefits of improved cookstoves: Moving from acquisition to correct and consistent use. Glob. Health Sci. Pract. 2014, 2, 268–274. [Google Scholar] [CrossRef] [PubMed] [Green Version]
  5. Legros, G.; Havet, I.; Bruce, N.; Bonjour, S.; Rijal, K.; Takada, M.; Dora, C. The Energy Access Situation in Developing Countries: A Review Focusing on the Least Developed Countries and Sub-Saharan Africa; World Health Organization: Geneva, Switzerland, 2019. [Google Scholar]
  6. Johnson, N.G.; Bryden, K.M. Factors affecting fuelwood consumption in household cookstoves in an isolated rural West African village. Energy 2012, 46, 310–321. [Google Scholar] [CrossRef]
  7. Lim, S.S.; Vos, T.; Flaxman, A.D.; Danaei, G.; Shibuya, K.; Adair-Rohani, H.; AlMazroaMD, M.A.; Amann, M.; AndersonMD, H.R.; Andrews, K.G.; et al. A comparative risk assessment of burden of disease and injury attributable to 67 risk factors and risk factor clusters in 21 regions, 1990–2010: A systematic analysis for the Global Burden of Disease Study 2010. Lancet 2012, 380, 2224–2260. [Google Scholar] [CrossRef] [Green Version]
  8. Smith, K.R.; Bruce, N.; Balakrishnan, K.; Adair-Rohani, H.; Balmes, J.; Chafe, Z.; Rehfuess, E. Millions dead: How do we know and what does it mean? Methods used in the comparative risk assessment of household air pollution. Annu. Rev. Public Health 2014, 35, 185–206. [Google Scholar] [CrossRef] [PubMed] [Green Version]
  9. Ramanathan, V.; Carmichael, G. Global and regional climate changes due to black carbon. Nat. Geosci. 2008, 1, 221–227. [Google Scholar] [CrossRef]
  10. Bailis, R.; Drigo, R.; Ghilardi, A.; Masera, O. The carbon footprint of traditional woodfuels. Nat. Clim. Chang. 2015, 5, 266–272. [Google Scholar] [CrossRef]
  11. Masera, O.R.; Bailis, R.; Drigo, R.; Ghilardi, A.; Ruiz-Mercado, I. Environmental burden of traditional bioenergy use. Annu. Rev. Environ. Resour. 2015, 40, 121–150. [Google Scholar] [CrossRef]
  12. Lewis, J.J.; Pattanayak, S.K. Who adopts improved fuels and cookstoves? A systematic review. Environ. Health Perspect. 2012, 120, 637–645. [Google Scholar] [CrossRef] [PubMed]
  13. Johnson, M.; Edwards, R.; Masera, O. Improved stove programs need robust methods to estimate carbon offsets. Clim. Chang. 2010, 102, 641–649. [Google Scholar] [CrossRef]
  14. Ruiz-Mercado, I.; Canuz, E.; Smith, K.R. Temperature dataloggers as stove use monitors (SUMs): Field methods and signal analysis. Biomass Bioenergy 2012, 47, 459–468. [Google Scholar] [CrossRef] [PubMed] [Green Version]
  15. Jeuland, M.A.; Bhojvaid, V.; Kar, A.; Lewis, J.J.; Patange, O.; Pattanayak, S.K.; Ramanathan, V. Preferences for improved cook stoves: Evidence from rural villages in north India. Energy Econ. 2015, 52, 287–298. [Google Scholar] [CrossRef]
  16. Mobarak, A.M.; Dwivedi, P.; Bailis, R.; Hildemann, L.; Miller, G. Low demand for nontraditional cookstove technologies. Proc. Natl. Acad. Sci. 2012, 109, 10815–10820. [Google Scholar] [CrossRef] [PubMed] [Green Version]
  17. Mortimer, K.; Ndamala, C.B.; Naunje, A.W.; Malava, J.; Katundu, C.; Weston, W.; Wang, D. A cleaner burning biomass-fuelled cookstove intervention to prevent pneumonia in children under 5 years old in rural Malawi (the Cooking and Pneumonia Study): A cluster randomised controlled trial. Lancet 2017, 389, 167–175. [Google Scholar] [CrossRef] [Green Version]
  18. Pope, D.; Bruce, N.; Dherani, M.; Jagoe, K.; Rehfuess, E. Real-life effectiveness of ‘improved’stoves and clean fuels in reducing PM2.5 and CO: Systematic review and meta-analysis. Environ. Int. 2017, 101, 7–18. [Google Scholar] [CrossRef] [PubMed]
  19. Clark, M.L.; Peel, J.L.; Burch, J.B.; Nelson, T.L.; Robinson, M.M.; Conway, S.; Reynolds, S.J. Impact of improved cookstoves on indoor air pollution and adverse health effects among Honduran women. Int. J. Environ. Health Res. 2009, 19, 357–368. [Google Scholar] [CrossRef]
  20. Rogers, E.M. Diffusion of preventive innovations. Addict. Behav. 2002, 27, 989–993. [Google Scholar] [CrossRef]
  21. Moses, N.D.; Pakravan, M.H.; MacCarty, N.A. Development of a practical evaluation for cookstove usability. Energy Sustain. Dev. 2019, 48, 154–163. [Google Scholar] [CrossRef]
  22. Alam, S.S.; Hashim, N.H.N.; Rashid, M.; Omar, N.A.; Ahsan, N.; Ismail, M.D. Small-scale households renewable energy usage intention: Theoretical development and empirical settings. Renew. Energy 2014, 68, 255–263. [Google Scholar] [CrossRef]
  23. Malakar, Y.; Greig, C.; van de Fliert, E. Resistance in rejecting solid fuels: Beyond availability and adoption in the structural dominations of cooking practices in rural India. Energy Res. Soc. Sci. 2018, 46, 225–235. [Google Scholar] [CrossRef]
  24. Barnes, D.F.; Openshaw, K.; Smith, K.R.; van der Plas, R. What makes people cook with improved biomass stoves? A comparative international review of Stove Programs. In World Bank Technical Paper; International Bank for Reconstruction and Development: Washington, DC, USA, 1994. [Google Scholar]
  25. Brown, T.; Katz, B. Change by design. J. Prod. Innov. Manag. 2011, 28, 381–383. [Google Scholar] [CrossRef]
  26. Hanna, R.; Duflo, E.; Greenstone, M. Up in smoke: The influence of household behavior on the long-run impact of improved cooking stoves. Am. Econ. J. Econ. Policy 2016, 8, 80–114. [Google Scholar] [CrossRef]
  27. He, L.; Wang, M.; Chen, W.; Conzelmann, G. Incorporating social impact on new product adoption in choice modeling: A case study in green vehicles. Transp. Res. Part Transp. Environ. 2014, 32, 421–434. [Google Scholar] [CrossRef]
  28. McFadden, D. Sociality, Rationality, and the Ecology of Choice. In Choice Modelling: The State-of-the-Art and the State-of-Practice; Emerald Group Publishing Limited: Bingley, UK, 2010; pp. 1–17. [Google Scholar]
  29. Adrianzén, M.A. Social capital and improved stoves usage decisions in the northern Peruvian Andes. World Dev. 2014, 54, 1–17. [Google Scholar] [CrossRef] [Green Version]
  30. Kumar, P.; Igdalsky, L. Sustained uptake of clean cooking practices in poor communities: Role of social networks. Energy Res. Soc. Sci. 2019, 48, 189–193. [Google Scholar] [CrossRef]
  31. Kumar, P.; Mehta, S. Poverty, gender, and empowerment in sustained adoption of cleaner cooking systems: Making the case for refined measurement. Energy Res. Soc. Sci. 2016, 19, 48–52. [Google Scholar] [CrossRef]
  32. Jürisoo, M.; Lambe, F.; Osborne, M. Beyond buying: The application of service design methodology to understand adoption of clean cookstoves in Kenya and Zambia. Energy Res. Soc. Sci. 2018, 39, 164–176. [Google Scholar] [CrossRef]
  33. Thandapani, S.; Woodbridge, R. Assessing the Benefits of Early Stage Design Research of Rural BoP-Focused Energy Solutions in Urban Settings. In Proceedings of the ICoRD’11 International Conference on Research into Design, Bangalore, India, 10–12 January 2011. [Google Scholar]
  34. Davis, F.D. Perceived usefulness, perceived ease of use, and user acceptance of information technology. MIS Q. 1989, 13, 319–340. [Google Scholar] [CrossRef] [Green Version]
  35. Bandura, A.; Cervone, D. Differential engagement of self-reactive influences in cognitive motivation. Organ. Behav. Hum. Decis. Process. 1986, 38, 92–113. [Google Scholar] [CrossRef]
  36. Venkatesh, V.; Morris, M.G.; Davis, G.B.; Davis, F.D. User acceptance of information technology: Toward a unified view. MIS Q. 2003, 27, 425–478. [Google Scholar] [CrossRef] [Green Version]
  37. Ajzen, I. From Intentions to Actions: A Theory of Planned Behavior. In Action Control; Springer: Berlin/Heidelberg, Germany, 1985; pp. 11–39. [Google Scholar]
  38. Sharma, R.; Mishra, R. A Review of Evolution of Theories and Models of Technology Adoption. Indore Manag. J. 2014, 6, 17–29. [Google Scholar]
  39. Sheeren, P.; Abraham, C. The Health Belief Model. In Predicting Health Behaviour; Conner, M., Norman, P., Eds.; Open University Press: Berkshire, UK, 2005. [Google Scholar]
  40. Gifford, R.; Steg, L.; Reser, J.P. Environmental Psychology. In The IAAP Handbook of Applied Psychology; Blackwell Publishing Ltd.: Hoboken, NJ, USA, 2011; pp. 440–470. [Google Scholar]
  41. Klöckner, C.A. Decision Models—What Psychological Theories Teach Us about People’s Behaviour. In the Psychology of Pro-Environmental Communication; Palgrave Macmillan: London, UK, 2015; pp. 69–102. [Google Scholar]
  42. Armitage, C.J.; Conner, M. Efficacy of the Theory of Planned Behaviour: A meta-analytic review. Br. J. Soc. Psychol. 2001, 40, 471–499. [Google Scholar] [CrossRef] [Green Version]
  43. Conner, M.; Armitage, C.J. Extending the Theory of Planned Behavior: A Review and Avenues for Further Research. J. Appl. Soc. Psychol. 1998, 28, 1429–1464. [Google Scholar] [CrossRef]
  44. Ajzen, I. Consumer attitudes and behavior: The theory of planned behavior applied to food consumption decisions. Ital. Rev. Agric. Econ. 2015, 70, 121–138. [Google Scholar]
  45. Shukri, M.; Jones, F.; Conner, M. Work Factors, Work-Family Conflict, the Theory of Planned Behaviour and Healthy Intentions: A Cross-Cultural Study. Stress Heal. 2016, 32, 559–568. [Google Scholar] [CrossRef] [PubMed]
  46. Botetzagias, I.; Dima, A.-F.; Malesios, C. Extending the Theory of Planned Behavior in the context of recycling: The role of moral norms and of demographic predictors. Resour. Conserv. Recycl. 2015, 95, 58–67. [Google Scholar] [CrossRef] [Green Version]
  47. Yadav, R.; Pathak, G.S. Young consumers’ intention towards buying green products in a developing nation: Extending the theory of planned behavior. J. Clean. Prod. 2016, 135, 732–739. [Google Scholar] [CrossRef]
  48. Kowsari, R.; Zerriffi, H. Three dimensional energy profile: A conceptual framework for assessing household energy use. Energy Policy 2011, 39, 7505–7517. [Google Scholar] [CrossRef]
  49. Kar, A.; Zerriffi, H. From cookstove acquisition to cooking transition: Framing the behavioural aspects of cookstove interventions. Energy Res. Soc. Sci. 2018, 42, 23–33. [Google Scholar] [CrossRef]
  50. Ajzen, I. The theory of planned behavior. Organ. Behav. Hum. Decis. Process. 1991, 50, 179–211. [Google Scholar] [CrossRef]
  51. Abraham, C.; Sheeran, P.; Johnston, M. From health beliefs to self-regulation: Theoretical advances in the psychology of action control. Psychol. Health 1998, 13, 569–591. [Google Scholar] [CrossRef]
  52. Conner, M.; Norman, P. Predicting Health Behaviour: Research and Practice with Social Cognition Models; Open University Press: Berkshire, UK, 1996. [Google Scholar]
  53. Maddux, J.E. Expectancies and the social–cognitive perspective: Basic principles, processes, and variables. In How Expectancies Shape Experience; American Psychological Association: Washington, DC, USA, 1999. [Google Scholar]
  54. Webb, T.L.; Sheeran, P. Does changing behavioral intentions engender behavior change? A meta-analysis of the experimental evidence. Psychol. Bull. 2006, 132, 2249–2268. [Google Scholar] [CrossRef] [PubMed] [Green Version]
  55. French, D.P.; Hankins, M. The expectancy-value muddle in the theory of planned behavior—And some proposed solutions. Br. J. Health Psychol. 2003, 8, 37–55. [Google Scholar] [CrossRef]
  56. Falko, F.; Presseau, S.J.; Vera, A.-S. Time to retire the theory of planned behavior. Health Psychol. Rev. 2014, 8, 1–7. [Google Scholar]
  57. Ajzen, I. The theory of planned behaviour is alive and well, and not ready to retire: A commentary on Sniehotta, Presseau, and Araújo-Soares. Health Psychol. Rev. 2015, 9, 131–137. [Google Scholar] [CrossRef] [PubMed]
  58. Ajzen, I. Theory of Planned Behaviour Questionnaire. Measurement Instrument Database for the Social Science 2013; University of Massachusetts Amherst: Amherst, MA, USA, 2018. [Google Scholar]
  59. Hankins, M.; French, D.; Horne, R. Statistical guidelines for studies of the theory of reasoned action and the theory of planned behaviour. Psychol. Health 2000, 15, 151–161. [Google Scholar] [CrossRef]
  60. MacCarty, N.A. Development and Use of an Integrated Systems Model to Design Technology Strategies for Energy Services in Rural Developing Communities. Ph.D. Thesis, Iowa State University, Ames, IA, USA, 2015. [Google Scholar]
  61. Francis, J.; Eccles, M.P.; Johnston, M.; Walker, A.E.; Grimshaw, J.M.; Foy, R.; Bonetti, D. Constructing Questionnaires Based on the Theory of Planned Behaviour: A Manual for Health Services Researchers; Centre for Health Services Research: Newcastle upon Tyne, UK, 2004. [Google Scholar]
  62. Oluka, O.C.; Nie, S.; Sun, Y. Quality assessment of TPB-based questionnaires: A systematic review. PLoS ONE 2014, 9, e94419. [Google Scholar] [CrossRef] [PubMed] [Green Version]
  63. Trochim, W.M.; Donnelly, J.P. Research Methods Knowledge Base; Atomic Dog Publishing: Cincinnati, OH, USA, 2001; Volume 2. [Google Scholar]
  64. Jann, B.; Long, J.S. Tabulating SPost results using estout and esttab. Stata J. 2010, 10, 46–60. [Google Scholar] [CrossRef] [Green Version]
  65. Iarossi, G. The Power of Survey Design A User’s Guide for Managing Surveys, Interpreting Results, and Influencing Respondents; The World Bank: Washington, DC, USA, 2006. [Google Scholar]
  66. McCambridge, J.; Witton, J.; Elbourne, D.R. Systematic review of the Hawthorne effect: New concepts are needed to study research participation effects. J. Clin. Epidemiol. 2014, 67, 267–277. [Google Scholar] [CrossRef] [Green Version]
  67. Dodou, D.; de Winter, J.C. Social desirability is the same in offline, online, and paper surveys: A meta-analysis. Comput. Hum. Behav. 2014, 36, 487–495. [Google Scholar] [CrossRef]
  68. Levitt, S.D.; List, J.A. Was there really a Hawthorne effect at the Hawthorne plant? An analysis of the original illumination experiments. Am. Econ. J. Appl. Econ. 2011, 3, 224–238. [Google Scholar] [CrossRef] [Green Version]
  69. Nederhof, A.J. Methods of coping with social desirability bias: A review. Eur. J. Soc. Psychol. 1985, 15, 263–280. [Google Scholar] [CrossRef]
  70. Albert, A.; Anderson, J.A. On the existence of maximum likelihood estimates in logistic regression models. Biometrika 1984, 71, 1–10. [Google Scholar] [CrossRef]
  71. Heinze, G.; Schemper, M. A solution to the problem of separation in logistic regression. Stat. Med. 2002, 21, 2409–2419. [Google Scholar] [CrossRef] [PubMed]
  72. Pakravan, M.H.; MacCarty, N.A. Design for clean technology adoption: Integration of usage context, user behavior, and technology performance in design. J. Mech. Des. 2020, 142, 1–10. [Google Scholar] [CrossRef]
  73. Pakravan, M.H.; MacCarty, N.A. An Agent-Based Model for Diffusion of Clean Technology Using the Theory of Planned Behavior. J. Mech. Des. 2020, in press. [Google Scholar]
Figure 1. Decision making theories in both health-related and environmental behaviors.
Energies 13 03021 g001
Figure 2. TPB framework and example survey questions
Energies 13 03021 g002
Table 1. TPB Constructs.
1. ATB Attitude Toward Behavior Outcome of an individual’s personal beliefs and his/her evaluations regarding validity of such beliefs.
2. SNSocial and Subjective Norms Outcome of an individual’s normative beliefs about a specific behavior, the extent to which people important to the person approve or disapprove the behavior, and personal evaluation of the social pressure for conforming to perceived normative beliefs.
3. PBCPerceived Behavioral ControlAn individual’s perception for the control s/he has over the behavior is a function of her control beliefs and the power s/he feels in such control beliefs.
Table 2. Demographic information of study’s samples.
HondurasUganda
Sample size (households)379175
Number of villages82
Affected population1765581
Number of children (under 17)684 (39% of affected population)204 (35% of affected population)
Main cook’s age distribution (years)Minimum: 15
Maximum: 94
Average: 37.4
Std. dev.: 14.5
Minimum: 15
Maximum: 75
Average: 36.16
Std. dev.: 15.32
Income average (per week)770 HNL
(~32 USD)
24,000 UGX
(~6.70 USD)
Education
(primary income earner)
No education 70%
Incomplete primary 30%
No education 10%
Incomplete primary 17%
complete primary 28%
Incomplete secondary 12%
Complete secondary 20%
College/university 11%
Table 3. Correlation among model constructs and descriptive statistics–Baseline, Honduras.
ATB1ATB2SN1SN2PBC1PBC2Intention
ATB 11.0
ATB 20.46 ***1.0
SN 10.11 **0.16 ***1.0
SN 20.11 **0.11 **0.12 **1.0
PBC 10.10 *0.12 **0.06−0.021.0
PBC 20.080.17 ***−0.01−0.10 *0.17 ***1.0
Intention0.16 ***0.12 **0.000.040.14 **0.15 ***1.0
Mean3.543.483.333.522.723.053.81
Standard Deviation0.4980.501.0680.501.0961.4880.415
* p-value < 0.10, ** p-value < 0.05, *** p-value < 0.01.
Table 4. Correlation among model constructs and descriptive statistics–Follow-up, Honduras.
ATB1ATB2SN1SN2PBC1Intention
ATB 11.0
ATB 20.35 ***1.0
SN 10.14 ***−0.051.0
SN 20.14 **−0.13 **0.14 **1.0
PBC 10.030.11 **0.02−0.09 *1.0
Intention−0.13 **−0.070.06−0.020.041.0
Mean4.744.774.474.264.892.66
Standard Deviation0.4570.4400.8281.1380.5510.600
* p-value < 0.10, ** p-value < 0.05, *** p-value < 0.01.
Table 5. TPB Models from Honduras.
Baseline
Model I
Baseline
Model II
Baseline
Model III
Follow-Up Model IFollow-Up
Model II
Dependent VariableWill you cook your principal meals mainly with (ICS brand)?How many meals do you cook each day with the (ICS brand)?
Independent Variable
ATB 1: Fuelwood consumption −0.3587
(0.2997)
−0.2982
(0.3351)
ATB 2: Smoke emission0.6143 *
(0.6633)
0.6305
(0.7230)
0.7361 *
(0.8713)
−0.7594 **
(0.3658)
−0.8395 **
(0.3285)
SN 1: Support of friends and family−0.1009
(0.3222)
−0.0209
(0.1786)
SN 2: Importance of opinion of friends and family −0.0279
(0.1998)
0.0154
(0.1980)
−0.1325
(0.1267)
−0.1599
(0.1252)
PBC 1: Obtaining permission or not 0.3449 ***
(0.1621)
0.3811 ***
(0.1758)
0.0178
(0.2112)
0.0855
(0.2112)
PBC 2: Feasibility of changing habits0.2565 *
(0.1781)
0.2751 *
(0.2081)
0.2836 *
(0.2093)
N255239237297309
Wald Chi-squared 6.47 *18.28 ***19.50 ***7.347.66 *
AIC223.5205.7202.2434.4456.5
BIC237.7223.0223.0464.0478.9
Log pseudo likelihood−107.8−97.83−95.11−209.2−222.3
Results are in log odds. * p-value < 0.10, ** p-value < 0.05, *** p-value < 0.01. Robust standard errors are in parenthesis.
Table 6. Correlation among model constructs and descriptive statistics–Baseline, Uganda.
ATB1ATB2SN1SN2PBC1PBC2Intention
ATB 11.0
ATB 20.29 ***1.0
SN 10.14 *0.15 **1.0
SN 2−0.060.12 *0.18 **1.0
PBC 1−0.090.12 *0.19 ***0.21 ***1.0
PBC 20.020.12 *0.26 ***0.13 *0.41 ***1.0
Intention 10.19 **0.38 ***0.25 ***0.28 ***0.45 ***0.071.0
Intention 2−0.030.16 **0.20 ***0.15 **0.18 **0.23 ***0.32 ***
Mean3.533.563.602.823.123.073.37
Standard Deviation0.6770.6020.9130.9871.4431.1680.988
* p-value < 0.10, ** p-value < 0.05, *** p-value < 0.01.
Table 7. Correlation among model constructs and descriptive statistics–Follow-up, Uganda.
ATB1ATB2SN1SN2SN3PBC1PBC2PBC3Int.1Int.2
ATB11.0
ATB20.36 ***1.0
SN10.24 **0.18 *1.0
SN2−0.02−0.060.27 **1.0
SN30.20 *0.070.19 *0.32 ***1.0
PBC1−0.03−0.03−0.07−0.070.021.0
PBC20.32 ***0.19 *0.13−0.020.080.41 ***1.0
PBC30.22 **0.22 **0.19 *0.000.17−0.080.121.0
Int.10.33 ***0.28 ***−0.06−0.160.21 **0.060.35 ***0.24 **1.0
Int.20.20*0.040.00−0.140.27 ***0.000.080.32 ***0.44 ***1.0
Mean3.633.443.762.513.233.623.383.193.413.53
Standard Deviation0.5930.5670.5011.5540.8350.8300.6740.9990.8600.501
* p-value < 0.10, ** p-value < 0.05, *** p-value < 0.01.
Table 8. TPB models from Uganda.
Uganda–BaselineBaseline
Model I i
Baseline
Model II ii
Follow-Up
Model I ii
Follow-Up
Model II ii
Dependent VariableHow many meals do you think you will cook with the improved cookstove during each week?Now that you have experienced (ICS brand) how likely is it that you cook all your main meals with that?How often do you think you will use (ICS brand) in next few months to cook your main meals?
Independent Variable
ATB 1: Fuelwood consumption0.5541 **
(0.4580)
1.1833
(0.2765)
1.3361
(0.6185)
2.6782 **
(1.2842)
ATB 2: Smoke emission1.1043 *** (1.0895)3.2772 *** (1.2047)1.1565
(0.5150)
2.1335 *
(0.9730)
SN 1: Support of friends and family0.2708
(0.2512)
1.4703 ** (0.2803) 0.4525
(0.2513)
SN 2: Importance of opinion of friends and family0.4237 **
(0.2734)
0.5373 *
(0.1786)
0.6441
(0.2007)
SN 3: Importance of neighbors’ stove types 1.3852 **
(0.2236)
PBC 1: Obtaining permission or not0.6833 *** (0.2579) 0.7950
(0.2578)
PBC 2: Power to make decision independently0.4619 **
(0.1140)
0.8986
(0.1341)
2.5113 ***
(0.8898)
PBC 3: Change of habit 2.7253 *** (0.7831)
N1721728783
Wald chi-squared 61.01 ***24.94 ***25.19 ***17.98 ***
AIC309.5343.6190.3103.9
BIC340.9368.7212.5120.8
Log pseudo likelihood−144.7−163.8−86.17−44.95
i Results are in log odds. ii Results are reported in odds-ratios. * p-value < 0.10, ** p-value < 0.05, *** p-value < 0.01. Robust standard errors are in parenthesis.

