Article

A Thermal Investigation and Optimization of an Air-Cooled Lithium-Ion Battery Pack

1
Key Laboratory of Intelligent Manufacturing, Ministry of Education, Shantou University, Shantou 515063, China
2
College of Mechanical Engineering, Hunan University of Humanities, Science and Technology, Loudi 417000, China
3
State Key Lab of Digital Manufacturing Equipment & Technology, School of Mechanical Science and Engineering, Huazhong University of Science and Technology, Wuhan 430074, China
*
Author to whom correspondence should be addressed.
Energies 2020, 13(11), 2956; https://doi.org/10.3390/en13112956
Submission received: 6 May 2020 / Revised: 3 June 2020 / Accepted: 5 June 2020 / Published: 9 June 2020

Abstract

:
An effective battery thermal management system (BTMS) is essential to ensure that the battery pack operates within the normal temperature range, especially for multi-cell batteries. This paper studied the optimal configuration of an air-cooling (AC) system for a cylindrical battery pack. The thermal parameters of the single battery were measured experimentally. The heat dissipation performance of a single battery was analyzed and compared with the simulation results. The experimental and simulation results were in good agreement, which proves the validity of the computational fluid dynamics (CFD) model. Various schemes with different battery arrangements, different positions of the inlet and outlet of the cooling system and the number of inlets and outlets were compared. The results showed that an arrangement that uses a small length-width ratio is more conducive to promoting the performance of the cooling system. The inlet and outlet configuration of the cooling system, which facilitates fluid flow over most of the battery pack over shorter distances is more beneficial to battery thermal management. The configuration of a large number of inlets and outlets can facilitate more flexible adjustment of the fluid flow state and can slow down battery heating to a greater extent.

1. Introduction

The performance of the lithium-ion battery (LIB) is at the core of the driving system of an electric vehicle, and thus it significantly affects the driving range and service life of electric vehicles [1,2]. Among the many factors that determine battery performance, the influence of temperature on the battery should not be underestimated [3]. Battery heating is an inevitable phenomenon and a complicated problem [4]. Reasonable control of temperature changes in battery operation depends on an efficient battery thermal management system (BTMS) [5,6]. Essentially, batteries work to convert chemical energy into electrical energy for the machine to use, so the heat generated is waste energy, which reduces the energy conversion efficiency of the battery. A certain amount of heat yield is beneficial to ensure the normal chemical reaction temperature of the battery and promote the charging and discharging process of the battery. However, if an abnormal amount of heat is generated or the heat does not dissipate in time, the battery suffers overheating, which may potentially cause the active material on the electrodes to peel off and promote electrolyte degradation, that is, cause harm to the battery itself [7,8,9]. These changes are irreversible and can cause permanent damage to the battery. In addition, because the battery is hot, there are safety risks. An overheated battery can short-circuit due to damage to the internal materials, such as the diaphragm, which sets off a chain reaction that can lead to a fire or even an explosion [10]. Without effective control and management, the harmful effects of a single battery can spread throughout the entire battery pack, and thermal runaway will be amplified, causing the battery pack to be out of control. Therefore, it is very necessary for electric vehicles to design a practical and efficient BTMS [11]. Excellent thermal management benefits the performance of the battery pack [12].
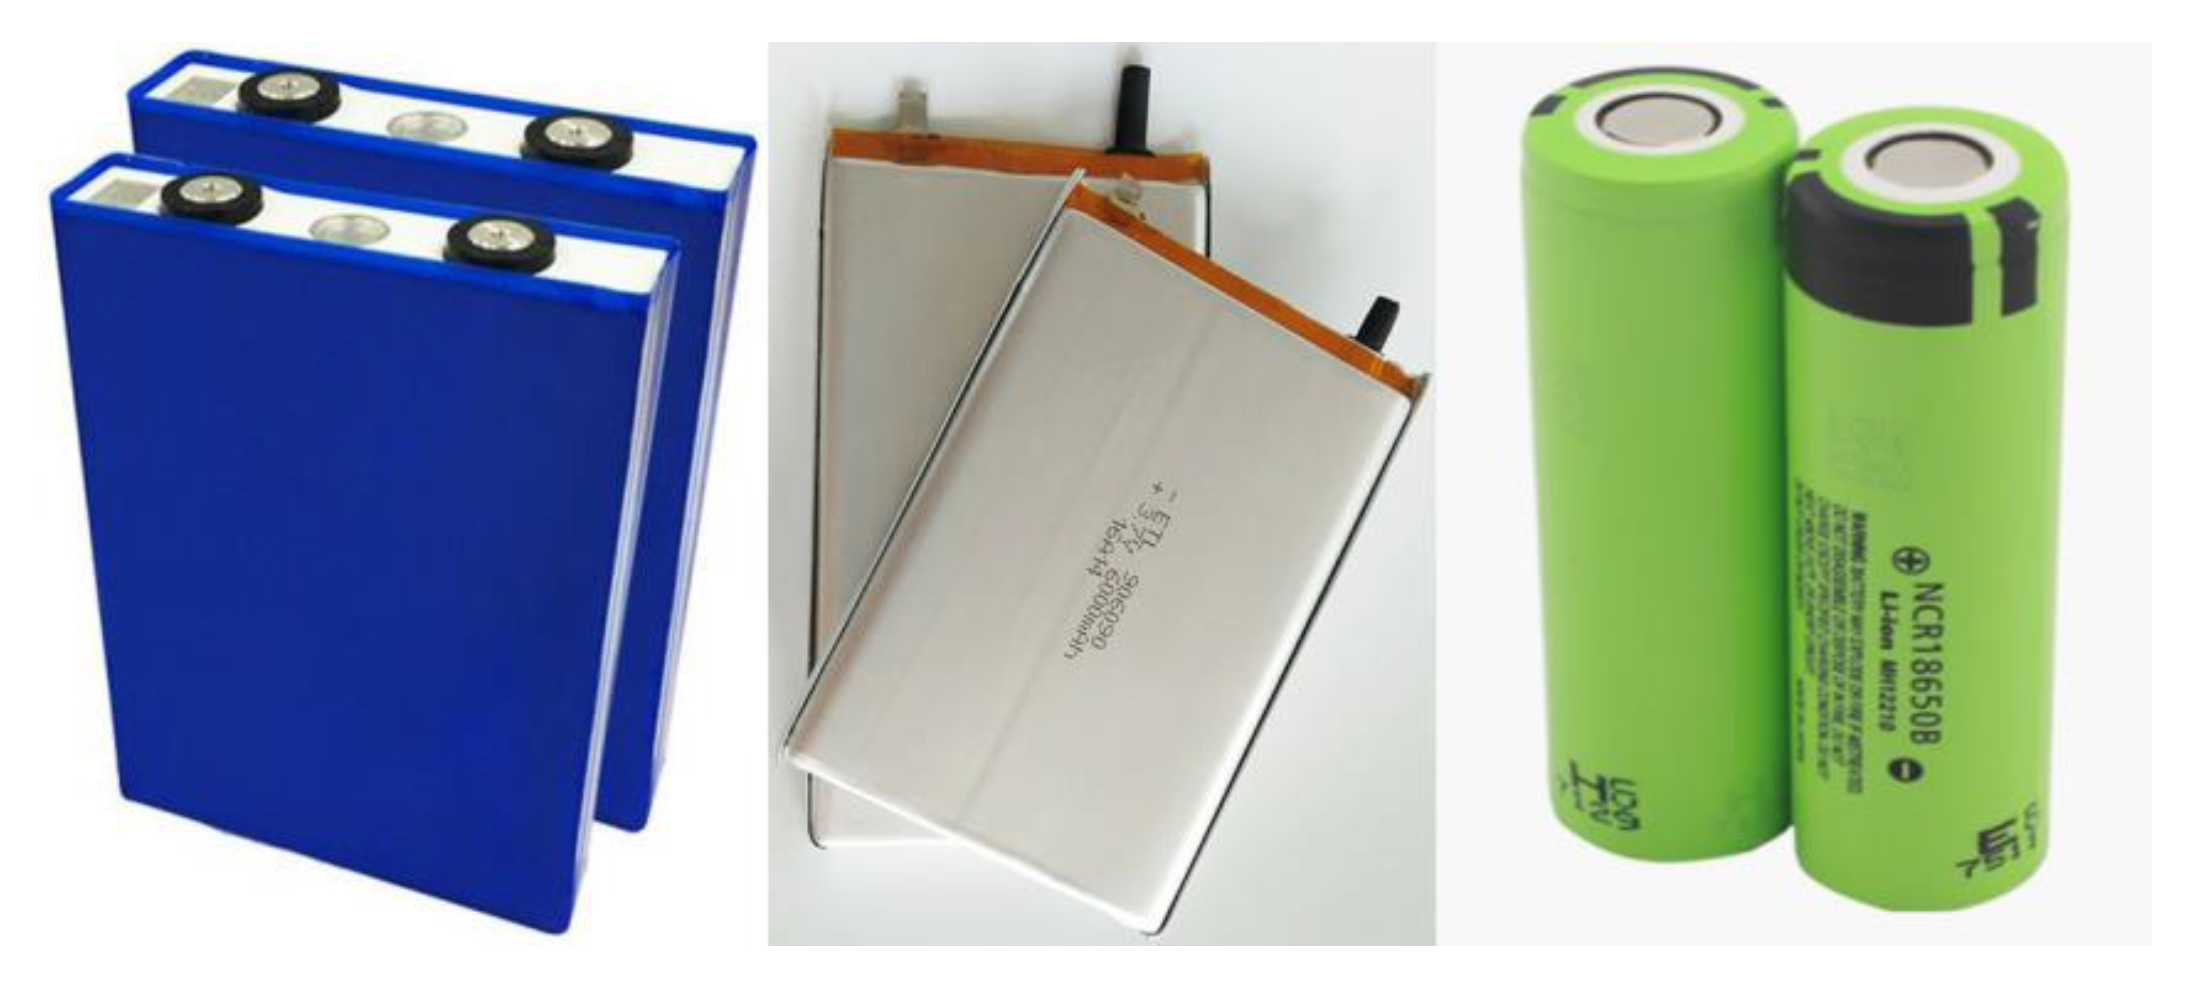
There are three main types of LIBs used in electric vehicles (EVs): (1) prismatic; (2) pouch; and (3) cylindrical batteries. Figure 1 shows these three types of batteries. The prismatic battery can be designed according to the needs of customers. This makes the prismatic battery suitable for almost all kinds of electric cars. This high adaptability also results in prismatic batteries that vary in size, nominal voltage, and other parameters, which makes it difficult to form an industry standard. Pouch batteries are manufactured and packed by superposition. Compared with prismatic batteries, the aluminum alloy shell of the pouch battery pack is replaced with a lighter aluminum plastic film package, which improves the energy density of the whole battery pack. However, a big drawback of soft-pack batteries is their poor consistency, which means they need more sophisticated control and monitoring systems. After years of development, the cylindrical battery has obtained a high degree of standardization, which makes it easy to achieve a unified industry standard. In addition, the cylindrical battery has inherent advantages in regard to heat dissipation, and a good heat dissipation space is formed between the cylinders when packing.
Among these types of battery, the cylindrical battery is the most discussed and well-studied and it is the first mass-produced commercial battery., Thus, much of the research has focused on cylindrical batteries. Most of the studies are based on three different ways of heat dissipation: AC, liquid-cooling (LC), and phase-change material (PCM) cooling. Wang detailed the three cooling methods in his research [13]. AC is widely used for its simplicity, low cost and there is no hidden danger of battery damage. Wang verified the effectiveness of forced-air cooling in ensuring the battery pack operates within the normal temperature range (no more than 40 °C) when the discharge of the current rate of a single battery is set at no more than 3C. Similarly, based on the AC method, Mahamud et al. [14] studied the influence of reciprocating airflow in the BTMS of cylindrical battery packs. This method reduced the battery temperature by about 4 °C (72%) and the maximum temperature (MaxT) by about 1.5 °C. LC is a cooling method that uses a liquid material with a large specific heat capacity (SHC), such as water, to flow through the surface of the battery and take away the generated heat. This method requires the battery system to be highly sealed, but its strong heat transfer capacity leads to a better cooling effect than that of AC [15]. Wang et al. [16] proved that several factors, such as fluid flow, flow direction, etc. determine the cooling effect at a certain degree. They designed a BTMS based on a hot silicon plate and used experiments and simulations to explore and verify the significant influence of liquid flow, flow direction and the number of cooling channels on the cooling capacity of the BTMS. PCM cooling, which uses the process of absorbing heat during the phase change to balance the heat that the battery generates, is costly but offers a pollution-free, high-return solution. By comparing cooling performance under different conditions, Kizilel et al. [17] proved that the PCM cooling method is superior to AC in regard to economy, effectiveness, and safety. Through simulation and experiment, Huang et al. [18] proved that the cooling system of thermal-assisted expanded graphite is superior to the AC system in actual and extreme conditions. In addition, Wang [19] and Wang [20] greatly improved the performance of the cooling system without changing the cooling mode, by optimizing the battery pack structure. Yang et al. [21] found the specific parameters of the battery pack through optimization analysis. They pointed out that the cooling system works best when the height of the battery pack is 34 mm and the width is 32 mm.
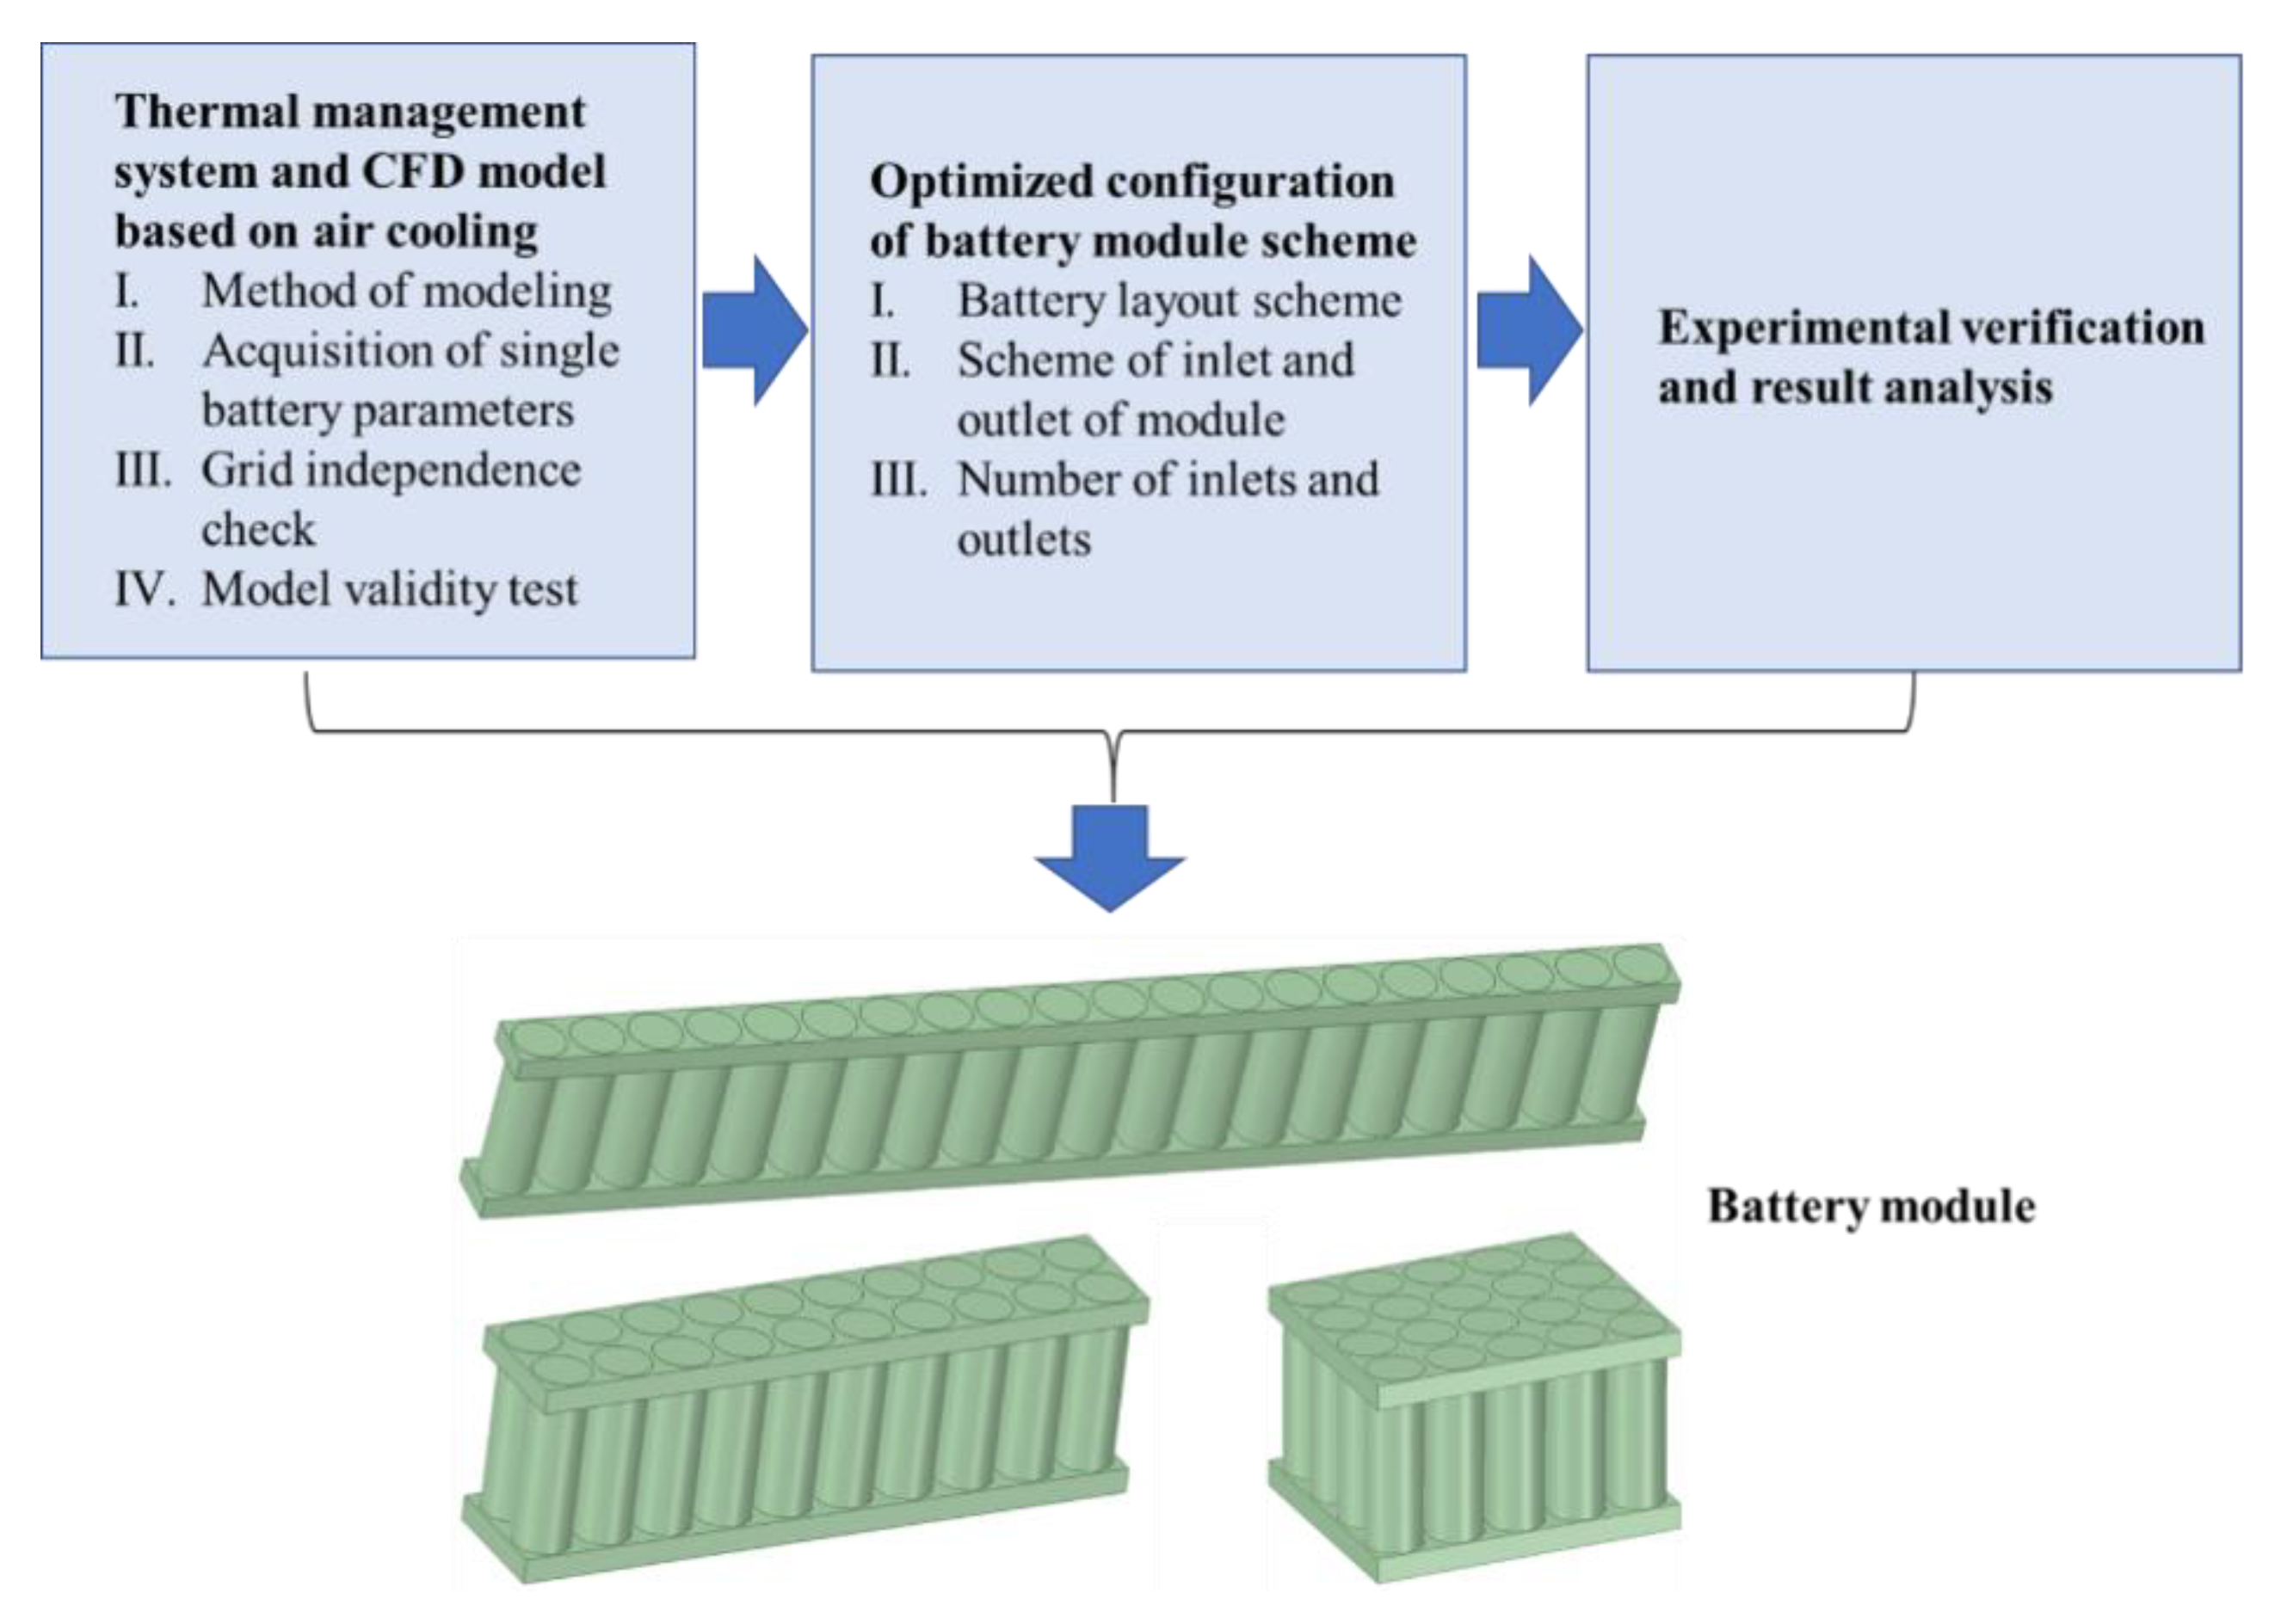
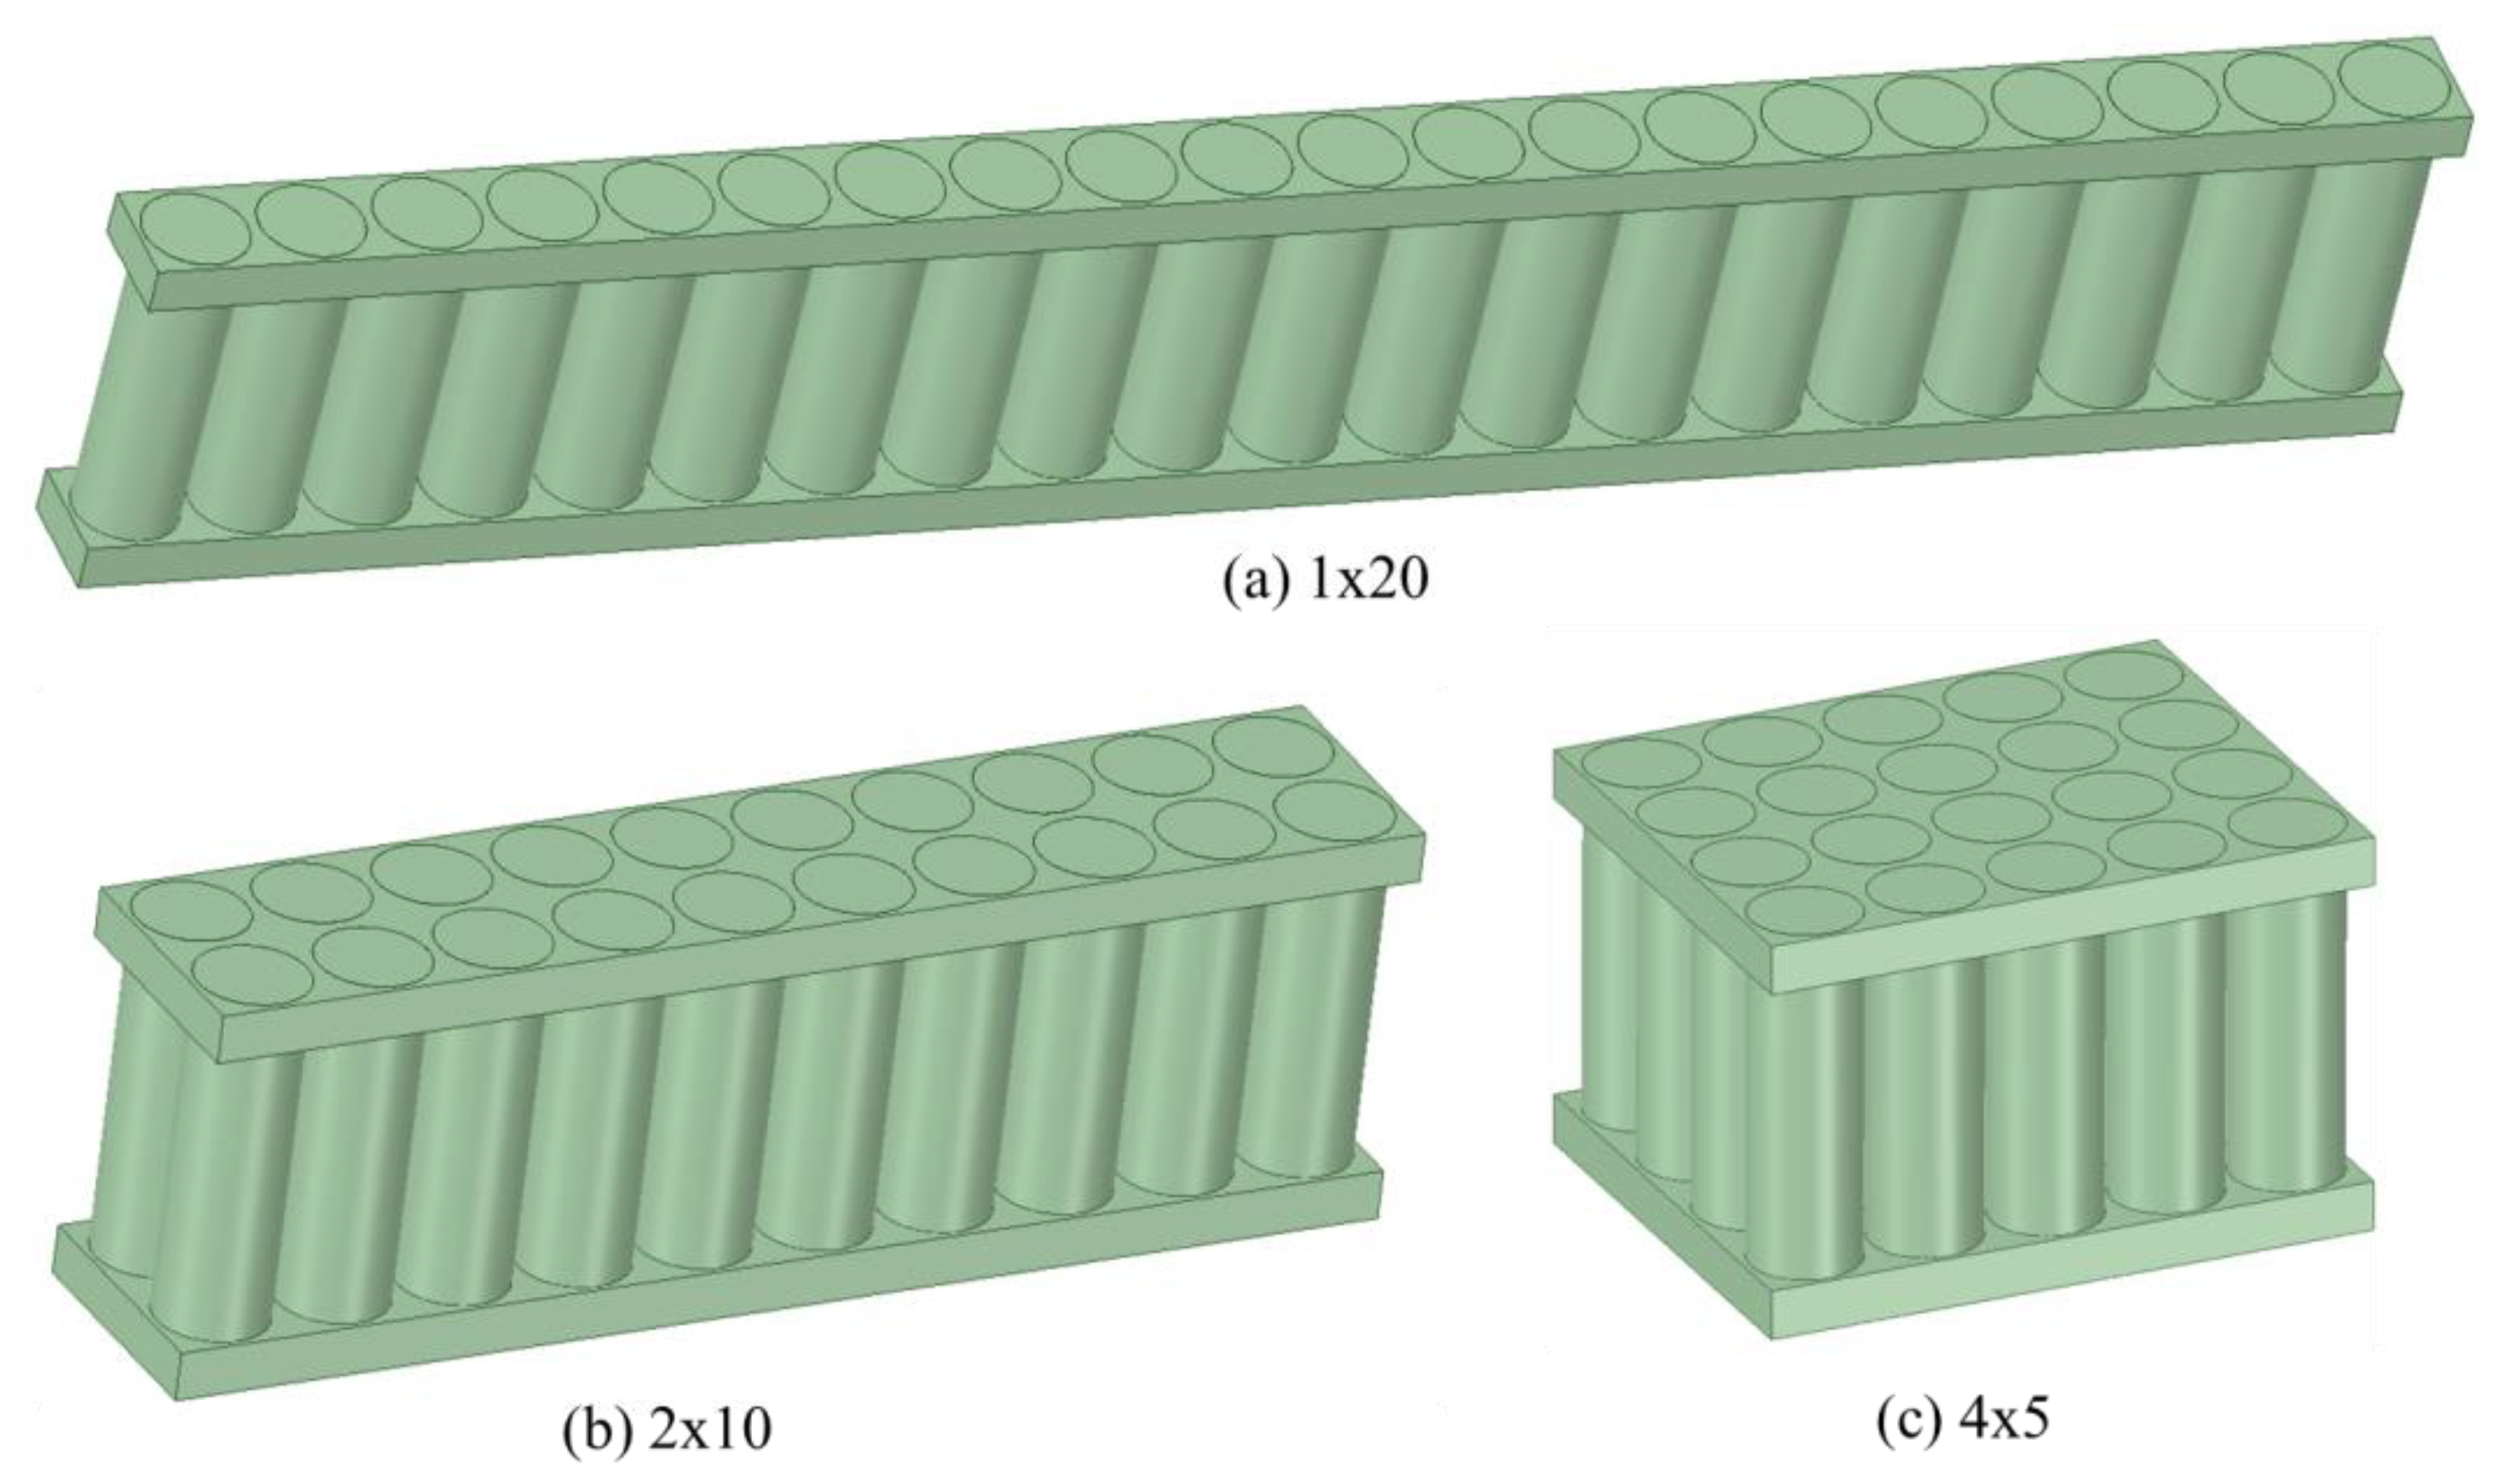
In this study, a cylindrical BTMS based on AC is proposed. The battery pack consists of 20 cylindrical battery modules of type 18650 batteries. First, the dynamic model was built and the validity of the model was verified. Then, the BTMS of the cylindrical battery pack was optimized for the comparative analysis of different battery configurations with different cell layouts, different positions of the air inlet and outlet in the AC system and the number of inlets and outlets. Finally, the accuracy and effectiveness of the whole process were verified experimentally, which provided an ideal design for the BTMS of the cylindrical battery in the future.

2. Problem Description

The single 18650 LIB used in this paper has a voltage of 3.6–4.2 V and a capacity of 2600 mAh. The main aim of this study is to reduce the MaxT and temperature standard deviation (TSD) of the battery during operation by optimizing the configuration of the BTMS for the battery module, which is composed of 20 cells. For a multi-cell module, the design of the BTMS must cover many aspects. The layout of the battery, the positioning scheme of the inlets and outlets, the number of inlet and outlet as well as the structural size of the battery module all affect the final cooling effect of a BTMS. First, the layout plan of the battery pack was analyzed and designed, then the optimal inlet and outlet position was designed based on the optimized layout plan. Then the influence of the number of inlet and outlet on the thermal performance of the battery was explored by increasing the number of inlets and outlets. Finally, the optimized configuration was determined. Details of the research method and technical route are shown in Figure 2. The specific steps to solve this multi-objective coupling problem are as follows:
(1)
Thermal management system and CFD.
(2)
Optimized configuration of the battery pack scheme.
(3)
Experimental validation and result analysis.

3. Heat Dissipation Model of Computational Fluid Dynamics

There are four main sources of heat production in working batteries, namely, reaction heat (RH), side reaction heat (SRH), joule heat (JH) and polarization heat (PH). The total calculation of the heat generation is shown in Equation (1).
P total = P re + P sr + P jo + P po
where P total represents the power of the total heat, P re represents the power of RH, P se represents the power of SRH, P jo represents the power of JH, and P po represents the power of PH.
RH refers to the heat generated by the chemical reaction in the electrodes in charging and discharging. Generally, the charging process of LIB absorbs energy to reduce ambient temperature and in reverse, its discharging process releases heat [22]. This results in a side reaction, that is, heat is generated by a series of chemical reactions other than the main chemical reaction, such as the partial decomposition of electrolyte at high temperature and self-discharge caused by the change in electrode material structure. These side reactions are intensified in the period before the battery fails. However, during the life of the battery, the side reactions are so weak that the heat of the side reaction is usually ignored. JH is the work done by the current on the internal resistance (IR). This part of the heat can be calculated by Joule’s law as shown in Equation (2):
P jo = I 2 R Ω
where R Ω is IR, and I refers to the current on R Ω .
PH refers to the heat generated when the positive and negative electrode potential deviates from the equilibrium potential. When polarization occurs, the voltage difference between the battery’s open circuit voltage and the terminal voltage generate PH. Generally, it is assumed that there is a polarization IR R p , and the heating power is calculated by Joule’s law, as shown in Equation (3),
P po = I 2 R p

3.1. Acquisition of Battery’s Thermodynamic Parameters

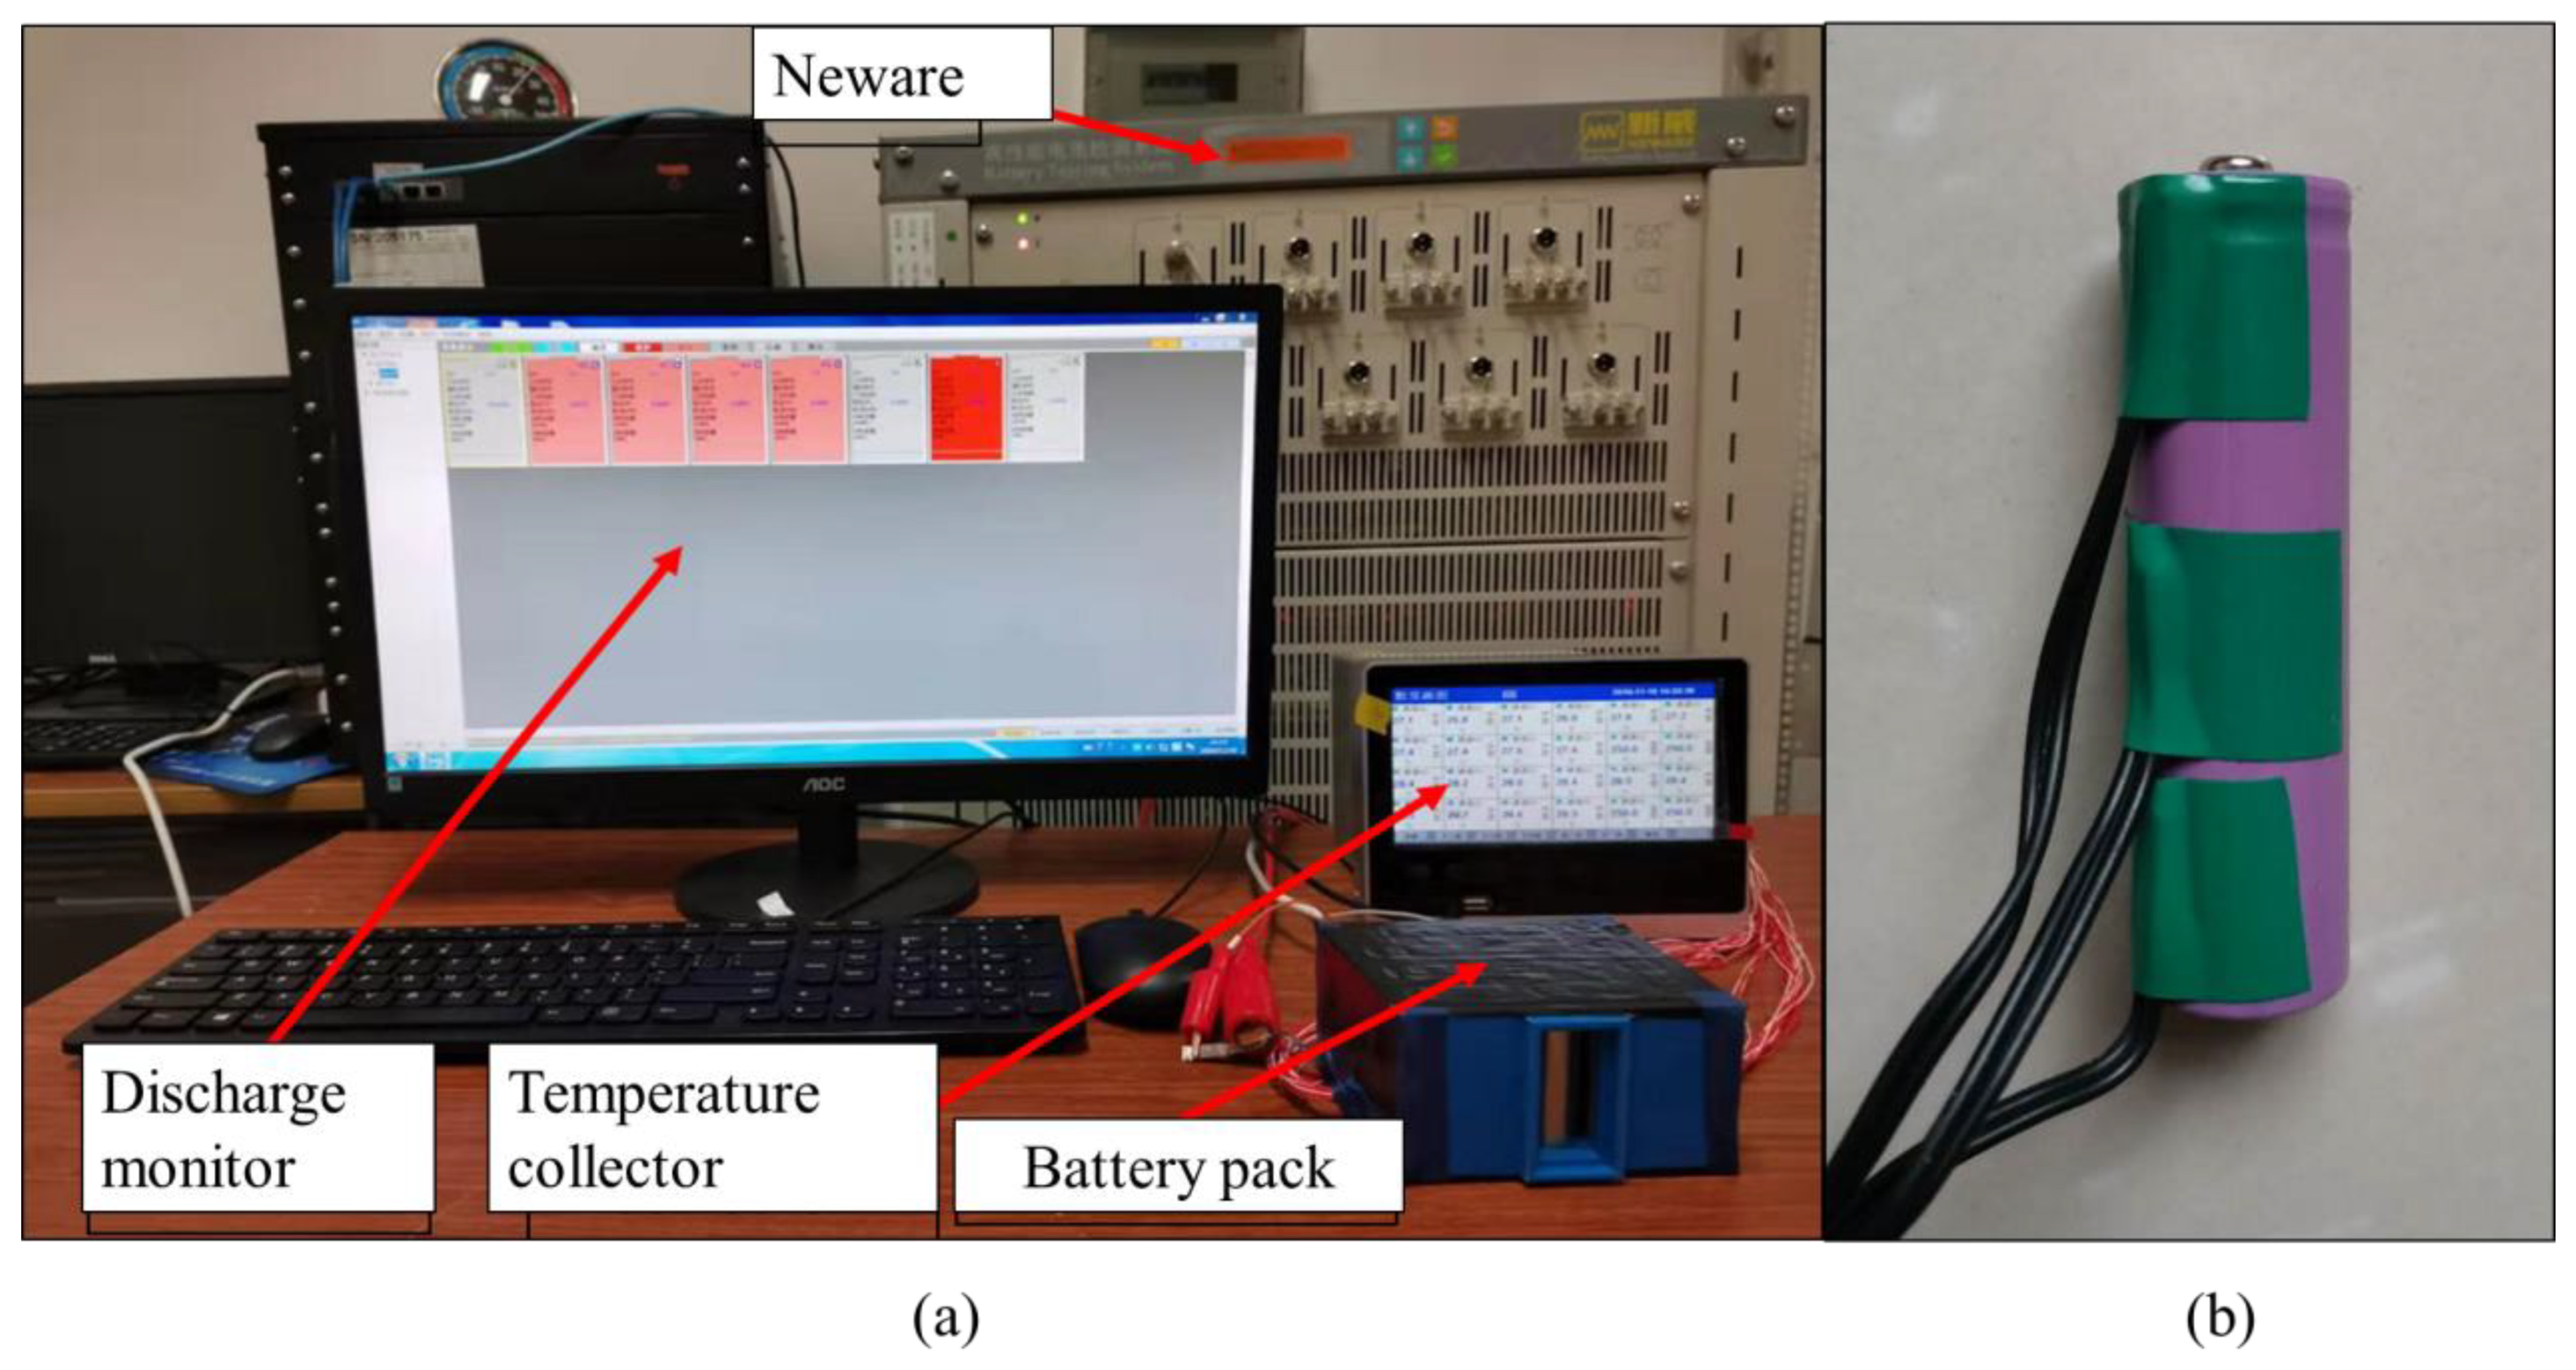
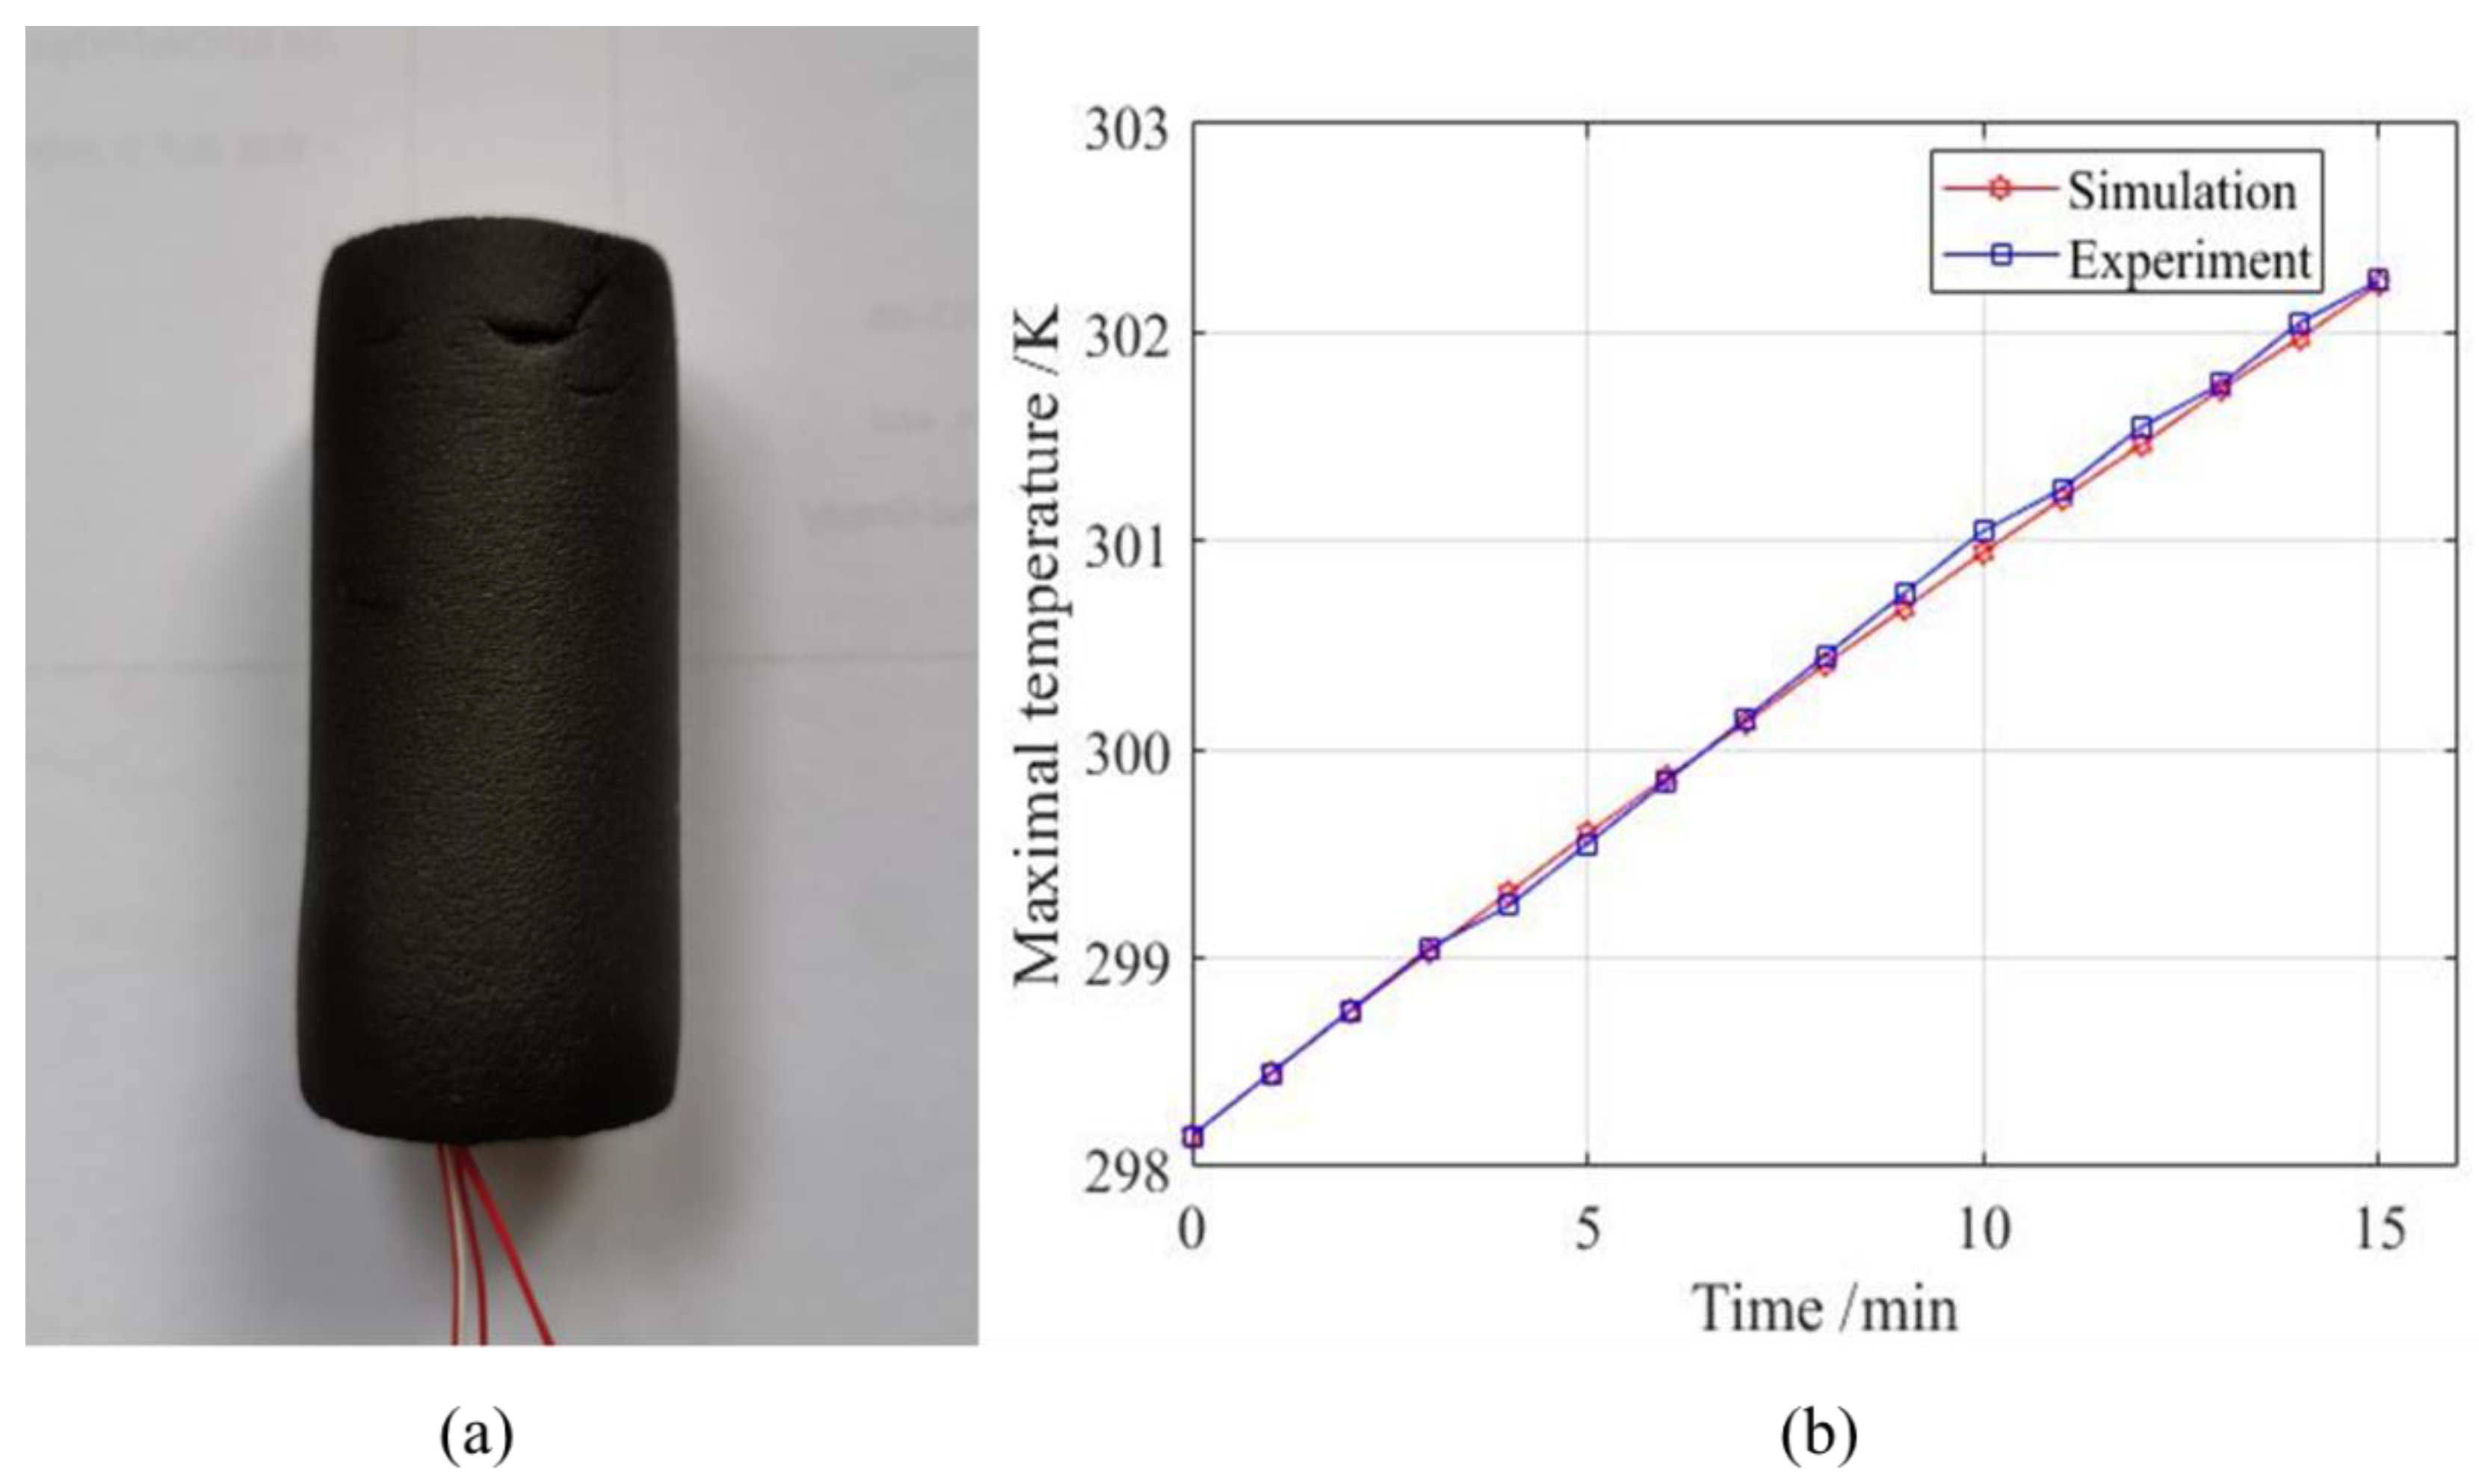
Before the heat dissipation model is built, the battery parameters need to be determined. These parameters include the IR, SHC, heat yield and thermal conductivity (TC) of the single battery. In order to obtain these parameters, it is necessary to conduct charge and discharge experiments on a single battery. The equipment generates cycles of charge and discharge, and the measurement of the parameters of current, voltage and temperature. The Arbin machine battery testing system was adopted, which can charge/discharge batteries at a set constant current or voltage value and record the respective current, voltage, capacity, and impedance per minute simultaneously. Besides the Arbin machine, several temperature sensors and a miniature blower were needed. The equipment is shown in Figure 3a and each battery is equipped with three temperature sensors, as shown in Figure 3b. For determining the measurement error, every single cell is installed with three temperature sensors that are attached at the cathode, middle and anode of the cell. The temperature utilized in this study is the average value.

3.1.1. Internal DC Resistance

The battery resistance refers to the direct current (DC) resistance of the battery, which consists of the static resistance and polarization resistance. The hybrid pulse power characterization test (HPPC) method was used to measure the DC resistance of the battery. The HPPC method is designed to test the resistance of the battery under specific temperatures and state of charge (SOC).

3.1.2. Specific Heat Capacity

The type 18650 battery is not homogeneous, so, the SHC C M refers to the equivalent SHC of a single battery. Assuming that the equivalent SHC of the battery is C M , according to the definition of SHC, it is described by Equation (4):
d ϕ d t = C M M d T d t
It is known that the value of the heat generated (i.e., temperature rise) by the battery is directly proportional to the equivalent SHC of the battery. In fact, the SHC is computed by the law of conservation of energy (COE). In an adiabatic environment, the value of the heat generation of a battery equals its stored heat. The accumulation of heat storage will lead to the rise in battery temperature. By measuring the temperature rise in a specific period time, the SHC of the battery can be calculated according to the above formula. In the actual experiment, in order to reduce the experimental error, the SHC of the battery under different discharge ratios (i.e., different value of heat generation) was measured and the SHC of the battery was calculated by linear regression. The experimental procedures have been described in detail in [23].

3.1.3. Heat Generation of Single-Cell and Thermal Conductivity

On this basis, Bernardi et al. (1984) provided a methodology to calculate the heat production rate of batteries, which is expressed by Equation (5).
P total = I T d E d T + I ( E U )
where P is the power of the heat generation, I is current in circuit, T is the real-time temperature of the battery, E refers to the open circuit voltage of battery, and U refers to the average terminal voltage of battery.
In Equation (5), the first item I T d E d T on the right side of equation is the formula to calculate the power of RH, which equals the P total in Equation (1). The second item refers to summary of JH and PH and it shows the voltage attribution. The voltage drops ( E U ) in the open circuit voltage and terminal voltage are attributed to internal DC resistance and their relationship is represented by Equation (6).
I ( E U ) = I 2 ( R Ω + R P )
  R Ω + R P make up the internal DC resistance, which can be expressed by R . So, the heat production Equation (5) can be expressed by Equation (7),
P total = I T d E d T + I 2 R
On the premise that the equivalent SHC is known (calculated in Section 3.1.2), the heat production in a certain period of time can be solved according to the definition of the SHC [23]. In this experiment, the heat dissipation effect of the battery within 15 min is discussed, so the heat generation of the battery should also be the heat generation within 15 min. The discharging current rate is set at 2C. Twenty single batteries were selected for heat yield measurement. The specific operational steps are as follows:
  • Take 20 type 18650 batteries and fully discharge them, and then hold them for 30 min at room temperature before charging them at 0.75C.
  • Record the current, voltage, temperature and corresponding time value.
For each cell, the temperatures were recorded. During battery discharge, oxidation occurs in the negative electrode, and lithium is separated from the carbon rod and releases energy, which causes the temperature of the negative electrode to rise. At the same time, there is a reduction at the positive pole. Lithium ions precipitate at the positive electrode and absorb a certain amount of energy, so the temperature of the positive pole decreases. Therefore, during the whole discharge process, the temperature gradually decreases from the negative electrode to the positive electrode. Thus, it is assumed that the temperature of the positive pole is transferred from the negative electrode and the equivalent TC of the whole battery is calculated based on the battery temperature distribution. The formula to calculate TC is illustrated in Equation (8):
λ = q δ Δ t
where λ is TC, q is conducted heat, and δ is the distance from the negative pole to the positive pole. Δ t refers to the temperature difference (TD) between the two poles. In fact, the conductivity of the battery is anisotropic, which means the TC is different in the surface and the thickness directions. However, the TC in the surface direction is much less than that in the thickness direction and it is ignored in this model [23,24].
In order to avoid contingency and remove outliers, 20 type 18650 batteries were tested under the same conditions. After calculating the average value of the 20 batteries, the thermodynamic parameters are listed in Table 1.

3.2. Modeling Method

A three-dimensional model was built in SpaceClaim18.2. The meshing operation and numerical simulation were processed in ansys18.2. In order not to consider the energy consumption too much, the fluid inlet speed is set to 1 m/s and it is maintained by a fan in all designs. This is the typical forced convection mode. The method of forced convection improves the heat dissipation effect by increasing the heat transfer rate per unit time. Compared with natural convection, it consumes more energy but performs very well with respect to thermal management. The Reynolds number can be calculated by Equation (9). In these models, the distance between the battery and the wall is 10 mm. The gap in the battery center is 20 mm. The fluid cross section with the largest characteristic length exists in a rectangular plane of 2 × 490 mm. The max Reynolds number here is 406, which determines the laminar flow type in the simulation.
Re = ρ υ d μ
where ρ and μ are fluid density and dynamic viscosity coefficient, and υ , d are the characteristic velocities and characteristic length of the flow field.
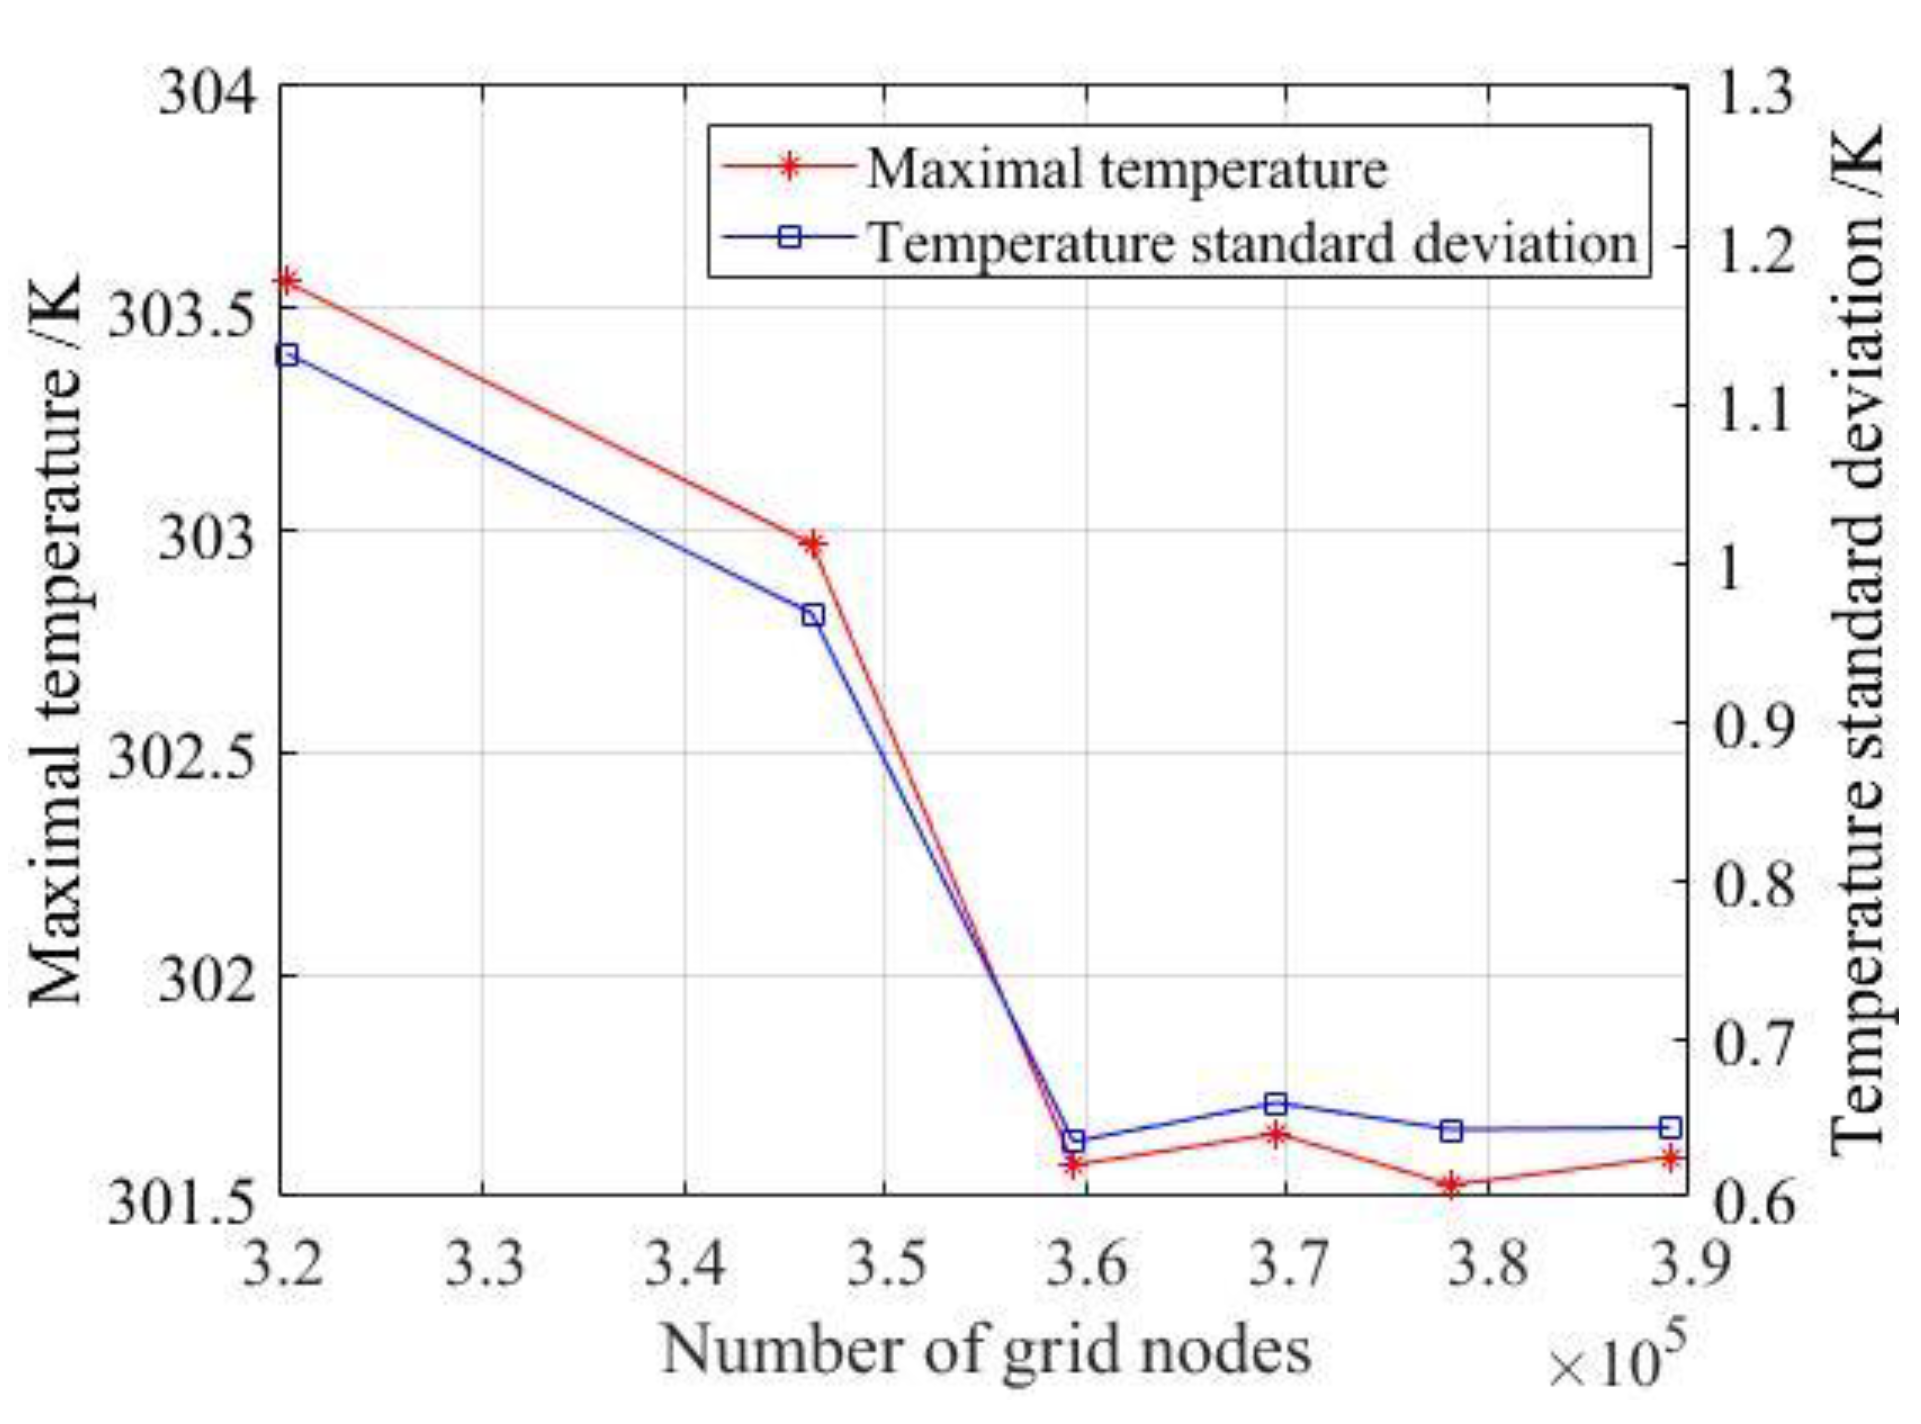
The results of the grid independence test are shown in Figure 4, which ensure that the subsequent simulation process is reliable. In Figure 4, once the number of grids reaches 359,370–389,048, the MaxT of the model remains constant, that is, when the number of grids is more than 359,370, the size of the nodes will not affect the calculation results and the grid will pass the independence test. In order to save computing costs, the number of grids is selected as 359,370.
To simulate the flow model in ANSYS and compare the results, some assumptions need to made, including:
  • Steady-state flow from the inlet
  • Constant thermal and physical properties
  • No energy within flow
  • Heat loss of radiation and natural convection is neglected
  • Gravity is not taken into consideration.
In the process of battery heat generation, the energy of the battery conforms to the law of COE [25,26], that is, it satisfies Equation (10),
ρ C p T t = x d ( k x d T x d ) + y d ( k y d T y d ) + z d ( k z d T z d ) + Q v
where ρ refers to density of battery; C p is equivalent to SHC; T refers to the battery temperature; k x d , k y d , and k z d represent the heat conductivity coefficient (HCC) in the x, y, and z directions, respectively; and Q v is a volumetric heat source of battery, which is the same as the heat generation rate.
The energy conservation equation (ECE) for coolant [8] is expressed by Equation (11):
ρ c o T c o t + ( ρ c o ν T c o ) = ( k c o C c o T c o )
The coolant in this study is air, so the variable ρ c o refers to the density of air; C c o and k c o are the SHC and TC of the air, respectively.
The velocity of air is about 1 m/s whose Mach number is far less than 0.3. So, the continuous equation of coolant (which here refers to air) is as shown in Equation (12)
ν = 0
where ν is the velocity vector.
The momentum conservation equation (MCE) is shown in Equation (13).
ρ co d ν d t = P + μ 2 ν
where P and μ are the static pressure and dynamic viscosity of the air, respectively.

3.3. Model Validity Test

To ensure that the model has practical value, it is necessary to test the validity of the model. A validity test involved a pre-experiment and a pre-experimental simulation and then the results are compared to show whether the model is effective and can be used for further study. A single battery was selected for testing and it was covered by a piece of insulated cotton. The covered single battery used to simulate adiabatic condition is shown in Figure 5a. Then, the battery was continuously discharged to collect the temperature change data for the battery during discharge. The result is shown in Figure 5b. The temperature measured by the experiment was almost the same as that measured by the simulation.

4. Analysis of the Results

The temperatures based on the battery layout, the inlet and outlet position, and the number of inlets and outlets of the module are considered. An AC system was adopted as the cooling method due to its simplicity and low cost. The forced air speed was set at 1 m/s. and a blower provides the forced air that flows into the battery pack. The accurate measurement of the anemometer ensures that the wind speed of the battery pack inlet is constant at the desired value. The blower and anemometer used in this study are shown in Figure 6. The discharge time was 15 min. Temperature was recorded at the end of each minute. The initial distance between the battery center and the wall is 20 mm, and the shortest distance between the battery center and the wall is 10 mm. Battery material parameters are shown in Table 1.

4.1. Battery Layout Analysis

The battery pack contains 20 type 18650 batteries. There are three possible layout configurations for a rectangular layout: 1 × 20, 2 × 10 and 4 × 5. The layouts are shown in Figure 7. To choose the best scheme, the three schemes need to be simulated and predicted.
To fully compare the advantages and disadvantages of these three configurations and select the best battery configuration, a single variable control method was used to make a comparative analysis of the schemes. For each arrangement, there is an air inlet and an air outlet equal in size to a rectangle of 20 × 49 mm. The module is cooled with constant wind speed in both the transverse (h) and longitudinal (v) directions. The six temperature distributions of the three battery configurations are shown in Figure 8. During the 15-min discharge, the MaxT variation of the layout schemes at the end of each minute is shown in Figure 9.
In Figure 8, it can be seen that the low-temperature area appears at the entrance and the high-temperature area is distributed at the exit. This is in line with the actual situation, because the air temperature entering the inlet is room temperature (298.15 k). When the air flows through the battery surface, which has a higher temperature, it will absorb the heat of the battery leading to a gradual increase in the temperature of air from the inlet to the outlet. Additionally, the longer the air travels through the cooling system, the hotter it gets. As seen in Figure 9, the cooling effect of the 4 × 5 battery arrangement is better in both directions than the other two arrangements. Therefore, the battery layout configuration of 4 × 5 was selected as the battery layout.

4.2. Inlet and Outlet Position

As mentioned above, the optimal battery layout configuration is a 4 × 5 scheme. The four sides of the battery pack can be set as an air inlet and air outlet. With each side divided into left, center and right parts, all 12 parts can be used as inlet or outlet, as shown in Figure 10.
According to symmetry, the duplicate and inferior schemes were removed, leaving 18 schemes to choose from. These 18 schemes are shown in Figure 11.
The MaxT change curve and TSD change values of all schemes were extracted, as shown in Figure 12 and Figure 13. The temperature of all schemes equals room temperature (298.15k) at the initial moment. With the discharge process, the MaxT increases gradually and the rate of increase gradually slows down. It can be seen that the final MaxT of scheme 1, 2, 7, and 15 is relatively high. The final MaxT of scheme 3, 4, 12, and 13 is relatively low. In addition, the air speed at the inlet and outlet are listed in Figure 14. The speed at the inlet remained at 1 m/s while it was no more than 0.2 m/s at the outlet. The outlet air speed of scheme 6 is the lowest, while the outlet air speed is the highest in scheme 3. The difference in outlet air speed indicates the complexity of flow. The eight schemes for the fluid velocity distribution path are shown in Figure 15 and Figure 16. It can be seen that in schemes 1, 2, 7 and 15, the inlet and outlet are too close and the pressure difference between the inlet and the outlet is the largest. After entering the inlet of the battery pack, the air fails to flow through most areas of the battery bag, resulting in most of the heat not being taken away in time. Therefore, the heat dissipation effect of the battery pack is poor. Scheme 3, 4, 12, and 13 avoid this problem. The fluid flows through almost all the cells in the battery pack.

4.3. Number of Inlets and Outlets

In order to obtain a better BTMS, a model with multiple outlet modes was studied. Options include one inlet and two outlets, two inlets and one outlet, two inlets and two outlets, and so on. Eighteen one inlet and one outlet options were discussed above in Section 4.2. On the basis of these one inlet and one outlet scheme, the one inlet and two outlet configurations are further discussed. Considering the symmetry, the inlet is arranged in the middle the side. The specific scheme is shown in Figure 17.
According to the information shown in Figure 18 and Figure 19, the MaxT is in scheme 23 and the minimum is in scheme 24. The largest TSD is in scheme 19 and the smallest is in scheme 24. As shown in Figure 20 by comparing scheme 19 and scheme 23, the short flow path of the fluid will remove local heat, and the temperature of the whole battery pack will be higher. The longer the fluid flow path, the more uniform the temperature distribution of the battery pack and the smaller the TSD. The MaxT and the TSD of different inlet and outlet schemes are caused by the change in the fluid flow state. The air speed at the inlet and outlet is displayed in Figure 21. The speed at the inlet was 1 m/s. There were discrepancies in the outlet speed. The zigzag change manifested by several schemes were at similar outlet speeds.

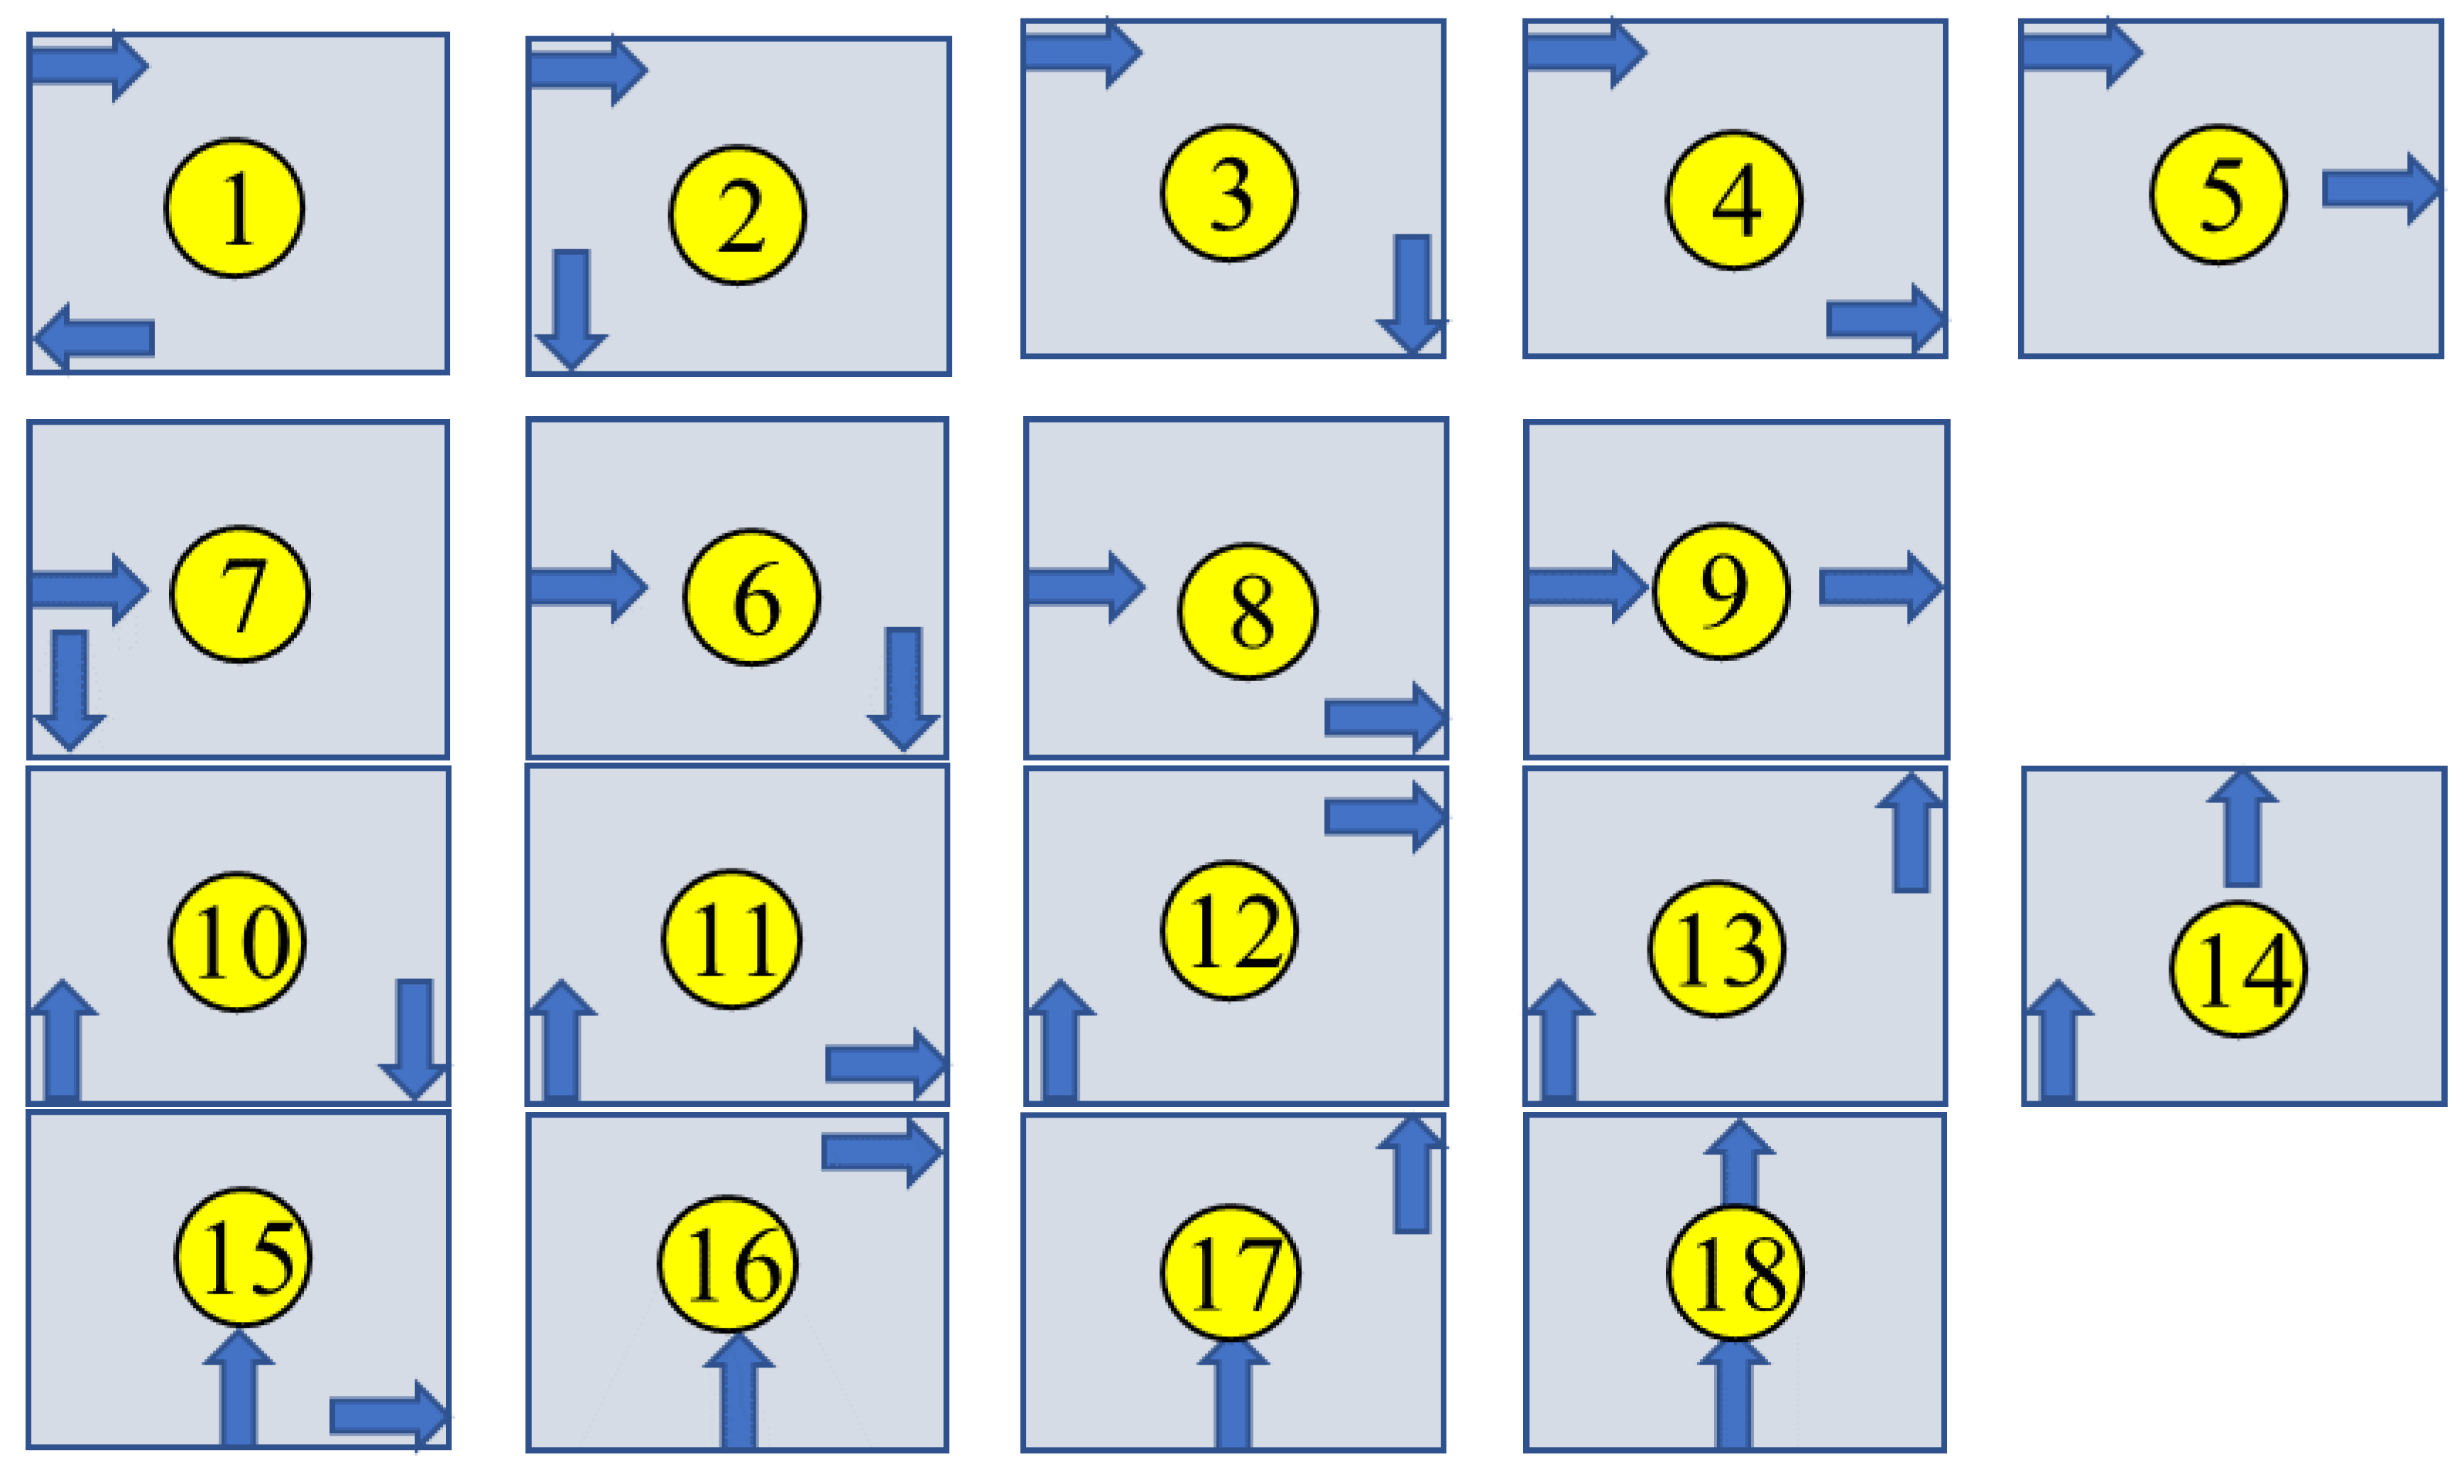
5. Experimental Validation

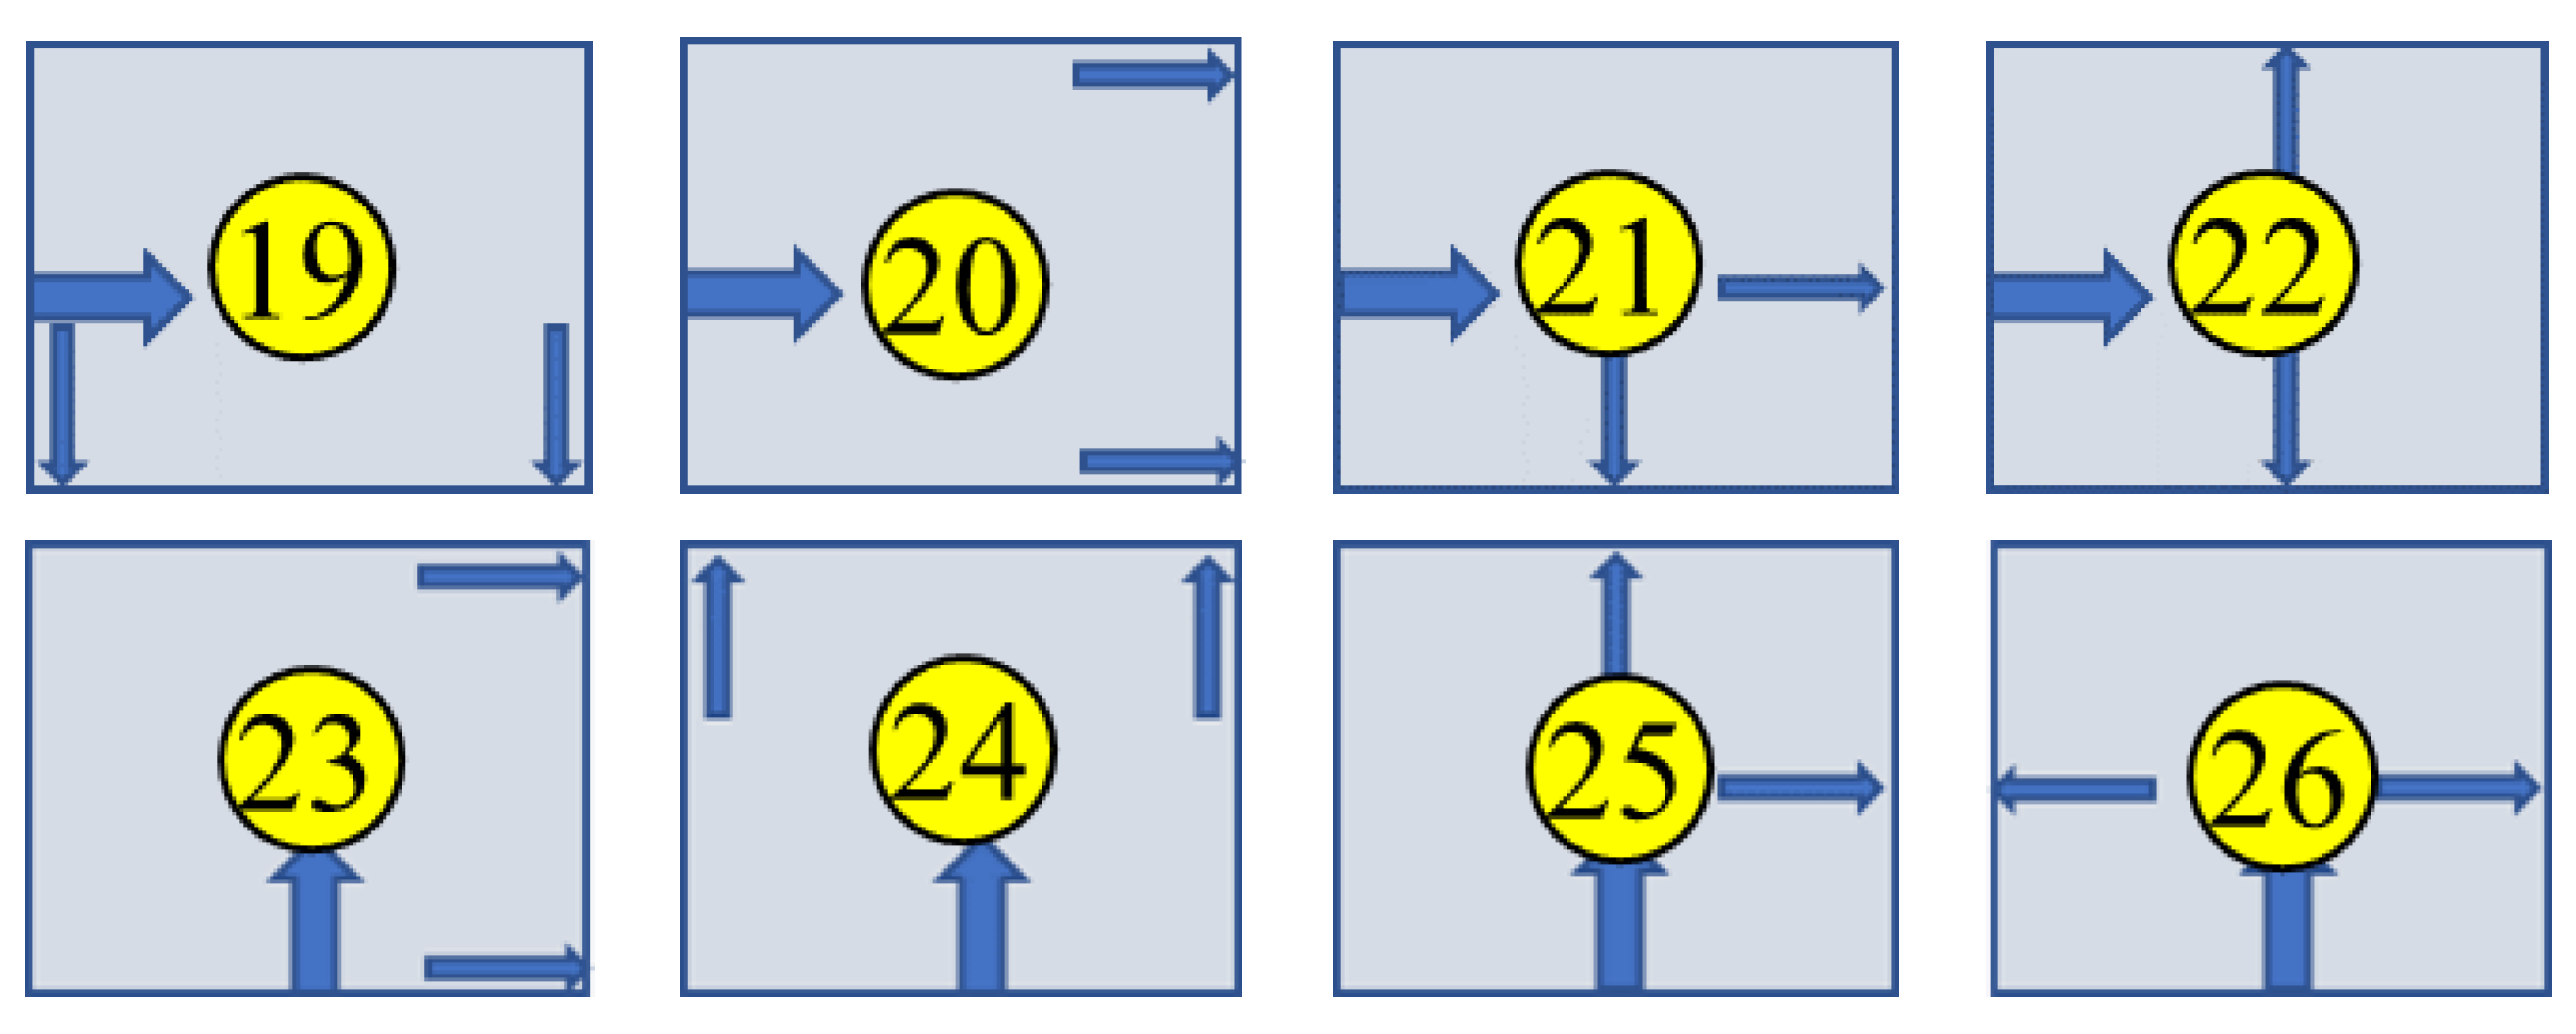
As we know from the previous section, the optimal arrangement of the inlet and outlet in the one-in-one-out model is scheme 13, and the optimal arrangement of the inlet and outlet in the one-in-two-out mode is scheme 24. This is because, under these two configurations, the fluid flow state in the battery pack is most suitable for dissipating the heat in the battery pack, which can result in good heat dissipation of the battery system when working. However, the simulation results need to be verified by experiments. Therefore, discharge tests were conducted on scheme 13 and scheme 24. The 20 batteries are arranged in a 4 × 5 arrangement and connected in a series of four and a parallel of five. To ensure a constant discharge current of 2 A, the discharge current of 8 A was set to constantly discharge for 15 min. In the experiment, the temperature of 20 batteries was collected in real-time, and a temperature sensor was installed on the side of each battery. The experimental set up is shown in Figure 3.
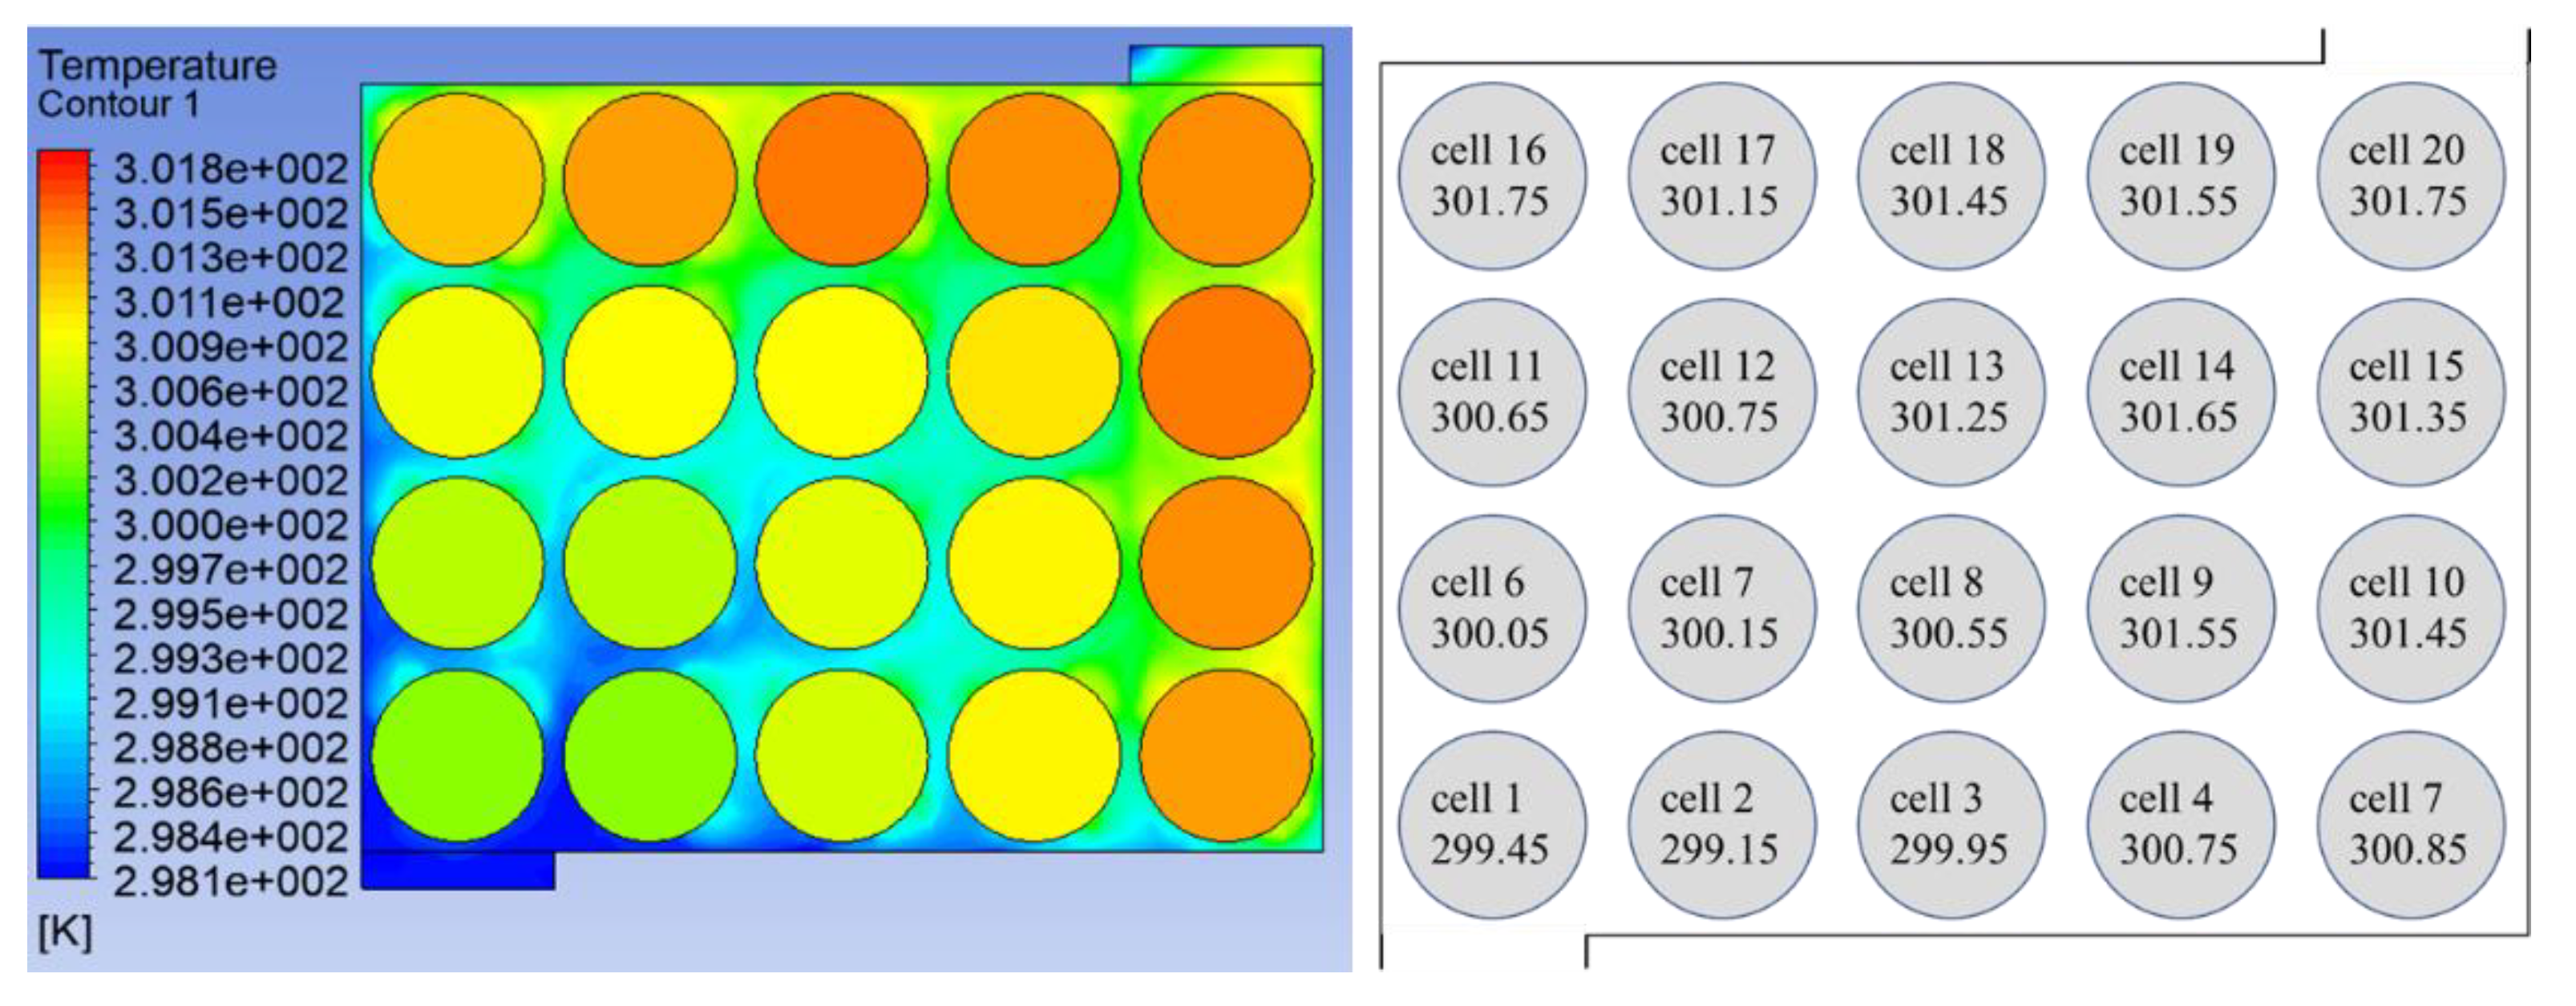
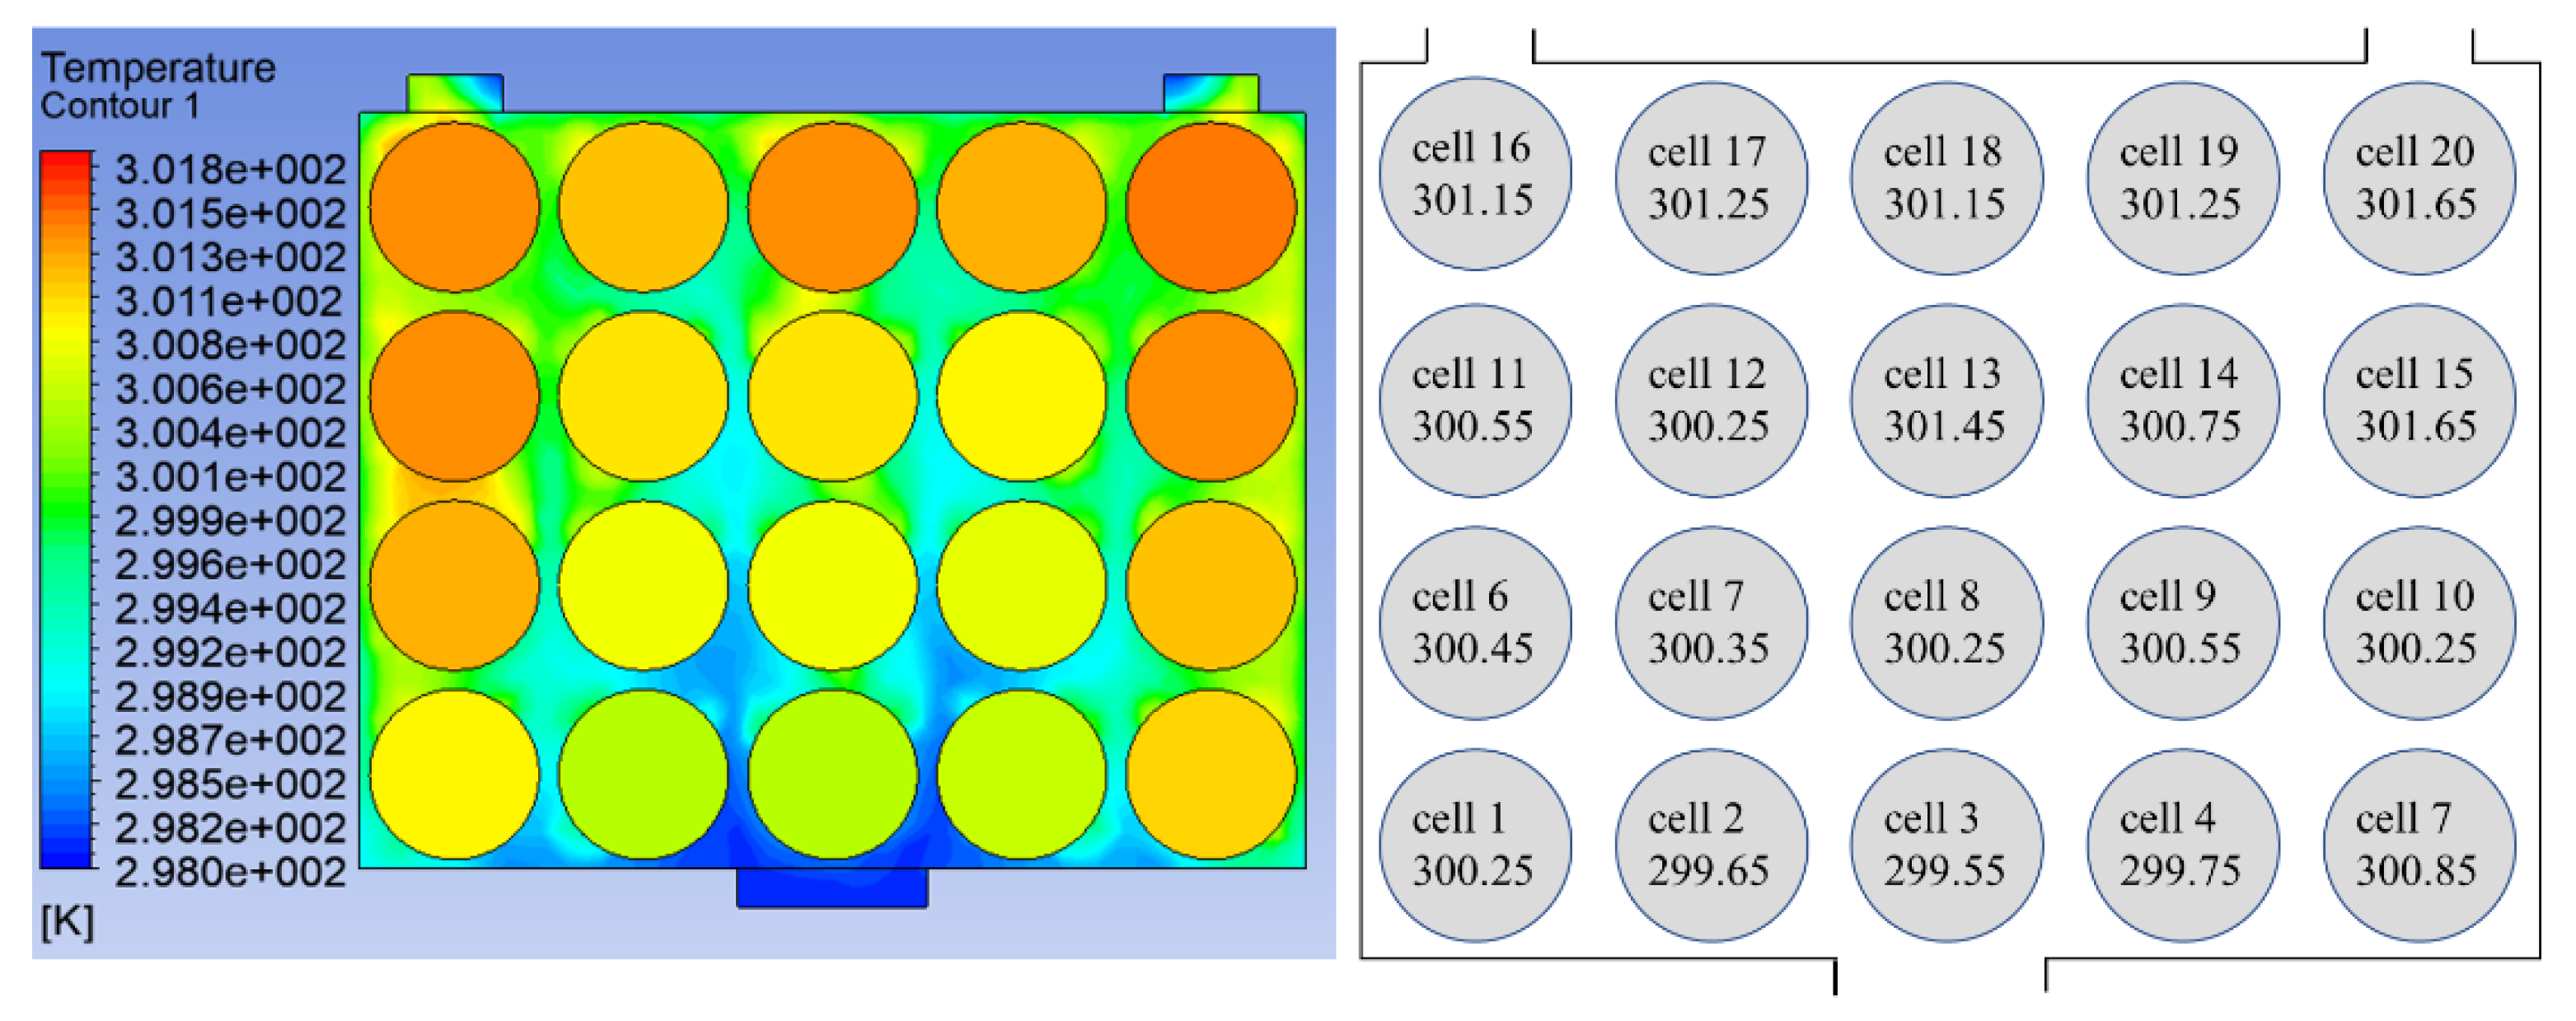
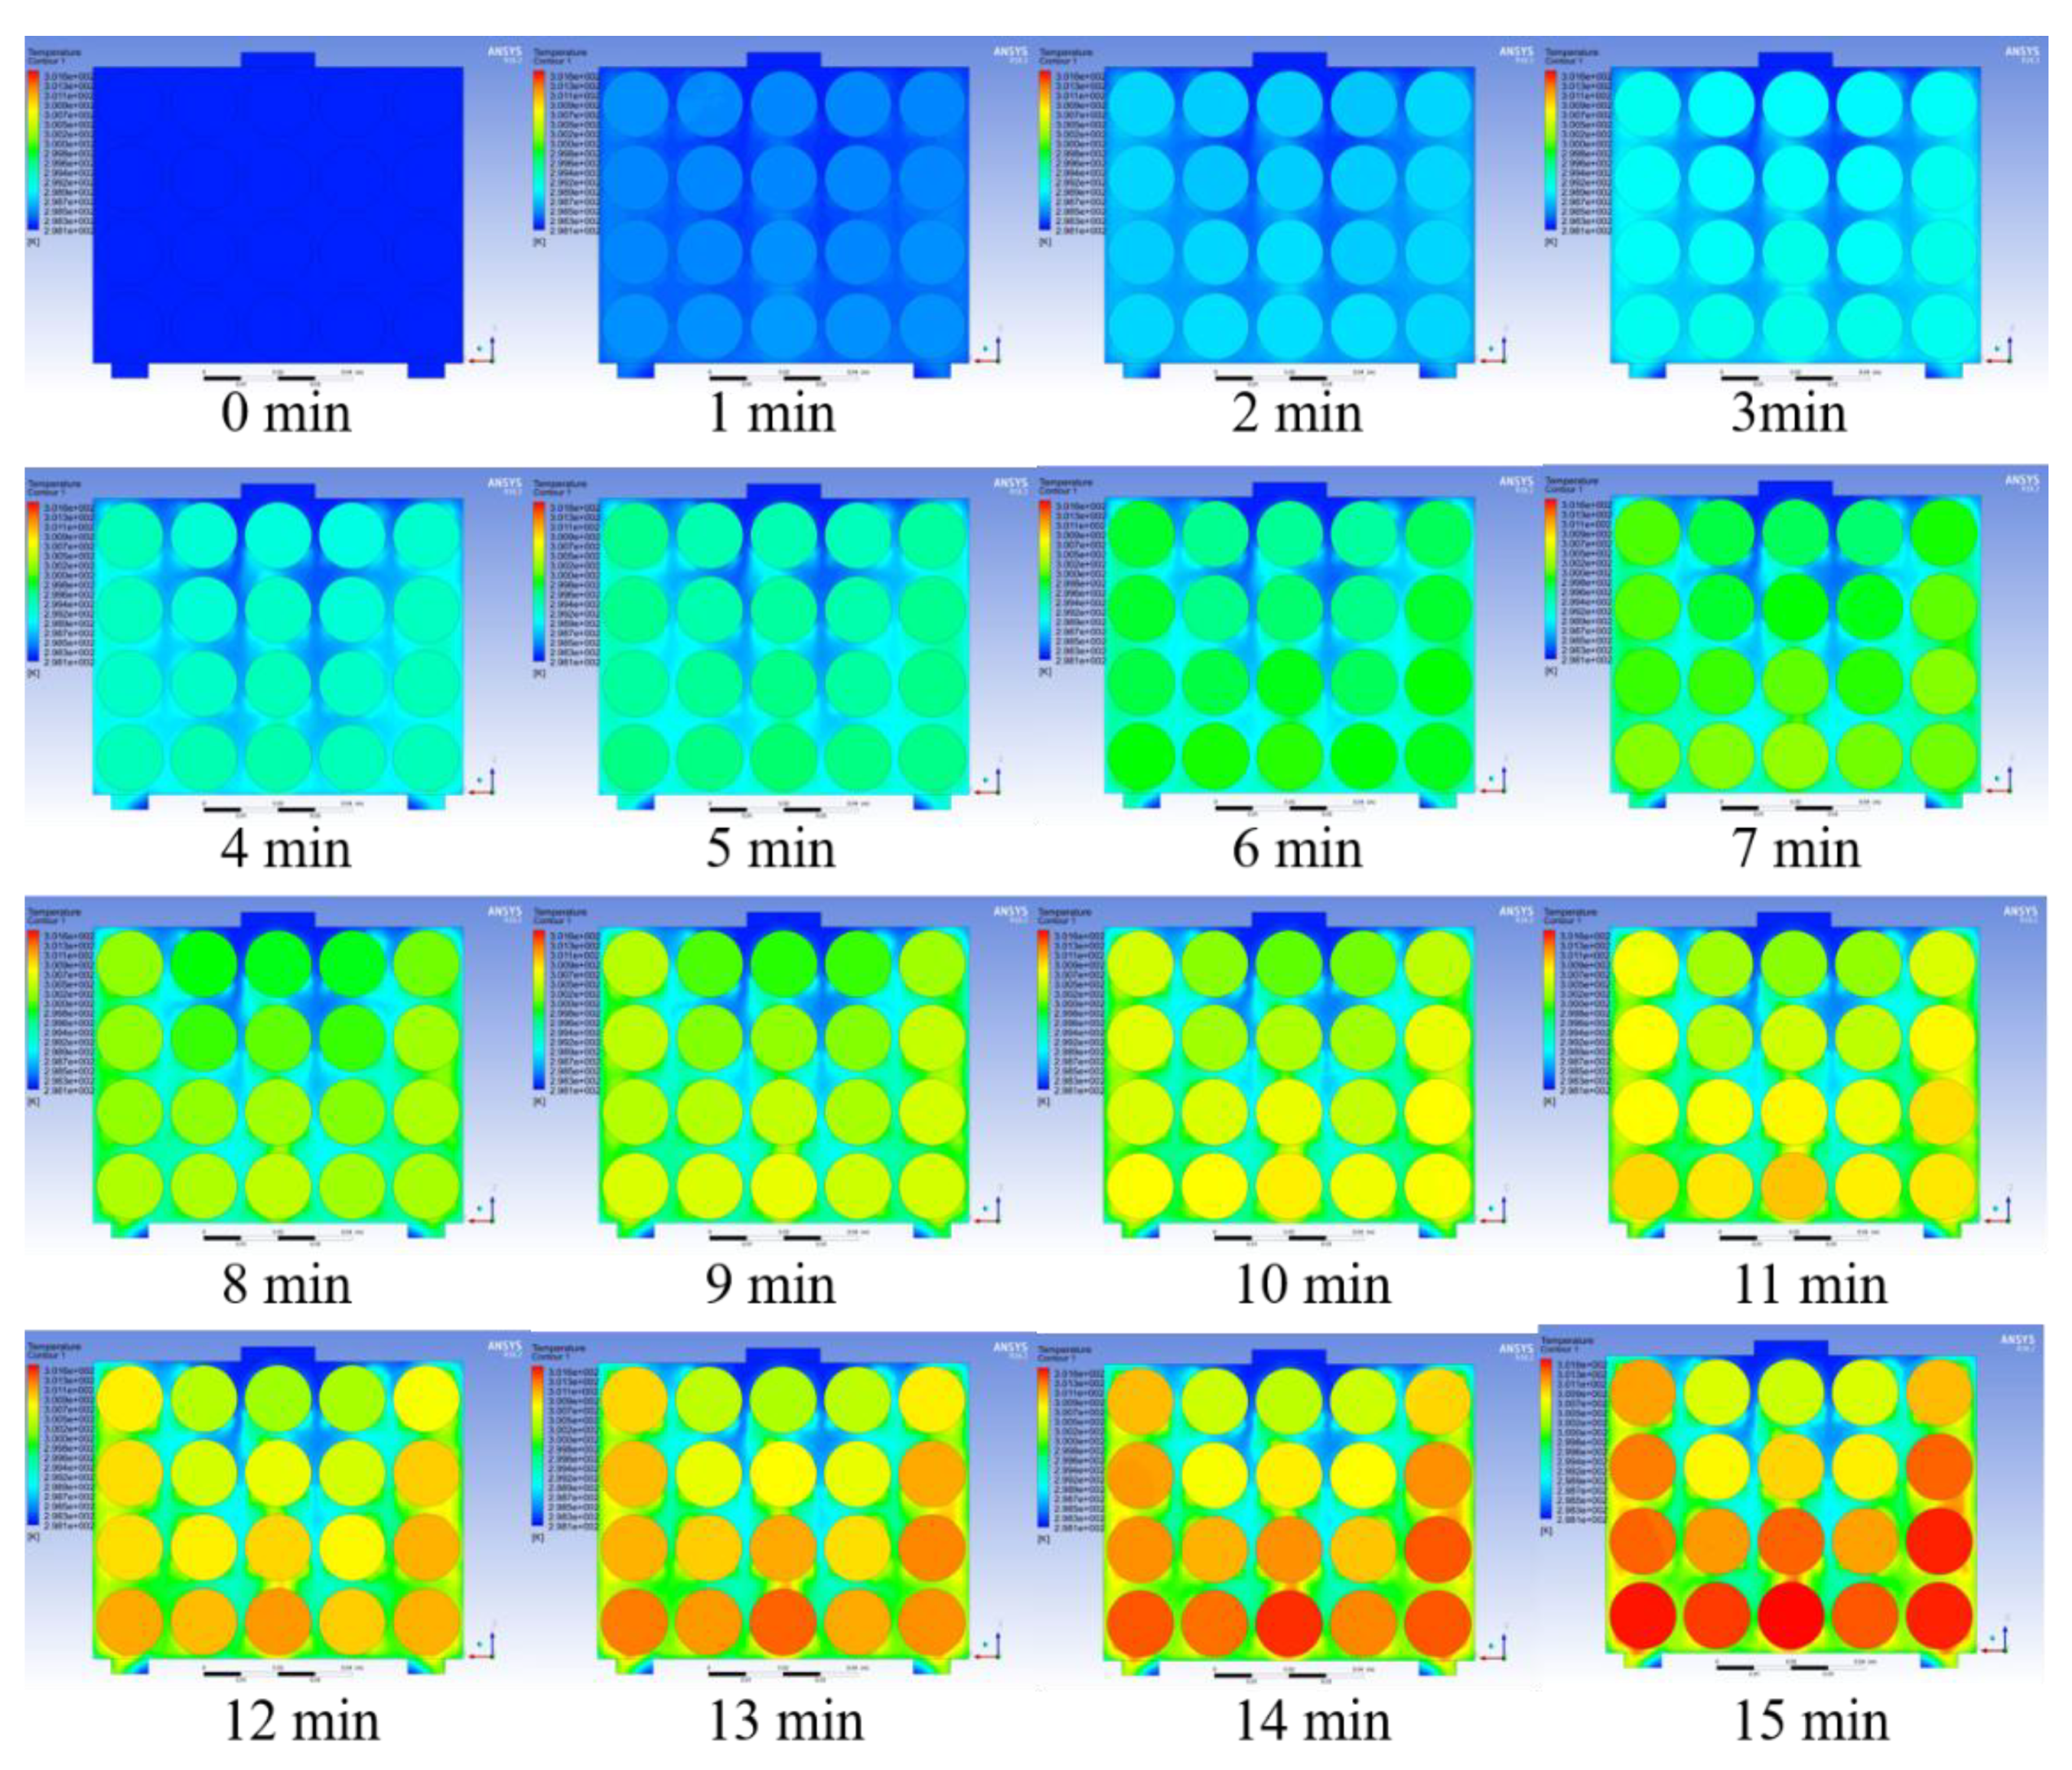
The temperature data of two battery packs were collected in the experiment. The temperature at the end of discharge (i.e., the MaxT of the battery) was marked on the single battery according to the battery layout in the experiment. The results are shown in Figure 22 and 
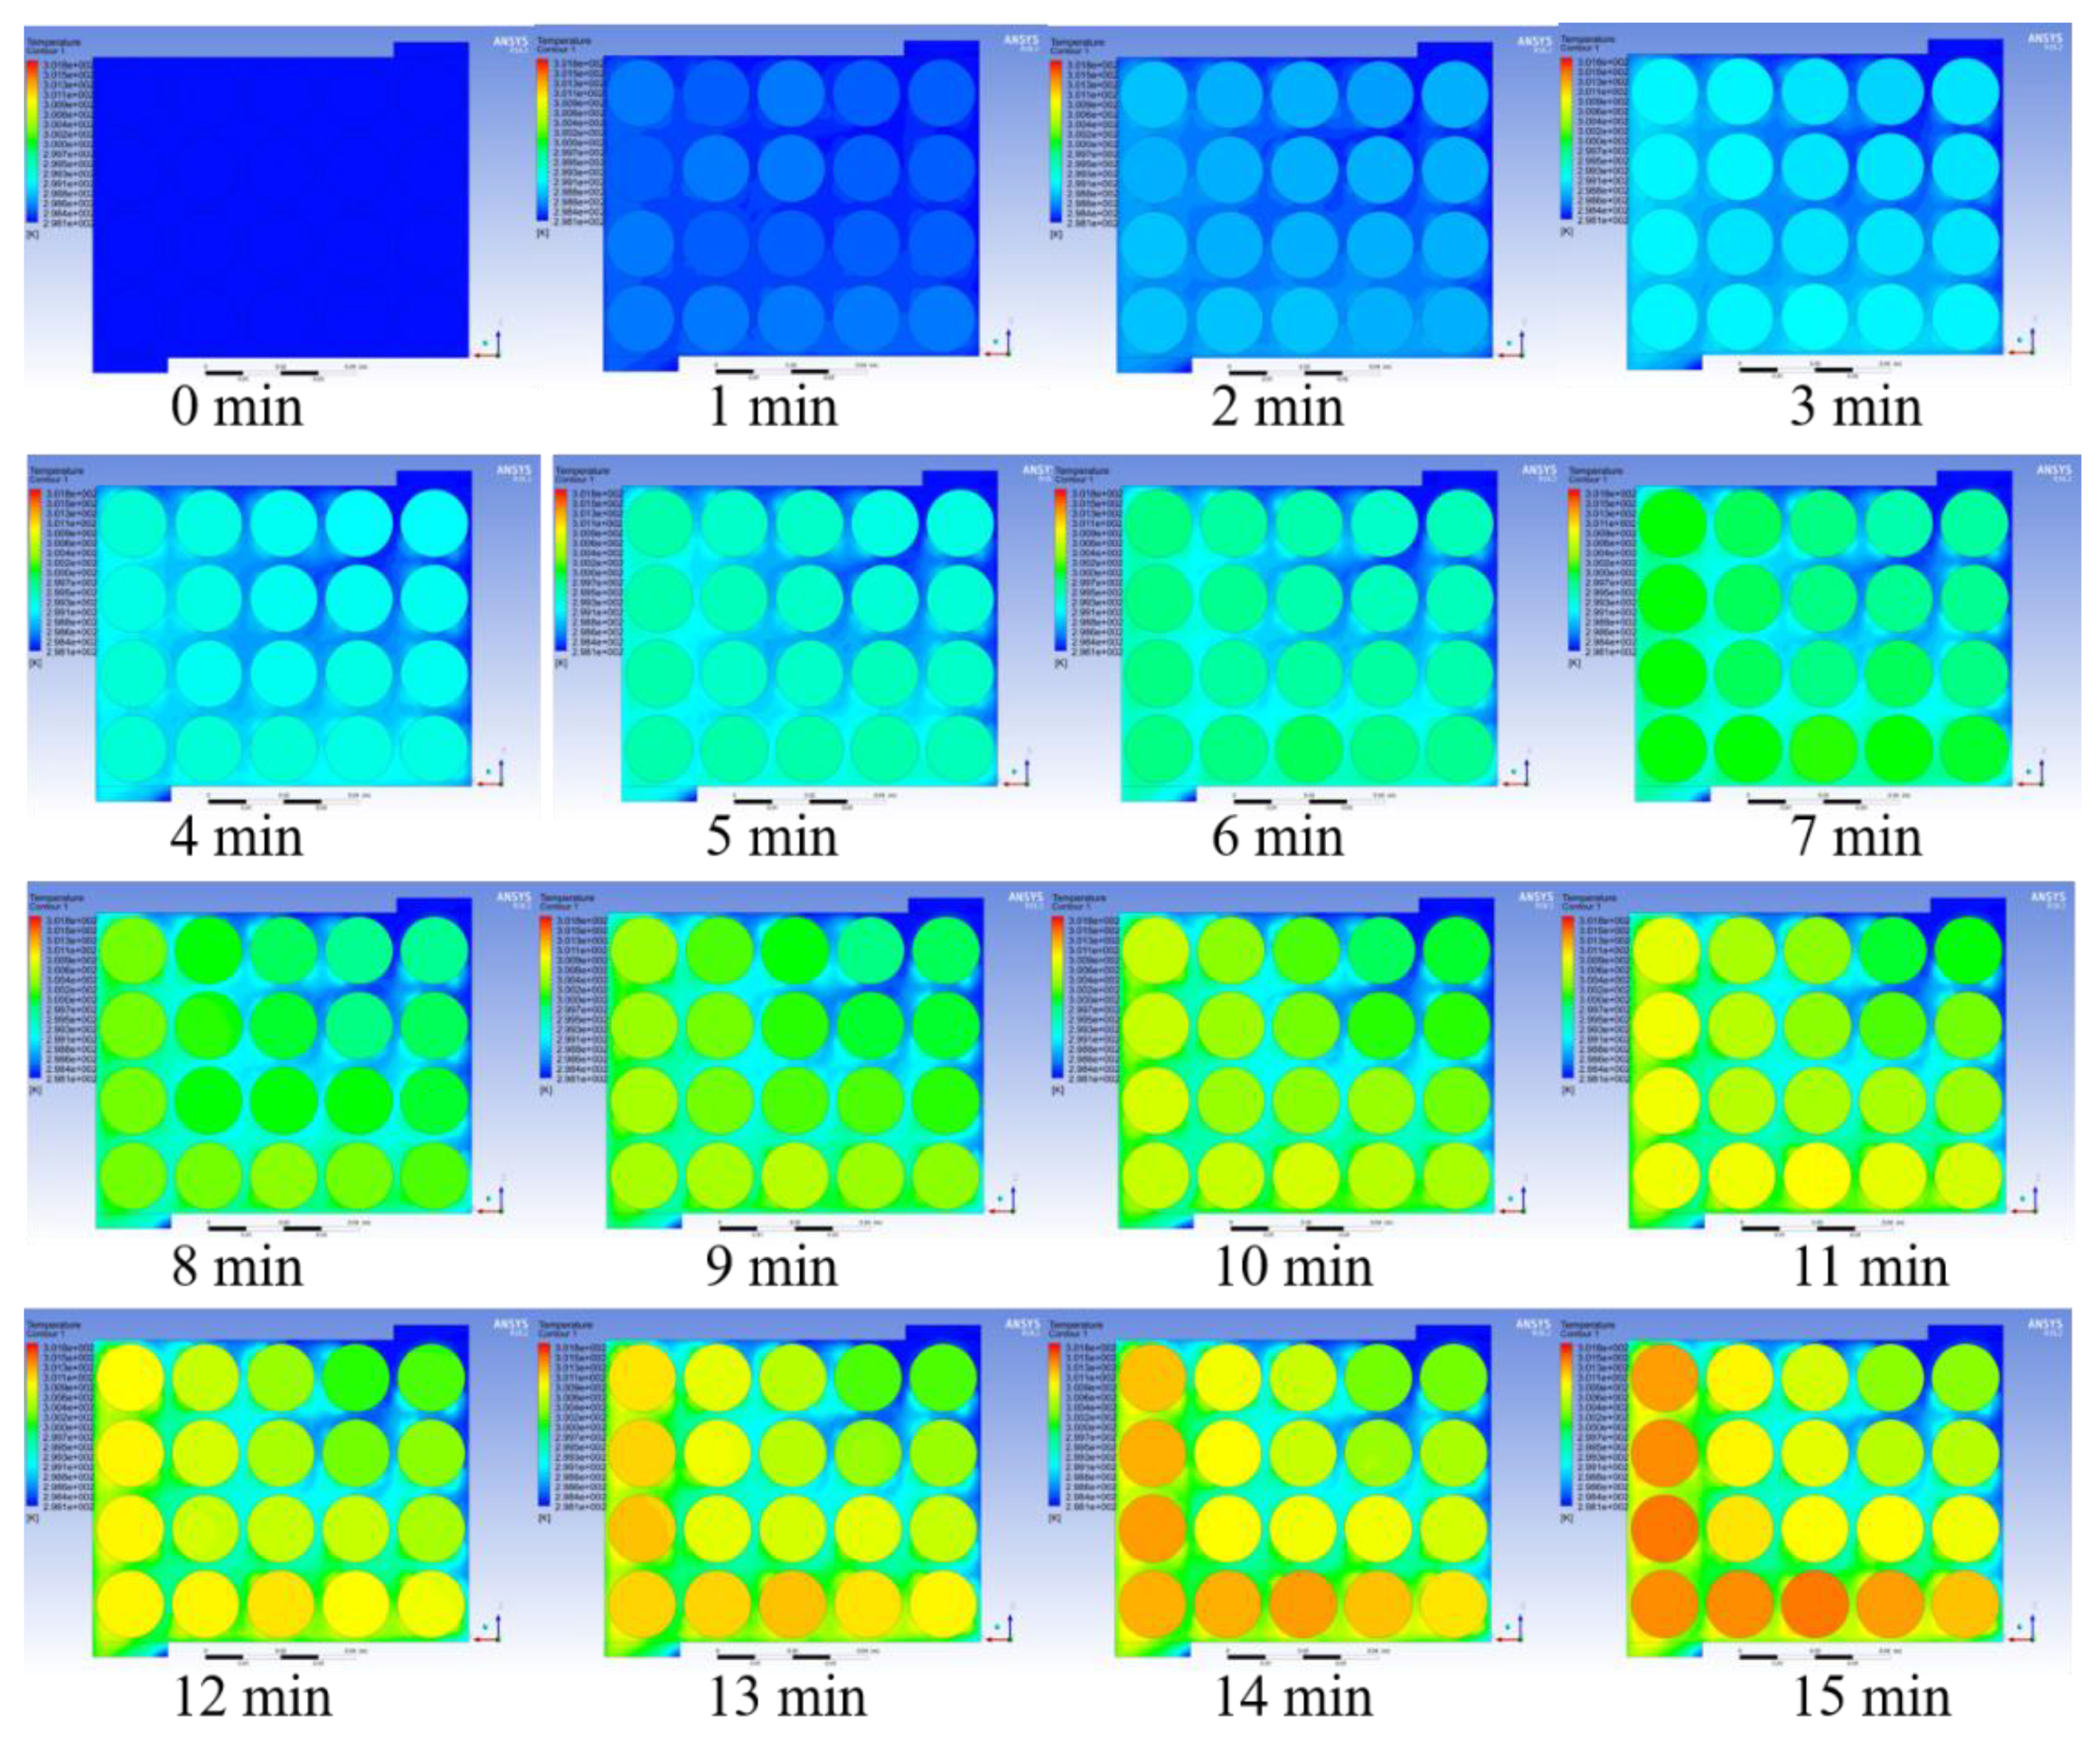
Figure 23, respectively. Under the premise of good enough performance of the BTMS, lower cost should also be a focus. The transient change process in the temperature cloud map is shown in Figure 24 and Figure 25.
Figure 22 and Figure 23 show the comparison of the battery temperature during the simulation and the experiment. In Figure 22, the error in MaxT between the simulation and experiment is 0.017% and in 
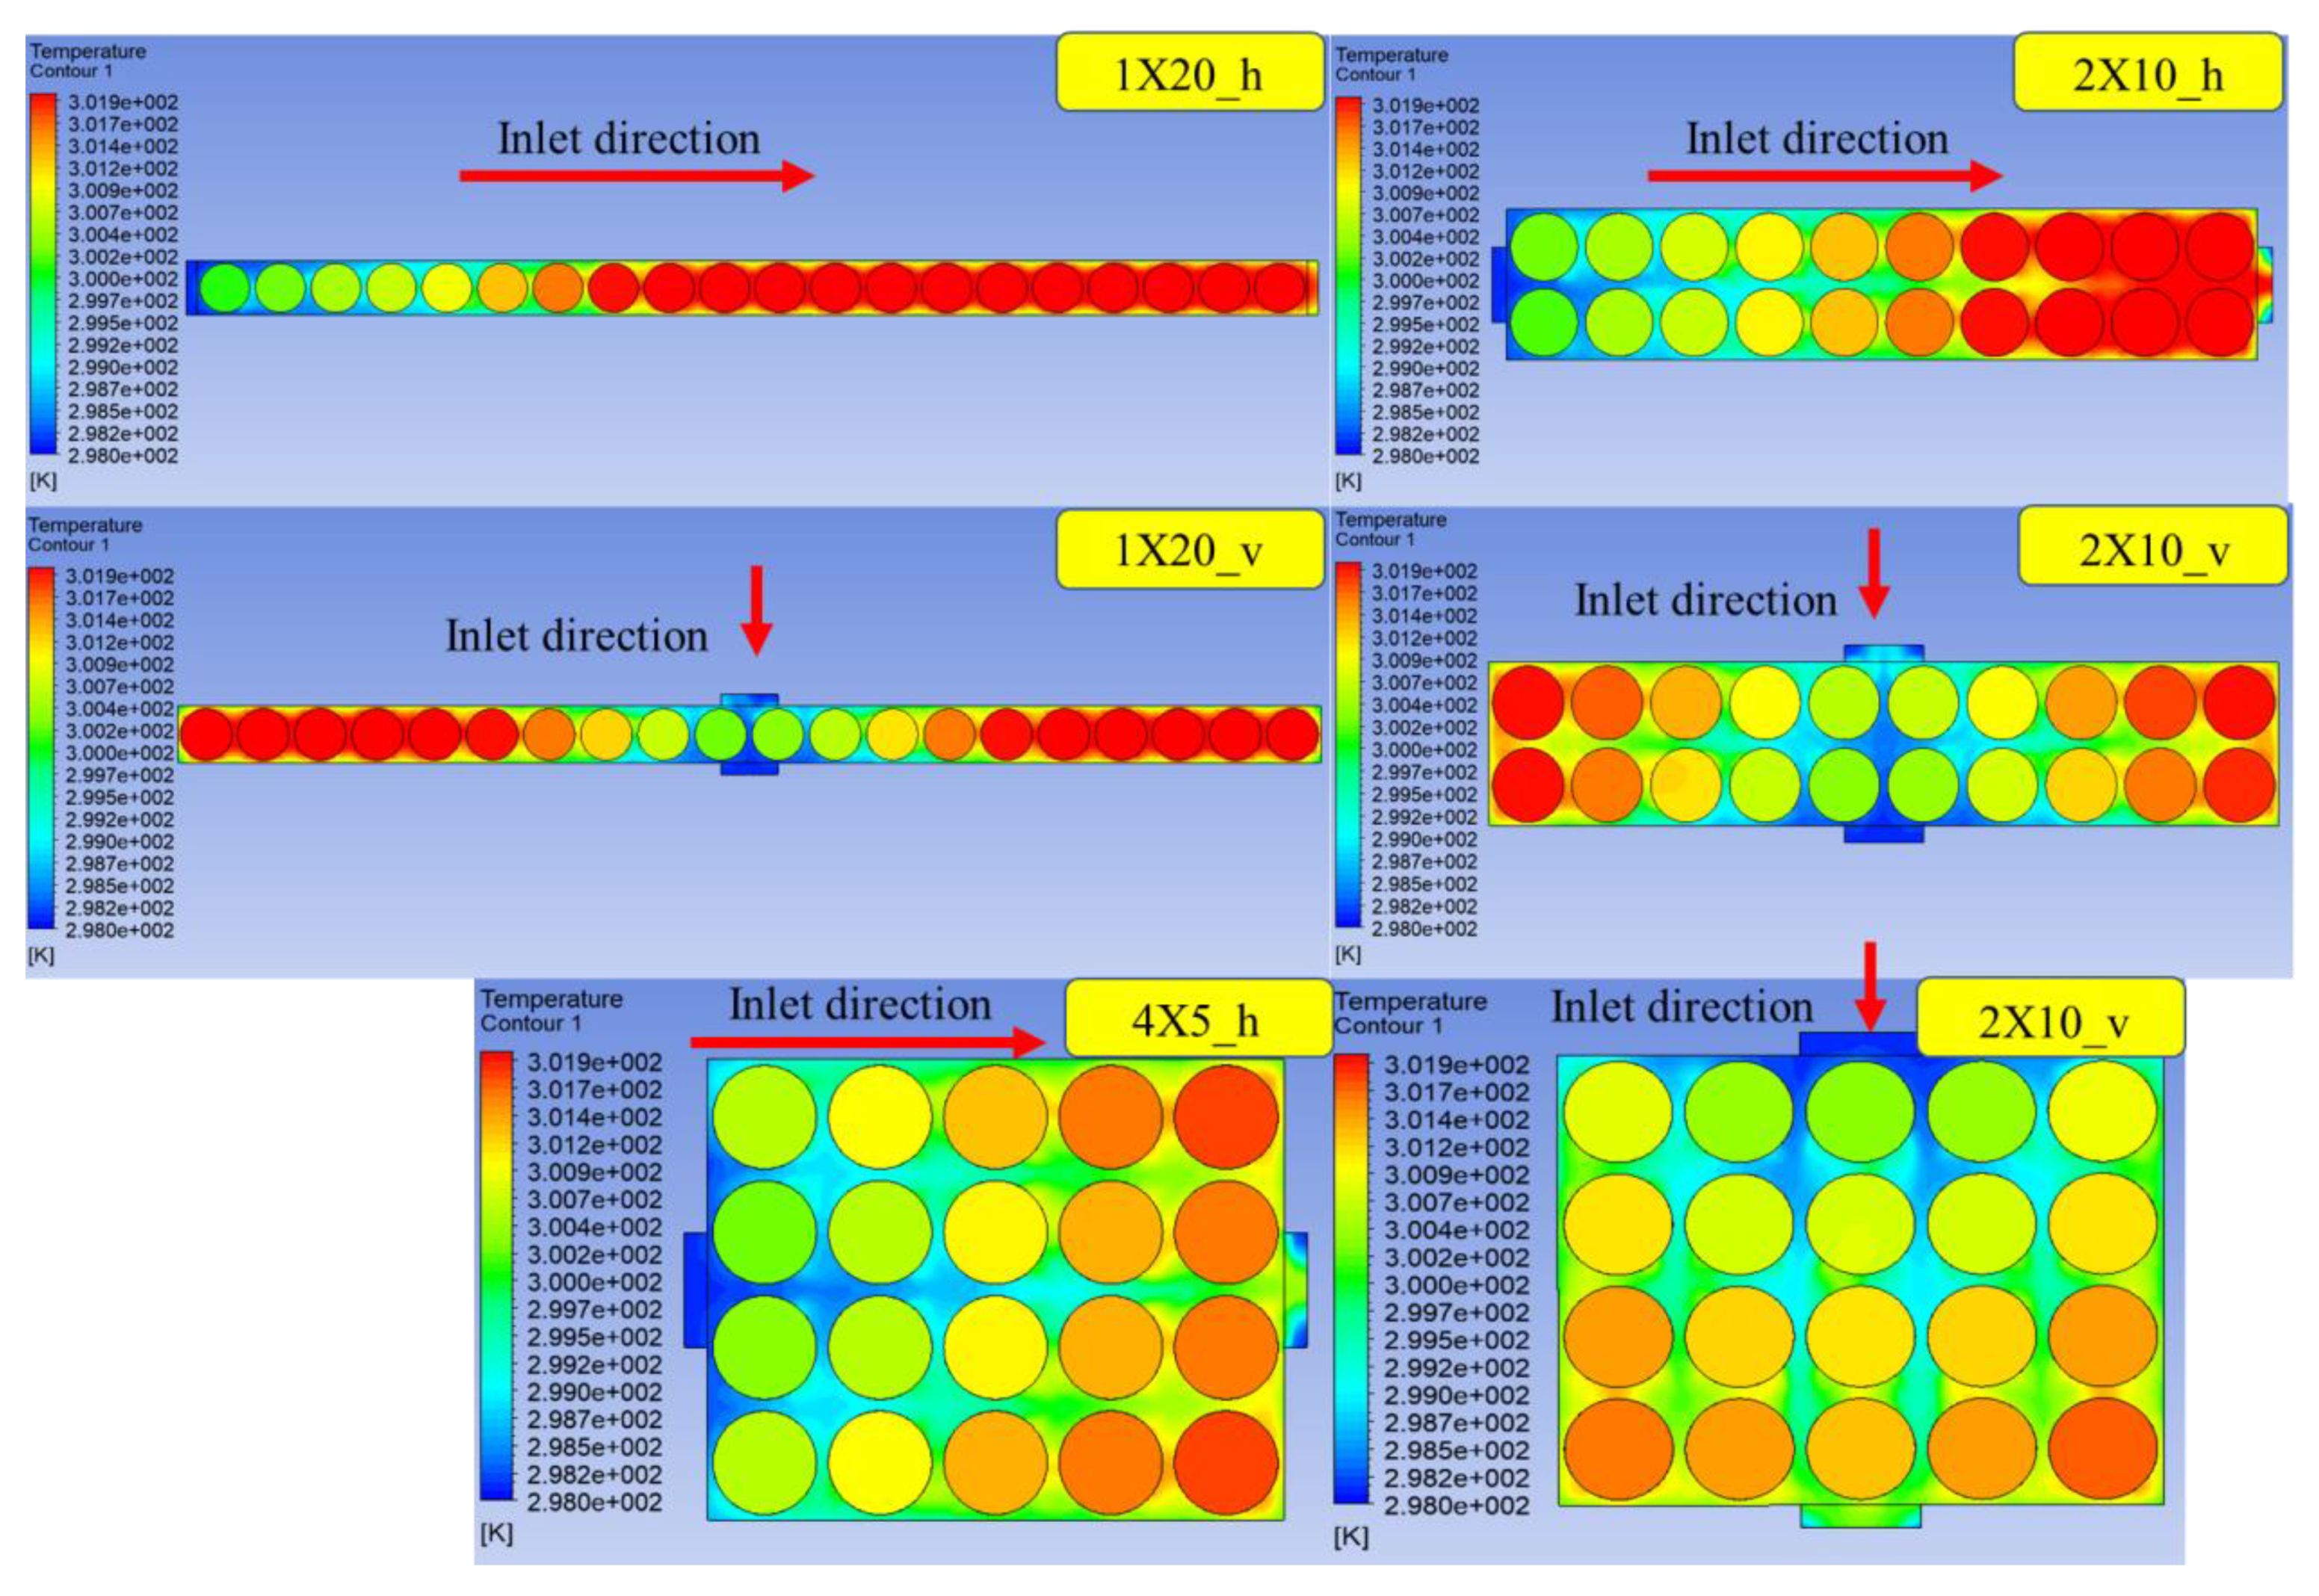
Figure 23, the error in MaxT between the simulation and experiment is 0.049%. The experimental results are close to the simulation temperature. Battery temperature is generally lower near the inlet, and the temperature starts to rise as the distance from the inlet increases. High-temperatures appear near the outlet, and the closer they are to the outlet, the higher the temperature. These phenomena are consistent with the basic predictions of heat transfer. However, the experimental results are still inconsistent with the simulation results. At the end of discharge, the battery temperature is still slightly lower than the simulation results. In addition, the influence of pressure on the temperature field was not considered in this study, which is a possible cause of temperature error. 
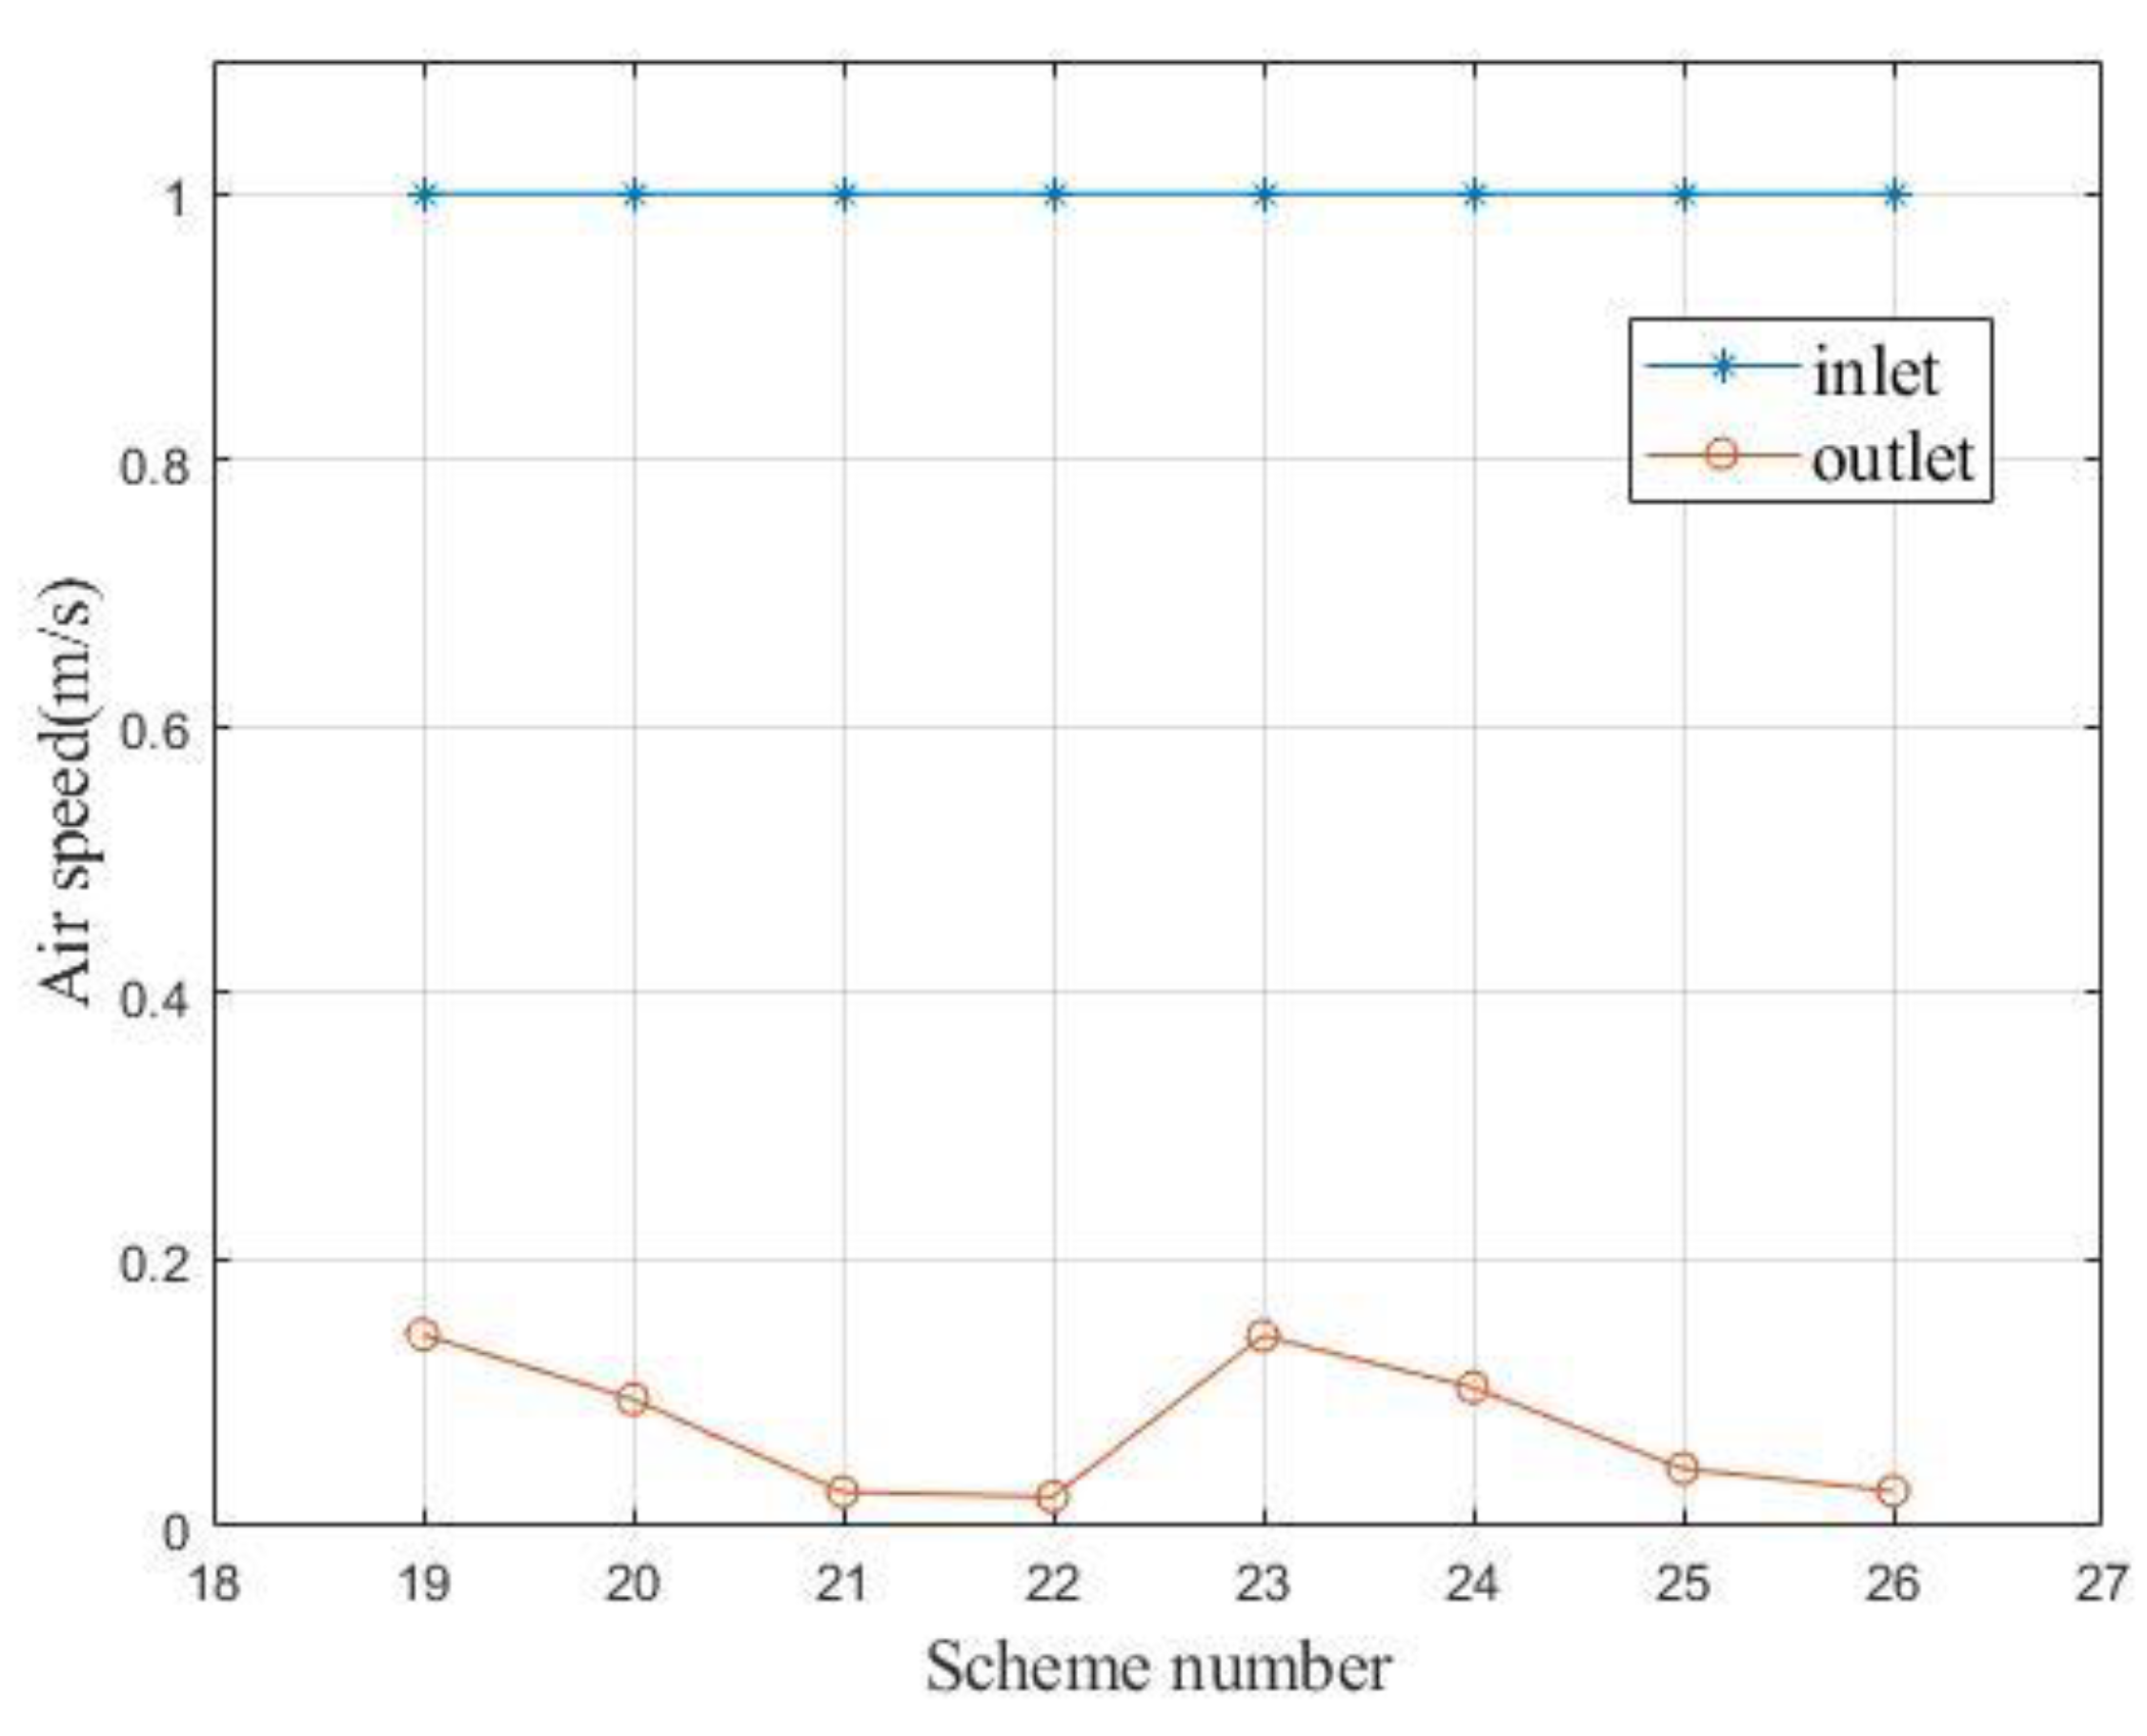
Table 2 shows a comparison of the air speed in the simulation and the experiment. Limited by the difficulty of adjustment and measurement accuracy, the forced air speed at the inlet can only be adjusted close to 1 m/s. The error in the simulation and experiment stabilized at less than 15.38%.

6. Conclusions

In this study, we designed an AC system for a cylindrical battery pack. The experiment was conducted on the basis of the simulation, and the following conclusions were drawn by comparing the results:
(1)
For the rectangular arrangement of a multi-cell cylindrical battery pack, an arrangement with a small length-width ratio is more conducive to reducing the MaxT and TSD of the battery in the discharge process.
(2)
The inlet and outlet configuration of the cooling system that facilitates fluid flow over most of the battery pack over shorter distances, is more conducive to battery thermal management.
(3)
The configuration of a large number of inlets and outlets facilitates more flexible adjustment of the fluid flow state and can slow down battery heating to a greater extent.
As the distance of cells in the pack greatly determines the performance of thermal management, future work will consider the optimization of the structural parameters.

Author Contributions

Data curation, X.C.; Formal analysis, X.P. and X.C.; Funding acquisition, X.L., X.P. and A.G.; Methodology, X.P. and X.L.; Software, A.G. All authors have read and agreed to the published version of the manuscript.

Funding

This was funded by the Department of education of Guangdong Province of China, grant number 2019KTSCX039; the Natural Science Foundation of Hunan Province of China, grant number 2017JJ3057; and the Research Foundation of Education Bureau of Hunan Province, China, grant number 17C0473. The APC was funded by Shantou University.

Conflicts of Interest

The authors declare no conflict of interest.

Nomeclature

AbbreviationMeaning
LIBLithium-ion battery
BTMSBattery thermal management system
ACAir-cooling
LCLiquid-cooling
PCMPhase change material
RHReaction heat
SRHSide reaction heat
JHJoule heat
PHPolarization heat
IRInternal resistance
SHCSpecific heat capacity
TCThermal conductivity
SOCState of charge
HCCHeat conductivity coefficient
COEConservation of energy
TDTemperature difference
MaxTMaximum temperature
MinTMinimum temperature
TSDTemperature standard deviation
ECEEnergy conservation equation
MCEMomentum conservation equation
CFDComputational fluid dynamics

References

  1. Mohammed, A.H.; Esmaeeli, R.; Aliniagerdroudbari, H.; Alhadri, M. Dual-purpose cooling plate for thermal management of prismatic lithium- ion batteries during normal operation and thermal runaway. Appl. Therm. Eng. 2019, 160, 114106. [Google Scholar] [CrossRef]
  2. Song, L.; Liang, T.; Lu, L.; Ouyang, M. Lithium-ion battery pack equalization based on charging voltage curves. Int. J. Electr. Power Energy Syst. 2020, 115, 105516. [Google Scholar] [CrossRef]
  3. Xu, X.; Li, W.; Xu, B.; Qin, J. Numerical study on a water cooling system for prismatic LiFePO 4 batteries at abused operating conditions. Appl. Energy 2019, 250, 404–412. [Google Scholar] [CrossRef]
  4. Wang, Q.; Jiang, B.; Xue, Q.F.; Sun, H.L.; Li, B.; Zou, H.M.; Yan, Y.Y. Experimental investigation on EV battery cooling and heating by heat pipes. Appl. Therm. Eng. 2015, 88, 54–60. [Google Scholar] [CrossRef]
  5. Jilte, R.D.; Kumar, R.; Ahmadi, M.H. Cooling performance of nanofluid submerged vs. nanofluid circulated BTMSs. J. Clean. Prod. 2019, 240, 118131. [Google Scholar] [CrossRef]
  6. Lai, Y.; Wu, W.; Chen, K.; Wang, S.; Xin, C. A compact and lightweight liquid-cooled thermal management solution for cylindrical lithium-ion power battery pack. Int. J. Heat Mass Transf. 2019, 144, 118581. [Google Scholar] [CrossRef]
  7. Weng, J.; Ouyang, D.; Yang, X.; Chen, M.; Zhang, G.; Wang, J. Alleviation of thermal runaway propagation in thermal management modules using aerogel felt coupled with flame-retarded phase change material. Energy Convers. Manag. 2019, 200, 112071. [Google Scholar] [CrossRef]
  8. Liu, W.; Jia, Z.; Luo, Y.; Xie, W.; Deng, T. Experimental investigation on thermal management of cylindrical Li-ion battery pack based on vapor chamber combined with fi n structure. Appl. Therm. Eng. 2019, 162, 114272. [Google Scholar] [CrossRef]
  9. Liu, K.; Li, K.; Ma, H.; Zhang, J.; Peng, Q. Multi-objective optimization of charging patterns for LIB management. Energy Convers. Manag. 2018, 159, 151–162. [Google Scholar] [CrossRef]
  10. Wang, S.L.; Stroe, D.I.; Fernandez, C.; Xiong, L.Y.; Fan, Y.C.; Cao, W. A novel power state evaluation method for the lithium battery packs based on the improved external measurable parameter coupling model. J. Clean. Prod. 2020, 242, 118506. [Google Scholar] [CrossRef]
  11. Liu, R.; Chen, J.; Xun, J.; Jiao, K.; Du, Q. Numerical investigation of thermal behaviors in lithium-ion battery stack discharge. Appl. Energy 2014, 132, 288–297. [Google Scholar] [CrossRef]
  12. Gachot, G.; Grugeon, S.; Eshetu, G.G.; Mathiron, D.; Ribière, P.; Armand, M.; Laruelle, S. Thermal behaviour of the lithiated-graphite/electrolyte interface through GC/MS analysis. Electrochim. Acta 2012, 83, 402–409. [Google Scholar] [CrossRef]
  13. Wang, T.; Tseng, K.J.; Zhao, J.; Wei, Z. Thermal investigation of lithium-ion battery module with different cell arrangement structures and forced air-cooling strategies. Appl. Energy 2014, 134, 229–238. [Google Scholar] [CrossRef]
  14. Mahamud, R.; Park, C. Reciprocating air flow for Li-ion battery thermal management to improve temperature uniformity. J. Power Sources 2011, 196, 5685–5696. [Google Scholar] [CrossRef]
  15. Sheng, L.; Su, L.; Zhang, H.; Li, K.; Fang, Y.; Ye, W.; Fang, Y. Numerical investigation on a lithium ion battery thermal management utilizing a serpentine-channel liquid cooling plate exchanger. Int. J. Heat Mass Transf. 2019, 141, 658–668. [Google Scholar] [CrossRef]
  16. Wang, C.; Zhang, G.; Meng, L.; Li, X.; Situ, W.; Lv, Y.; Rao, M. Liquid cooling based on thermal silica plate for battery thermal management system. Int. J. Energy Res. 2017, 41, 2468–2479. [Google Scholar] [CrossRef]
  17. Kizilel, R.; Sabbah, R.; Selman, J.R.; Al-hallaj, S. An alternative cooling system to enhance the safety of Li-ion battery packs. J. Power Sources 2009, 194, 1105–1112. [Google Scholar] [CrossRef]
  18. Huang, H.; Wang, H.; Gu, J.; Wu, Y. High-dimensional model representation-based global sensitivity analysis and the design of a novel thermal management system for lithium-ion batteries. Energy Convers. Manag. 2019, 190, 54–72. [Google Scholar] [CrossRef]
  19. Wang, T.; Tseng, K.J.; Zhao, J. Development of efficient air-cooling strategies for LIB module based on empirical heat source model. Appl. Therm. Eng. 2015, 90, 521–529. [Google Scholar] [CrossRef]
  20. Wang, J.; Gan, Y.; Liang, J.; Tan, M.; Li, Y. Sensitivity analysis of factors in fl uencing a heat pipe-based thermal management system for a battery module with cylindrical cells. Appl. Therm. Eng. 2019, 151, 475–485. [Google Scholar] [CrossRef]
  21. Yang, N.; Zhang, X.; Li, G.; Hua, D. Assessment of the forced air-cooling performance for cylindrical LIB packs: A comparative analysis between aligned and staggered cell arrangements. Appl. Therm. Eng. 2015, 80, 55–65. [Google Scholar] [CrossRef]
  22. Ismail, N.H.F.; Toha, S.F.; Azubir, N.A.M.; Ishak, N.H.M.; Hassan, M.K.; Ibrahim, B.S.K. Simplified heat generation model for lithium ion battery used in electric vehicle. IOP Conf. Ser. Mater. Sci. Eng. 2013, 53, 3–8. [Google Scholar] [CrossRef]
  23. Chen, S.; Peng, X.; Bao, N.; Garg, A. A comprehensive analysis and optimization process for an integrated liquid cooling plate for a prismatic lithium-ion battery module. Appl. Therm. Eng. 2019, 156, 324–339. [Google Scholar] [CrossRef]
  24. Park, H. A design of air flow configuration for cooling lithium ion battery in hybrid electric vehicles. J. Power Sources 2013, 239, 30–36. [Google Scholar] [CrossRef]
  25. Du, X.; Qian, Z.; Chen, Z.; Rao, Z. Experimental investigation on mini-channel cooling-based thermal management for Li-ion battery module under different cooling schemes. Int. J. Energy Res. 2018, 42, 2781–2788. [Google Scholar] [CrossRef]
  26. Zhao, R.; Gu, J.; Liu, J. An investigation on the signi fi cance of reversible heat to the thermal behavior of lithium ion battery through simulations. J. Power Sources 2014, 266, 422–432. [Google Scholar] [CrossRef]
Figure 1. A prismatic battery, pouch battery and cylindrical battery (from left to right).
Energies 13 02956 g001
Figure 2. Research methods and the technical route.
Energies 13 02956 g002
Figure 3. (a) Experimental equipment. (b) The battery with temperature sensors.
Energies 13 02956 g003
Figure 4. Grid independence test based on the maximum temperature (MaxT) and temperature standard deviation (TSD).
Energies 13 02956 g004
Figure 5. (a) The covered single battery. (b) Temperature rise of a single battery under an adiabatic environment.
Energies 13 02956 g005
Figure 6. The blower (a) and anemometer (b) used in experiment.
Energies 13 02956 g006
Figure 7. Battery layout configuration (a) 1 × 20, (b) 2 × 10, (c) 4 × 5.
Energies 13 02956 g007
Figure 8. Temperature distribution of the battery layout schemes.
Energies 13 02956 g008
Figure 9. The MaxT variation in the layout schemes over time.
Energies 13 02956 g009
Figure 10. Optional choices of inlets and outlets.
Energies 13 02956 g010
Figure 11. Schemes for the battery pack with a single inlet and single outlet.
Energies 13 02956 g011
Figure 12. The MaxT variation in schemes for the battery pack with a single inlet and single outlet over time.
Energies 13 02956 g012
Figure 13. TSD of schemes for the battery pack with a single inlet and single outlet over time.
Energies 13 02956 g013
Figure 14. The air speed at the inlet and outlet based on inlet and outlet position.
Energies 13 02956 g014
Figure 15. Velocity path line of scheme 1, 2, 7, 15.
Energies 13 02956 g015
Figure 16. Velocity path line of scheme 3, 4, 12, 13.
Energies 13 02956 g016
Figure 17. Schemes for the battery pack with a single inlet and double outlet.
Energies 13 02956 g017
Figure 18. The maximal temperature of schemes for the battery pack with a single inlet and single outlet over time.
Energies 13 02956 g018
Figure 19. TSD of schemes for the battery pack with a single inlet and single outlet over time.
Energies 13 02956 g019
Figure 20. Velocity path line of scheme 19, 23, 24.
Energies 13 02956 g020
Figure 21. The air speed at the inlet and outlet based on the number of inlets and outlets.
Energies 13 02956 g021
Figure 22. Comparison between the simulation and experimental results for scheme 13 (simulation on the left and experiment on the right).
Energies 13 02956 g022
Figure 23. Comparison between the simulation and experimental results for scheme 24 (simulation on the left and experiment on the right).
Energies 13 02956 g023
Figure 24. A temperature field change in scheme 13 in the dying minutes.
Energies 13 02956 g024
Figure 25. A temperature field change in scheme 24 in the dying minutes.
Energies 13 02956 g025
Table 1. The thermodynamic parameters of the battery.
Parameterρ (kg·m−3)RDC (Ω)Cp (J·kg−1·K−1)λ (W·m−1·K−1)P (W/m3)
Value2812.70.074922.4141.214,947.6
Table 2. Comparison of the air speed at the inlet and outlet in the simulation and the experiment.
PositionSimulationExperiment
Scheme 13Air speed at inlet1 m/s1.03 m/s
Air speed at outlet0.136 m/s0.15 m/s
Scheme 24Air speed at inlet1 m/s1.01 m/s
Air speed at outlet0.026 m/s0.03 m/s

