Article

Will China Achieve Its Ambitious Goal?—Forecasting the CO2 Emission Intensity of China towards 2030

1
Business School, Shandong University at Weihai, Weihai 264209, China
2
School of Economics and Management, Beihang University, Beijing 100083, China
3
Beijing Key Laboratory of Emergency Support Simulation Technologies for City Operation, Beijing 100083, China
4
The School of Humanities and Social Sciences, Beihang University, Beijing 100083, China
*
Author to whom correspondence should be addressed.
Energies 2020, 13(11), 2924; https://doi.org/10.3390/en13112924
Submission received: 12 April 2020 / Revised: 19 May 2020 / Accepted: 25 May 2020 / Published: 7 June 2020

Abstract

:
China has set out an ambitious target of emission abatement; that is, a 60–65% reduction in CO2 emission intensity by 2030 compared with the 2005 baseline level and emission peak realisation. This paper aimed to forecast whether China can fulfil the reduction target of CO2 emission intensity and peak by 2030 based on the historical time series data from 1990 to 2018. Four different forecasting techniques were used to improve the accuracy of the forecasting results: the autoregressive integrated moving average (ARIMA) model and three grey system-based models, including the traditional grey model (1,1), the discrete grey model (DGM) and the rolling DGM. The behaviours of these techniques were compared and validated in the forecasting comparisons. The forecasting performance of the four forecasting models was good considering the minimum mean absolute percentage error (MAPE), demonstrating MAPE values lower than 2%. ARIMA showed the best forecasting performance over the historical period with a MAPE value of 0.60%. The forecasting results of ARIMA indicate that China would not achieve sufficient reductions despite its projected emission peak of 96.3 hundred million tons by 2021. That is, the CO2 emission intensity of China will be reduced by 57.65% in 2030 compared with the 2005 levels. This reduction is lower than the government goal of 60–65%. This paper presents pragmatic recommendations for effective emission intensity reduction to ensure the achievements of the claimed policy goals.

1. Introduction

Copenhagen and Cancun United Nations Climate Conference reiterated the goal of global climate cooperation, that is, the increasing world temperature should be controlled below 2 °C. The claimed goal means that substantial commitments and efforts are needed to accelerate the arrivals of CO2 emission peaks and considerably reduce the global greenhouse gas (GHG) emissions. Global CO2 emissions should be halved by 2050 to achieve this goal, and the world should realise zero emissions by the end of this century [1]. Therefore, the concepts of ‘carbon reduction’, ‘decarbonised’ and ‘low carbon’, popularised by the Department of Trade and Industry of the UK in 2003 [2], have received substantial concerns worldwide. ‘Decarbonisation’ or ‘low carbon’ has been an indispensable component of sustainability [3,4]. ‘Low carbon’ indicates that socioeconomic development should minimise or avoid the reliance on carbon-based energy. The transitions in energy consumptions will contribute to the transformation of development patterns for achieving sustainability. This process is difficult because the stability and durability of the overall socioeconomic development must be guaranteed [5]. In the 21st century, most countries are seeking to transform the current carbon-intensive economy into a low carbon or decarbonised one.
Although the per capita emission of China only accounted for approximately one-third of that of the U.S. in 2009 [6], China has become the top carbon emitter surpassing the U.S. since 2007, considering the emission absolute values (Figure 1). The extraordinary emission of China is due to its tremendous socioeconomic size, thus becoming the world’s most populous country (e.g., 1.4 billion people), top developing country, the second-largest economy, the largest product exporter, the top energy consumer and the largest energy importer [6,7,8,9,10,11,12]. Substantial increases in carbon emission are widely recognised as an inevitable by-product of the low-efficient economic growth pattern of China [8]. China has made remarkable economic achievements, known as the ‘growth miracle’, over the last three decades [13,14], with a fast-paced growth rate (continuous 10% annual increase in its GDP as measured in real terms) [6,15]. However, the rapid economic growth leads to a substantially high level of energy consumption and CO2 emission per unit GDP because the export of China is highly reliant on the low value-added intermediate goods and processing trade [15]. In the mid- and long-term, China is expected to face sustainable pressures for carbon emission abatements because the undergoing urbanisation and modernisation will generate hundreds of millions of new middle-income individuals in the population, who will be subject to an energy-intensive and high-emission lifestyle [8,16]. Hence, China is expected to account for 31% of the world’s total emission by 2030 considering the premise of per capita emission emulating the OECD level [11].
From a global perspective, the extraordinary emission from China has largely moderated the reduction effects elsewhere, such as the large decline in the European Union and Japan [17]. Within the global governance framework, China is facing mounting pressures to deal with emission abatement appropriately. Determining sustainable ways to achieve low-carbon economic development whilst maintaining acceptable economic growth rates is imperative for China. As a response, the Chinese government announced an official target to reduce its carbon emission per unit of GDP from the 2005 levels by 40–45% and 60–65% of by 2020 and 2030, respectively.
However, goal setting is one thing, and implementing these goals is another. History has recorded various attempts by China to reduce carbon emissions, some of which failed to achieve their intended goals. For example, China has set out 20 environmental goals in the 10th Five-Year Plan (FYP) during 2000 and 2005. However, eight goals, approximately 40% in total, have not been achieved. Regarding GHG emission, sulphur dioxide and CO2 exceeded the emission control goals. For another example, as a flagship document for the 11th FYP, the State Council aimed to reduce energy consumption per unit of GDP by 20% from 2005 to 2010. Attaining this ambitious goal may indicate a carbon emission reduction of 1.5 billion tons [18]. The realisation of the policy objective again failed, demonstrating a mild reduction of 19.05%. In addition, China also pledged to double the per capita GDP by 2020 compared with the 2010 levels. This finding may imply the continuous increase in the total and per capita emissions [19].
Therefore, the feasibility of China fulfilling the 2030 target has gained growing interest. To the best knowledge of the authors, the feasibility of China meeting the CO2 emission reduction target has not been intensively forecasted and thoroughly discussed. The forecasting studies on this question through various model comparisons are few. Adopting four forecasting models, this paper aimed to forecast the carbon emission intensity trends of China by 2030 and examine the possibility of target achievements. The projection results regarding the realisation of the reduction goals based on past trends and current momentum will be compared and verified. Constructing optimal forecasts is meaningful to determine future impacts and key challenges because China is the top emitter responsible for 27.3% of global emissions, thus demonstrating a growing share [20]. Hence, the present study focused on forecasting the result validation. The research outcomes provide valuable references and supporting evidence for China to design the carbon emission control policy and action plans effectively.
This paper is organised as follows. Section 2 introduces the institutional background of the carbon emission abatement commitment of China. Section 3 provides the literature review. Section 4 presents the specifications and theories of the forecasting models. Section 5 describes the forecasting results of the four models and provides policy recommendations for effective emission reductions. Section 6 concludes the paper.

2. Institutional Background

The deterioration of domestic ecological environments has led to growing concerns on eco-protections from the Chinese government and the public. In 2006, China’s central authorities have decided to transform its economic development patterns to a sustainable, resource-saving, and low-carbon economy in the 11th Five Year Plan period. Low-carbon development has been recognized as a significant component in China’s future national strategic plan. The central government has instituted an impressive array of emission-control policies to promote low-carbon development (see Table 1). These policies mainly focus on renewable energy, energy saving, green infrastructure, low-carbon cities. The concept of ‘eco-civilisation’ was initially proposed in the 17th National Congress of the Communist Party of China in 2007. The institutionalisation of environmental considerations by formally embedding eco-civilisation into the political report of a party is a milestone [21].
The 12th Five-Year Plan set out obligation objectives for each province and municipality to reduce their carbon emission and energy use intensities (Table 2). This institutional arrangement is known as the ‘Target-Oriented Responsibility System’. The binding targets are decomposed from provincial levels down to various local levels. The State Council annually organised evaluations and appraisals on the achievements of energy-saving and emission-reduction targets of local governments. The pace and quality of emission reductions are included in the assessment of government performance. The poor performance induces an administrative accountability system for responsible officials. Therefore, emission reduction has become an important consideration for the performance and promotion of local elites. The ‘Target-Oriented Responsibility System’ shows the brute forces of the central government to promote carbon emission reduction. In the hierarchical government administrative system of China, this system is viewed as an effective way to enforce the implementation of emission reduction plans. Local governments are proactively implementing the low-carbon policies, supporting the new energy and renewable energy projects and experimenting with low-carbon city development [22,23].
The design of carbon emission reduction plans of most developed countries adheres to a ‘total quantity control’ strategy. For example, Canada pledged to reduce its greenhouse gas emissions in 2020 by 17% relative to the 2005 level; Japan announced to cut its greenhouse gases by 20% compared with 2013. These ‘total quantity control’ schemes aim to reduce absolute emission. As a developing country, China has adopted a different carbon emission reduction strategy based on ‘emission intensity control’. This strategy aims to control the carbon emission per unit of economic outcomes (i.e., GDP). Emission intensity control significantly differs from the total quantity control in that the overall emission amount may continue to increase despite the decline in the carbon emission intensity during the same period. China has announced an ambitious target of carbon emission control, that is, a 40–45% reduction of CO2 intensity by 2020 compared with that of the 2005 level [24]. This policy design aims to promote the coordinated relationship between the economic developments of China with environmental protection missions.

3. Literature Review

Substantial attention has been provided on modelling and forecasting the CO2 emissions of China since the Copenhagen Climate Summit. Different opinions and forecast results on the feasibility of China achieving its pledge on reducing CO2 intensity have emerged.
Uwasu et al. [25] believed that the target number in the pledge is feasible and compatible with the domestic agenda of China, which effectively balances socioeconomic development and energy securities [26]. The major challenge for achieving the target is the slowing down of the remarkable economic growth rate. Yuan et al. [27] considered that the reduction target is consistent with international expectations and domestic overarching socioeconomic development targets. The prediction results show that if the annual economic growth rate of China is maintained at 7% and 6% in the 12th and 13th FYP period, respectively, then achieving the 45% emission reduction target leads to 8600 million tons of annual CO2 emission by 2020. This value is close to 8400 million tons, which is the 450 ppm scenario of the United Nations Climate Change Conference (UNFCCC) for China.
Zhang [28] doubted whether China has sufficient capacities to fulfil this ambitious target, and deemed that the main obstacle is the considerable difficulties of ensuring the local government to implement the target-oriented policy incentives. Zhao and Mao [29] also believed that meeting the pledged target presents remarkable difficulties for China. Based on emissions from thermal power, which is the single largest sectorial emitter in China, Liu et al. [30] found that meeting the target is substantially difficult due to the extensive expansions of thermal power projects and the low-energy efficiency levels.
Existing literature regarding the carbon emissions of China can be grouped into two strands. The first is factor decomposition, which explores the determining factors of carbon emissions. For example, Zhang [31] is the first Chinese case to conduct factor decomposition by decoupling the increase in carbon emissions of China from economic development. Various methods, such as the Kaya identity [32], stochastic impacts by regression on population, affluence and technology [33,34], input–output analysis [35], logarithmic mean Divisia index (LMDI) [36], driver-pressure-state-impact-response, partial least square structural equation modelling [37] and Divisia [38], are widely adopted in current studies.
The second is modelling and forecasting carbon emissions. Auffhammer and Carson [39] predicted the CO2 emissions by 2010 through provincial panel data. These data are deemed to contain richer information regarding the CO2 emission path of China compared with the national aggregate level. The prediction suggests that the emissions of China would show a moderate growth trajectory with a slow increase rate by 2010. More importantly, the estimation results reject the existence of environmental Kuznets curves in China. As per China’s 2020 national goal for reducing CO2 emission intensity, Wang et al. [16] investigated the different means at provincial levels for achieving the emission reduction target assigned by the central government. Fujian proposed the expansion of nuclear power development; Anhui, as a coal-rich province, aimed to accelerate the GDP growth at a faster rate than energy consumption. Wang et al. [40] developed four forecasting models to predict the coal production of China from 2010 to 2015. After comparing the forecasting accuracy of these techniques, it adopted the p-value rolling discrete grey model (RDGM) as the best fitting model to predict the coal production of China from 2010 to 2015. Fan et al. [41] predicted the macroeconomic costs of CO2 emission reduction in China with the combined use of the multi-objective programming method and the input–output analysis. They found that CO2 emission mitigation is costly in an economic sense, ranging from 3100 RMB/ton to 4024 RMB/ton. The industrial sectors, including mining, petroleum, chemical and steeling, are CO2 emission-intensive industries, which are the most cost-effective areas for emission abatement.
Hossain et al. [42] forecasted the energy production, consumption and CO2 emission of China towards 2025 using the autoregressive integrated moving average (ARIMA) technique. Forecasting results suggest that the energy security of China will encounter serious challenges of almost 2985 Mtce of production deficiency by 2025. The CO2 emission will not reach a peak by 2025 due to a slowing increase rate. He et al. [43] predicted the energy requirements and CO2 emission of China from 2010 to 2020 based on the scenario analysis approach. The results show that carbon productivity will be gradually improved by 5.4% annually, whilst the CO2 intensity of GDP will be minimised by 50% than that prevailing in 2005. Forecasting is based on the assumption that China will conduct an ‘energy conversation and emission abatement first’ strategy by developing clean and renewable energy and performing economic restructuring. Yu et al. [44] predicted the primary energy demands of China until 2020 based on a nonlinear model. Three future scenarios were established on the basis of different combinations of the postulated population, the GDP structure, urbanisation rate and coal consumption weight. The findings show that annual growth in energy demand will range from 6.7% to 2.81% between 2010 and 2020 in the three scenarios. However, these prediction scenarios are rigid and idealised.
The main methods for modelling and forecasting the CO2 emissions of China are summarised in Table 3. The univariate forecasting techniques used in this study are unique and superior. These techniques possess the features of high accuracy and simplicity. Accuracy is the key criterion for forecasting models. Carbon emission intensity is jointly determined by complicated factors, including the internal sub-system and external environments, such as economic affluence levels, industrial structure, energy efficiency, energy consumption structure and technological [44]. Therefore, the accuracy of the emission modelling and forecasting is highly dependent on the appropriate and complete inclusion of determining factors. In the aforementioned literature, the key influencing factors of carbon emission have been fundamentally involved and discussed. However, the influencing factors selected in each study are diversified, which leads to remarkable differences in the processes and conclusions of carbon emission modelling and forecasting [28]. In addition, potential omitting factors may result in misleading conclusions. The four univariate models used in this study aim to achieve optimised matching models and obtain a high precision in forecasting. These estimations are only based on the time series data of the predicted objective without the inclusion of related influencing variables. This processing method not only overcomes the shortcomings of historical data shortage in CO2 emission-related variables but also avoids the ‘contaminated influence by multitudes of complicated factors’ [30].

4. Research Method and Data

4.1. Data

This research developed a decision-supporting system to forecast the carbon emission intensity in China. After a comparative analysis of five widely used short-term load forecasting techniques, Moghram and Rahman [51] concluded that no best solution is available for each system idiosyncrasies. Model efficiency under specific conditions should be examined and compared, and improvements should be made on the basis of knowledge derived from the model analysis for improved accuracy [52]. Particularly, the immediate policy implications considering the time span were emphasised because the current emission-related issues (not only carbon but also other air pollutants) have caused serious concerns regarding public health in China. Hence, this study performed a comparative study to find the best-fitting forecasting technique for the emission intensity trends of China by 2020.
The forecasting techniques, including the autoregressive integrated moving average (ARIMA) model and three grey system theory-based models (the traditional grey model (1,1) (GM), the discrete grey model (DGM) and the rolling discrete grey model (RDGM)), were employed to reduce the latest emission intensity data of China from 1990 to 2018. However, the carbon emission intensity data of China had not been officially reported by the Chinese government or international institutions (Yuan et al., 2012). As previously mentioned, the Chinese government announced an official target to reduce carbon emissions by 60–65% by 2030 relative to the 2005 baseline, as measured by per unit of GDP. According to the clearly defined policy target and consensus-related policy reports and literature [30,53], this study estimates the carbon intensity according to the following equation:
Carbon   Intensity = Carbon   Emssions GDP
Annual data regarding the GDP and GDP index of China were sourced from the CEIC Database (Additional details on the website: http://www.ceicdata.com/countries/china), and CO2 emissions data were obtained from the BP Statistical Review of World Energy 2019 workbook (The statistical consensus can be accessed on the website: http://www.bp.com/en/global/corporate/energy-economics/statistical-review-of-world-energy/2019-in-review.html). The GDP was firstly deflated by taking the GDP in 1990 as 100. The raw data were converted to a logarithmic scale to minimise heteroscedasticity. Table A1 in the Appendix A shows additional information on the raw data. The following procedure was performed to test for the stationarity of the time series da ta.

4.2. Forecasting Models

4.2.1. ARIMA

The ARIMA model, which was initially presented by Box and Jenkins [54], gained increasing popularity over the last four decades. Some researchers regard ARIMA as the ‘most versatile linear model for forecasting time series’ [55]. The ARIMA technique is a univariate approach. Unlike the classical regression models, ARIMA is not based on the causal relationship between the endogenous and exogenous variables and is independent of economic theory. ARIMA describes the development of the explained variable through its own past values without considering exogenous influences. The development of the variable over time is considered a stochastic process, which is dependent on random influences. The general form of different versions of ARIMA is shown as ARIMA (p, d, q), where p represents the order of auto-regression, d stands for the degree of differencing and q indicates the orders of the moving average.

4.2.2. GM (1,1)

The grey system theory was firstly proposed by Deng [56]. The grey system models, such as GM, DGM and RDGM, have the unique advantage of predicting with a small sample size, discrete and limited information [30]. The equations are expressed as follows.
Assume a non-negative series x ( 0 ) , where:
x ( 0 ) = { x 1 ( 0 ) ,   x 2 ( 0 ) ,   ,   x T ( 0 ) } ,
where   x k ( 0 )     is   the   datum   at   kth   time   and   T   is   the   total   number   of   modelling   data . In this paper,   x ( 0 )   is   the CO2 emission intensity of China, which spans from 1965 to 2014.
Let x ( 1 ) denote the One order Accumulated Generating Operation (1-AGO) series of x ( 0 ) with the following form:
x ( 1 ) = { x 1 ( 1 ) ,   x 2 ( 1 ) ,   a ,   x T ( 1 ) } ,
and x k ( 1 ) is derived as follows:
x k ( 1 ) = i = 1 k x i ( 0 ) ,   k = 1 ,   2 ,   ,   T .
A first-order differential equation is then fitted to the grey series, x t ( 1 ) , and is written as follows:
d x t ( 1 ) d t + β 1 x t ( 1 ) = β 0 ,
where the parameter β 1 is called the developing coefficient, and β 0 is named the grey input. This equation has the corresponding time response series:
x ^ k + 1 ( 1 ) = ( x 1 ( 0 ) β 0 β 1 ) e β 0 k + β 0 β 1 ,   k = 1 ,   2 ,   ,   T 1 ,
and the restored value series:
x ^ k + 1 ( 0 ) = x ^ k + 1 ( 1 ) x ^ k ( 1 ) = β 1 ( x 1 ( 0 ) β 0 β 1 ) e β 0 k ,   k = 1 ,   2 ,   ,   T 1 .

4.2.3. DGM

DGM (1,1) involves the combined use of discrete and continuous equations for estimating parameters and forecasting. However, the procedure of transiting the discrete equation to the continuous equation may lead to errors in the forecasting results [57]. The GM method was proposed in this section to solve the traditional problem of GM (1,1), in which the summation results are sensitive to iterative data values, and improve the tendency-catching capability [52,58].
The equation is:
x k + 1 ( 1 ) = β 1 x k ( 1 ) + β 0
and is named the ‘discrete grey model (DGM)’. As mentioned above,   x ( 1 ) denotes the 1-AGO series of x ( 0 ) and x ( 0 )   is   China’s CO2 emission intensity.
If β ^ = ( β 1 ,   β 0 ) T is a sequence of parameters, set the matrix Y and B as follows:
Y = (   x 2 ( 1 )   x 3 ( 1 )   x T ( 1 ) ) ,   B = ( x 1 ( 1 ) 1 x 2 ( 1 ) 1 x T 1 ( 1 ) 1 )
then the least squares estimate sequence of the grey differential equation x k + 1 ( 1 ) = β 1 x k ( 1 ) + β 0 satisfies β ^ = ( B T B ) 1 B T Y where Y = B   β ^ .
It can be proved as this: we substituted all data values into the grey differential equation:
x k + 1 ( 1 ) = β 1 x k ( 1 ) + β 0
Which gives that
x 2 ( 1 ) = β 1 x 1 ( 1 ) + β 0   x 3 ( 1 ) = β 1 x 2 ( 1 ) + β 0  
x T ( 1 ) = β 1 x T 1 ( 1 ) + β 0 that is, Y = B β ^ = B ( B T B ) 1 B T Y for the evaluated values of β 1 and β 0 , and substitute x k + 1 ( 1 ) , k = 1 , 2 ,   , T 1 with β 1 x k ( 1 ) + β 0 , which gives the error sequence ε = Y B β ^ . Let S = ε T ε = ( Y B β ^ ) T ( Y B β ^ ) = k = 1 T 1 ( x k + 1 ( 1 ) β 1 x k ( 1 ) β 0 ) 2 .
The value of β 1 and β 0 make S minimum and should satisfy:
{ S β 1 = 2 k = 1 T 1 ( x k + 1 ( 1 ) β 1 x k ( 1 ) β 0 ) x k ( 1 ) = 0 S β 0 = 2 k = 1 T 1 ( x k + 1 ( 1 ) β 1 x k ( 1 ) β 0 ) = 0
Solving the equations, we then get:
β 1 = k = 1 T 1 x k + 1 ( 1 ) x k ( 1 ) 1 T 1 k = 1 T 1 x k + 1 ( 1 ) k = 1 T 1 x k ( 1 ) k = 1 T 1 ( x k ( 1 ) ) 2 1 T 1 ( k = 1 T 1 x k ( 1 ) ) 2
and:
β 0 = 1 T 1 [ k = 1 T 1 x k + 1 ( 1 ) β 1 k = 1 T 1 x k ( 1 ) ]
From Y = B β ^ , it follows that:
B T B β ^ = B T B ( B T B ) 1 B T Y = B T Y
However:
B T B = ( x 1 ( 1 ) 1 x 2 ( 1 ) 1 x T 1 ( 1 ) 1 ) T ( x 1 ( 1 ) 1 x 2 ( 1 ) 1 x T 1 ( 1 ) 1 ) = ( k = 1 T 1 ( x k ( 1 ) ) 2 k = 1 T 1 x k ( 1 ) k = 1 T 1 x k ( 1 ) T 1 )
( B T B ) 1 = 1 ( T 1 ) k = 1 T 1 ( x k ( 1 ) ) 2 [ k = 1 T 1 x k ( 1 ) ] 2 × ( T 1 k = 1 T 1 x k ( 1 ) k = 1 T 1 x k ( 1 ) k = 1 T 1 ( x k ( 1 ) ) 2 )
and:
B T Y = ( x 1 ( 1 ) x 2 ( 1 ) 1 1 x T 1 ( 1 ) 1 ) (   x 2 ( 1 )   x 3 ( 1 )   x T ( 1 ) ) = ( k = 1 T 1 x k ( 1 ) x k + 1 ( 1 ) k = 1 T 1 x k + 1 ( 1 ) )
Therefore:
β ^ = ( B T B ) 1 B T Y = 1 ( T 1 ) k = 1 T 1 ( x k ( 1 ) ) 2 [ k = 1 T 1 x k ( 1 ) ] 2 ( ( T 1 ) k = 1 T 1 x k ( 1 ) x k + 1 ( 1 ) k = 1 T 1 x k ( 1 ) k = 1 T 1 x k + 1 ( 1 ) k = 1 n 1 x k ( 1 ) k = 1 n 1 x k ( 1 ) x k + 1 ( 1 ) + k = 1 n 1 x k + 1 ( 1 ) k = 1 n 1 ( x k ( 1 ) ) 2 ) = k = 1 T 1 x k + 1 ( 1 ) x k ( 1 ) 1 T 1 k = 1 T 1 x k + 1 ( 1 ) k = 1 T 1 x k ( 1 ) k = 1 T 1 ( x k ( 1 ) ) 2 1 T 1 ( k = 1 T 1 x k ( 1 ) ) 2 × 1 T 1 [ k = 1 T 1 x k + 1 ( 1 ) β 1 k = 1 T 1 x k ( 1 ) ] = ( β 1 ,   β 0 ) T
Assuming that B, Y and β ^ are the same as above, that is, β ^ = ( β 1 ,   β 0 ) T = ( B T B ) 1 B T Y , then the following holds true.
(1) Set x 1 ( 1 ) = x 1 ( 0 ) , then the recursive function is given by
x ^ k + 1 ( 1 ) = β 1 k x 1 ( 0 ) + 1 β 1 k 1 β 1 β 0 ,   k = 1 ,   2 ,   ,   T 1
x ^ k + 1 ( 1 ) = β 1 k ( x 1 ( 0 ) β 0 1 β 1 ) + β 0 1 β 1 ,   k = 1 ,   2 ,   ,   T 1
(2) The restored values of   x k + 1 ( 0 ) can be given by
x ^ k + 1 ( 0 ) = x ^ k + 1 ( 1 ) x ^ k ( 1 ) = ( x 1 ( 0 ) β 0 1 β 1 ) ( β 1 1 ) β 1 k 1 ,   k = 1 ,   2 ,   ,   T 1

4.2.4. RDGM

The passing of time leads to the random perturbation factors affecting the grey system. Addressing system disturbance actors and updating the entire simulation system by adding new data whilst removing old data to continue the model development process is important to enhance the accuracy of forecasting values.
The RDGM model integrates the advantages of the traditional DGM to the data series. Thus, the series maintains a dynamic equal dimension with the removal of the oldest data and the addition of new data. A new DGM model is established to predict the next value and the results are added to the original series. The process mentioned above is called iteration. The iteration is conducted until the forecasting objective or the level of forecasting precision is achieved.

5. Research Findings

5.1. Evaluation of Forecasting Performance

In the forecasting competition related to CO2 emission trends, two loss functions were regarded as the criteria to estimate the forecasting performance: mean absolute percentage error (MAPE) and residual error [52]. The expression of the two loss functions is shown as follows:
e k = | x k ( 0 ) x ^ k ( 0 ) x k ( 0 ) | × 100 % ,
M A P E = 1 T k = 1 n | x k ( 0 ) x ^ k ( 0 ) x k ( 0 ) | × 100 % ,
where x k ( 0 ) denotes the CO2 emission intensity of China at kth time from 1965 to 2014 , x ^ k ( 0 ) is the predicted value of x k ( 0 ) and T refers to the total number of modelling data.
The residual error approach is inaccurate because the measure precision is sensitive to the original data. The MAPE is widely selected in forecasting literature as the basic criteria for evaluations [30,59]. The MAPE denotes the differences between the forecasted and the original series. The absolute values of MAPE are used in this study as the evaluation criteria because the magnitudes of errors were more important than the directions of errors. The forecasting model with the lowest MAPE value indicates the best-performing model with the lowest forecasting errors.

5.2. Selection of Appropriate Training Interval

The grey prediction model has the advantages of processing small sample data. The traditional grey prediction model is based on the observation data. However, an increasing number of studies argued the following: the old data cannot accurately reflect the current trend and its contribution to the prediction capability of the model is relatively low; by contrast, the recent data containing a considerable amount of the latest information is important to the prediction of the future situation [40,60]. Therefore, selecting the appropriate continuous data segment from the sample data is crucial to improve the accuracy of the grey prediction model [61]. The number of interval data is also called the number of points [62], which is used to capture the latest trend to construct the grey prediction model. The specific method of selecting the optimal number of points is as follows.
For x ( 0 ) = ( x 1 ( 0 )   ,   x 2 ( 0 )   , , x n ( 0 )   ) , l -point rolling ( 4 l n 1 ) can be excised on x ( 0 ) by using x i ( 0 )   ,   x i + 1 ( 0 )   , , x n + l 1 ( 0 )   ( i + l n ) to construct a GM (1,1) and then using x n + l ( 0 )   to test it at a time.   MAPE l corresponding to the l -point can be computed as follows:
M A P E l = 1 n l k = l + 1 n | x k ( 0 )   x ^ k ( 0 )   | x k ( 0 )   × 100 % .
The most suitable point v is the l-point that can lower the MAPE:
v = arg   min l   MAPE l .
After the above steps are completed, the results show that the error of the model measured by MAPE significantly decreased with the reduction in the number of points (Table 4). The MAPE of the GM (1,1) model based on 15 points was 6.99% and decreased to 1.58% when the number of points decreased to 4. Four points can remarkably improve the accuracy of the model. Therefore, the nearest four data intervals for the GM (1,1), DGM and RDGM models were used for model fitting and prediction. The predications of the GMs have uncertainties, which are criticised by many people. However, this study could avoid this problem by using a rolling mechanism to select the training data. Table 5 shows the residual rate of 25 predictions of CO2 intensity based on a four-data training interval from 1994 to 2018, and all the residual rates were less than 5%, amongst which the largest was 4.73%. Therefore, assuming that the residual rate of the next prediction with four sample sizes is less than 5% at a significant level of 1% is reasonable.
According to the principle of the number of points, the data interval length of the three GM tests and forecasts was the same, but the data years were different. ARIMA is a model based on a large number of samples that must contain as much historical data as possible. Table 6 shows the selection details of specific data ranges.

5.3. Comparisons of Prediction Accuracy of Different Forecasting Models

The forecasting aims to estimate the future trend of the system by identifying the relationships among the historical data. The current trend of China’s carbon emission intensity can be expected as a gradual downturn according to the historical relationship between emission and economic development. Thus, a GM was used as the first benchmark model for forecasting the carbon emission intensity trend. The benchmark model was extended with a particle swarm optimization (PSO) algorithm by estimating an optimal parameter and reducing the convergent error to the minimum to enhance the prediction accuracy of the model. The results of the two improved GMs (DGM and RDGM), together with the classical ARIMA model result, are thus presented.
The sample data of China’s CO2 emission intensity were from 1990 to 2018. Firstly, the data from 2013 to 2016 were selected as the testing data to forecast the values from 2017 to 2018 through three GMs. The ARIMA model needed a large number of samples. Thus, the CO2 emission density during the period 1990–2016 was used to fit the model, and the data from the period 2017–2018 were also utilised as the test interval of the model. The derived forecasting values were compared with real observation data from 2017 to 2018 to measure the precision of each model. The MAPE values of the four forecasting models are presented in Table 7. The test values of DGM and RDGM suggest their slight superiority to the GM (1,1). These models increased their MAPE by 0.02% and 0.01% relative to the MAPE values of the GM (1,1) (i.e., 1.70%). However, the ARIMA significantly improved the benchmark GM (1,1) model. The proposed forecasting procedure using ARIMA led to a 1.10% reduction in the average MAPE. The MAPE value for the ARIMA was 0.60%. Hence, the ARIMA, which yielded the lowest MAPE (0.60%), provides the most accurate forecast results in the four models. With the highest estimation fitness, the RDGM forecasts that carbon emission intensity from 2017 to 2018 averaged annually at 0.5874 tons per 10 thousand RMB. This value was close to the actual value of 0.5908 tons per 10 thousand RMB. For the three other models, the forecasted carbon emission intensity in the same period averaged at 0.5808 tons per 10 thousand RMB for the GM (1,1) and the RGDM and 0.5809 tons per 10 thousand RMB for the DGM. Figure 2 displays the detailed results. Table 6 shows that ARIMA is the best-fitted model with the highest precision and the lowest residual percentages for forecasting Chinese CO2 intensity, which is closely followed by the GM (1,1), RGDM and DGM.

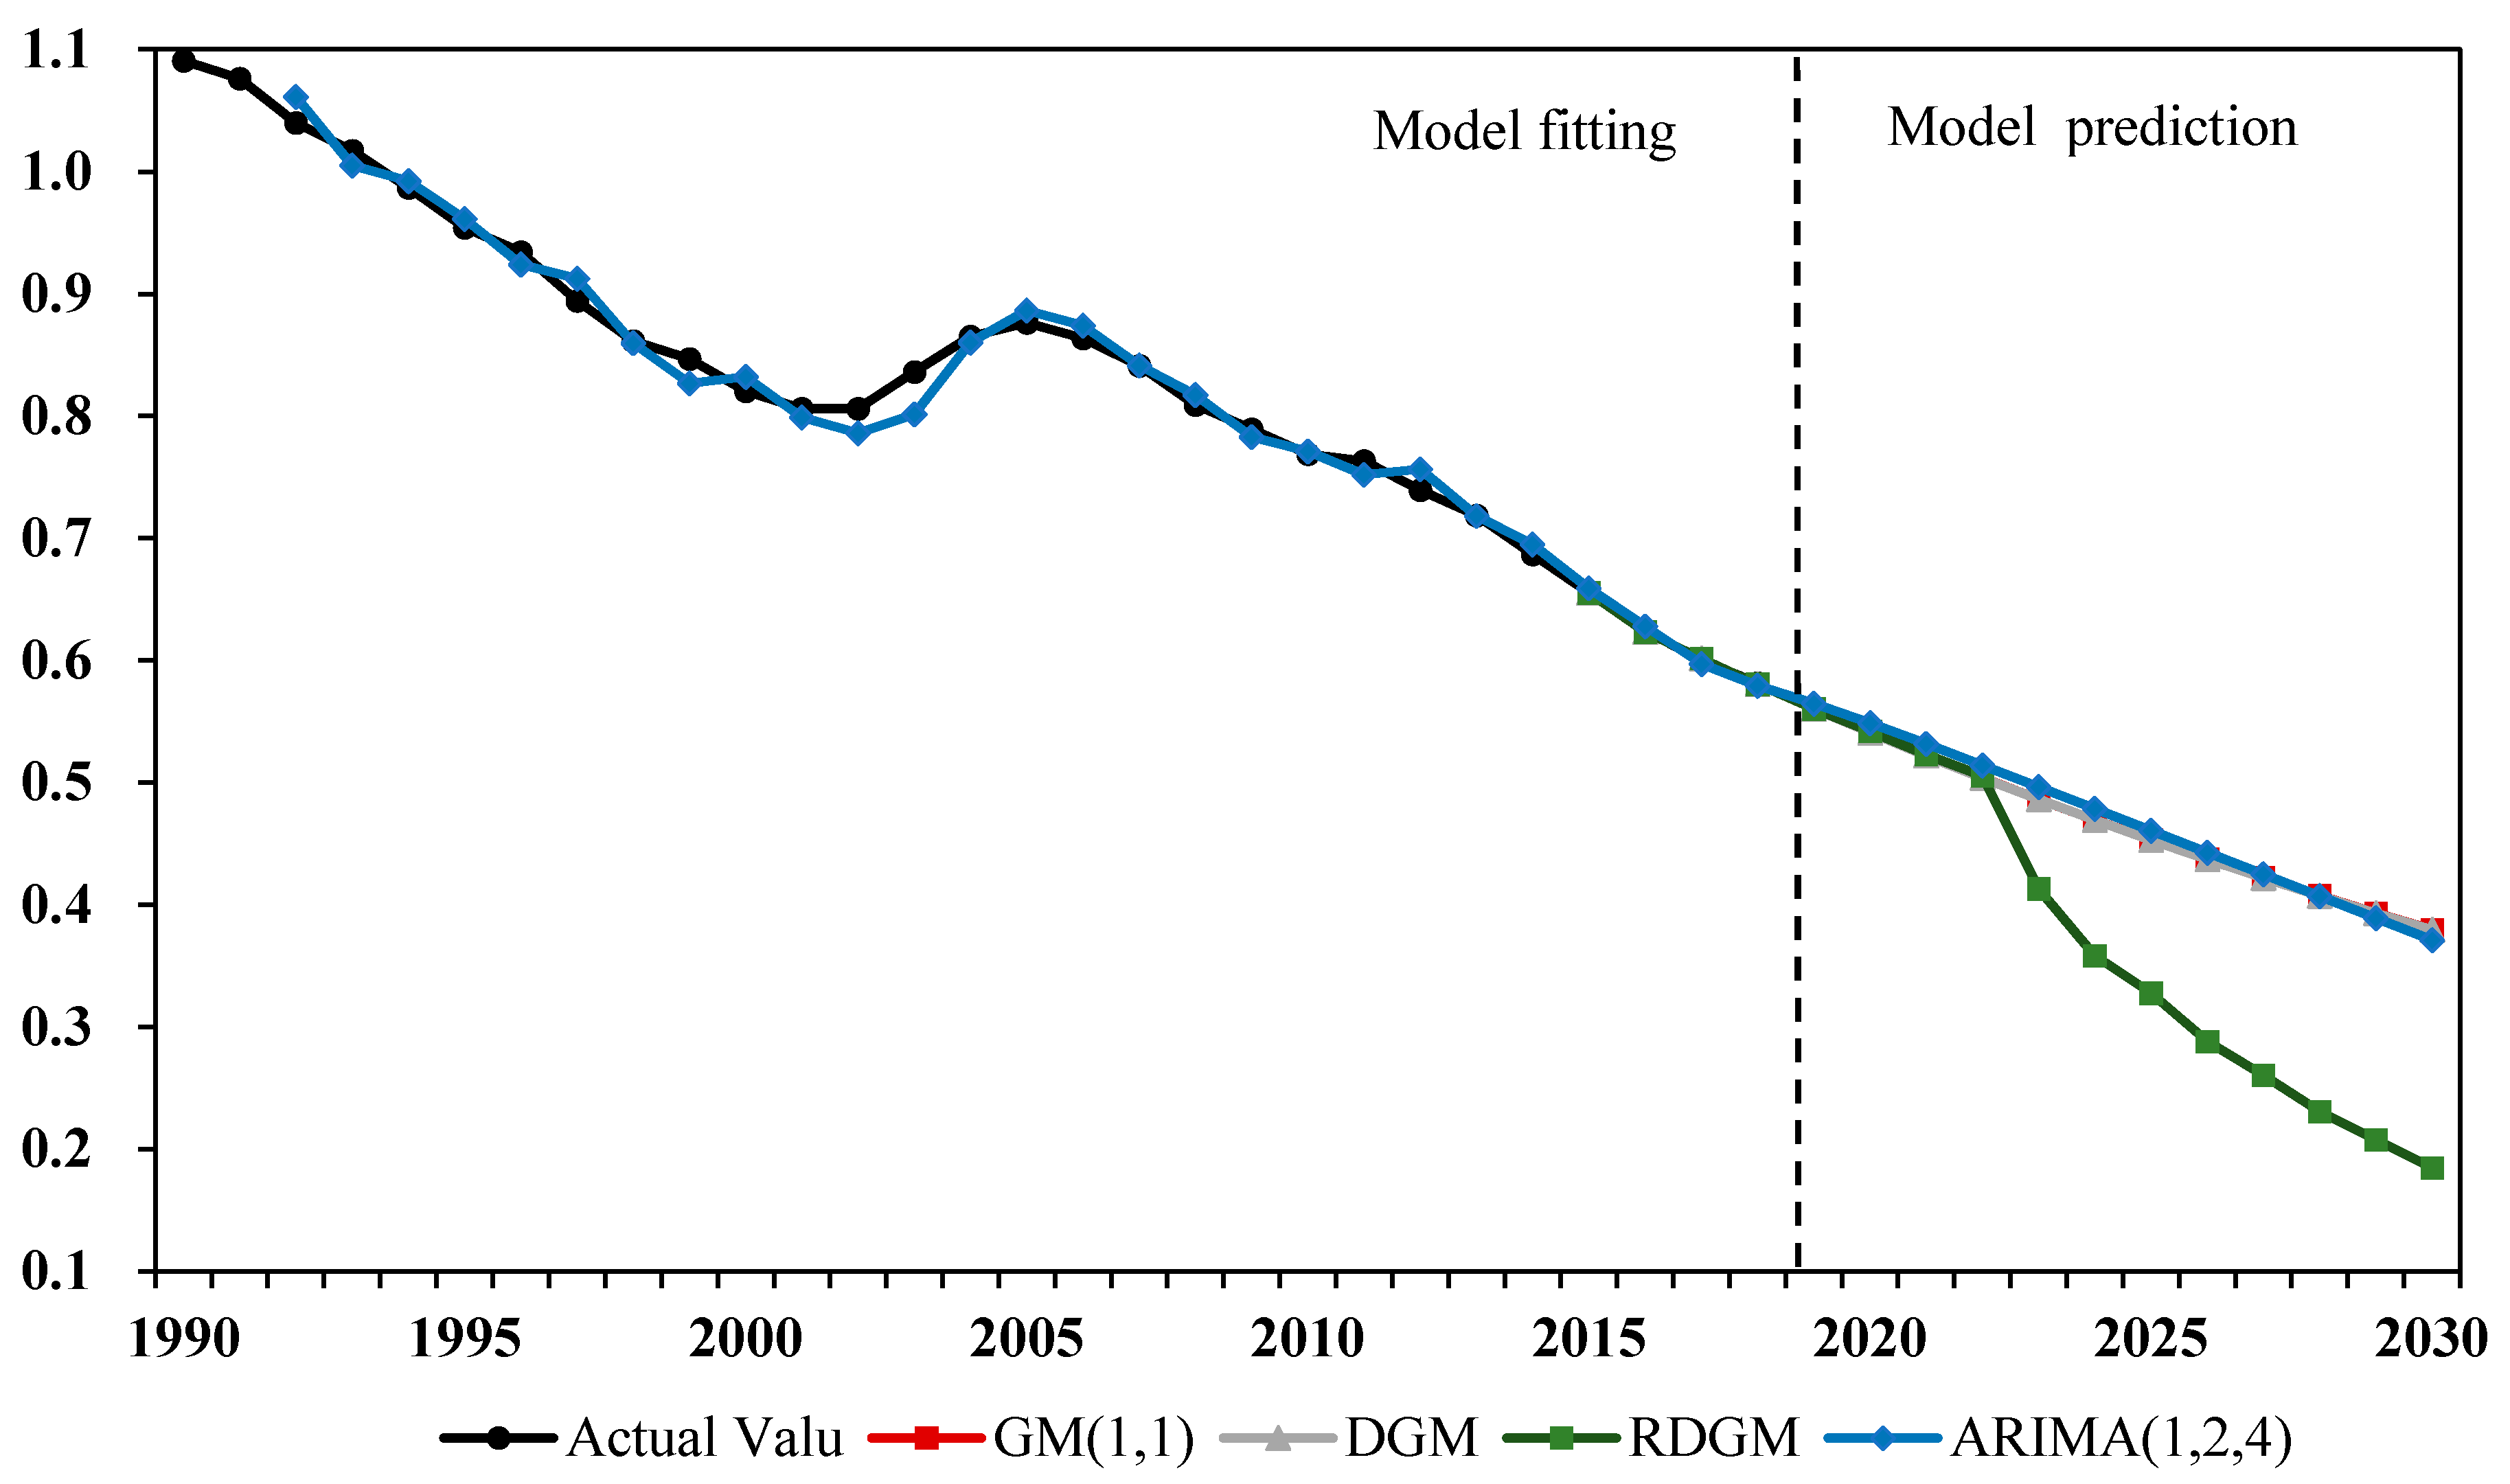
5.4. Prediction of CO2 Emission Density in 2019–2030

The ARIMA model is a typical model used to predict time series data. The predication results in Table 7 indicate that the ARIMA model shows a better prediction performance than the three other GMs. However, the prediction results of the GM (1,1), DGM and DRGM models reflect the trend of data changes within an acceptable range of error. Therefore, fully considering the estimation results of the four models is important to ensure the prediction accuracy. This study performed two steps for the prediction of carbon emission density in 2019–2030. Firstly, the GM (1,1), DGM and RDGM models used the 2015–2018 data as the training interval and the ARIMA model employed the 1990–2018 data as the training interval for the model fitting. Secondly, the CO2 emission density of China over the next 12 years was predicted. Table 8 and Figure 2 display the prediction of CO2 emission density in 2019–2030, and Table 9 estimates the future emission reduction of China based on the predicted results.
The prediction results of the GM (1,1), DGM, RDGM and ARIMA models arrived at similar conclusions: China will reduce its carbon emission intensity towards 2030, and the reduction will be remarkably slow to fulfil the intended objective.
The GM (1,1) and DGM models derived similar prediction results. The GM (1,1) model predicted that the CO2 density (0.3796) of China in 2030 will be reduced to 0.4966 tons per 10 thousand RMB, which is lower than 0.8762 in 2005. This finding indicates a remarkable decrease rate of 56.68%. The result of the DGM model predicted that the CO2 emission density of China in 2030 will be 0.3793 tons per 10 thousand RMB, a decrease of 56.71% compared with that in 2005. However, the prediction of the RDGM model was different from that of the two previous GMs. The RDGM model predicted that the CO2 emission density of China in 2030 will be 0.1847 tons per 10 thousand RMB, which is equivalent to one-fifth of that in 2005: a decrease rate of 78.93%. However, the ARIMA (1,2,4) model predicted that the emission density of CO2 in 2030 will be 0.3711, which is 57.65% lower than that in 2005 (lower than the minimum target of 60%). In addition, the four models projected that the unit carbon emission in 2020 was less than 40% than that in 2005, and the Chinese government may not achieve the minimum target of unit carbon emission in 2020. ARIMA (1,4,2) predicted the lowest carbon emission reduction (37.37%), whilst the most optimistic prediction was derived by DGM (38.28%). By 2021, the GM (1,1), DGM and RDGM models predicted a relative reduction of 40.42%, 40.43% and 40.32%, respectively, compared with that in 2005, whilst the ARIMA (1,4,2) model predicted a reduction of 39.31%. The ARIMA (1,4,2) model predicted that the CO2 emission density in the current year until 2022 will be reduced by more than 40% compared with that in 2005. Therefore, the 2020 and 2030 emission reduction targets are considerable challenges for China.
The prediction aimed to test the feasibility of the two policy targets. Firstly, whether China can achieve the goal of a 60–65% reduction of CO2 emission intensity by 2030 compared with that of the 2005 baseline level. Secondly, whether the CO2 emission of China will reach its peak by 2030. Figure 3 depicts the CO2 emissions in 1990–2018 and the projections based on the data spanning the period between 1990 and 2018. The CO2 emissions since 1990 maintained a rising trend, whilst growth rates remarkably varied in different stages. CO2 emissions before 2013 rapidly and sensationally increased. However, the growth rate of emissions after 2013 slowed down and became negative in 2013, 2014 and 2015. ARIMA showed the best forecasting performance over the historical period. The forecasting results of ARIMA indicated that the annual CO2 emissions from 2016 to 2020 slightly increased at a relatively low growth rate and will reach their peak in 2021. The CO2 emissions in 2030 will be decreased to 9.07 billion tons. Therefore, realising the goal of peaking CO2 emissions is possible.
Local officials had more interest in economic growth goals than environmental protection goals due to the GDP-based criteria for political promotion. High-energy consumption and power in the period, particularly since 2002, were the main inhibitors for these environmental protection goals. For example, the energy consumption of China in 2005 expanded to 2.2 billion tons standard coal, considerably exceeding the 1.5 billion tons predicted by the Chinese Academy for Environmental Planning. Thermal power generation is the single largest coal consumer and emitter/contributor of sulphur dioxide [30].
The growth model of China is associated with increasing environmental costs, such as resource depletion and pollutant emission, despite its substantial economic benefits [63,64]. Maintaining the previous ‘pollution first, governance next’ model is not economically sustainable because the costs of pollution borne by all citizens could be higher than the gains from the national income growth. Thus, an incentive structure of local cadres should be arranged to evaluate their performance with sustainability goals to promote the awareness of an environment-friendly economy. Extending the tenures of local officials, providing additional resources and encouraging public participation through the opening up of additional channels for compliance monitoring may be ways to promote the long-term local realisations of governments regarding the sustainable growth path [65].
The government has already realised the institutional barriers and proposed revised criteria for evaluating the performance of local government officials. Sustainable and inclusive goals, such as promoting equity through structural reform, fostering technological capacity and innovation and enhancing social security systems, are included [65]. In particular, the Chinese leadership has shown its strong commitments to green and low-carbon development [65]. However, achieving the commitment may be a long and difficult journey for various reasons: the increasing ownership of private cars has been observed over the last decade, leading to rising urban planning and transport congestion problems; rapid property market developments over the last two decades have markedly enhanced the level of embodied carbon emission in the building sector; and energy consumption structures considerably influence CO2 emission intensities. Traditionally, China has been highly dependent on carbon-intensive and non-renewable energy. Major fuel generally includes coal and oil. The tradition of coal as a major energy consumption for heating in northern China cannot be changed overnight. Non-renewable energy cannot be rapidly replaced by renewable ones in the future. Thus, the coal output of China is expected to continue to remain high due to rapid economic growth, infrastructure construction and industrial upgrading [40]. Some projections also suggested that updating and substituting the existing energy infrastructure will take at least 60 years [40]. Therefore, the anticipated trend of emissions is stable and remains ascendant in the short- and mid- term. However, the proposed models considering carbon intensity emission revealed a declining pattern in the coming years.
Considering influential literature references, such as the World Energy Outlook, and conference reports, such as the 2015 Paris Climate Conference (COP 21) and COP22 in Marrakech, a plausible combination of strategy and policy approaches is suggested to achieve the emission intensity goal of 2030 in successive steps.
(1) Carbon pricing
The implementation of carbon pricing, either through cap-and-trade schemes or carbon taxes, should be accelerated to carbon offsets. For example, China has established regional trading schemes in seven pilot cities, and the Chinese government is planning to coverage carbon prices at the national level.
(2) Sectoral agreements
Sectoral agreement refers to using a quantity-based policy instruments to limit the emission from a specific industry. In recent decades, the build-ups of infrastructure led to notable emission increases from several energy-intensive industries, such as steel, cement and glass. The energy demand from these sectors is projected to decline by 2040, reducing the industrial coal use of China (IEA, 2016). The sectoral agreement should be implemented in the emission-intensive industries to the curb emission increase because the energy use in these industries has passed the high points and also because pf the commitment of China to reduce excess production capacity in key sectors.
(3) National policies and standards
These measures are legislated at the national level with forcible powers to pursue the national policy objectives, such as mandatory building code standards, vehicle emission standards and appliances labelling. China has pledged in the US–China Climate Change Cooperation Agreement that half of the new buildings would fulfil the green standard by 2030. The implementation of these policies is necessarily important for emission abatements in the building, transport and industrial sectors, which are of remarkable potential for China to receive emission abatement returns.
(4) Adjusted resource pricing
The energy-pricing system of China should be reformed to a market-orientated mechanism. Subsidies for residential energy use, particularly fossil-based energy, should be reduced and costs of energy should be raised to foster environmental consciousness and improve energy use behaviour.
(5) Adjustment of energy structure to clean systems
Restructuring the energy mix should be accelerated to achieve the policy target. The 450 Scenario sets out a clear energy transition model to achieve the target of controlling the long-term global temperature rise below 2 °C by limiting the GHG concentration in the atmosphere to around 450 parts per million of CO2. According to the 450 Scenario, renewable energy is planned to contribute to almost 60% of power generation by 2040, nearly half of which comes from wind and solar power [66], providing important implications for China. The decarbonisation of the power industry should be a vital component for limiting carbon emission intensity.
China remains the top coal market, accounting for almost half of the world’s total coal consumption in 2035. However, the proposition of coal use in power generation is projected to decline from 75% to 45% by 2040; the continuing economic transitions notably slow down the demand for coal and energy of China [67]. China is expected to maintain its position as the leading source of growth in the deployment and commercialisation of renewables over the future 20 years [67]. For instance, the largest expansion and deployment of nuclear and solar photovoltaics are spurred in China [66]. The nuclear expansion scheme of China has an annual growth rate of 11% (averaged at 1100 TWh), accounting for 75% of the world’s total increase in nuclear generation. China is also emerging as the second-largest shale gas supplier, only second to the U.S. [67].
In addition to the deployment and commercialisation of clean energy systems, investments in improving grid connectivity and production-side efficiencies are vital components for energy restructuring.

6. Conclusions

China is undertaking committed efforts to accomplish the claimed 2030 emission intensity abatement and emission peak targets. Balancing socioeconomic development with CO2 emissions abatement is vitally important because China is in the process of industrialisation, urbanisation and modernisation and will continue to be so over the next two to three decades. Forecasting has significant implications for strategic and action planning for China’s target-oriented policy incentives on CO2 emission abatement. This paper forecasts the trends of CO2 emissions, identifies the key challenges and provides recommendations for policy ratification. This paper compared the prediction precisions of four forecasting models, namely the ARIMA, GM, DGM and RDGM, models based on annual national data from 1990 to 2018.
This study revealed several important findings.
(1) ARIMA is a robust forecasting model with high accuracy. According to the accuracy measurable indicator of MAPE, the forecasting performances of the four forecasting models were good, demonstrating MAPE values lower than 2%. ARIMA showed the best forecasting performance over the historical period with the MAPE value of 0.60%.
(2) Four forecast models arrived at a consensus that the CO2 emission intensity will maintain a clear declining trajectory from 2019 to 2030. Specifically, the carbon emission intensity in 2030 is projected to decrease to the range between 0.19 and 0.39 tons per thousand RMB from 0.58 tons per thousand RMB in 2018. Moreover, the reductions in CO2 emission intensity by 2030 will range from 56.68% by GM (1,1) to 78.93% by RDGM compared with the 2005 baseline.
(3) The claimed target of the 2030 CO2 emission intensity reduction is a relatively difficult task for China. Forecasted results from ARIMA, which is the best-fitted model, are 0.371 tons per thousand RMB. This result indicates a reduction rate of 57.65% in 2030, which is less than the lower limit of the claimed target (60%) and largely behind the upper limit of 65%. However, China is projected to reach the peak of CO2 emission around 2021.
The implications of the research findings are as follows. The forecast results provide valuable reference for the Chinese government to consummate the strategies and action plans to promote the achievement of carbon emission reduction goals by 2030. Specifically, according to the predicted trend of carbon emissions, the possibility that China cannot achieve its declared carbon emission reduction target by 2030 is high. The Chinese government must make increased efforts and adopt effective policies to promote energy conservation and emission reduction. An imperative array of measures covering economic restructuring, energy efficiency improvement, carbon technology advancements and the development of carbon trading markets, are strongly recommended to ensure the achievements of the claimed target. Measures to assure the achievement of the policy target by 2030 are thus multifaceted: (i) promote the social awareness of a low-carbon economy and environmental protection; (ii) upgrade the industrial structure of China to high-end manufacture; (iii) enhance energy efficiency through energy consumption restructuring; (iv) strengthen the enforcement of environmental protection legislation and compliance; (v) accelerate the development of a carbon sink; (vi) turn green development into growth opportunities; and (vii) broaden the scope of the clean development mechanism. These measures are also critical for China to hasten the arrivals of the GHG emission plateau by 2030. Supportive institutional arrangements, advancements in low-carbon technologies, industrial restructuring and the cultivations of a low-carbon lifestyle are the key areas for China to attain the claimed target of CO2 emission reduction [68].
The contributions of this study lie in the following aspects. (i) This study was the first to propose the usage of GM, DGM, RDGM and ARIMA methods in an integrative modelling framework to predict CO2 emissions. Moreover, this study enriches and expands CO2 emission prediction methods and empirical findings. (ii) Through the principle points, this study overcomes the problem of a high degree of uncertainty, which is a common challenge in traditional grey forecast models. On this basis, the forecasting performance of the ARIMA model and the three grey forecast models is compared. This comparison improved the accuracy and reliability of the forecast results.
Although the models constructed in this paper show good forecast performance for CO2 emissions in China, this paper has some limitations, which form promising themes for future research. Particularly, under the business-as-usual scenario, this study predicts whether CO2 emissions will peak in 2030 and whether the reduction of CO2 emission density in 2030 will achieve the declared policy target. However, the future economic growth rate and the environmental policies exert considerable effects on the CO2 emissions and emission density. Therefore, scenario analysis in future research is a promising strategy to explore and disentangle the different trends of CO2 emissions and emission density under different socioeconomic and political circumstances.

Author Contributions

Y.L., Funding acquisition, Methodology, Software, Writing—original draft;Funding; Y.W., Data curation and formal analysis, Writing—original draft; Z.D. (Corresponding author), Conceptualization, Funding acquisition, Resources, Writing—review and editing; Qiongqiong LI, Writing—review and editing. All authors have read and agreed to the published version of the manuscript.

Funding

The authors are grateful for the financial support from the China National Social Sciences Fund (No. 15CGL077), MOE (Ministry of Education in China) Project of Humanities and Social Sciences (No. 18YJC840041), National Natural Science Foundation of China (No. 71904009), the Postdoctoral Science Foundation of China (No. 2019M652415) and Young Scholars Program of Shandong University, Weihai. Besides, the authors also thank the anonymous reviewers for insightful comments that helped us improve the quality of the paper.

Acknowledgments

The authors thank the anonymous reviewers for insightful comments that helped us improve the quality of the paper.

Conflicts of Interest

The authors declare no conflict of interest.

Nomenclature

GHGGreenhouse gas
ARIMAAutoregressive integrated moving average
GMGrey model
DGMDiscrete grey model
RDGMRolling discrete grey model
MAPEMean absolute percentage error
GDPGross domestic product
FYPFive-Year Plan
NDRCNational Development and Reform Commission
PSOParticle swarm optimization
STIRPATStochastic impacts by regression on population, affluence and technology
LMDILogarithmic mean Divisia index
DPSIRDriver-pressure-state-impact-response
PLS-SEMPartial least square-structural-equation modeling
EKCEnvironmental Kuznets curve

Appendix A

Table A1. Raw data of the prediction analysis (1990–2018).
YearNominal GDP (RMB)GDP Index (Take GDP in Last Year as 100)GDP Index (Take GDP in 1990 as 100)Real GDPCO2 (Million Tons)CO2 Emission Intensity (Tons Per 10,000 RMB)CO2 Emission Intensity (Logarithm)
199018,872.9 10018872.92326.512.327199321.090864418
199122,005.6109.3109.320628.07972457.811.914826951.076087739
199227,194.5114.2124.820623557.267022582.110.96094891.039848153
199335,673.2113.9142.170663426831.727132790.710.40074681.017064524
199448,637.5113160.652849630319.8516629409.6966173610.986620258
199561,339.9111178.324663133655.035343029.19.0004362470.95426356
199671,813.6109.9195.978804736986.883843178.68.5938572540.934188136
199779,715109.2214.008854840389.677163166.77.8403696760.89433654
199885,195.5107.8230.701545543540.071973163.77.2661799960.861306152
199990,564.4107.7248.465564546892.657523294.77.0260466660.84671103
2000100,280.1108.5269.585137450878.53343362.76.6092706980.82015354
2001110,863.1108.3291.960703855101.4516835256.3972906210.805996081
2002121,717.4109.1318.529127960115.683783845.46.3966668230.805953731
2003137,422110350.382040766127.252164534.46.8570821440.836139352
2004161,840.2110.1385.770626872806.1046253377.3304292650.865129407
2005187,318.9111.4429.748478381106.000556099.57.5204053440.876241249
2006219,438.5112.7484.32653591406.462626677.97.3057197580.863663009
2007270,092.3114.2553.100903104386.18037240.36.9360714020.841113555
2008319,244.6109.7606.7516905114511.63987378.56.4434497770.809118448
2009348,517.7109.4663.7863495125275.73397708.86.1534662440.789119823
2010412,119.3110.6734.1477025138554.96178135.25.8714606090.768746152
2011487,940.2109.6804.6258819151856.23818805.85.7987739670.76333618
2012538,580107.9868.1913266163852.88098991.55.4875446510.739378067
2013592,963.2107.8935.9102501176633.40569237.75.2298714220.718491012
2014643,563.1107.41005.167609189704.27769223.74.8621465560.686828045
2015688,858.21071075.529341202983.5779174.64.5198730530.655126237
2016746,395.1106.81148.665336216786.460391194.2064435150.623915062
2017832,035.9106.91227.923245231744.7269229.83.9827443580.600182431
2018919,281.1106.71310.194102247271.62279428.73.8130942390.581277539
Data Source: CEIC Database and BP Statistical Review of World Energy 2019 workbook (With calculation and compilation).

References

  1. Chung, K.H.K.; Wei, Y.G.; Cheong, T.S.; Chui, D.K.H. The evolution of energy market and energy usage: An application of the distribution dynamics analysis. Front. Energy Res. 2020. [Google Scholar] [CrossRef]
  2. Department of Trade and Industry. Our Energy Future–Creating a Low Carbon Economy; The Stationery Office: London, UK, 2003. [Google Scholar]
  3. Wei, Y.G.; Huang, C.; Lam, P.T.I.; Yuan, Z.Y. Sustainable Urban Development: A Review on Urban Carrying Capacity. Habitat Int. 2015, 46, 64–71. [Google Scholar] [CrossRef]
  4. Wei, Y.; Huang, C.; Li, J.; Xie, L. An Evaluation Model for Urban Carrying Capacity: A Case Study of China’s Mega-Cities. Habitat Int. 2016, 53, 87–96. [Google Scholar] [CrossRef]
  5. Li, Y.; Wei, Y.; Shan, S.; Tao, Y. Pathways to a Low-Carbon Economy: Estimations on Macroeconomic Costs and Potential of Carbon Emission Abatement in Beijing. J. Clean. Prod. 2018, 199, 603–615. [Google Scholar] [CrossRef]
  6. Li, B.; Yao, R. Urbanisation and Its Impact on Building Energy Consumption and Efficiency in China. Renew. Energy 2009, 34, 1994–1998. [Google Scholar] [CrossRef]
  7. Piao, S.; Fang, J.; Ciais, P.; Peylin, P.; Huang, Y.; Sitch, S.; Wang, T. The Carbon Balance of Terrestrial Ecosystems in China. Nature 2009, 458, 1009–1013. [Google Scholar] [CrossRef]
  8. Qi, Y.; Wu, T.; He, J.; King, D.A. China’s Carbon Conundrum. Nat. Geosci. 2013, 6, 507–509. [Google Scholar] [CrossRef]
  9. The World Bank. World Development Indicators. 2013. Available online: http://data.worldbank.org/data-catalog/world-development-indicators (accessed on 9 November 2013).
  10. Guo, X.H. China’s Shifting Policies towards Sustainability: A Low-carbon Economy and Environmental Protection. J. Contemp. China 2013, 22, 428–445. [Google Scholar] [CrossRef]
  11. BP. Statistical Review of World Energy. 2013. Available online: http://www.bp.com/en/global/corporate/energy-economics/statistical-review-of-world-energy.html (accessed on 9 November 2016).
  12. Wei, Y.; Gu, J.; Wang, H.; Yao, T.; Wu, Z. Uncovering the Culprits of Air Pollution: Evidence from China’s Economic Sectors and Regional Heterogeneities. J. Clean. Prod. 2018, 171, 1481–1493. [Google Scholar] [CrossRef]
  13. Liu, Y. Exploring the Relationship between Urbanization and Energy Consumption in China Using ARDL (Autoregressive Distributed Lag) and FDM (Factor Decomposition Model). Energy 2009, 34, 1846–1854. [Google Scholar] [CrossRef]
  14. Wu, Y. China’s Economic Growth: A Miracle with Chinese Characteristics; Routledge Curzon: New York, NY, USA, 2004. [Google Scholar]
  15. Bosworth, B.; Collins, S.M. Accounting for Growth: Comparing China and India; NBER Working Paper No. 12943; National Bureau of Economic Research, Inc.: New York, NY, USA, 2007. [Google Scholar]
  16. Wei, Y.; Huang, C.; Lam, P.; Sha, Y.; Feng, Y. Using Urban-Carrying Capacity as a Benchmark for Sustainable Urban Development: An Empirical Study of Beijing. Sustainability 2015, 7, 3244–3268. [Google Scholar] [CrossRef] [Green Version]
  17. Wang, R.; Liu, W.; Xiao, L.; Liu, J.; Kao, W. Path towards Achieving of China’s 2020 carbon Emission Reduction Target-A Discussion of Low-Carbon Energy Policies at Province Level. Energy Policy 2011, 39, 2740–2747. [Google Scholar] [CrossRef]
  18. Xie, Z. Report of Chinese State Council on Responding to Climate Change. 2009. Available online: http://www.npc.gov.cn/npc/xinwen/syxw/2009-08/25/content_1515283.htm (accessed on 9 November 2013).
  19. Zhou, L.; Li, J.; Chiang, Y. Promoting Energy Efficient Building in China through Clean Development Mechanism. Energy Policy 2013, 57, 338–346. [Google Scholar] [CrossRef]
  20. BP. Statistical Review of World Energy. 2016. Available online: http://www.bp.com/content/dam/bp/pdf/energy-economics/statistical-review-2016/bp-statistical-review-of-world-energy-2016-full-report.pdf (accessed on 9 November 2016).
  21. Liu, H.; Zhou, G.; Wennersten, R.; Frostell, B. Analysis of Sustainable Urban Development Approaches in China. Habitat Int. 2014, 41, 24–32. [Google Scholar] [CrossRef]
  22. Wei, Y.; Li, Y.; Liu, X.; Wu, M. Sustainable Development and Green GDP Assessments in Mega-cities Based on the Emergy Analysis Method—A Case Study of Wuhan. Sustain. Dev. 2020, 28, 294–307. [Google Scholar]
  23. Li, Y.; Wei, Y.G.; Zhang, X.; Tao, Y. Regional and Provincial CO2 Emission Reduction Task Decomposition of China’s 2030 Carbon Emission Peak Based on the Efficiency, Equity and Synthesizing Principles. Struct. Chang. Econ. Dyn. 2020, 53, 237–256. [Google Scholar] [CrossRef]
  24. State Coucil of Chinese Government. National Climate Change Program (2014–2020). 2009. Available online: http://www.gov.cn/ldhd/2009-11/26/content_1474016.htm (accessed on 9 November 2016).
  25. Uwasu, M.; Jiang, Y.; Saijo, T. On the Chinese Carbon Reduction Target. Sustainability 2010, 2, 1553–1557. [Google Scholar] [CrossRef] [Green Version]
  26. Wei, Y.; Li, Y.; Wu, M.; Li, Y. Progressing Sustainable Development of ‘the Belt and Road Countries’: Estimating Environmental Efficiency Based on the Super-SBM Model. Sustain. Dev. 2019, 1–19. [Google Scholar]
  27. Yuan, J.; Hou, Y.; Xu, M. China’s 2020 Carbon Intensity Target: Consistency, Implementations, and Policy Implications. Renew. Sustain. Energy Rev. 2012, 16, 4970–4981. [Google Scholar] [CrossRef]
  28. Zhang, Z. Assessing China’s Carbon Intensity Pledge for 2020: Stringency and Credibility Issues and Their Implications. Environ. Econ. Policy Stud. 2011, 13, 219–235. [Google Scholar] [CrossRef]
  29. Zhao, C.; Mao, C. Forecast of Intensity of Carbon Emission to China Based on BP Neural Network and ARIMA Combined Model. Resour. Environ. Yangtze Basin 2012, 21, 665–671. [Google Scholar]
  30. Liu, L.; Zong, H.J.; Zhao, Y.; Chen, C.X.; Wang, Z.J. Can China Realize Its Carbon Emission Reduction Goal in 2020: From the Perspective of Thermal Power Development. Appl. Energy 2014, 124, 199–212. [Google Scholar] [CrossRef]
  31. Zhang, Z. Decoupling China’s Carbon Emissions Increase from Economic Growth: An Economic Analysis and Policy Implications. World Dev. 2000, 28, 739–752. [Google Scholar] [CrossRef]
  32. Zhu, Q.; Peng, X.; Lu, Z.; Wu, K. Factors Decomposition and Empirical Analysis of Variations in Energy Carbon Emission in China. Resour. Sci. 2009, 31, 2072–2079. [Google Scholar]
  33. Dai, H.; Sun, T.; Zhang, K.; Guo, W. Research on Rural Nonpoint Source Pollution in the Process of Urban-Rural Integration in the Economically-Developed Area in China Based on the Improved STIRPAT Model. Sustainability 2015, 7, 782–793. [Google Scholar] [CrossRef] [Green Version]
  34. Li, H.; Ma, H.; Zhang, M.; Li, N. Analysis on Influence Factors of China’s CO2 Emissions Based on Path-STIRPAT Model. Energy Policy 2011, 39, 6906–6911. [Google Scholar] [CrossRef]
  35. Su, B.; Ang, B.W. Input-output Analysis of CO2 Emissions Embodied in Trade: A Multi-Region Model for China. Appl. Energy 2014, 114, 377–384. [Google Scholar] [CrossRef]
  36. Dong, F.; Long, R.; Chen, H.; Li, X.; Yang, Q. Factors Affecting Regional Per-Capita Carbon Emissions in China Based on an LMDI Factor Decomposition Model. PLoS ONE 2013, 8, e80888. [Google Scholar] [CrossRef]
  37. Wei, Y.; Zhu, X.; Li, Y.; Yao, Y.; Tao, Y. Influential Factors of National and Regional CO2 Emission in China Based on Combined Model of DPSIR and PLS-SEM. J. Clean. Prod. 2019, 212, 698–712. [Google Scholar] [CrossRef]
  38. Xu, G.; Liu, Z.; Jiang, Z. Decomposition Model and Empirical Study of Carbon Emissions for China, 1995–2004. China Popul. Resour. Environ. 2006, 16, 158–161. [Google Scholar]
  39. Auffhammer, M.; Carson, R.T. Forecasting the Path of China’s CO2 Emissions Using Province-level Information. J. Environ. Econ. Manag. 2008, 55, 229–247. [Google Scholar] [CrossRef] [Green Version]
  40. Wang, J.; Dong, Y.; Wu, J.; Mu, R.; Jiang, H. Coal production forecast and low carbon policies in China. Energy Policy 2011, 39, 5970–5979. [Google Scholar] [CrossRef]
  41. Fan, Y.; Zhang, X.; Zhu, L. Estimating the Macroeconomic Cost of CO2 Emission Abatement in China Based on Multi-objective Programming. Adv. Clim. Chang. Res. 2010, 6, 130–135. [Google Scholar]
  42. Hossain, M.S.; Li, B.; Chakraborty, S.; Hossain, M.R.; Rahman, M.T. A Comparative Analysis on China’s Energy Issues and CO2 Emissions in Global Perspectives. Sustain. Energy 2015, 3, 1–8. [Google Scholar]
  43. He, J.; Deng, J.; Su, M. CO2 Emission from China’s Energy Sector and Strategy for Its Control. Energy 2010, 35, 4494–4498. [Google Scholar] [CrossRef]
  44. Yu, S.; Wei, Y.; Wang, K. China’s Primary Energy Demands in 2020: Predictions from an MPSO-RBF Estimation Model. Energy Convers. Manag. 2012, 61, 59–66. [Google Scholar] [CrossRef]
  45. Li, Z. An Econometric Study on China’s Economy, Energy and Environment to the Year 2030. Energy Policy 2003, 31, 1137–1150. [Google Scholar]
  46. Choi, Y.; Zhang, N.; Zhou, P. Efficiency and Abatement Costs of Energy-related CO2 Emissions in China: A Slacks-Based Efficiency Measure. Appl. Energy 2012, 98, 198–208. [Google Scholar] [CrossRef]
  47. Yu, S.; Wei, Y.; Wang, K. Provincial Allocation of Carbon Emission Reduction Targets in China: An Approach Based on Improved Fuzzy Cluster and Shapley Value Decomposition. Energy Policy 2014, 66, 630–644. [Google Scholar] [CrossRef]
  48. Du, K.; Lu, H.; Yu, K. Sources of the Potential CO2 Emission Reduction in China: A Nonparametric Metafrontier Approach. Appl. Energy 2014, 115, 491–501. [Google Scholar] [CrossRef]
  49. Xu, L.; Chen, N.; Chen, Z. Will China Make a Difference in Its Carbon Intensity Reduction Targets by 2020 and 2030? Appl. Energy 2017, 203, 874–882. [Google Scholar] [CrossRef]
  50. Li, H.; Qin, Q. Challenges for China’s Carbon Emissions Peaking in 2030: A Decomposition and Decoupling Analysis. J. Clean. Prod. 2019, 207, 856–865. [Google Scholar] [CrossRef]
  51. Moghram, I.; Rahman, S. Analysis and Evaluation of Five Short-Term Load Forecasting Techniques. IEEE Trans. Power Syst. 1989, 4, 1484–1491. [Google Scholar] [CrossRef]
  52. Wang, J.; Zhu, S.; Zhao, W.; Zhu, W. Optimal Parameters Estimation and Input Subset for Grey Model Based on Chaotic Particle Swarm Optimization Algorithm. Expert Syst. Appl. 2011, 38, 8151–8158. [Google Scholar] [CrossRef]
  53. The State Council of China. National Climate Change Plan (2014–2020); China’s Policies and Actions for Addressing Climate Change Information Office: Beijing, China, 2014; p. 5.
  54. Box, G.E.P.; Jenkins, G.M. Time Series Analysis: Forecasting and Control; Holden-Day: San Francisco, CA, USA, 1970. [Google Scholar]
  55. Chu, C.W.; Zhang, G.P. A Comparative Study of Linear and Nonlinear Models for Aggregate Retail Sales Forecasting. Int. J. Prod. Econ. 2003, 86, 217–231. [Google Scholar] [CrossRef]
  56. Deng, J. Control Problems of Grey Systems. Syst. Control Lett. 1982, 1, 288–294. [Google Scholar]
  57. Lin, Y.H.; Lee, P.C. Novel High-Precision Grey Forecasting Model. Autom. Constr. 2007, 16, 771–777. [Google Scholar] [CrossRef]
  58. Xie, N.; Liu, S. Discrete Grey Forecasting Model and Its Optimization. Appl. Math. Model. 2009, 33, 1173–1186. [Google Scholar] [CrossRef]
  59. Makridakis, S.; Hibon, M.; Moser, C. Accuracy of Forecasting: An Empirical Investigation. J. R. Stat. Soc. Ser. A 1979, 142, 97–145. [Google Scholar] [CrossRef]
  60. Liu, S.; Lin, Y. Grey Information: Theory and Practical Applications; Springer: London, UK, 2010. [Google Scholar]
  61. Sun, X.; Sun, W.; Wang, J.; Zhang, Y.; Gao, Y. Using a Grey-Markov Model Optimized by Cuckoo Search Algorithm to Forecast the Annual Foreign Tourist Arrivals to China. Tour. Manag. 2016, 52, 369–379. [Google Scholar] [CrossRef]
  62. Hu, Y.C.; Jiang, P.; Lee, P.C. Forecasting Tourism Demand by Incorporating Neural Networks into Grey–Markov Models. J. Oper. Res. Soc. 2018, 70, 12–20. [Google Scholar] [CrossRef]
  63. Wei, Y.; Wang, Z.; Wang, H.; Yao, T.; Li, Y. Promoting Inclusive Water Governance and Forecasting the Structure of Water Consumption Based on Compositional Data: A Case Study of Beijing. Sci. Total Environ. 2018, 634, 407–416. [Google Scholar] [CrossRef] [PubMed]
  64. Huang, W.; Wang, H.; Zhao, H.; Wei, Y. Temporal-Spatial Characteristics and Key Influencing Factors of PM 2.5 Concentrations in China Based on STIRPAT Model and Kuznets Curve. Environ. Eng. Manag. J. 2020, 18, 2587–2604. [Google Scholar]
  65. The World Bank DRSCS. China 2030: Building a Modern, Harmonious, and Creative Society; The World Bank: Washington, DC, USA, 2012. [Google Scholar]
  66. IEA (International Energy Agency). World Energy Outlook. 2016. Available online: https://www.iea.org/newsroom/news/2016/november/world-energy-outlook-2016.html (accessed on 9 November 2017).
  67. BP. Statistical Review of World Energy. 2017. Available online: https://www.bp.com/content/dam/bp/en/corporate/pdf/energy-economics/statistical-review-2017/bp-statistical-review-of-world-energy-2017-full-report.pdf (accessed on 9 November 2017).
  68. Wei, Y.; Wu, M.; Li, Y.; Li, Y. The Decomposition of Total-Factor CO2 Emission Efficiency of 97 Contracting Countries in Paris Agreement. Energy Econ. 2019, 78, 365–378. [Google Scholar] [CrossRef]
Figure 1. The CO2 emissions of the world’s top 3 emitters (million tons). Source: (BP, 2016).
Energies 13 02924 g001
Figure 2. CO2 emission intensity comparisons of the four forecasting models from 2019 to 2030 (tons per 10 thousand RMB).
Energies 13 02924 g002
Figure 3. The predicted CO2 emissions in China from 1990 to 2030 (hundred million tons).
Energies 13 02924 g003
Table 1. Compliance to green policies and action plans of china on CO2 emission control.
YearPolicy and Action Plans
1992China became the signatory nation of the ‘United Nations Framework Convention on Climate Change’ (UNFCCC).
1997China became the contracting country of ‘the Kyoto Protocol’.
December 2007The ‘Chinese National Plan to Respond to Climate Change’ was released. This national plan includes the specific objectives, fundamental rules, key areas and policy measures of the Chinese government to effectively control CO2 emission by 2010. In addition, this plan was initially established by a developing country to address climate change issues.
2007A directive, namely, ‘A Comprehensive Work Plan for Energy Saving and Emission Reduction’, was enacted by the Chinese National Development and Reform Commission (NDRC).
November 2009The State Council declared the target of greenhouse gas emissions in 2020. That is, the carbon emission intensity in 2020 will be reduced by 40–45% from the 2005 baseline.
2010The first series of ‘Low-Carbon Pilot Cities’ selected by the NDRC, including eight cities and five provinces, was experimented.
March 2011China’s 12th Five-Year Plan declares the goal of reducing carbon emission intensity by 17% from the 2010 baseline.
2011‘Notification on the Implementations of Carbon Emission Trading Pilot Work’ by the NDRC.
2011The first series of ‘energy-saving and emission-reduction demonstration cities’, which included eight cities, was promulgated.
2011China introduced two provinces and five cities into the carbon transition pilot programme.
2012The second series of ‘Low-Carbon Pilot Cities’ extended to 29 cities.
2013China emissions exchange in Shenzhen was established.
2013The second series of ‘energy-saving and emission-reduction demonstration cities’ included 10 cities.
2015The newly revised Environmental Protection Law commenced.
2017The national carbon emission trading market was officially launched.
2018China implemented the first green tax law, namely, the Environmental Protection Tax Law.
Source: Compiled by the authors.
Table 2. Targets for CO2 emission intensity abatement for each region in “12th Five-Year” period.
ZoneReduction Target of CO2 Emission Intensity (%)Reduction Target of Energy Use Intensity (%)ZoneReduction Target of CO2 Emission Intensity (%)Reduction Target of Energy Use Intensity (%)
Beijing1817Hubei1716
Tianjin1918Hunan1716
Hebei1817Guangdong19.518
Shanxi1716Guangxi1615
Inner Mongolia1615Hainan1110
Liaoning1817Chongqing1716
Jilin1716Sichuan17.516
Heilongjiang1616Guizhou1615
Shanghai1918Yunnan16.515
Jiangsu1918Tibet1010
Zhejiang1918Shaanxi1716
Anhui1716Gansu1615
Fujian17.516Qinghai1010
Jiangxi1716Ningxia1615
Shandong1817Xinjiang1110
Henan1716
Source: “12th Five-Year” Energy-Saving and Emission Reduction Work Plan; “12th Five-Year” Greenhouse Gas Emission Control Plan.
Table 3. Literature on forecasting the CO2 emissions of China.
ReferenceMethodsLevelFindings
[45]An integrated econometric modelNationalThe continuation of high economic growth rates (6%) by 2030 will lead to insurmountable difficulties for CO2 emission abatements.
[39]Fixed-effect model and dynamic models with provincial panel dataNationalThe magnitude of the forecasted increase in the CO2 emission of China is considerably larger than the reduction embodied in the Kyoto Protocol.
[46]A non-radial slacks-based measure (SBM)Provincial and nationalThe potential CO2 emission reduction is averaged at 56.1 million for each province during the period 2001–2010. The eastern region reveals higher CO2 emission efficiency than those of the central and western regions.
[30]A combined model of Greg Model (1,1), the autoregressive integrated moving average (ARIMA), a second-order polynomial regression model (SOPR) and particle swarm optimization (PSO)SectorialThe rapid expansions of China’s thermal power lead to serious challenges for meeting the 2020 reduction target. The thermal power generation of China for 2020 should be strictly controlled between 3801 to 4492 billion kW h to achieve the 2020 target.
[47]A combined model of the particle swarm optimization (PSO) algorithm, fuzzy c-means (FCM) clustering algorithm, and Shapley decompositionProvincialFifteen provinces will exceed the national average reduction rate from 2010 to 2020 to achieve the 2020 emission abatement target.
[48]A nonparametric metafrontier approachProvincial and NationalPotential emission abatement of 1687 million tons is estimated for China and averaged at 56.2 million tons for each province during 2006–2010.
[49]Stochastic impacts by regression on population, affluence and technology(STIRPAT) model and GM (1,1) modelNationalThe CO2 density of China will be reduced by 52.8% and 70.0% by 2020 and 2030, respectively, compared with that in 2005.
[50]A hybrid method combing logarithmic mean Divisia index (LMDI) and decoupling index approachSectional and NationalThe total CO2 emission of China maintains a decreasing trajectory. Strengthening the decoupling relationship between CO2 emission and economic growth from 2015 to 2030 is a necessary precondition for China to achieve the ‘2030 target’.
Table 4. Mean absolute percentage error (MAPE) of the GM (1,1) model with different numbers of points.
The Number of Points MAPE l   ( % ) The Number of Points MAPE l   ( % )
156.9993.85
146.5083.19
136.5773.12
125.9262.45
115.1851.97
104.7841.58
Table 5. Predictions of CO2 emission density during the period 1994–2018 based on four sample size training intervals.
Training Interval (Year)Forecast YearForecast ValueReal ValueResidual Percentage (%)
1990–199319940.9865 0.9866 0.0119%
1991–199419950.9624 0.9543 0.8578%
1992–199519960.9248 0.9342 1.0074%
1993–199619970.9069 0.8943 1.4102%
1994–199719980.8694 0.8613 0.9395%
1995–199819990.8260 0.8467 2.4494%
1996–199920000.8207 0.8202 0.0658%
1997–200020010.8025 0.8060 0.4390%
1998–200120020.7843 0.8060 2.6909%
1999–200220030.7966 0.8361 4.7337%
2000–200320040.8468 0.8651 2.1180%
2001–200420050.8966 0.8762 2.3197%
2002–200520060.8999 0.8637 4.1925%
2003–200620070.8669 0.8411 3.0641%
2004–200720080.8258 0.8091 2.0671%
2005–200820090.7849 0.7891 0.5325%
2006–200920100.7623 0.7687 0.8371%
2007–201020110.7494 0.7633 1.8204%
2008–201120120.7482 0.7394 1.1943%
2009–201220130.7284 0.7185 1.3724%
2010–201320140.6966 0.6868 1.4224%
2011–201420150.6640 0.6551 1.3538%
2012–201520160.6257 0.6239 0.2940%
2013–201620170.5947 0.6002 0.9062%
2014–201720180.5733 0.5813 1.3800%
MAPE (%) 1.5792%
Table 6. Data range of the model fitting and prediction.
PurposeTime PhraseGM (1,1)DGMRDGMARIMA
To compareTraining intervaldata from 2013–2016data from 1990–2016
Test intervaldata from 2017-2018
To predictTraining intervaldata from 2015–2018data from 1990–2018
Forcast intervaldata from 2019–2030
Notes: GM (1,1) denotes the grey model with first order and one variable, DGM denotes the discrete grey model, RDGM denotes the rolling discrete grey model, and ARIMA denotes the autoregressive integrated moving average model.
Table 7. MAPE Comparisons of the four forecasting models from 2013 to 2018 for China’s CO2 emission intensity.
YearReal Value
(Tons per 10000 RMB)
GM (1,1)DGMRDGMARIMA
Fitness Value
20130.71850.71850.71850.71850.7177
20140.68680.68690.68700.68700.6943
20150.65510.65470.65480.65480.6583
20160.62390.62400.62410.62410.6271
YearReal Value (Tons per 10000 RMB)Forecast Value
20170.60020.59470.59480.59480.5996
20180.58130.56690.56700.56680.5752
MAPE (%) 1.701.681.690.60
Table 8. Prediction of CO2 emission density in 2019-2030.
YearGM (1,1)DGMRDGMARIMA (1,2,4)
20190.56040.56030.56030.5648
20200.54090.54080.54190.5488
20210.52200.52200.52290.5318
20220.50390.50380.50530.5142
20230.48640.48620.41300.4964
20240.46940.46930.35830.4786
20250.45310.45290.32760.4607
20260.43730.43710.28800.4428
20270.42210.42190.26060.4249
20280.40740.40720.23080.4070
20290.39330.39300.20770.3890
20300.37960.37930.18470.3711
Table 9. Prediction of CO2 emission density reduction.
ModelForecasted Reductions Compared to 2005
201920202021202220232024202520262027202820292030
GM (1,1)36.05%38.27%40.42%42.49%44.50%46.43%48.29%50.09%51.83%53.50%55.12%56.68%
DGM36.05%38.28%40.43%42.51%44.51%46.45%48.31%50.11%51.85%53.53%55.15%56.71%
RDGM36.05%38.16%40.32%42.33%52.87%59.11%62.61%67.13%70.26%73.66%76.30%78.93%
ARIMA (1,2,4)35.54%37.37%39.31%41.32%43.35%45.38%47.42%49.47%51.51%53.55%55.60%57.65%

