Abstract
We are investigating how to use urban design approaches to conduct the layout and basic design of newly-built high-rise buildings to reduce wind obstruction and create effective urban ventilation. Few studies have addressed this issue. This study analyzes the effects of high-rise building on pedestrian-level wind in downstream street canyons based on wind tunnel test results, and examines the suitability of an urban design specification. The height (H) of high-rise buildings and the airflow passage width (S) between adjacent high-rise buildings are key control factors for this issue; H/D = 3 and S/D = 1.125 are critical parameters and recommended values (D is the height of the downstream street blocks).
1. Introduction
In high-rise building design, in addition to safety and aesthetics, how the building affects the surrounding microclimate is an important consideration. For example, strong ground-level winds generated around high-rise buildings may cause pedestrian safety and wind comfort issues. Since the 1960s, studies of pedestrian wind environments have attracted significant attention. Relevant studies were generally categorized into three aspects, one that examines the effects of a single high-rise building on its surrounding pedestrian-level wind field [1,2,3,4,5], another that investigates the effects of high-rise buildings [6,7,8,9,10,11,12,13,14] and another that focuses on urban street canyons [12,13,14,15,16,17].
Kuo et al. [2] used wind tunnel testing to investigate the characteristics of the pedestrian-level wind environment in street canyons around single high-rise buildings for different approaching wind directions and geometrical conditions, including different street widths and podium heights. The results showed that a higher podium creates stronger wind speeds within the street canyon. Tamura et al. [4] investigated the effects of several parameters (i.e., building height H, building width B, aspect ratio H/B and the approaching wind profile) on pedestrian-level wind fields around single high-rise buildings through wind tunnel tests. They found that the downwash airflow generated by the buildings within the atmospheric boundary layer significantly affected the pedestrian-level wind field. Additionally, it showed that both the area of the strong-wind regions and the wind intensity in these regions increased with H, albeit at lower rates after a certain H value was reached. Moreover, they found that at a fixed H, a decrease in aspect ratio (i.e., increased width of the windward side) led to weakened downwash and Venturi effects.
Pedestrian-level wind field characteristics in a building cluster are affected by their morphological characteristics. It is a complex airflow process resulting from the interaction of many factors. The channeling effect increases the wind speed in the street canyon, and forms displeasing gusts. The outdoor air inflow direction, the street canyon width and the building height on the sides of the street canyon all affect the street canyon wind field characteristics.
For wind field characteristics in passages with various separation distances between adjacent buildings, Blocken et al. [6] described three types of flow in inter-building passages: resistance, interaction and isolation flow. In a passage wind field, increased wind speeds occur only at pedestrian-height level, whereas wind speeds at other passage heights are only 8% higher than those in the free flow (without buildings). Thus, the Venturi effect cannot be demonstrated as applicable to passage wind fields. Blocken et al. [7] designed the diverging and converging configurations of two high-rise buildings and analyzed the wind environments, using wind tunnel tests with wind-speed profiles of rural area conditions. They found that wind speeds were higher in the diverging passage than the converging passage. Additionally, they also found that the wind speed increased as the width of the street canyon increased. This finding contradicts results obtained from previous studies on parallel street canyon passages. Li et al. [12] validated the wind network index based on wind tunnel test results (spatial average velocity, surface pressure on individual buildings and total drag force). They found that the wind network index can effectively identify building layout effects on the wind field. Road distribution affects the street canyon morphology, and thereby affects the urban wind environment characteristics.
References [12,13,14,15,16,17] discussed wind field characteristics in large street canyons. Biao et al. [13] proposed the use of urban spatial indices (openness, area, and shape) to distinguish urban wind field characteristics. Through computational fluid dynamics (CFD), An et al. [14] verified the urban ventilation and air pollutant dispersion effects of a void design of large-mass high-rise buildings. Ramponi et al. [15] investigated urban outdoor ventilation with different wind directions on equal and unequal street widths via CFD. It showed that the main street can be both beneficial and non-beneficial for the ventilation efficiency of the downstream area, depending on the wind directions. He et al. [17] performed wind tunnel tests and CFD simulations, and found that non-orthogonal road distribution patterns can more easily channel horizontal airflows, compared to orthogonal road distribution patterns.
To obtain the best landscape views and increase total floor areas, building heights along river banks are often maximized. Towering buildings along river banks can beautify city skylines. However, from a wind environment perspective, massive buildings possibly cause strong winds in corners and weak winds in downstream street canyons. Excessively strong and weak winds both negatively impact urban microclimates [11]. In Taiwan, some county and city governments have taken steps to reduce external wind obstruction by newly constructed buildings through urban design specifications and are expecting effective convection to ventilate and dissipate heat in the constructed environment.
Few studies investigating the wind environment issue in urban design specifications have been reported. In this context, the objective of the present study is to provide insights into the suitability of an urban design specification for having adequate urban ventilation performance via analyzing the effects of high-rise building on pedestrian-level wind in downstream street canyons based on wind tunnel test results, for which little information is available. Of particular emphasis in this study were the effects of the airflow passage width between adjacent high-rise buildings (S), the high-rise building height (H) and the width of the first-row (L) downstream street blocks on the wind environment.
2. Materials and Methods
2.1. Application Scenario
In Taiwan, the New Taipei City government established an urban design specification for wind environment control in the redistricted zone on the north side of Banqiao Jiangcui. The key points of this specification are as follows:
- (1)
- For a construction site with an average width greater than 15 m, the sum of the widths of the façades of all the buildings should not exceed 70% of the average width of the site (as shown in Figure 1).
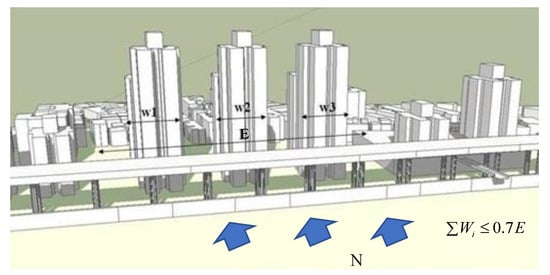 Figure 1. High-rise building façade width limited by the urban design specification (redistricted zone on the north side of Banqiao Jiangcui in New Taipei City, Taiwan) (Wi = maximum width of the façade of each high-rise building; E = average width of the construction site).
 - (2)
- To facilitate environmental ventilation, reduce the urban heat island effect and prevent winds generated by high-rise buildings from affecting pedestrians, environmental wind field tests and analysis should be provided for high-rise buildings in the first-row street blocks along the river.
- (3)
- To maintain ventilation and landscape corridors, a 4 m-wide uncovered pedestrian sidewalk is reserved for each road perpendicular to the river bank. Planning should ensure that these sidewalks will maintain their natural environmental conditions and visual transparency, and provide pedestrian passage 24 h per day.
The first point aims to prevent the newly constructed high-rise building on the windward side from obstructing outdoor airflows due to excessively small inter-building distances (i.e., S values), and thereby from affecting ventilation in the downstream building cluster. Additionally, to ensure adequate ventilation in the zone, reduce the urban heat island effect and prevent pedestrian-level gusts, the specification requires that wind tunnel tests and analysis for the environmental wind field be presented for the first-row buildings along the river bank. The third point aims to increase the number of ventilation paths. The above-mentioned specification is used as the application scenario for this study and as a test-planning reference.
2.2. Experimental Model
In this study, a reduced-scale (1/250) stiff test model was used. Figure 2 schematically shows the tested model (please also refer to Figure 3c) and the locations of the wind-speed measuring points. The dimension of each street block, the distribution pattern of the street blocks (a 3 × 3 checkerboard-type pattern) and the width of the streets (10 cm) in the downstream area (the area within the dotted rectangular box in Figure 2) were fixed. There were three variables: S, H and the distance (L) between the high-rise buildings and the first-row downstream street blocks (i.e., the width of the street S1). Based on their vertical and horizontal directions, the streets are labeled downwind streets (L1 and L2) and transverse streets (S1–S4).
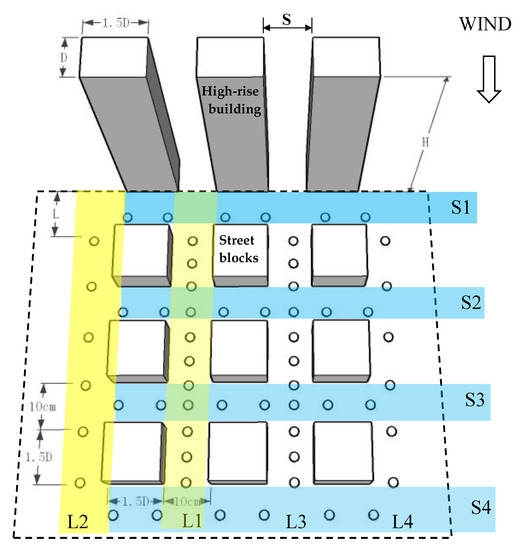
Figure 2.
Schematic diagram of the investigated model and wind speed measurement points (Symbol O).
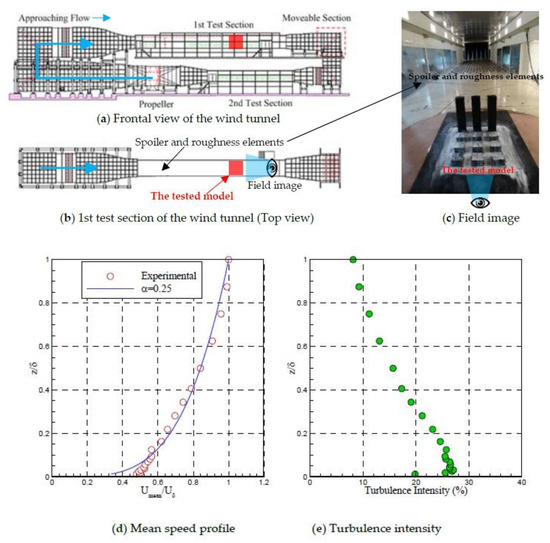
Figure 3.
Wind tunnel and approaching wind profile [2]. (a) Frontal view of the wind tunnel; (b) 1st test section of the wind tunnel (top view); (c) field image; (d) mean speed profile; and (e) turbulence intensity.
The dimension of each high-rise building was set to 1D (length) × 1.5D (width) × H (height of the high-rise building), and the dimensionless ratio H/D was set to 1–7 (D = 8 cm). The distance between two high-rise buildings is the width of the outdoor airflow passage (i.e., S). The dimensionless passage ratio S/D was set to 0.375, 0.75, 1.125, 1.5 and 1.875. The dimensionless ratio L/D was set to 0.75, 1, 1.25 and 1.5. The size of a street block, composed by low-rise buildings, is 1.5D (length) × 1.5D (width) × D (height of the street blocks; height of low-rise buildings in a street block as well). The dimensions set in this study were confirmed to be consistent with the real situation by scaling up at the ratio of 1/250.
In this study, surface wind speed meters (Irwin probes) were used to measure the surface wind speed at the center of each street canyon, which was subsequently used to reflect the pedestrian-level wind environment. Irwin probes were placed at a total of 58 points (marked by O in Figure 2). There were 34 and 24 measuring points in the downwind and transverse street canyons, respectively. The arrow in Figure 2 indicates the direction of the approaching wind, which is perpendicular to the façade of each high-rise building.
2.3. Experimental Setup
The experiments were carried out at the Wind Tunnel Laboratory, Architecture and Building Research Institute, Ministry of the Interior, Taiwan, located on the Gueiren Campus of National Cheng-Kung University. The wind tunnel is a closed type with two testing sections, as illustrated in Figure 3a–c. The pedestrian-level wind environment tests in this study used the wind tunnel’s first test section, with a section width of 4 m and a section height of 2.6 m. The maximum approaching wind speed is around 30 m/s.
Based on the related test regulations of Taiwan, the approaching turbulent wind flow in the wind tunnel follows a power law with the exponent of 0.25, using a series of 1.6 m spoiler and roughness elements, to simulate a wind flow profile above suburban terrain. The test models were fabricated at a length scale of 1/250. Figure 3d and e show the normalized mean wind speed, Umean/Uδ, and turbulence intensity of the approaching wind in the wind tunnel, respectively. Umean is the mean wind speed at the height of z; Uδ represents the mean wind speed of the modeled atmospheric boundary layer height (δ = 1.6 m).
The flow field in an urban street canyon exhibits a complex flow pattern that is affected by the near-field buildings. In this study, the airflow pattern and the cause of formation in the street canyons is observed based on the wind-speed measurements with the help of oil film testing. In the oil film test, the oil (70% Kerosene; 10% Oleic acid; and 20% Titanium dioxide powder) was evenly spread on the model and ground surfaces. When the wind blows the oil film, the airflow pattern near the surfaces of the objects can be observed from the change of the oil film, as illustrated in Figure 3a (right). The higher the wind speed, the more the oil film can be driven; a lower wind speed will still let the white oil film accumulate.
3. Results and Discussion
The mean wind speed of each measurement point (Ui) was divided by the free stream wind speed outside the modeled atmospheric boundary layer (Uh) to obtain a dimensionless mean wind speed Vel (= Ui/Uh).
3.1. Flow Structures
As shown in Figure 4 (right) (H = 2D; S = 1.125D), the pedestrian-level dimensionless wind speeds, measured by Irwin probes at the wind tunnel, are presented as velocity contours. Colors represent the level of wind speed, as the closer the color is to blue, the lower the wind speed; this is followed by the green, with the closer to red, the higher the wind speed. When the wind flows downstream after passing through the passage of high-rise buildings, the channeling effect increases the wind velocity in the street canyon (marked by symbol ❶). At the intersections of L3/S2 and L3/S3, the higher (0.5) and lower (0.2) dimensionless velocities can be found, respectively. This phenomenon can be verified in the oil film test (marked by ❷ and ❸, respectively).
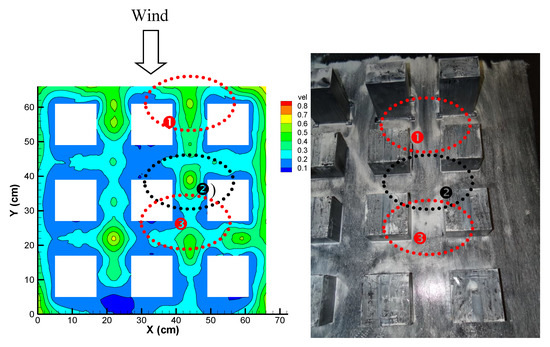
Figure 4.
Comparison between the wind tunnel testing results (left) and the oil film observation (right) of the case H = 2D; S = 1.125D.
Figure 5 shows the pedestrian-level Vel (dimensionless wind speed) contours in the study area in the absence of high-rise buildings in front of the study area, and in the presence of high-rise buildings with S/D values of 0.375, 0.75 and 1.875 in front of the study area, respectively. Figure 5a shows the Vel distribution in the street canyons in the absence of high-rise buildings in front of the study area. It shows that there was a relatively high Vel (approximately 0.7) in the upstream area (marked by ❶) of downwind street canyon L1. In the downstream direction, the Vels at the intersection of S2 and L1 (marked by ❷) and the intersection of S3 and L1 (marked by ❸) were approximately 0.4–0.6. Further down the downstream direction, the Vel at location ❹ was less than 0.2. In the transverse street canyons, the approaching wind moved towards corner ❺ due to the presence of high-rise buildings. At this location, because the buildings were relatively short, the corner strong-wind region was not pronounced. Some of the approaching wind moved to the transverse street canyon ❻ via the outer side of the study area.
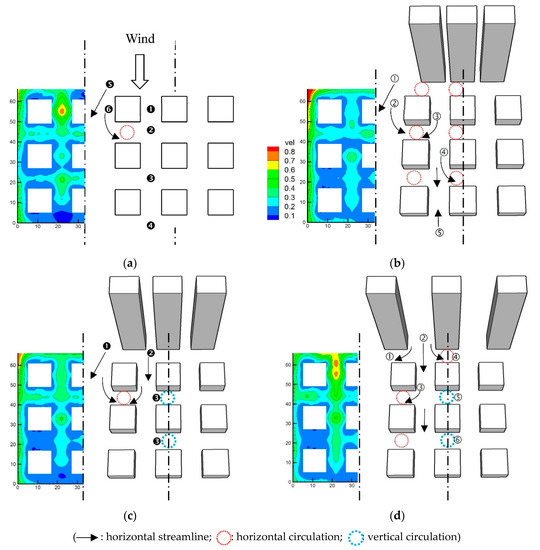
Figure 5.
Airflow velocity (Vel) distribution in the street canyons (H/D = 7, L/D = 1). (a) No high-rise buildings in front. (b) S/D = 0.375. (c) S/D = 0.75. (d) S/D = 1.875.
Figure 5b shows the wind-field distribution in the presence of high-rise buildings with an S/D value of 0.375. Because the high-rise buildings were arranged in a relatively dense pattern, their effects on the downstream study area were similar to those of a resistance flow [6]. It shows a strong-wind region located at corner ① on the outer side of the high-rise buildings. Due to the resistance from the high-rise buildings, the Vel in downwind street canyon L1 was even lower than that in Figure 5a. Additionally, the Vels in the transverse street canyons S1–S4 were also lower than those in Figure 5a. There was different cause for the formation of low-speed circulation in the transverse street canyons. The horizontal circulations (red dotted circles in Figure 5b) in the transverse street canyons between L2 and L1 were formed from airflows ② and ③, which whirled into the street canyons. The circulations in the transverse street canyons between L1 and the central axis of symmetry were formed from airflow ④, which whirled into the transverse street canyons. On the other hand, after the approaching flow passed over the top of the high-rise buildings, a downwash airflow ⑤ was formed, which met with the stream-wise flow that moved in the opposite direction on the third-row street canyon (S4–L1). This led to a relatively low Vel at this location.
As the distance between the high-rise buildings increased to 0.75D (Figure 5c), there was an increase in the airflow passages (S). It became easier for the external wind to smoothly flow into the downwind street canyon L1 after passing between the high-rise buildings. Consequently, there was a wind field reduction at corner ❶. However, the Vel in the downwind street canyon ❷ was higher than the previous two cases. As the S increased, this phenomenon became increasingly pronounced, and could even lead to the formation of instant gusts that affect pedestrians. The downstream wind fields were less significantly affected by the high-rise buildings in front. In these wind fields, the Vels were relatively low. The flow characteristics in the case where S/D = 0.75 were similar to those in the previous scenario, where S/D = 0.375. However, there were two differences: (1) in the case where S/D = 0.75, after the approaching flow passed over the top of the high-rise buildings, a downwash airflow formed in the downstream area and merged with the relatively high-speed airflow in downwind street canyon L1, with these two airflows moving in different directions met and stagnating at a point further downstream outside the study area; and (2) in the case where S/D = 0.75, vertical airflow circulations were formed in the second- and third-row transverse street canyons (S2 and S3) between L1 and the central axis of symmetry, as shown by the blue dotted circles in Figure 5c.
As S gradually increased to a value greater than the width of the downstream street canyons (e.g., S/D = 1.875 (Figure 5d), the outdoor wind immediately encountered the downstream buildings after entering the passage between the high-rise buildings, and thus moved outward (towards location ①) along the transverse street canyon. Another airflow ② moved directly towards the downwind street canyon L1. This airflow began to move outward at location ③ after flowing to the second-row transverse street canyon S2. Due to the shelter effect, low-speed circulations were formed in the central regions of the transverse street canyons (between L1 and the central axis of symmetry). Due to the circulation at the corner of the high-rise building in front, there was a horizontal airflow circulation (④) in the central region of the first-row transverse street canyon S1. In contrast, there was primarily a vertical circulation (⑤ and ⑥, respectively) in the central region of each of the second- and third-row transverse street canyons (S2 and S3).
Based on the above analysis, similar flow field morphologies were observed when S/D = 0.375 and 0.75. Due to the obstruction by the high-rise buildings, the airflow speed in the downwind street canyon L1 was relatively low. In comparison, the wind field in the outer street canyon L2 consisted of a rapid circulation formed by the movement of the airflow undercut by the high-rise buildings in front, and was stronger than the flow field in the downwind street canyon L1. As a result, the airflow in street canyon L2 mainly entered the transverse street canyon, and formed a horizontal circulation at this location. When S/D = 1.125, S was close to the width of the downwind street canyon. Thus, the flow field morphology in this scenario was relatively stable. As S increased to 1.5D and 1.875D, the shelter effect of the high-rise buildings on the downwind street canyon L1 weakened. As a result, after entering the passage between the high-rise buildings and generating a channel effect, the wind field entered the downstream street canyon L1 at an increased speed. On the other hand, there was also an increase in the area of the weak-wind regions in street canyon L2. As a result, after whirling into the transverse street canyons, the strong wind field in street canyon L1 moved to street canyon L2.
In summary, when S/D ≤ 0.75, this study shows an edge effect-dominated airflow field. In this scenario, the airflow entered the transverse street canyons mainly through street canyon L2. However, the downwind field in street canyon L1 was stronger than the transverse flow fields. As a result, the flow field that moved from street canyon L2 to the transverse street canyons cannot enter street canyon L1. When S/D ≥ 1.5, it shows a stream-wise dominated airflow field. The airflow characteristics differed from those of the edge effect-dominated flow field. When 0.75 < S/D < 1.5, the flow field structure was between those of the previous two scenarios.
3.2. Effects of H
Figure 6a shows the airflow velocity (Vel) distribution in the study area at various S/D values when H/D = 1 (H/D = 1 means that the upstream high-rise buildings and the buildings in the downstream building cluster were of the same height). Due to the lack of airflow at the corner of the high-rise buildings and the high-rise buildings’ channel effect, the Vels in Figure 6a were relatively low, overall. Figure 6b,c show the Vel distribution when H/D = 3 and 7, respectively. As H increased, the strength of the circulation at the corner gradually increased. At a small S, a wind field with a Vel over 0.8 appeared at the corner. As S increased, due to the strengthening of the channel effect, a high-wind speed region appeared in the upstream area of the downwind street canyon.
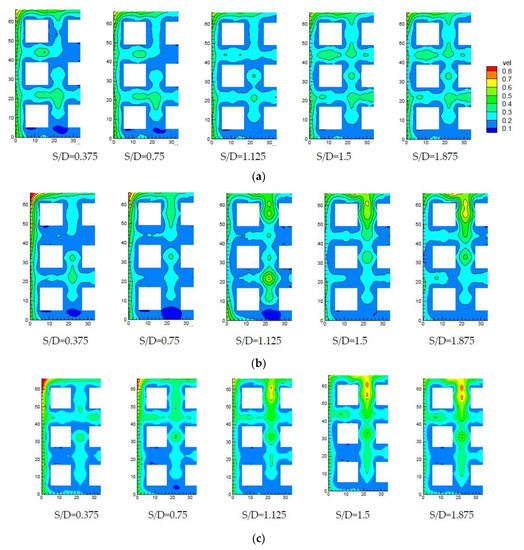
Figure 6.
Effects of H on street canyon Vel distributions (L/D = 0.75). (a) H/D = 1. (b) H/D = 3. (c) H/D = 7.
Additionally, as demonstrated in Figure 6a (S/D = 0.375), at a relatively low H, the area of the regions where the Vel of the wind field was less than 0.3 in the street canyons was relatively small. H was the largest in Figure 6c. When the high-rise buildings were densely arranged (S/D = 0.375), the shelter effect affected the Vels in the street blocks, and the Vel was less than 0.3 in a large area. As S gradually increased, Vel gradually increased in the street canyons. A notable strong-wind region appeared in Figure 6c (S/D = 1.5 and 1.875).
3.3. Variation of the Velocity in the Downwind Street Canyons
Figure 7a shows that when S/D = 0.375 (represented by symbol O), because the three high-rise buildings (H/D = 7) were in close proximity to each other, they exerted a shelter effect on the downstream street canyons. As a result, the Vel generated in downwind street canyon L1 was relatively low. As S/D increased to 0.75, Vel in street canyon L1 increased somewhat, in particular between street canyon measuring points 1 and 6. As S/D increased to 1.125, 1.5, and 1.875, Vel at the entrance of street canyon L1 was near 1. As S increased, Vel in the upstream area of street canyon L1 increased, whereas Vel in the downstream area of street canyon L1 was relatively low, and there was no significant difference between the scenarios.
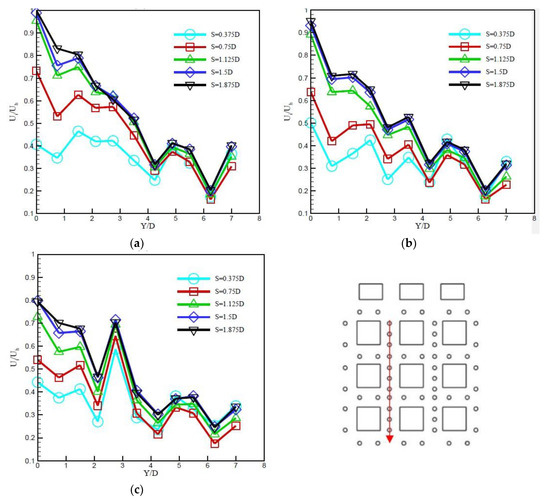
Figure 7.
Variation of Vel in downwind street canyon L1 (H/D = 7) (a) L/D = 0.75, (b) L/D = 1 (c) L/D = 1.5.
Here, the effect of L (i.e., the distance between the high-rise buildings and street block S1) is considered. When L/D = 0.75 and 1, the Vel variation in the downwind street canyons exhibited relatively similar trends. However, when L/D = 1.5 (Figure 7c), Vel increased suddenly at measuring point 5, and then decreased sharply further downstream. This high local Vel occurred because the street canyon formed by the buildings between street canyons S2 and S3 caused further flow field channelization.
Figure 8 shows the Vel variation in street L2 on the outer side of the street canyons. At a relatively small S, the airflow in street L2 was dominated by the corner circulation. As a result, Vel in street L2 was higher than that in other cases. When L/D = 0.75 and 1 (Figure 8a,b), the variation of Vel in street L2 exhibited similar trends. However, when L/D = 1.5 (Figure 8c), a local low Vel appeared at measuring points 3 and 4, as a result of the flow field structure (see Section 3.2 for details).
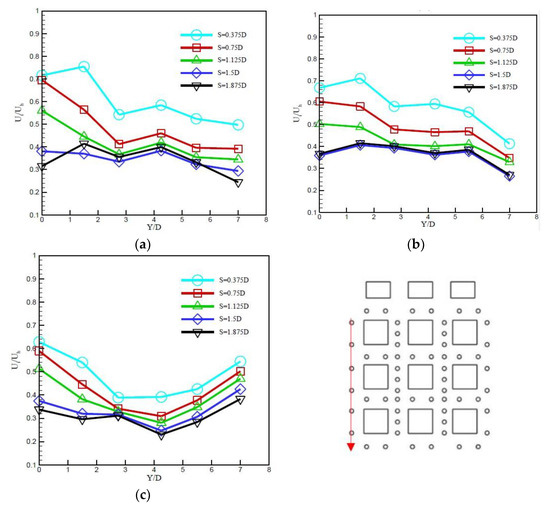
Figure 8.
Variation of Vel in downwind street canyon L2 (H/D = 7) (a) L/D = 0.75, (b) L/D = 1 (c) L/D = 1.5.
3.4. Assessing the Urban Design Specification
Figure 9 shows the relationships of S and H with Vel (Ui/Uh, calculated for all measurement points) from gathering all the measured data. Figure 9a shows that the Vel variation trend differed between H/D = 1–2 and H/D = 3–7. When H/D = 1–2, Vel varied relatively gently between 0.3 and 0.35. In comparison, Vel varied relatively sharply when H/D = 3–7. The greater the H or S was, the greater too was the Vel in the downstream street canyons. Figure 9b shows that when H/D ≥ 3, the Vel curve transitions at an S/D value of 1.125. When S/D > 1.125, multiple strong-wind regions might be formed. Under this condition, it is necessary to evaluate whether pedestrian-level gusts could be generated in certain regions or at certain street corners. When S/D < 1.125, multiple weak-wind regions might be formed. Under this condition, it is necessary to evaluate ventilation issues resulting from poor outdoor airflow.
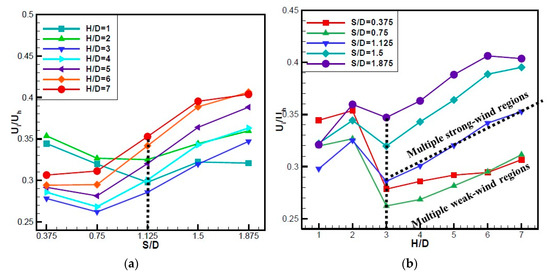
Figure 9.
(a) Relationships of S and (b) H with Vel (Ui/Uh).
The urban design specification for the area on the north side of Banqiao Jiangcui in New Taipei City, Taiwan stipulates that the total width of the facades of the buildings along the river bank should not exceed 70% of the width of the construction site submitted for approval, i.e., S/D ≥ 1.125. In Taiwan, however, the H/D values for high-rise buildings generally range from 3 to 7. Figure 9 demonstrates that the aforementioned urban design specification is suitable, and can allow relatively high wind speeds in the residential building cluster downstream of the high-rise buildings. However, several streets would still be located in strong-wind regions. Therefore, it is necessary to evaluate whether pedestrian-level strong winds can be generated. Additionally, when H/D = 3–7, on average, there were low Vels at 36–15% of the measuring points. Thus, it is necessary to note that some streets are in weak-wind regions. The wind maps in Figure 6b,c can be used to identify the strong- and weak-wind regions.
4. Conclusions
This study analyzes the effects of high-rise buildings on pedestrian-level wind field characteristics in downstream street canyons based on wind tunnel test results. By fixing the downstream building height (D), street block morphology and street canyon width, the effects of airflow passage width (S), height of the high-rise buildings (H) and the distance (L) between the high-rise buildings and the first-row downstream street blocks on the pedestrian-level wind environment were evaluated.
The results show the following. When H/D ≥ 3, an S/D value of 1.125 is a critical point. When S/D > 1.125, multiple strong-wind regions might be formed. Under this condition, it is necessary to evaluate whether pedestrian-level strong winds could be generated in certain regions or at certain street corners. When S/D < 1.125, multiple weak-wind regions might be formed. Under such conditions, it is necessary to evaluate ventilation issues resulting from poor outdoor airflow.
The urban design specification discussed in this study stipulates that the sum of the width of the building façades along the river bank should not exceed 70% of the width of the construction site submitted for approval, i.e., S/D ≥ 1.125. In Taiwan, the H/D values for high-rise buildings generally range from 3 to 7. The results of this study demonstrate that this urban design specification is suitable.
The effects of an urban high-rise building on its surrounding wind environment are case-specific. Therefore, when designing a new high-rise building, it is impossible to ensure an excellent wind environment surrounding this building merely through an urban design or building design specification. Instead, it is necessary to evaluate the effects based on correct wind tunnel tests or computational fluid dynamics (CFD) simulations. After identifying strong- and weak-wind regions based on the wind maps (for example, Figure 6b,c in this study), an excellent wind environment can be essentially achieved by adjusting the site planning or building design.
The wind tunnel test results in this study are limited to the application scenarios and the chosen specific location. To explore the applications at other scenarios and locations, customized wind tunnel tests should be carried out. The focus of this study is to explore the suitability of an urban design specification for having adequate urban ventilation performance; however, broader investigations on environmental impacts (e.g., air pollutant dispersion, urban heat island, wind danger, outdoor-indoor air quality interaction, etc.) and urban wind mitigating means (e.g., vegetation, building façade conformation, etc.) are noticeable. This is not what we are exploring in this study, but is worthy of further consideration.
Author Contributions
C.-Y.K. and R.-J.W. conceived of and designed the experiments; C.-Y.K. and R.-J.W. performed the experiments; C.-Y.K., Y.-P.L. and C.-M.L. analyzed the data; and C.-Y.K. and C.-M.L. wrote the paper. All authors have read and agreed to the published version of the manuscript.
Funding
Support from the Architecture and Building Research Institute, Ministry of the Interior, Taiwan through grant No. PG10304-0144 in this study is gratefully acknowledged.
Conflicts of Interest
The authors declare no conflict of interest.
References
- Tamura, Y.; Tanaka, H.; Ohtake, K.; Nakai, M.; Kim, Y. Aerodynamic characteristics of tall building models with various unconventional configurations. In Structures Congress 2010; ASCE: Orlando, FL, USA, 2010; pp. 3104–3113. [Google Scholar]
- Kuo, C.Y.; Tzeng, C.T.; Ho, M.C.; Lai, C.M. Wind tunnel studies of a pedestrian-level wind environment in a street canyon between a high-rise building with a podium and low-level attached houses. Energies 2015, 8, 10942–10957. [Google Scholar] [CrossRef]
- Xu, X.; Yang, Q.; Yoshida, A.; Tamura, Y. Characteristics of pedestrian-level wind around super-tall buildings with various configurations. J. Wind Eng. Ind. Aerodyn. 2017, 166, 61–73. [Google Scholar] [CrossRef]
- Tamura, Y.; Xu, X.; Yang, Q. Characteristics of pedestrian-level mean wind speed around square buildings: Effects of height, width, size and approaching flow profile. J. Wind Eng. Ind. Aerodyn. 2019, 192, 74–87. [Google Scholar] [CrossRef]
- Van Druenen, T.; van Hooff, T.; Montazeri, H.; Blocken, B. CFD evaluation of building geometry modifications to reduce pedestrian-level wind speed. Build. Environ. 2019, 163, 106293. [Google Scholar] [CrossRef]
- Blocken, B.; Carmeliet, J.; Stathopoulos, T. CFD evaluation of wind speed conditions in passages between parallel buildings—Effect of wall-function roughness modifications for the atmospheric boundary layer flow. J. Wind Eng. Ind. Aerodyn. 2007, 95, 941–962. [Google Scholar] [CrossRef]
- Blocken, B.; Stathopoulos, T.; Carmeliet, J. Wind environmental conditions in passages between two long narrow perpendicular buildings. J. Aerosp. Eng. 2008, 21, 280–287. [Google Scholar] [CrossRef]
- Yim, S.H.L.; Fung, J.C.H.; Lau, A.K.H.; Kot, S.C. Air ventilation impacts of the “wall effect” resulting from the alignment of high-rise buildings. Atmos. Environ. 2009, 43, 4982–4994. [Google Scholar] [CrossRef]
- Ng, E.; Yuan, C.; Chen, L.; Ren, C.; Fung, J.C.H. Improving the wind environment in high-density cities by understanding urban morphology and surface roughness: A study in Hong Kong. Landsc. Urban Plan. 2011, 101, 59–74. [Google Scholar] [CrossRef] [PubMed]
- Tsang, C.W.; Kwok, K.C.S.; Hitchcock, P.A. Wind tunnel study of pedestrian level wind environment around tall buildings: Effects of building dimensions, separation and podium. Build. Environ. 2012, 49, 167–181. [Google Scholar] [CrossRef]
- Yang, A.S.; Wen, C.Y.; Wu, Y.C.; Juan, Y.H.; Su, Y.M. Wind Field Analysis for a High-rise Residential Building Layout in Danhai, Taiwan. In Proceedings of the World Congress on Engineering 2013, London, UK, 3–5 July 2013. [Google Scholar]
- Li, J.; Peng, Y.; Ji, H.; Hu, Y.; Ding, W. A wind tunnel study on the correlation between urban space quantification and pedestrian–level ventilation. Atmosphere 2019, 10, 564. [Google Scholar] [CrossRef]
- Biao, L.; Cunyan, J.; Lu, W.; Weihua, C.; Jing, L. A parametric study of the effect of building layout on wind flow over an urban area. Build. Environ. 2019, 160, 106160. [Google Scholar] [CrossRef]
- An, K.; Wong, S.M.; Fung, J.C.H. Exploration of sustainable building morphologies for effective passive pollutant dispersion within compact urban environments. Build. Environ. 2019, 148, 508–523. [Google Scholar] [CrossRef]
- Ramponi, R.; Blocken, B.; de Coo, L.B.; Janssen, W.D. CFD simulation of outdoor ventilation of generic urban configurations with different urban densities and equal and unequal street widths. Build. Environ. 2015, 92, 152–166. [Google Scholar] [CrossRef]
- Chew, L.W.; Norford, L.K. Pedestrian-level wind speed enhancement in urban street canyons with void decks. Build. Environ. 2018, 146, 64–76. [Google Scholar] [CrossRef]
- He, Y.; Tablada, A.; Wong, N.H. A parametric study of angular road patterns on pedestrian ventilation in high-density urban areas. Build. Environ. 2019, 151, 251–267. [Google Scholar] [CrossRef]
© 2020 by the authors. Licensee MDPI, Basel, Switzerland. This article is an open access article distributed under the terms and conditions of the Creative Commons Attribution (CC BY) license (http://creativecommons.org/licenses/by/4.0/).