Article

A Sustainable Solution for Energy Efficiency in Italian Climatic Contexts

by
Valeria Annibaldi
1,
Federica Cucchiella
1 and
Marianna Rotilio
2,*
1
Department of Industrial and Information Engineering and Economics, University of L’Aquila, Via G. Gronchi n. 18, 67100 L’Aquila, Italy
2
Department of Civil, Construction-Architectural and Environmental Engineering, University of L’Aquila, Via G. Gronchi n. 18, 67100 L’Aquila, Italy
*
Author to whom correspondence should be addressed.
Energies 2020, 13(11), 2817; https://doi.org/10.3390/en13112817
Submission received: 6 May 2020 / Revised: 24 May 2020 / Accepted: 28 May 2020 / Published: 2 June 2020

Abstract

:
In the European Union, about 40% of energy consumption and 36% of CO2 emissions come from buildings; therefore, the improvement of their energy performance is a strongly focused issue. In particular, the energy efficiency of the building envelope is a very important element to pay attention to. Many studies have been conducted on this field of research, and the study illustrated in this paper also belongs to this topic. In particular, this article presents a multidisciplinary method to find sustainable solutions for energy efficiency in Italian climatic contexts using the Life Cycle Cost Analysis approach. In detail, this paper defines the reference scenario and then deepens the methodology used to determine the economically optimal thickness of a specific insulating material—hemp fiber—applied to a specific type of wall—uninsulated cavity walls made of hollow bricks, which are very widespread in Italy. The analysis is developed in relation to three different regions—Piedmont, Abruzzo, and Campania. The results show that the economically optimal thickness is different for each region analyzed and demonstrates how energy efficiency strategies must be carefully weighed according to the specific conditions of the site.

1. Introduction

Buildings energy consumption is considered to be one of the main sources of energy consumption in many countries. In fact, in the European Union, about 40% of total energy consumption and 36% of CO2 emissions come from buildings [1]. In particular, the demands for energy in the residential, industrial, and services sector are 45%, 37%, and 18% respectively [2]. In order to reduce these consumptions, it would be advisable to limit the transmission of heat through the building envelope, as this can lead to energy savings [3] and guarantee better thermal comfort. Thermal comfort represents a relevant issue in the design of new buildings or during the renovation of existing ones [4], and in this field, thermal insulation certainly represents a valid solution to reduce the transmission of heat through the building envelope. Proper design of the building envelope with the determination of the appropriate amount of insulating material can lead to energy savings. In fact, excessive insulation involves, on the one hand, the reduction of heat transmission through the envelope, on the other, a high installation cost of the insulation. According to a conservative perspective, it is suitable to choose an insulating material that has the lowest possible thermal conductivity value and the highest possible thickness [5]. However, it is also necessary to consider the cost of insulation, which increases with its thickness. Therefore, for each type of insulating material, there is a point beyond which the additional cost of the material will not offset the energy savings. For this reason, it is essential to identify the optimal insulation thickness in which the sum of the installation cost of the insulating material and the energy cost is minimal. The evaluation of the optimal thickness depends on many parameters such as the type of building, its exposure, the climatic conditions, the energy source [6]. Many studies have been conducted on the evaluation of the optimal thickness of the insulation. One study by Mahlia and Iqbal [7] shows that the use of insulating materials with their optimal thickness and the presence of air spaces in the composite walls reduce fuel consumption and emissions in air-conditioned buildings. Dombayci [8] analyzes the environmental impact of the optimal thickness of the insulation for the external walls of the building. Dylewski [9] shows that thermal insulation is a profitable investment from both an economic and environmental point of view. Furthermore, the same author [9] considers to be appropriate to use insulation thicknesses greater than those required by current regulations.
Daouas [10] shows that the orientation of the wall influences energy consumption and also has a small effect on the optimal thickness of the insulation; instead, one study by Yu et al. [11] analyzes the impact of the color of the external surface on the value of the thickness of the insulation. According to D’Agostino et al. [6], it is appropriate to limit the thickness of the insulation for hot climates, while Annibaldi et al. [12] compare the optimal thickness in relation to the transmittance values of the historical walls measured in situ with that calculated through literature data.
An aspect not to be underestimated in the application of thermal insulation is the environmental impact deriving from the design and disposal of the insulating material. In fact, to have high thermal performance of the envelope, the thickness of the insulation must be increased, which in turn translates into a greater quantity of material and therefore greater environmental impact. To solve this problem, different approaches are taken into account—either reduce the quantity of material by increasing its thermal performance or reduce the environmental impact of materials by replacing conventional materials with ecological ones [13]. This paper belongs to a more general study on insulating materials and uses the Life Cycle Cost Analysis (LCCA) to define their optimal thickness with the scope to optimize both environmental and economic aspects. In particular, the objective of this document is to define the optimal thickness for insulation of plant origin applied to the same type of wall located in different Italian regions, which are characterized by different thermal loads. In this way, it is possible to compare the results obtained starting from identical boundary conditions (the same wall type and the same insulation) in different climatic contexts. In addition, the results were also compared with Italian law standards (Ministerial Decree of 26.05.2015, Table 1 of Appendix B), which define the limit values of the thermal transmittance for the external vertical walls. These limits are set according to six climatic zones, from “A” to “F” (Presidential Decree 412 of 26.08.1993). From the point of view of the insulating material, the choice to analyze a plant origin insulator derives from the fact that a study by Kylili and Fokaides [14] highlights how the use of environmentally friendly materials is the way to achieve the sustainability of the built environment. Among these materials, hemp fiber has been selected because the demand for insulators from renewable resources (and in particular the use and applications of hemp products in insulation) is growing [15]. On the other hand, with regard to the type of wall, it was decided to analyze one of the most widespread in the Italian national territory [16]. This is the typical uninsulated cavity walls made of hollow bricks present at least in five Italian regions from the 1950s–1970s onward—Abruzzo, Campania, Liguria, Lombardy, and Piedmont. For this study, the regions of Piedmont, Abruzzo, and Campania were taken into consideration in order to evaluate the variation in the thickness of the insulation according to the different location of these regions. In fact, they are located in the north, central, and south of Italy, respectively, and this is because, in the Italian peninsula, the climate varies considerably from north to south. The latter is characterized by a dry and hot climate in summer with non-rigid winters, the first is characterized by a harsh climate with very cold winters and very hot summers, while in the center, the climate is temperate.
The thermal loads were assessed through the degree-days (DDs) method according to which the energy requirement for space heating or cooling is proportional to the difference between the average daily temperature and the base temperature.
Before illustrating the methodological approach with the related results, in the next section, the reference scenario is presented for the explanation of the context within which the research was conducted.
Finally, a summary of the main references about the energy efficiency general topic is presented (Figure 1). In detail, the following sub-topics are highlighted:
-
Insulating materials, distinguishing the natural typology from the others;
-
Optimal thickness—LCCA.
The purpose of the research and the reference location are also reported.

2. Reference Scenario

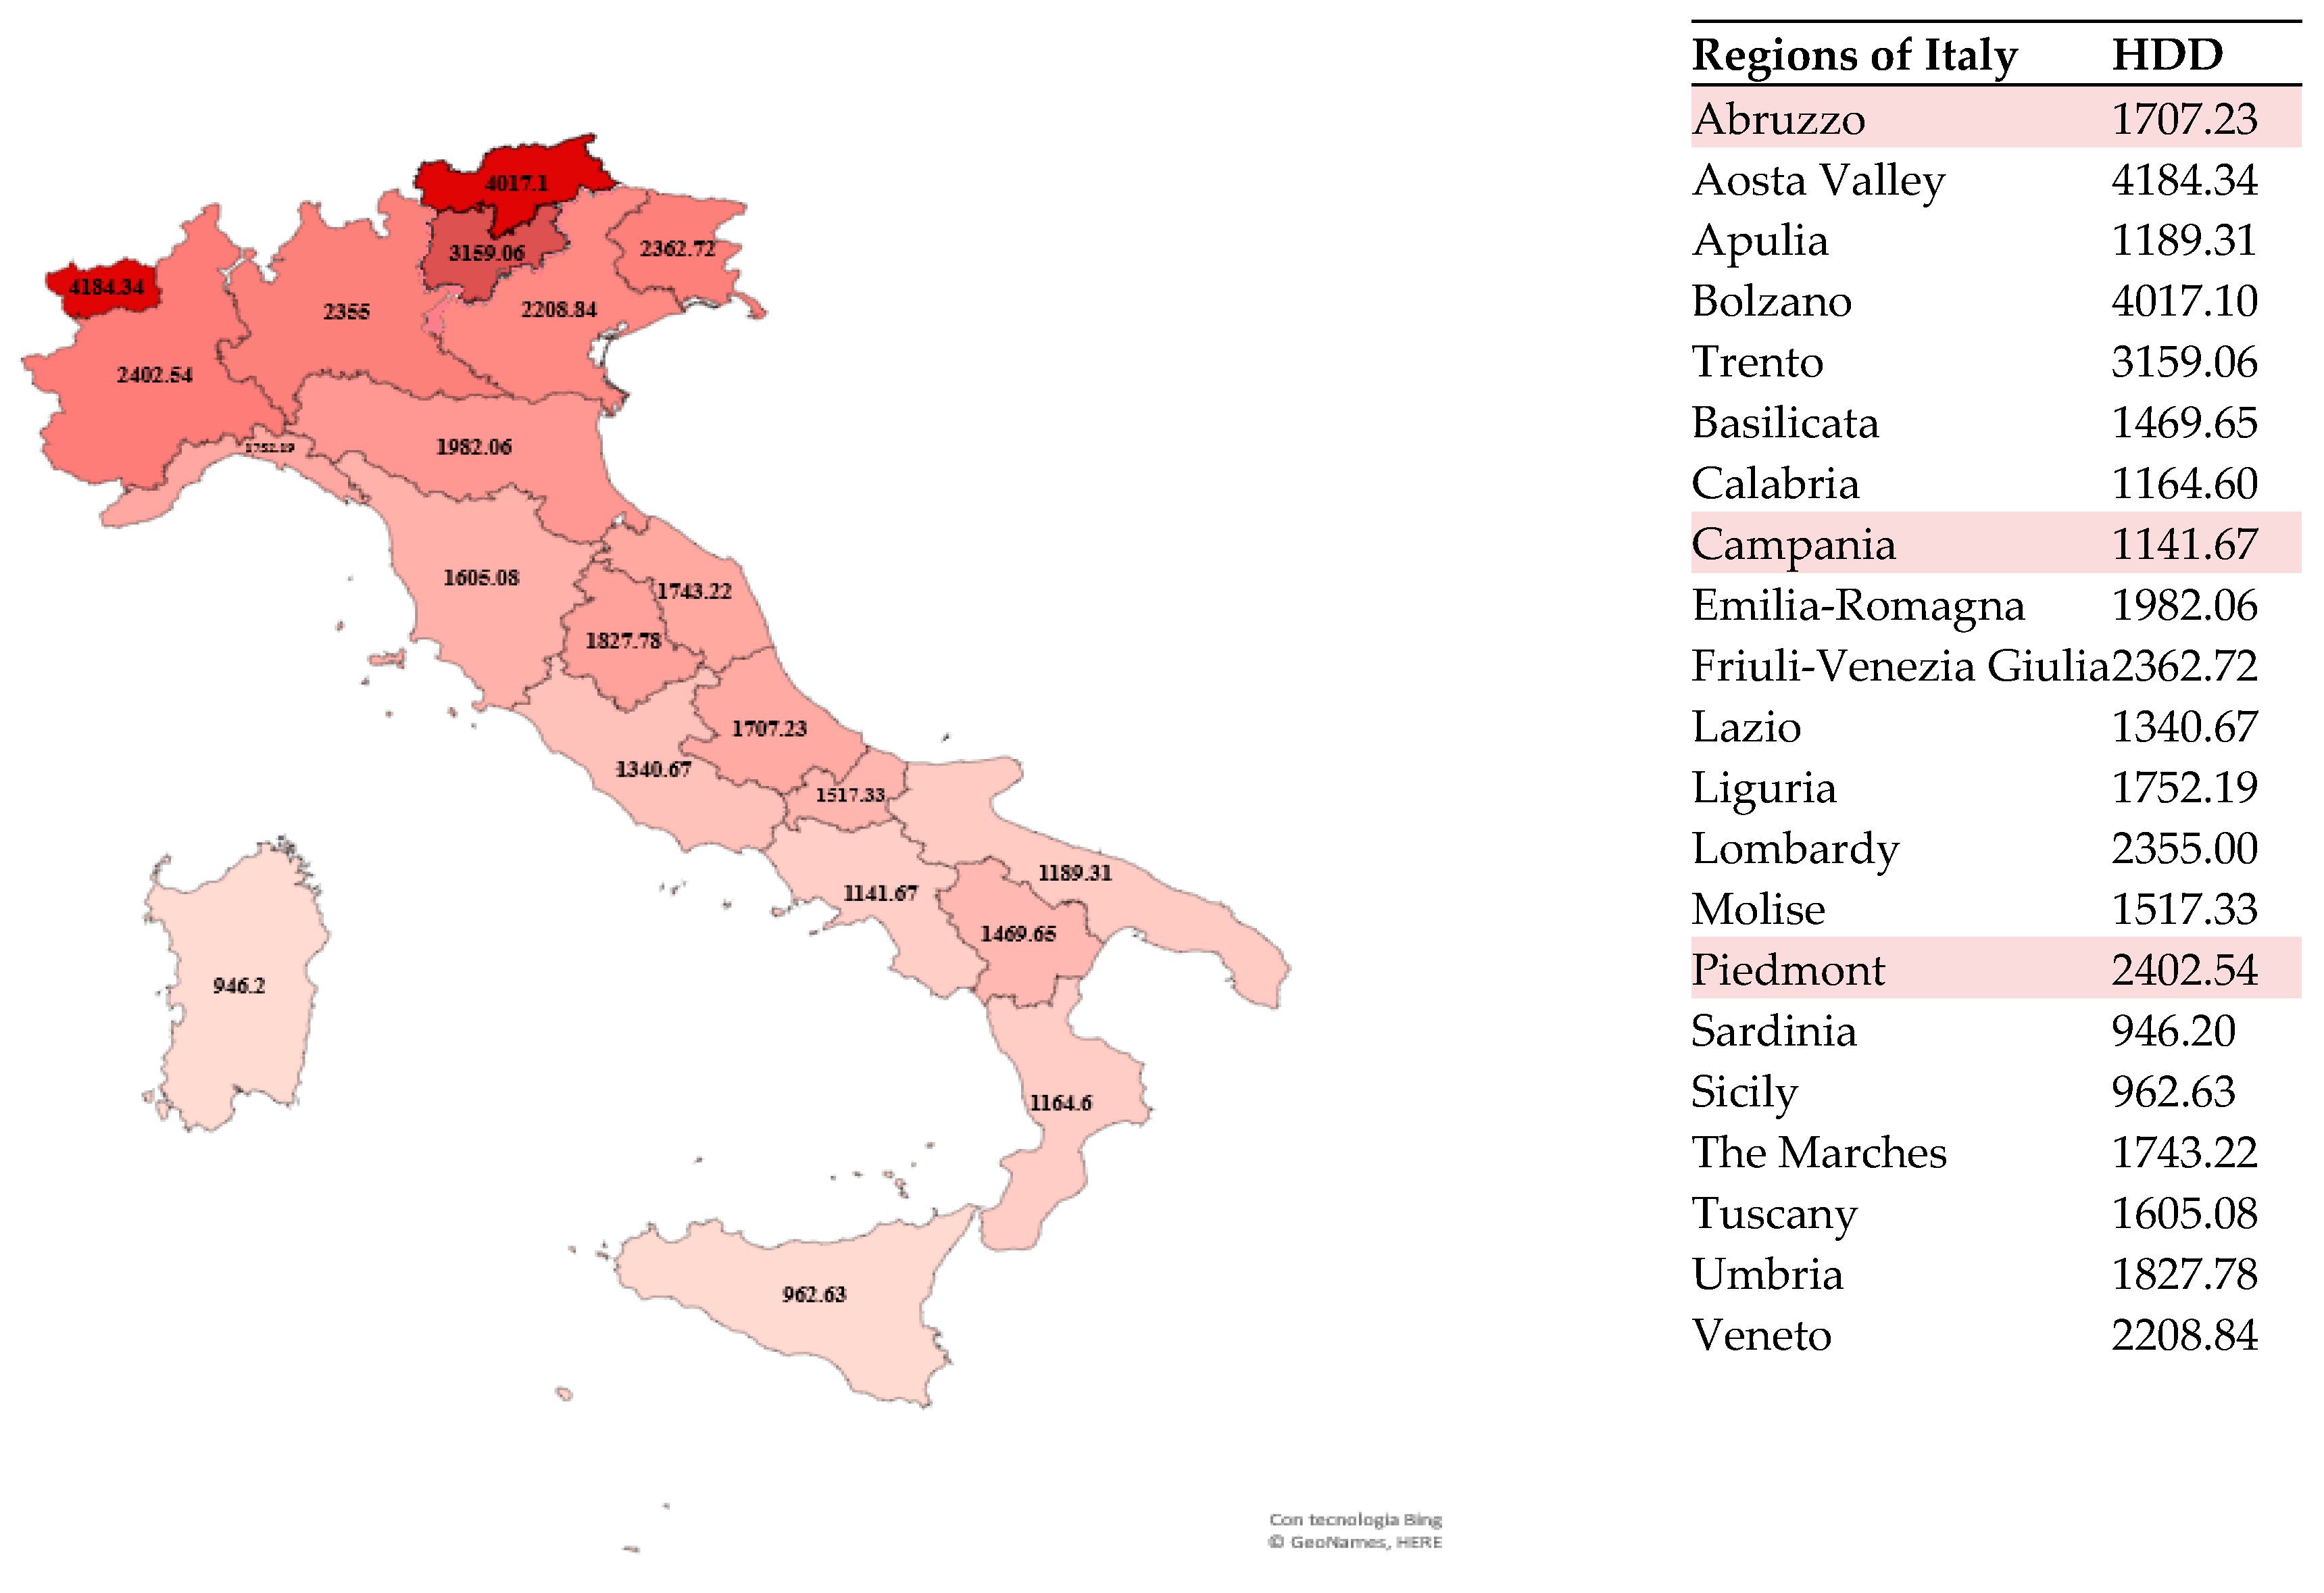
This section illustrates the reference scenario of the study developed, deepening the aspects and motivations briefly anticipated in the previous section. It has been divided into three parts, such that, in Section 2.1 and Section 2.2, the type of wall and the insulating material chosen for the analysis covered by this article are respectively presented. Section 2.3 illustrates the Heating Degree Day (HDD) and Cooling Degree Day (CDD) values for each of the Italian regions. This information is essential to introduce the contents of the following chapters.

2.1. The Type of Wall Object in This Study

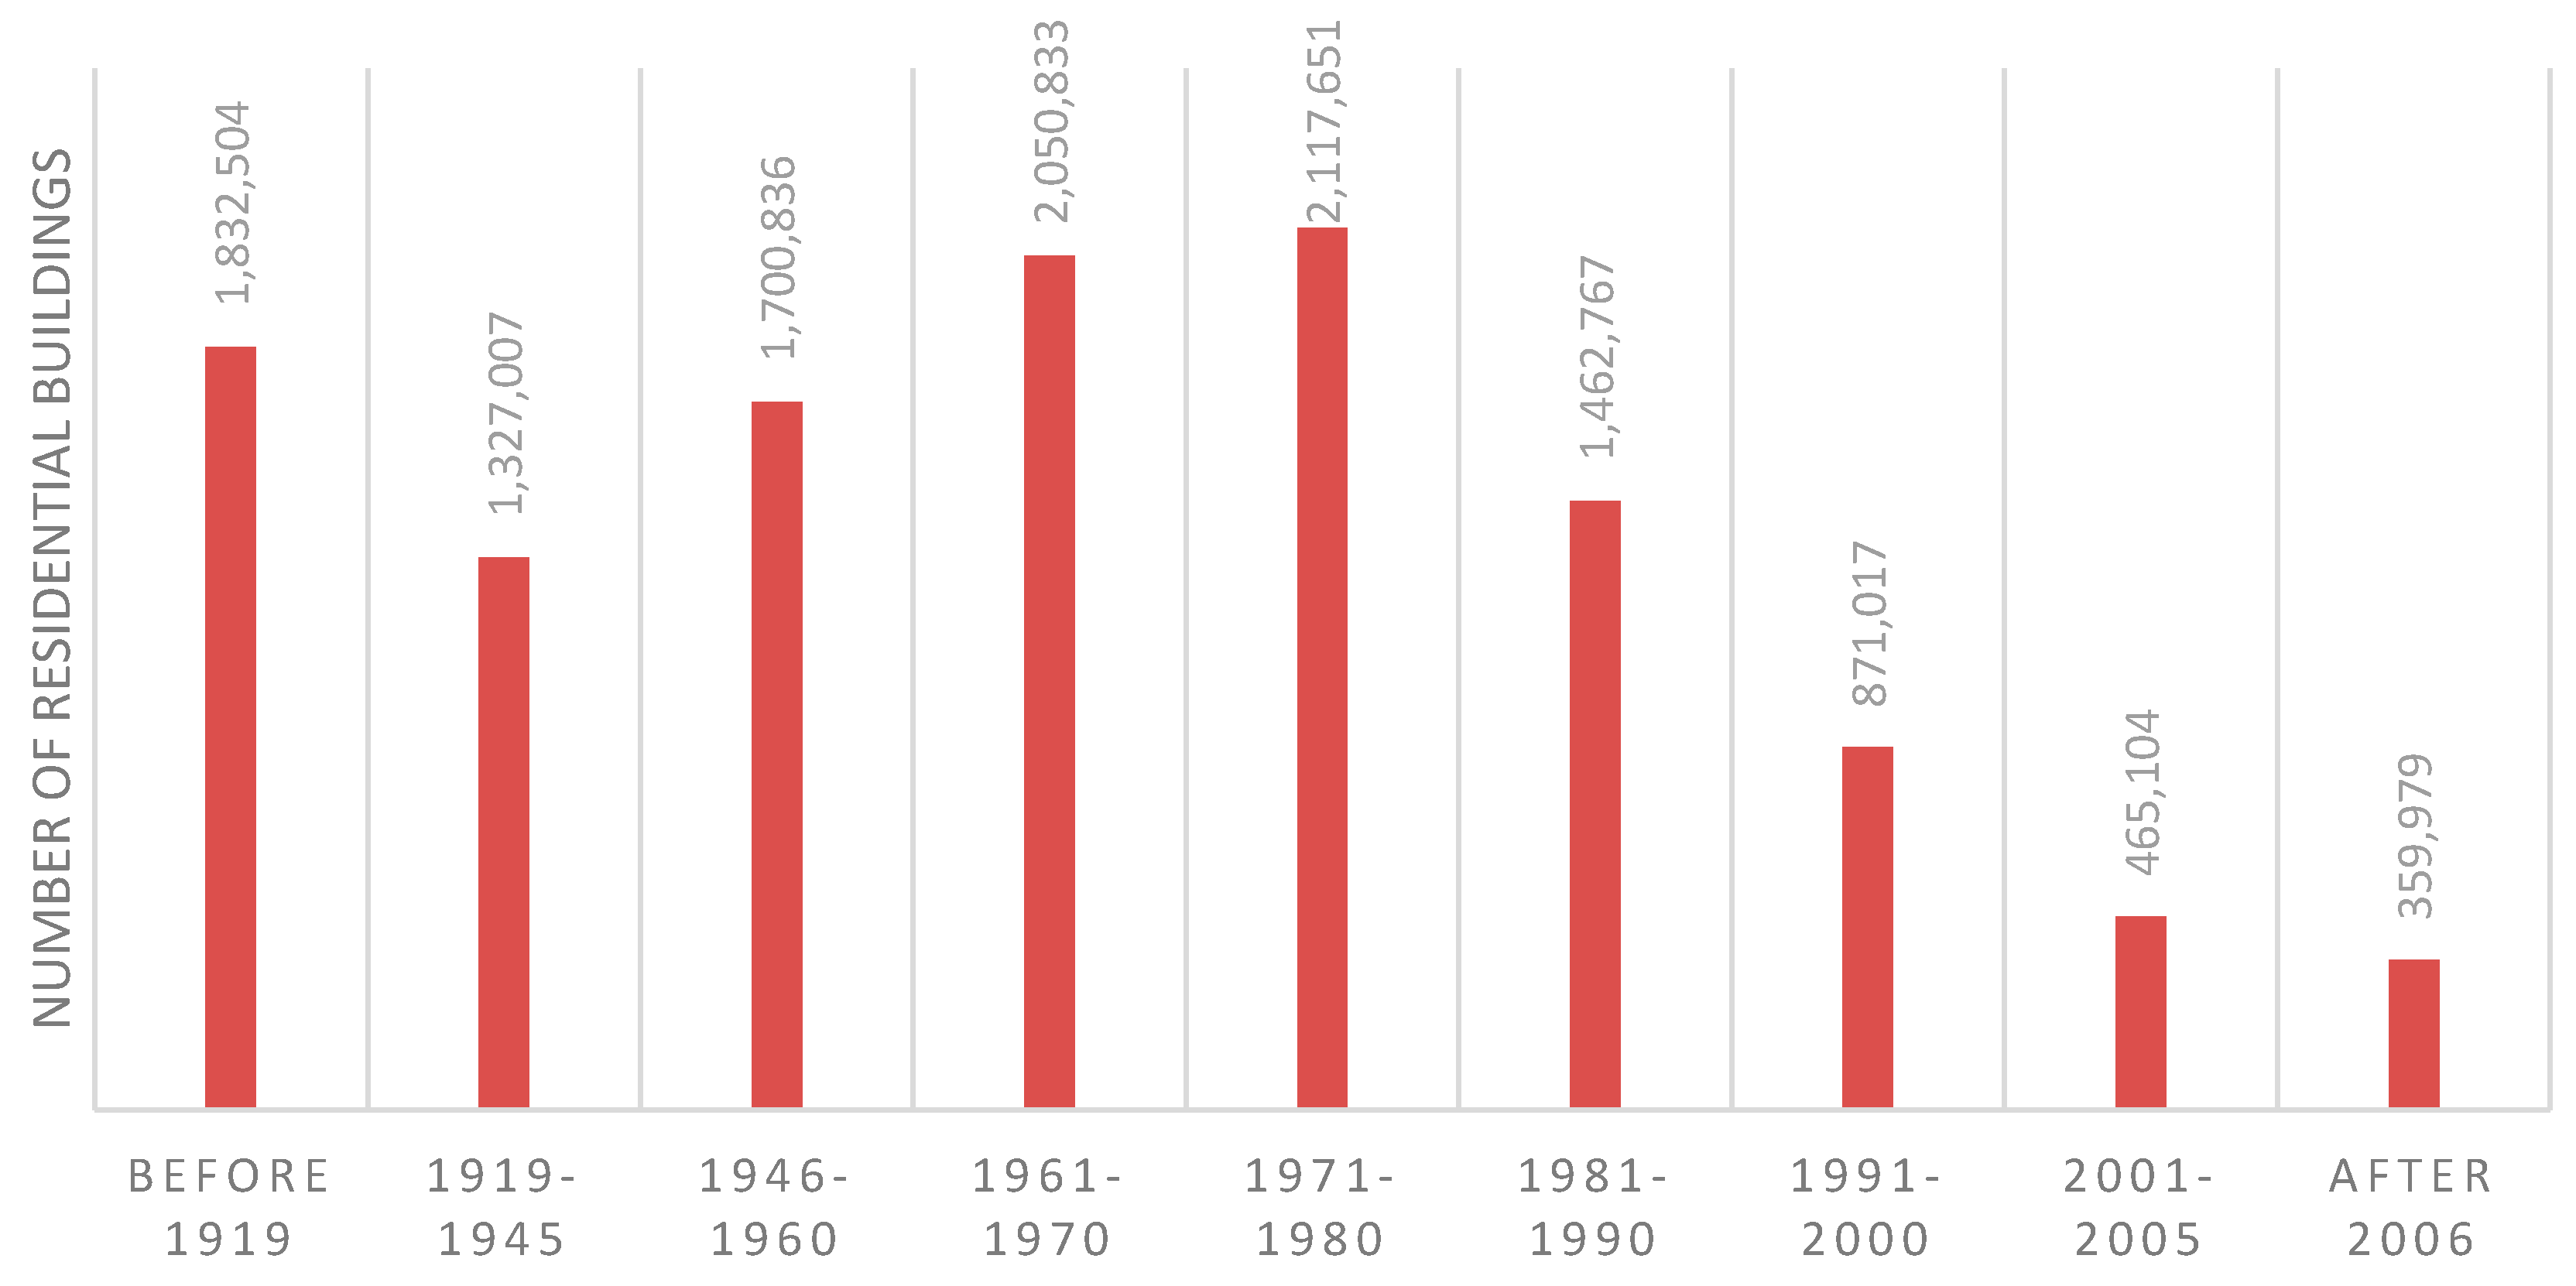
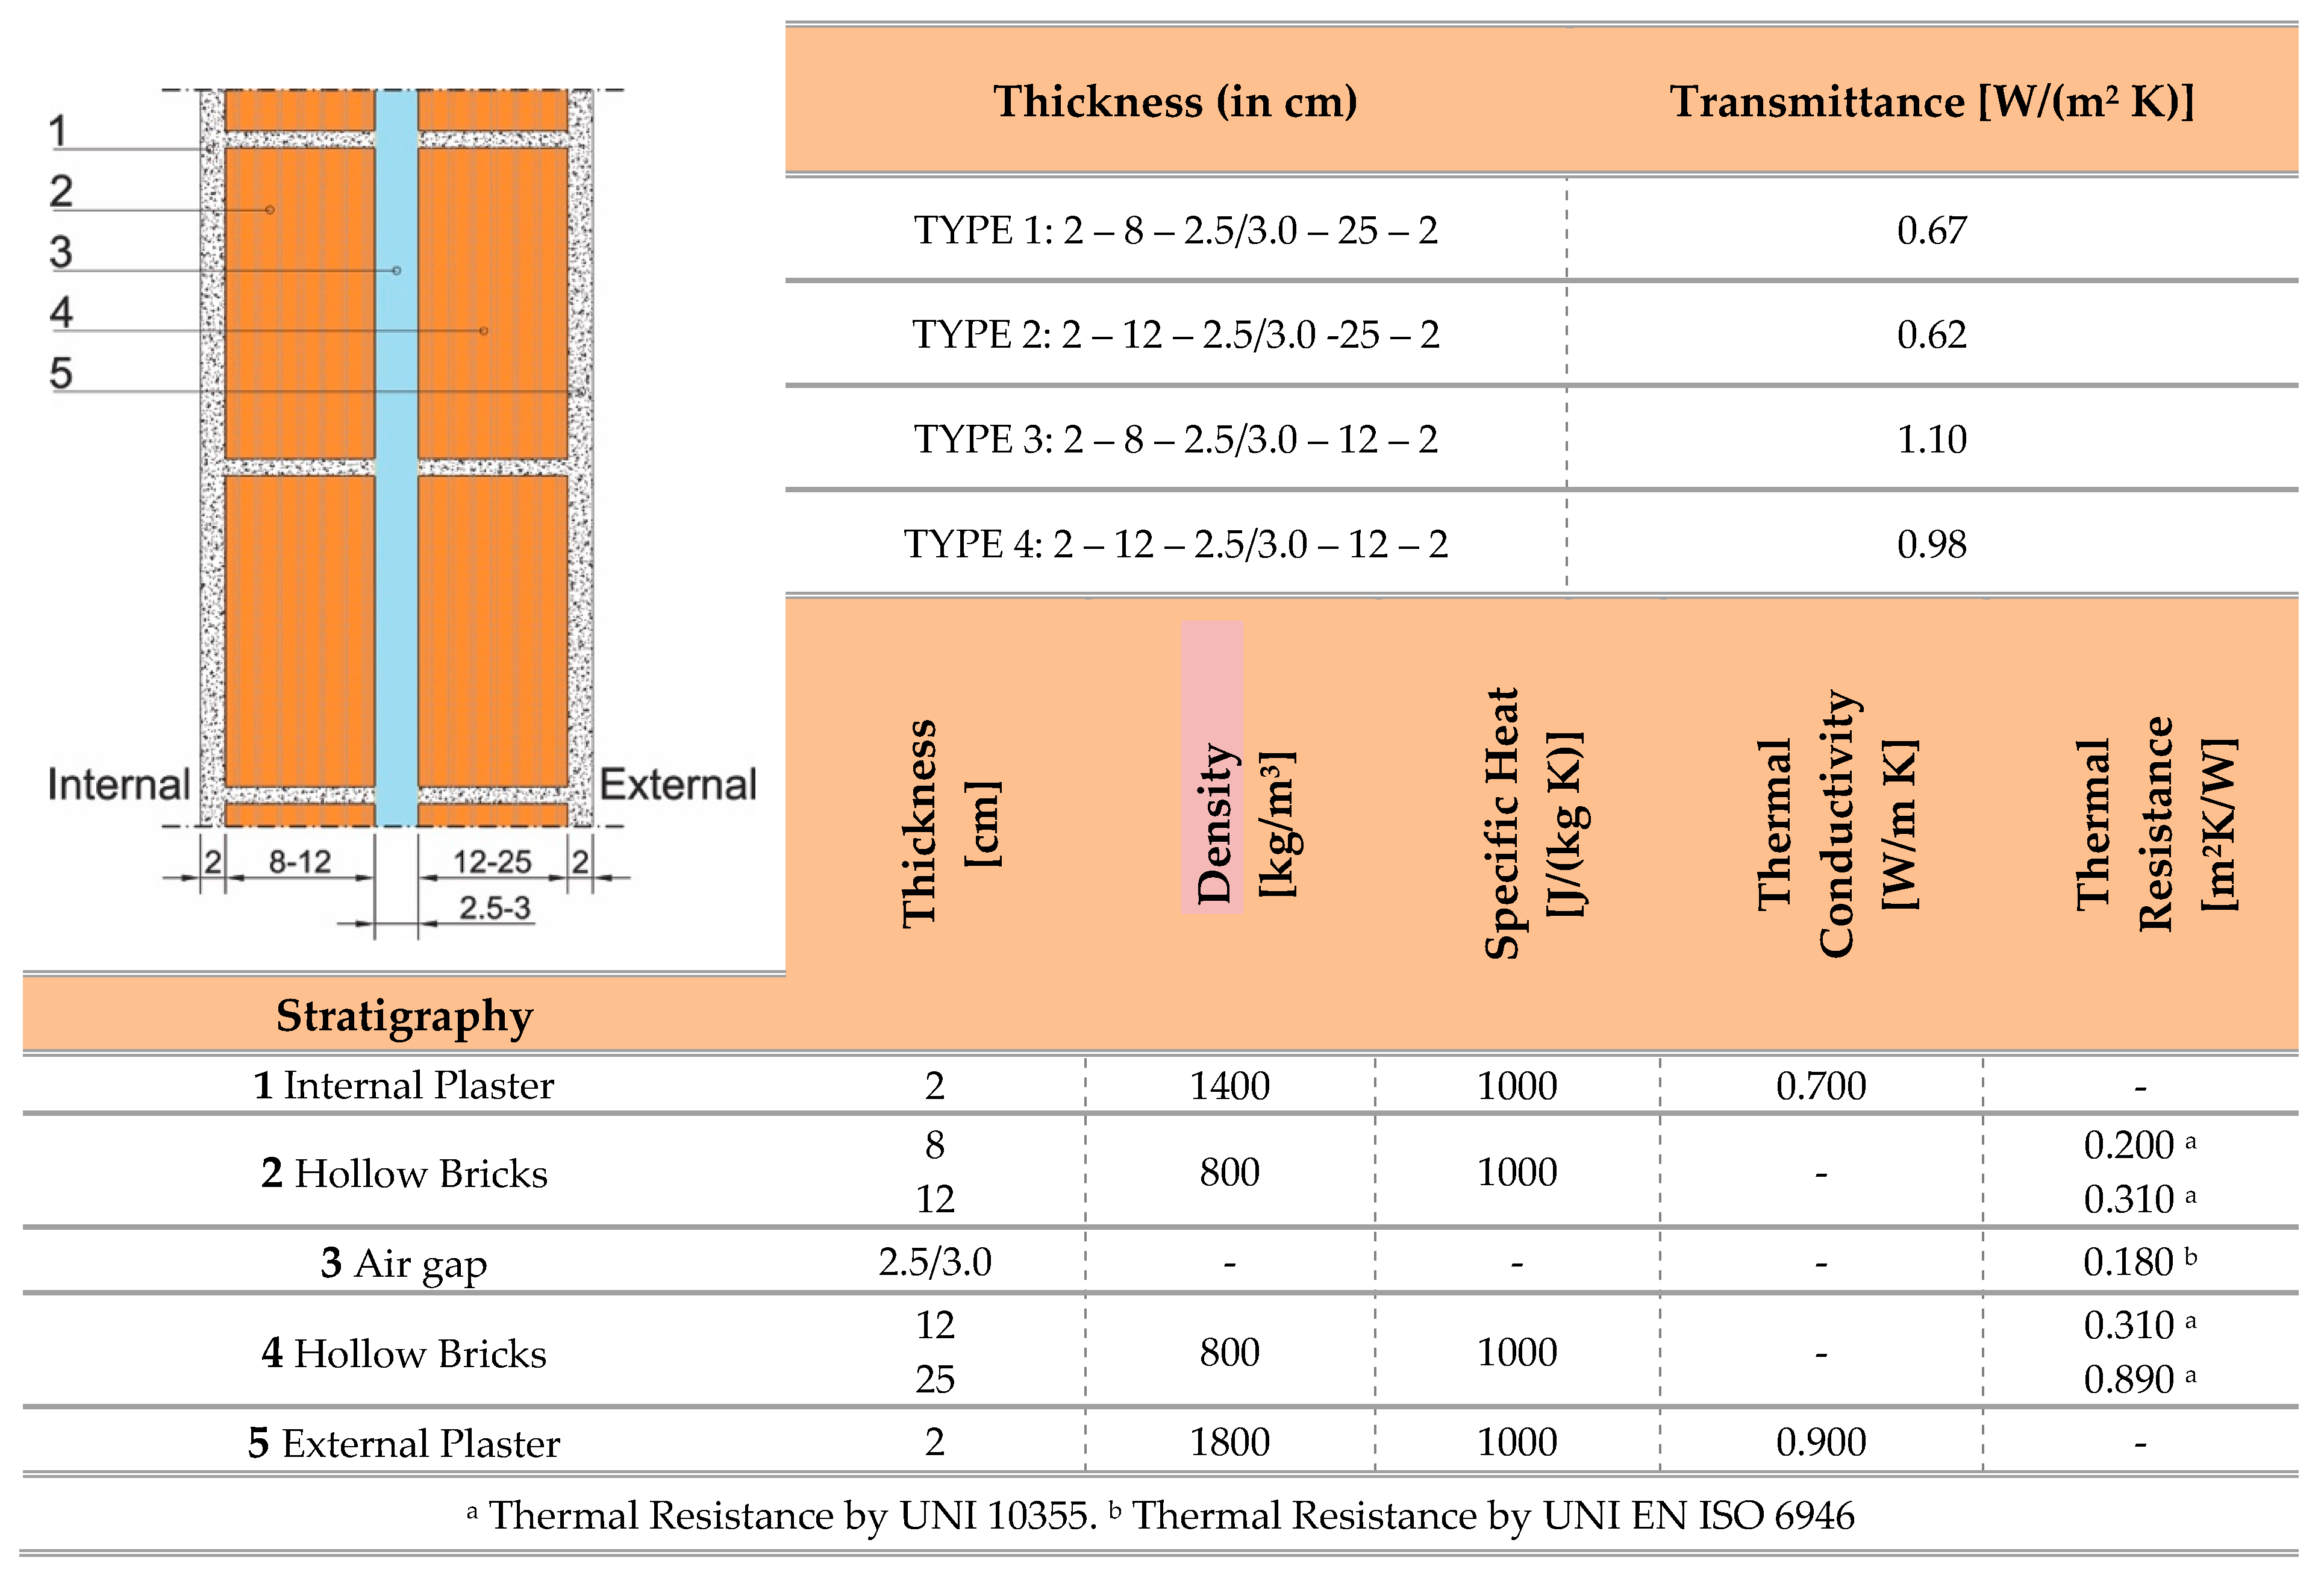
The type of wall object in this study is the typical uninsulated cavity walls made of hollow bricks that have become very widespread in Italy since the 1950s but which saw its use grow considerably during the 1970s, i.e., the years of greatest building boom, Figure 2 [17]. It is a typical Italian construction technology [18], and it has no structural function, but it was used mainly as a wall in reinforced concrete frame buildings as a separation element between the inside and the outside. The stratigraphy consists of a double layer of hollow bricks of different thickness separated by a gap of air in quiet and covered with plaster, both on the inside and on the outside of the masonry itself (for details, see Figure 3). The wall transmittance varies according to the thickness of each layer and, as verifiable in the aforementioned figure, oscillates between a minimum value of 0.62 W/(m2 K) and a maximum value of 1.10 W/(m2 K). In the present study, an average value of 0.98 W/(m2 K) was used corresponding to the stratigraphy in which the thickness of internal and external plaster is equal, i.e., equal to 2 cm, as well as the thickness of the two layers of hollow bricks, i.e., equal to 12 cm.
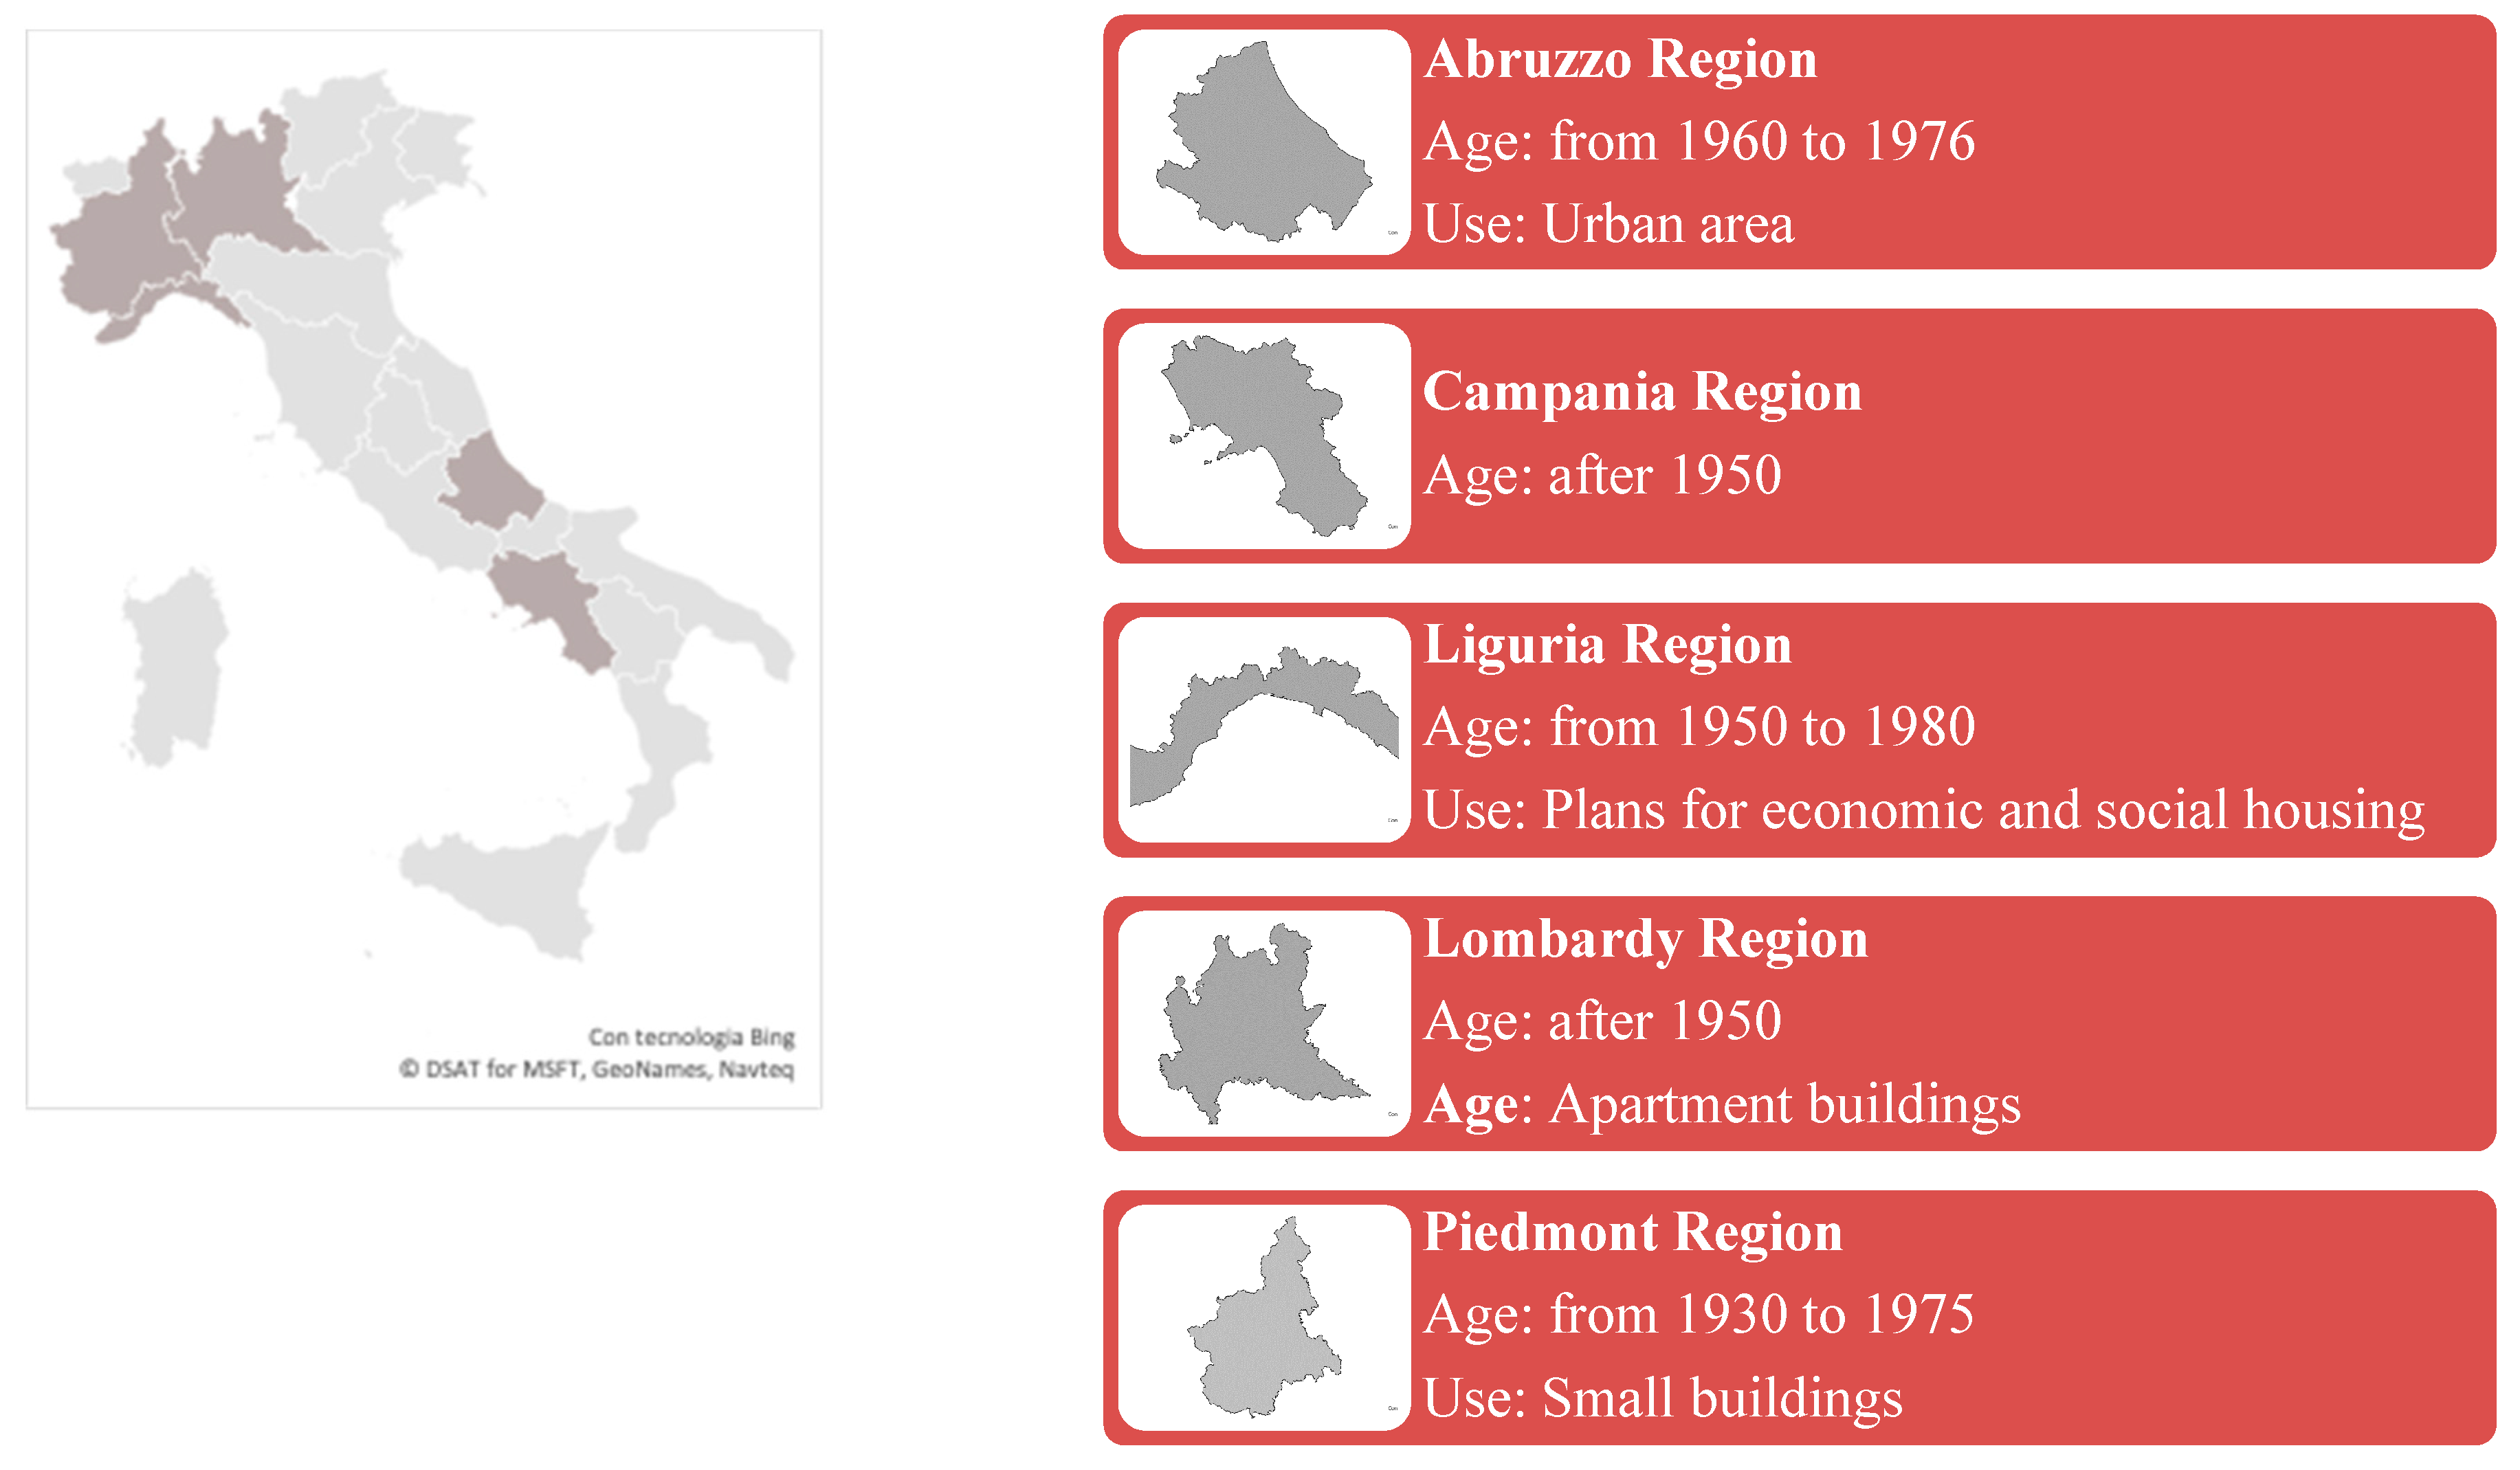
The uninsulated cavity walls made of hollow bricks is a construction typology widespread at least in the regions listed in Figure 4 [16], especially in apartment buildings and also in all buildings belong to the so-called PEEP plans, or plans for economic and social housing. It was also commonly used before the first Italian law for the containment of energy consumption for thermal uses in buildings (Law 30 March 1976, n. 373). Therefore, to date, this wall type is obsolete, and there is an evident need to propose adequate energy retrofit interventions to reduce energy consumption and minimize the total costs of the building equipped with this type of wall. Ascione et al. [19] have the same opinion. In fact, they evaluate the use of phase change materials to reduce the energy demand for cooling and improve the internal comfort of a building equipped with uninsulated cavity walls. Another study by Zinzi et al. [18] illustrates a deep energy retrofit intervention in a 1960s school characterized, like many others, by walls of the type of interest for the present research. For this reason, this study intends to put attention precisely to uninsulated cavity wall made of hollow bricks, the type of wall chosen for the validation of the methodological approach.

2.2. Insulation Materials

The construction sector contributes to environmental pollution due to the exploitation of natural resources and the production of demolition waste. Thus, it is essential to develop new building materials with a low impact on the environment. The sustainability of a material is assessed on the basis of the use of resources and the environmental impact, without neglecting the production process, which should have the minimum amount of energy, reduced production waste, and the possibility of recycling. In construction industry, a material is sustainable if, in addition to having the least possible impact on the environment during its life cycle, it resists mechanical, physical, and chemical stresses [20,21].
However, in the construction sector, the currently most used insulating materials are produced from petrochemical derivatives and have high thermal performance but significant environmental impacts [22].
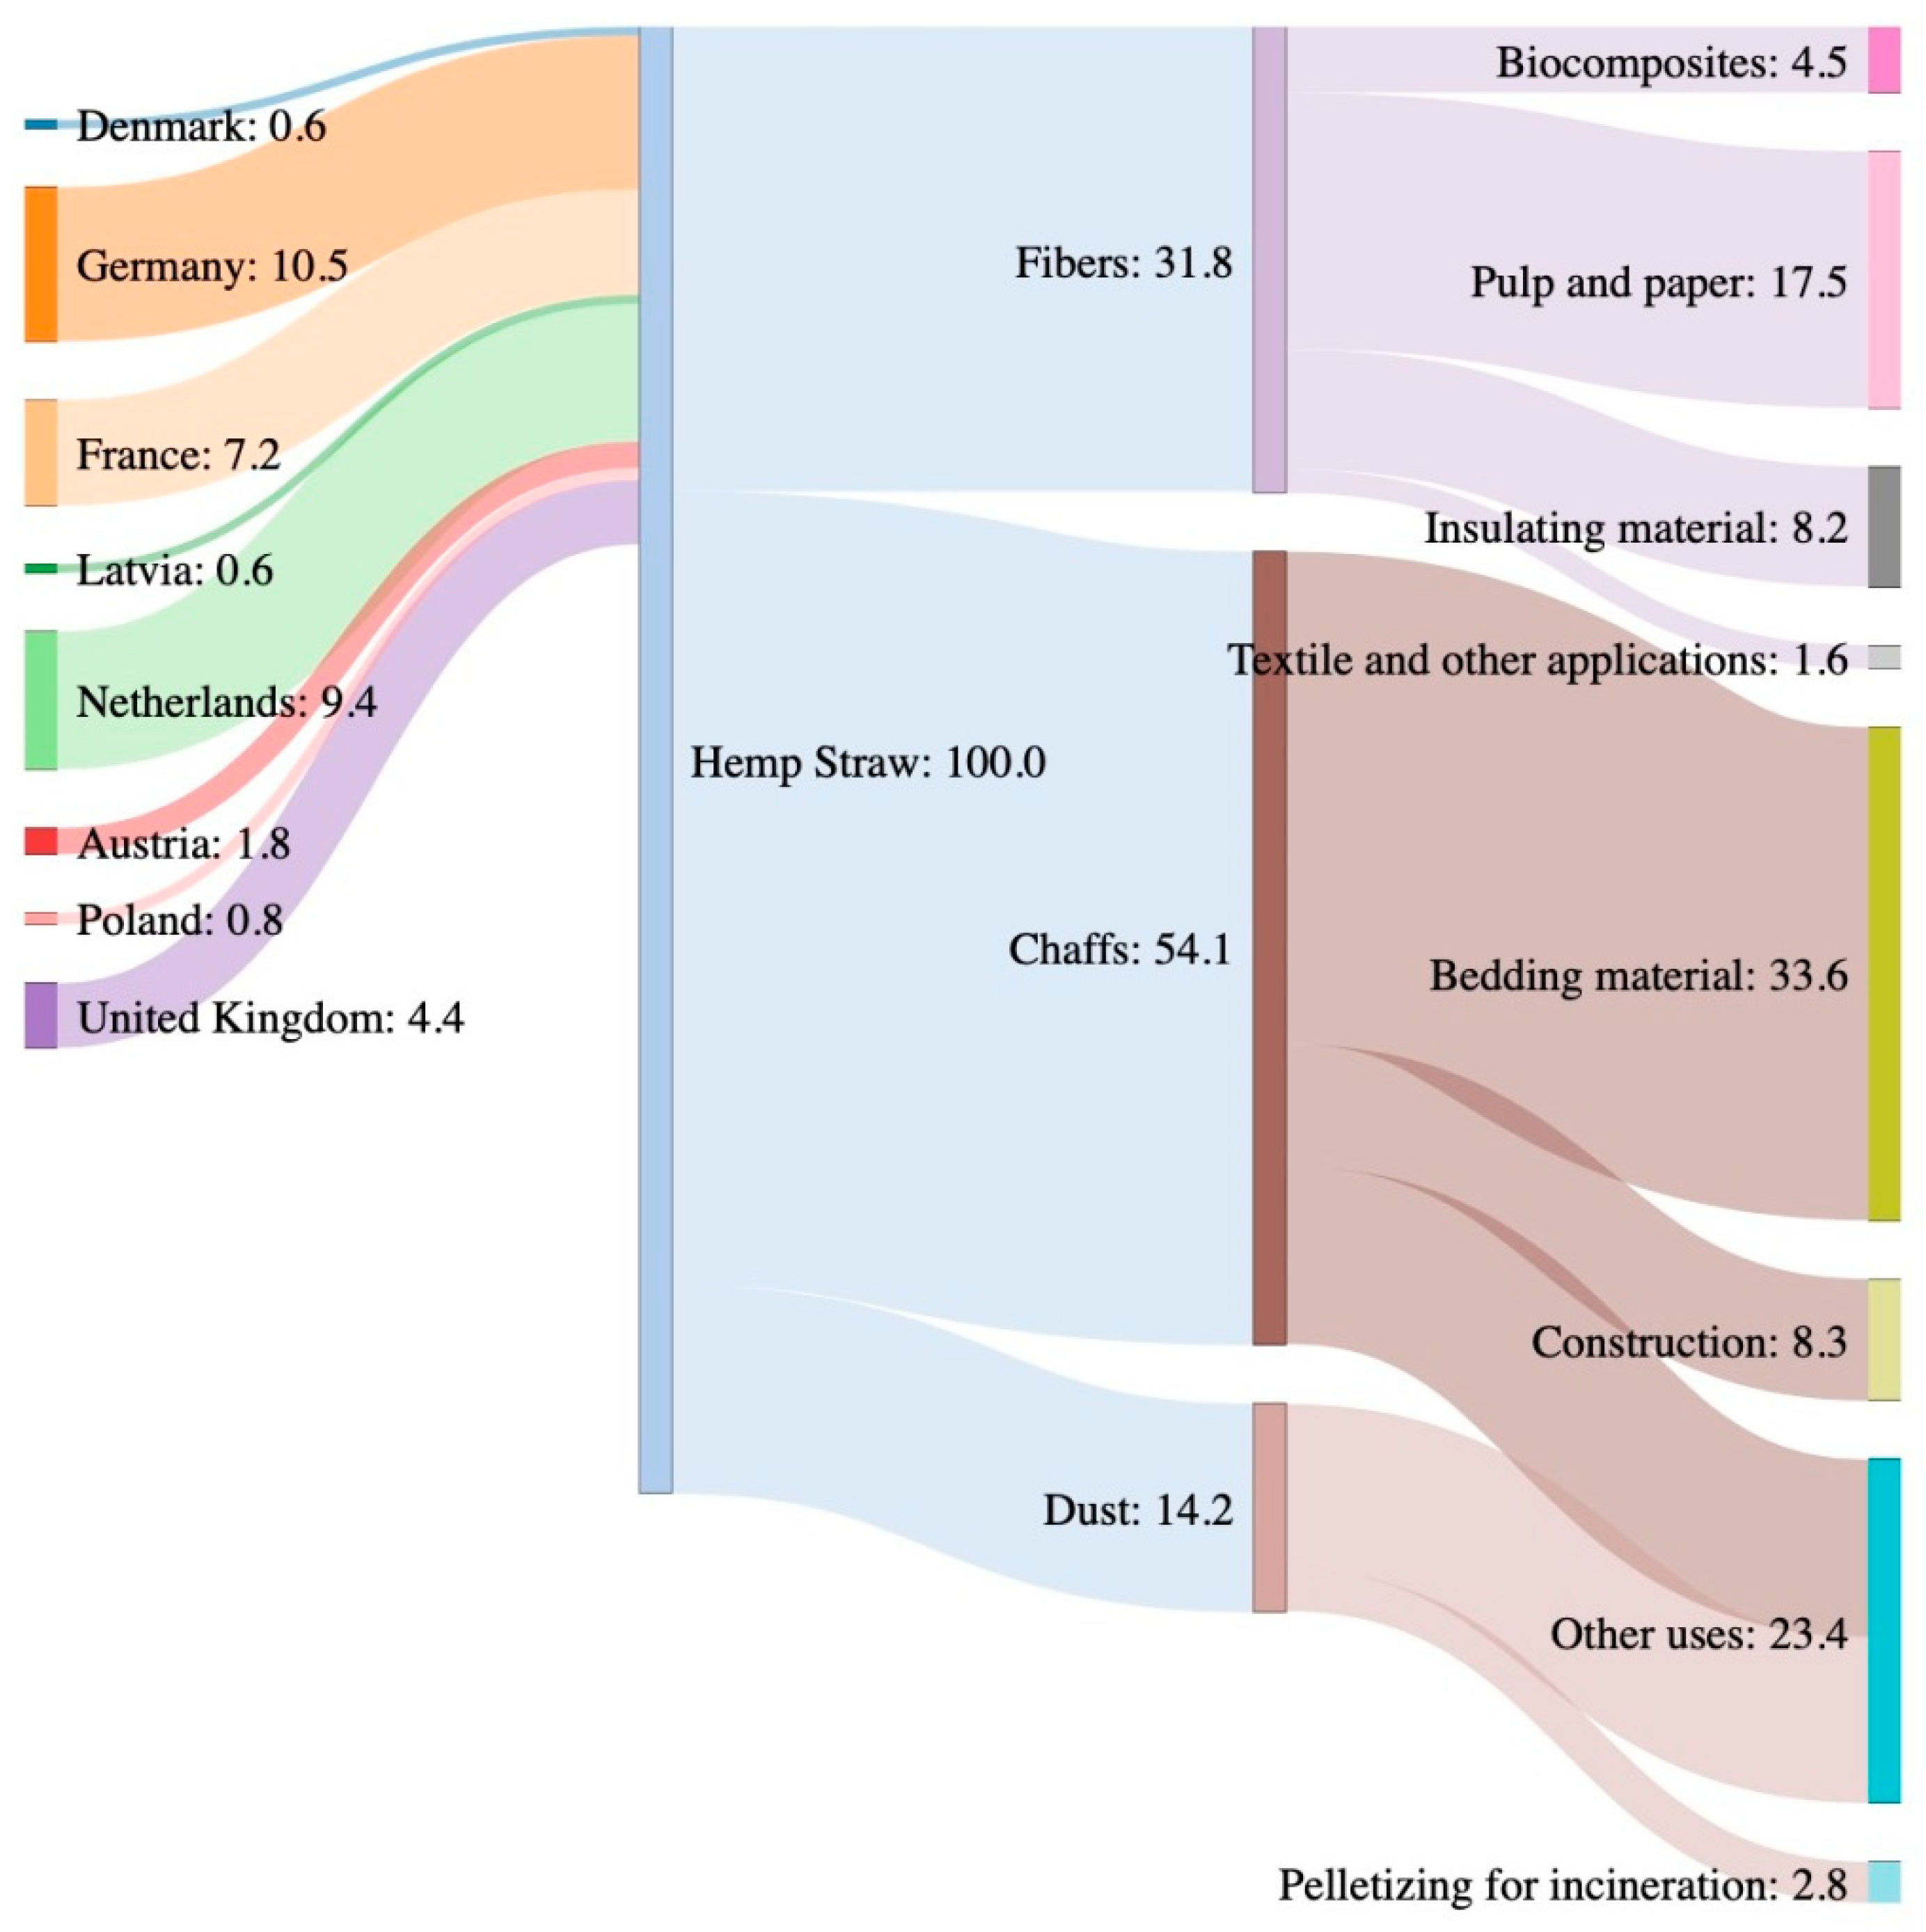
Among bio-based materials, hemp insulators are seen as new materials in the choice of insulation and are increasingly favored by eco-builders [23,24]. According to the IAL Consultants data, in Europe, the share of hemp insulating materials in the total market for thermal insulation products is still very low [25]. In particular, in Figure 5, 8.2% of hemp fibers were used to produce insulating material, and 8.3% of hemp chaffs were utilized in the construction industry.
However, hemp has good properties, low cost, and high cellulose content. Furthermore, its fibers can be easily grown in a wide range of environments and, compared to others of the vegetable type, it has further advantages such as a high biomass yield, the ability to extract heavy metals from the soil, and low production of NO3 [26].
Despite their poor mechanical properties, hemp fibers exhibit excellent acoustic and thermal properties that can reduce heat diffusion and maintain internal hygrothermal comfort thanks to their high porosity and low density [23]. Furthermore, Latif et al. [27] compared the hygrothermal properties between hemp and rock wool, obtaining that the frequency and probability of occurrence of condensation is lower for hemp compared to rock wool.
Among other properties, thermal conductivity is fundamental in evaluating the thermal performance of an insulating material. In fact, the lower thermal conductivity of the insulating material, the greater its ability is to resist heat transfer and, therefore, the greater the effectiveness of the insulation. The thermal conductivity of hemp insulators lies in the thermal conductivity range of a generic insulating material and it is comparable to that of other fibrous insulating materials [25].

2.3. HDD and CDD Values

This section shows the HDD and CDD values for each of the 20 Italian regions [28], Figure 6 and Figure 7 are useful for assessing the correlation between energy demand for heating and cooling for a building in the Italian climate context. The Trentino Alto-Adige is a region with a special statute and includes the territory of the provinces of Trento and Bolzano. The two provinces form a system of autonomous entities characterized by different culture and language. Therefore, the Italian regions are Abruzzo, Aosta Valley, Apulia, Trentino Alto-Adige with Autonomous Province of Bolzano and Autonomous Province of Trento, Basilicata, Calabria, Campania, Emilia-Romagna, Friuli-Venezia Giulia, Lazio, Liguria, Lombardy, Molise, Piedmont, Sardinia, Sicily, the Marches, Tuscany, Umbria, and Veneto.
As previously mentioned, three regions located in the north, in the center, and in the south are taken into consideration in this study—Abruzzo, Campania, and Piedmont. The choice of Abruzzo and Campania was inevitable since, among the regions in Figure 4, they are the only two located respectively in the center and south. Instead, with regard to the regions located in northern Italy, the one that had the most extreme values of CDD and HDD was chosen, which was Piedmont.

3. Materials and Methods

This section aims to illustrate the methodology used to determine the economically optimal thickness of a specific insulating material applied to a specific type of wall. To this end, it is necessary to take into account the correlation between the demand for energy and the climatic context of the Italian regions. The section is divided into two subsections. In particular, Section 3.1 illustrates the Life Cycle Cost Analysis, while Section 3.2 shows the calculation methodology necessary to determine the economically optimal thickness.

3.1. Life Cycle Cost Analysis

A Life Cicle Cost Analysis (LCCA) is an economic tool capable of evaluating the global costs of a product in all its phases of the life cycle [29,30]. In particular, the following cost items are examined:
  • The purchase cost;
  • The operating costs of the product;
  • Maintenance costs for product storage;
  • The final costs for disposal and/or recovery.
In the construction industry, LCCA considers all costs that affect the building from construction to management up to eventual demolition. Thermal insulation, being a valid means of reducing energy losses, entails a reduction in energy costs for cooling and heating against an initial investment necessary for the energy requalification of the building. In this context, the LCCA of the present research takes into account only the investment cost, the heating cost and the cooling cost excluding the operating costs, maintenance costs, and the recovery value [12], and this choice defines the boundary conditions of the study. More precisely, the total cost that affects the building is given by the sum of the
  • Cost of insulating material;
  • Cost of natural gas chosen as heating fuel;
  • Cost of electricity used for cooling.
Furthermore, it is interesting to find, through the use of the LCCA, the value of the thickness of the insulation, which allows both the cost of energy for the cooling and heating system and the cost of the insulating material to be minimized. In fact, the greater the thickness of the insulation to be applied to the building wall, the greater the thermal performance of the property with a reduction in heat losses. At the same time, however, as the thickness of the insulating material increases, the cost of the panel itself also increases. As shown in Figure 8, the heating and cooling costs decrease as the thickness of the insulation increases; on the contrary, the cost of the insulation is directly proportional to its thickness. However, in correspondence with the optimum insulation thickness, x o p t , it is verified that both the energy costs and the cost of the insulation are minimal. Optimum insulation thickness represents the most convenient insulation thickness because
  • for x < x o p t the savings obtained by applying the insulation material is less than the cost of energy for the heating and cooling system;
  • for x > x o p t the higher cost of the insulating panel is not offset by the savings in the cost of heating and cooling.
Therefore, in both cases, there is an increase in total costs.

3.2. Calculation of Optimum Insulation Thickness

The economically optimal thickness is calculated by minimizing the total costs. The total costs expressed in €/m2 are given by the sum of the cost of the insulation, the cost of heating and the cost of cooling:
C t = C h + C c + C i n s
where
  • C t : total cost (€/m2)
  • C h : total heating cost (€/m2)
  • C c : total cooling cost (€/m2)
  • C i n s : cost of insulation (€/m2)
The cost of insulation C i n s is given by
C i n s = C m · x
where C m is cost of insulating material (€/m3) and x is insulation thickness (m).
To estimate the total heating cost, C h , it is necessary to identify the lower heating values of natural gas ( H u ) , efficiency of the heating systems ( η h ) and cost of natural gas ( C f ) . Instead, to estimate the total cooling cost, C c , it is necessary to identify performance of cooling system ( C O P ) and cost of electricity ( C e ) .
Total heating cost C h and total cooling cost C c are estimated with the Equations (3) and (4):
C h = 86400 · H D D · C f · P W F ( R t w + x λ ) · H u · η h
C c = 86400 · C D D · P W F · C e · 2.778 · 10 7 ( R t w + x λ ) · C O P
Here, 86,400 and 2.778 · 10 7 are conversion factors (1 day = 86,400 s and 1 Joule = 2.778 · 10 7 kWh), R t w is the total thermal resistance of the wall without heat insulation expressed in (m2 K)/W, x   λ is the thermal resistance of the insulating material in (m2 K)/W.
For the definition of HDD and CDD it is necessary to apply the degree-days (DDs) method, which assesses the effect of temperature changes on the energy consumption of a building assuming that both the use of the building that the building heating and cooling systems are constant over time [31]. This method assumes that the difference between the average outdoor temperature and the base temperature is directly proportional to the building’s energy needs. The base temperature is a known value and represents the external temperature that allows for the internal comfort of a building without the functioning of the heating/cooling systems [32].
Degree Days (DDs) for a given geographical location, are defined as the sum of the positive differences between the base temperature and the average daily outdoor temperature, calculated over a 12-month period. Therefore, for the estimate of Heating Degree Days (HDD), the difference between the base temperature and the average daily outdoor temperature is calculated only when the base temperature is greater than the outdoor temperature. On the contrary, in the case of Cooling Degree Days (CDD), this difference is quantified only when the external temperature is greater than the base temperature [32]. HDD and CDD values can be calculated with the following equations:
H D D = i = 1 N d ( T b T d )    f o r   T b T d
C D D = i = 1 N d ( T d T b )    f o r   T d > T b
where
  • N d : number of heating or cooling days of a certain time period
  • T b : base temperature [°C]
  • T d : daily-mean temperature [°C]
PWF is the Present Worth Factor and allows for the conversion of all costs incurred at different times, in one moment, usually at the time of the first payment. In the case study, the annual cost of heating and cooling was calculated based on the present value considering an inflation rate (f) and an interest rate (i) of 1.18% and 2.8% respectively and a useful life (N) 20 years old. In particular, PWF is calculated with the following equation:
P W F = ( 1 + r ) N 1 r · ( 1 + r ) N
with
r = i f 1 + f
Therefore, the total cost of a thermally insulated wall structure is
C t = 86400 · P W F ( R t w + x λ ) · ( H D D · C f H u · η h + C D D · C e · 2.778 · 10 7 C O P ) + C m · x
Once the total cost of a thermally insulated wall structure has been identified, it is possible to determine the value of the thickness of the insulation which allows to minimize both the cost of energy for the cooling and heating system and the cost of the insulating material. Therefore, x o p t is calculated by placing the derivative of the function C t with respect to the thickness of the insulating material “x” equal to zero:
x   ( 86400 · P W F ( R t w + x λ ) · ( H D D · C f H u · η h + C D D · C e · 2.778 · 10 7 C O P ) + C m · x ) = 0
By solving Equation (10) it is possible to calculate x o p t
x o p t = [ P W F · 86400 · λ C m · ( C D D · C e · 2.778 · 10 7 C O P + H D D · C f H u · η h ) ] 1 2 λ · R t w

4. Results and Discussion

The following section shows the results obtained by applying the methodology described in the previous section to the case under study. To this end, all of the input data required have been found or calculated, as summarized in Figure 9. In particular, the thermal conductivity of the hemp fiber was extrapolated from UNI 10351:2015 [33]. Instead, the cost of the insulating materials was extrapolated from Annibaldi et al. [12]. The characteristics of the heating and cooling system have been extrapolated from literature data [12,34,35].
The HDD and CDD values for the Abruzzo, Campania and Piedmont regions were considered from Eurostat Database [28]. Finally, the external wall type properties was calculated by UNI 11552:2014 [16].
Finding all the necessary data, the model presented in the previous section was applied to the following three Italian regions:
  • Piedmont, located in the north-western part of the country;
  • Campania, located in southern Italy;
  • Abruzzo, located in central Italy.
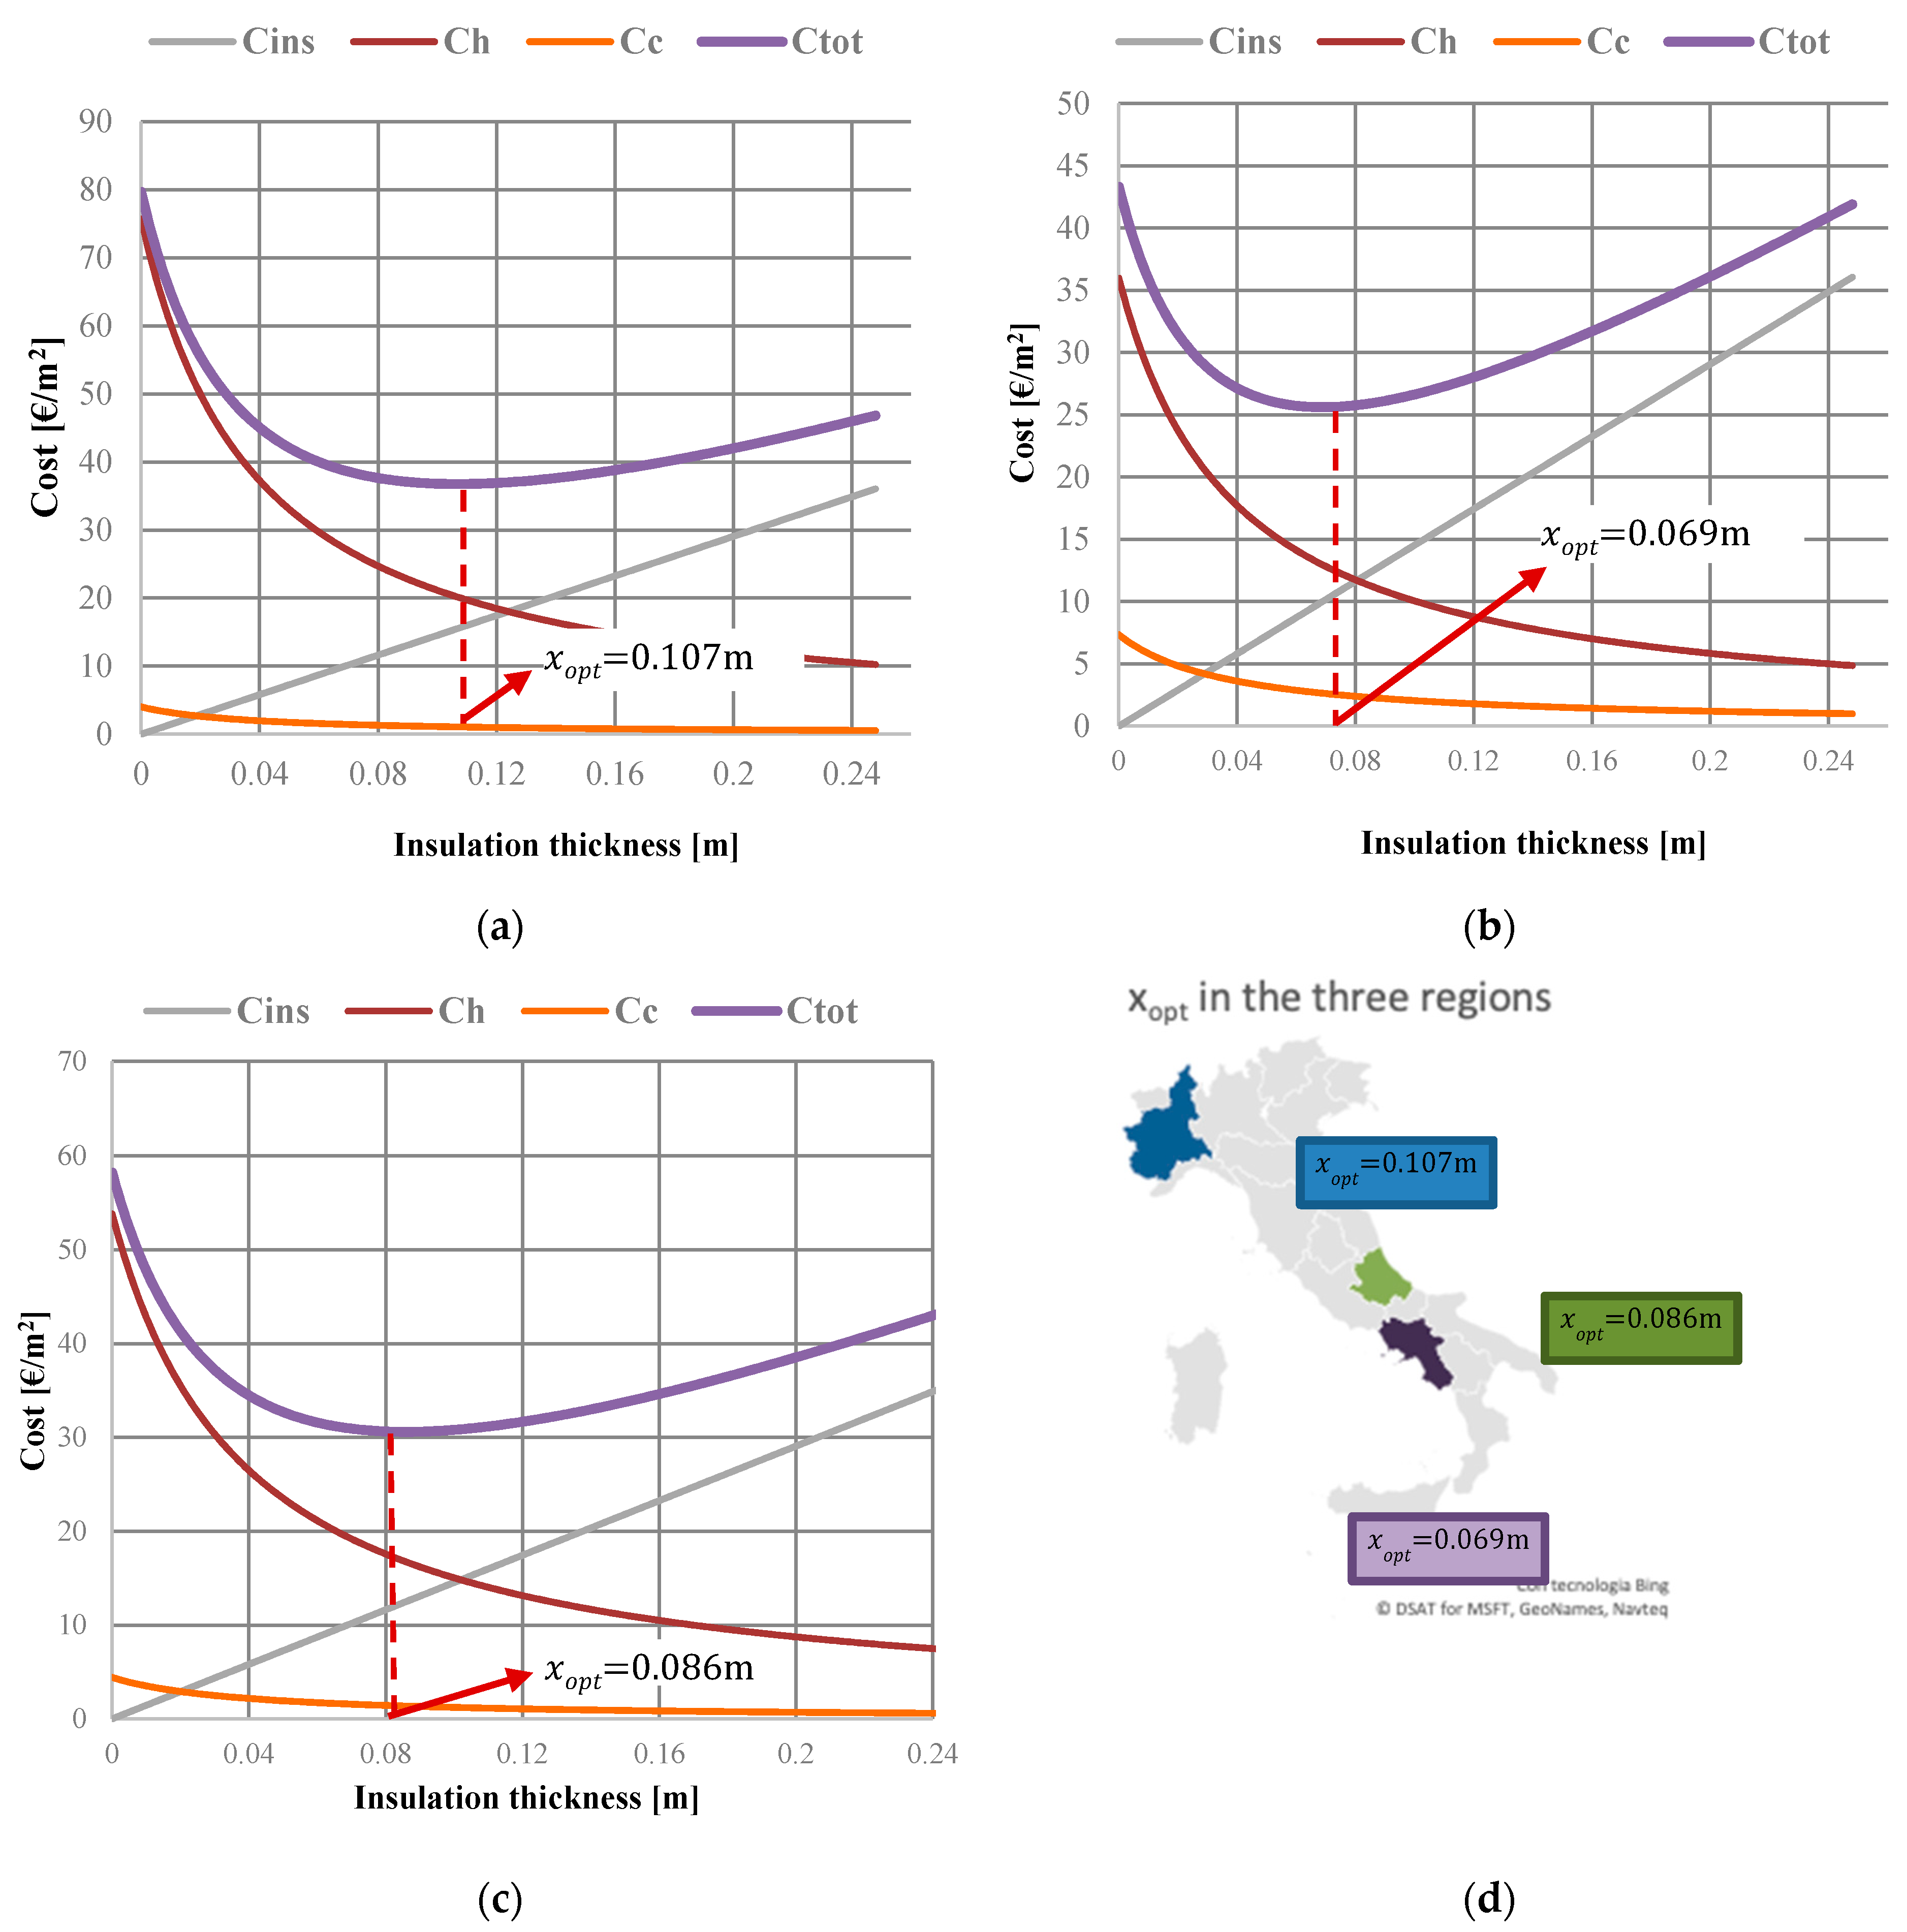
The economically optimal thickness of the hemp fiber applied to the same type of wall was calculated for each of the regions analyzed. This is because, in the research, the location of the case study within the Italian peninsula assumed great importance. In fact, in the Italian peninsula, the climate varies considerably from north to south and, consequently, so do the HDD and CDD values. The north is characterized by a harsh climate with very cold winters and very hot summers. In the center, the climate is temperate, and the south is characterized by a dry and hot climate in summer with non-rigid winters. For this reason, the choice of the regions to be analyzed was established according to the climatic differences. The results obtained confirm this trend. In fact, they show that the three regions have a specific economically optimal thickness value for the hemp fiber applied to the uninsulated cavity wall made of hollow bricks as previously defined (Figure 3). Specifically, the research results illustrate how the optimal thickness in Campania is equal to 0.069 m, 0.086 m in Abruzzo, and 0.107 m in Piedmont (Figure 10).
Piedmont requires a greater thickness of the hemp fiber insulation than the remaining regions in order to balance the investment cost and operating costs due to heating and cooling. In fact, as it is possible to verify in Figure 10, a thickness of the hemp fiber insulation equal to 0.107 m compensates for the additional cost of the insulating layer on the wall structure located in Piedmont with the lower cost of heating and cooling.
On the other hand, for the Campania and Abruzzo regions, it is necessary to have a thickness of the hemp fiber equal to 0.069 m and 0.086 m, respectively, to have the minimization of the total costs (Figure 10).
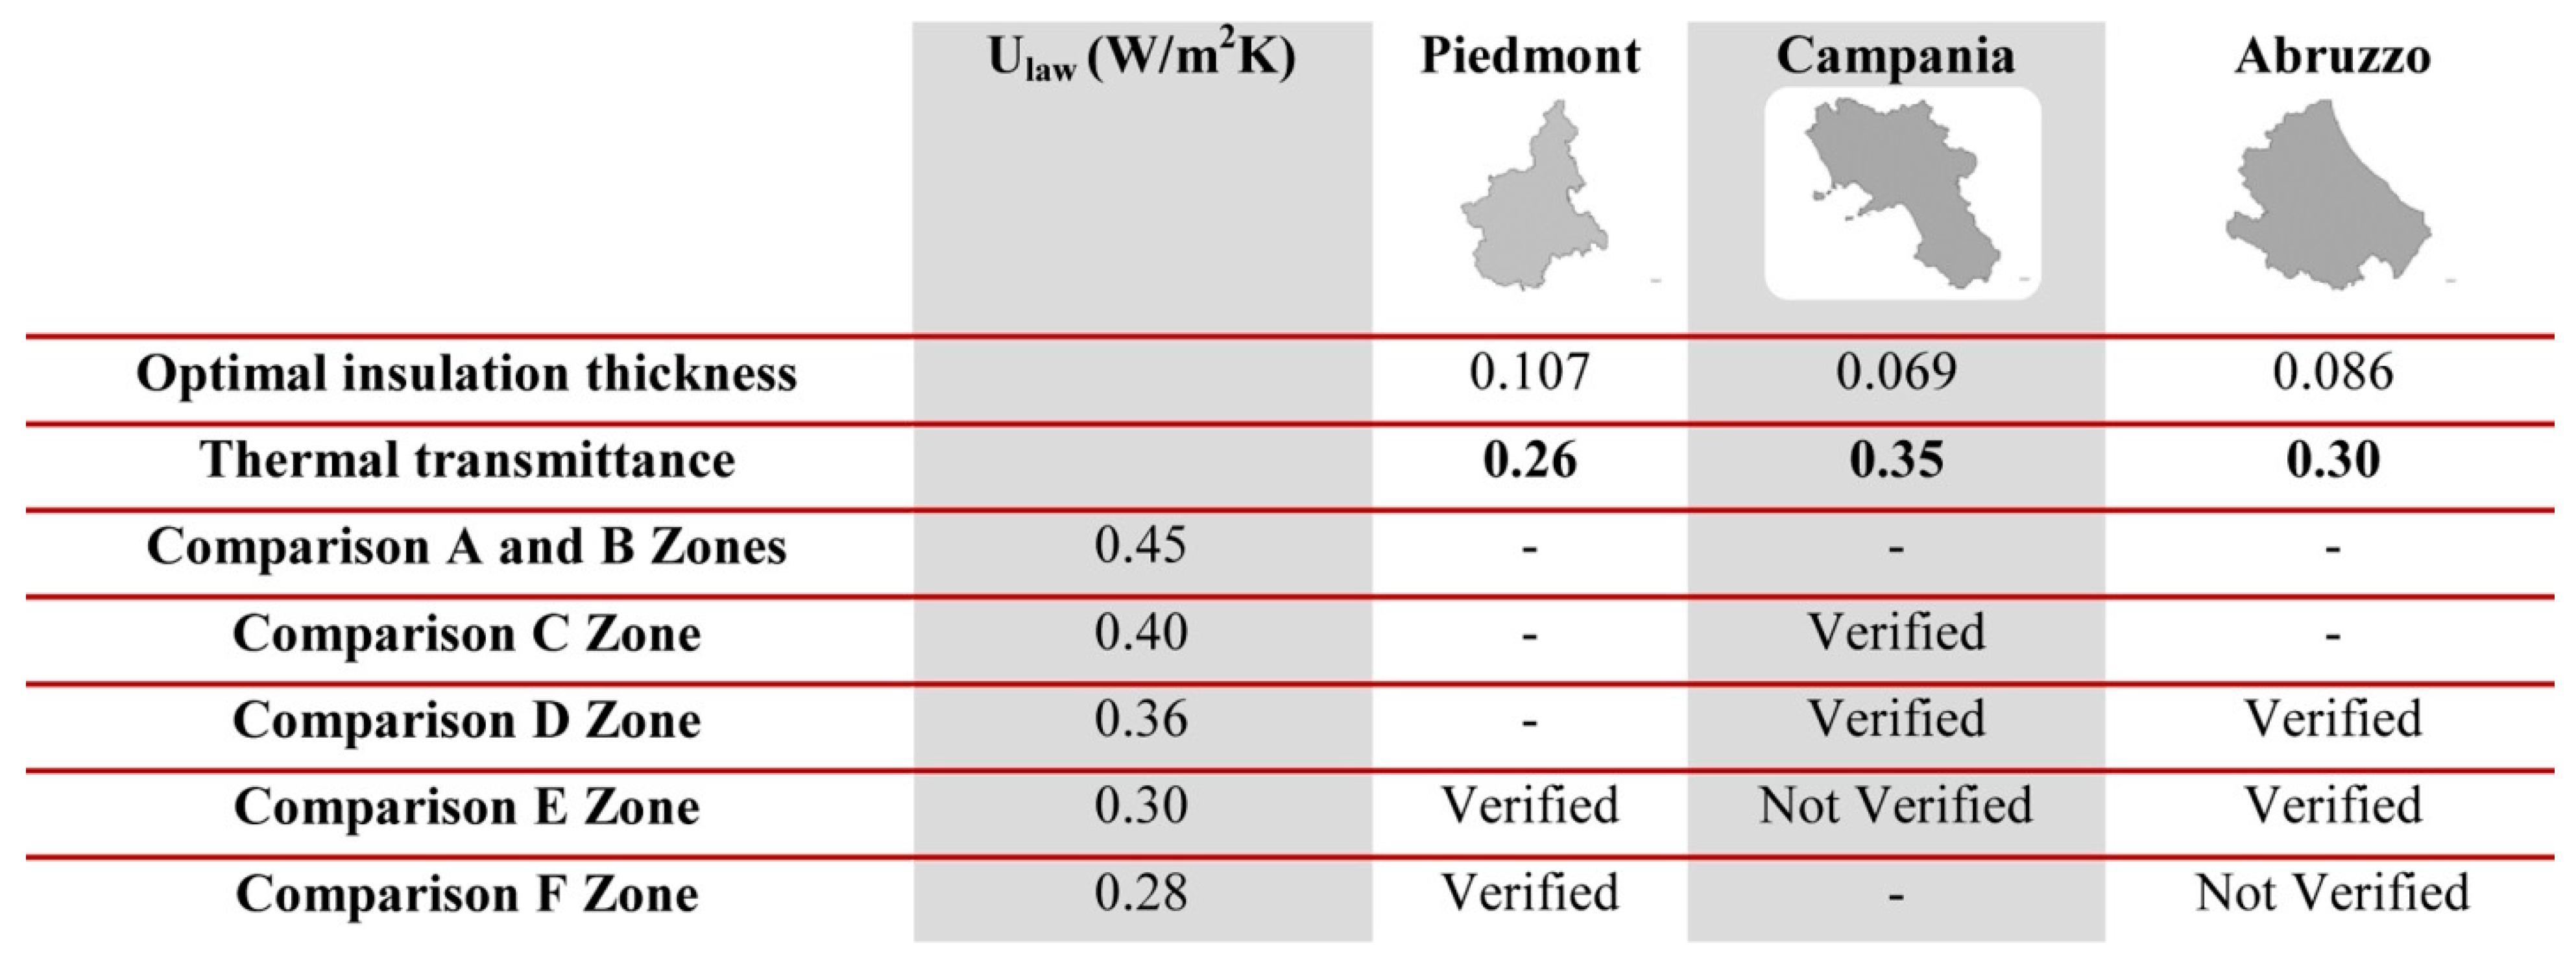
In the light of the three optimal thicknesses obtained, the thermal transmittance value associated with each of them was then calculated. This thermal transmittance was equal to 0.26 W/m2 K in Piedmont, 0.30 W/m2 K in Abruzzo, and 0.35 W/m2 K in Campania. These results were then compared with Italian law standards (M.D. of 26.05.2015, Table 1 of Appendix B), which define the limit values of the thermal transmittance for the external vertical walls (Table 1). These limits are set according to six climatic zones (Presidential Decree 412 of 26.08.1993). The territory of Piedmont falls into two of these climatic zones (E and F), while Campania and Abruzzo fall into three—that is C, D, and E for the first region and D, E, and F for the second. In order to make the aforementioned comparison between the transmittance calculated by the optimal thickness and the limit value (Figure 11), it is possible to observe that the former is verified in most cases. For example, in the Piedmont case, the transmittance related to the optimal thickness of the hemp panel is equal to 0.26 W/m2 K, which is less than the limit value for zone E, 0.30 W/m2 K, and also for zone F, 0.28 W/m2 K. It is therefore clear that, also from the regulatory point of view, the methodology illustrated in this article confirms its validity.
The results obtained illustrate how energy efficiency choices must be assessed on the basis of many parameters, seeking a correct balance between the environmental and economic issues that, in fact, then represent the two perspectives of the same problem. For this reason, it is necessary to carefully evaluate energy retrofit strategies. In fact, this study has shown how the environmental and climatic contexts influences the energy behavior of the different strategies.

5. Conclusions

The proper design of a building envelope with the determination of the appropriate amount of insulating material can lead to energy savings. Any study of the state of the art has shown how many researchers investigate in this important field. One of the main topics is related to the optimal insulation thickness identification in which the sum of the installation cost of the insulating material and the energy cost is minimal. This optimal thermal insulation thickness depends on various factors, including the wall type, the thermal insulation material, and the different climatic conditions.
In this study, hemp fiber thermal insulation was applied to the same wall type located in three Italian regions with different climatic conditions. The wall being studied is an uninsulated cavity wall made of hollow bricks that is a construction typology widespread in Italy. The selected regions are Piedmont, located in the north-western part of the country; Campania, located in southern Italy; and Abruzzo, located in central Italy.
The results show that the economically optimal thickness is different for each region analyzed. In fact, each region has a specific HDD and CDD and consequently a different thermal requirement for heating and cooling. The region that requires the highest economically optimal thickness is Piedmont (0.107 m), characterized by a continental climate with cold winters and very hot summers. Campania, on the contrary, is characterized by a Mediterranean climate with mild temperatures, and therefore the economically optimal thickness is less (0.069 m). Instead Abruzzo requires a thickness of 0.086 m. The results also demonstrated the possibility of effectively applying the methodology developed in light of the current legislative constraints. Its strength derives from the fact that it takes into account the climatic peculiarities of each context in which it is applied. Moreover, it can validly direct and guide retrofit strategies.
The study presented demonstrates how energy efficiency strategies must be carefully weighed according to the specific conditions of the site. Moreover, the authors are currently applying the same methodology presented here to further types of walls that are widespread in the national territory.

Author Contributions

C.F. and R.M. conceived and designed the experiments and the methodology; R.M. was the corresponding author, defined the structure and organization of the article, and realized the review; C.F. and R.M. also defined the editing and wrote the paper with A.V., who carried out the economic analyses. All authors have read and agreed to the published version of the manuscript.

Funding

This research received no external funding.

Conflicts of Interest

The authors declare no conflict of interest.

Nomenclature

C c Total cooling cost (€/m2)
C e Cost of electricity (€/kWh)
C f Cost of natural gas (€/kg)
C h   Total heating cost (€/m2)
C i n s Cost of insulation (€/m2)
C m Cost of insulating material (€/m3)
C t Total cost (€/m2)
C D D Cooling degree-days (°C-days)
C O P Performance of cooling system
DDsDegree-days
f Inflation rate (%)
H u Lower heating values of natural gas (J/kg)
H D D Heating degree-days (°C-days)
i Interest rate (%)
NLifetime (years)
N d Number of heating or cooling days of a certain time period
PWFPresent Worth Factor
R t w Total thermal resistance of the wall in the absence of the intervention ((m2 K)/W)
T b Base temperature (°C)
T d Daily-mean temperature (°C)
x Insulation thickness (m)
x o p t Optimum insulation thickness (m)
x λ Thermal resistance of the insulant ((m2 K)/W)
η h Efficiency of the heating systems
λ Thermal conductivity of the insulation (W/(m·K))
UThermal transmittance (W/(m2·K))

References

  1. Ascione, F.; Bianco, N.; Mauro, G.M.; Napolitano, D.F. Building envelope design: Multi-objective optimization to minimize energy consumption, global cost and thermal discomfort. Application to different Italian climatic zones. Energy 2019, 174, 359–374. [Google Scholar] [CrossRef]
  2. Sigarchian, S.G.; Malmquist, A.; Martin, V. The choice of operating strategy for a complex polygeneration system: A case study for a residential building in Italy. Energy Convers. Manag. 2018, 163, 278–291. [Google Scholar] [CrossRef]
  3. Vincelas, F.F.C.; Ghislain, T. The determination of the most economical combination between external wall and the optimum insulation material in Cameroonian’s buildings. J. Build. Eng. 2017, 9, 155–163. [Google Scholar] [CrossRef]
  4. Bourguiba, A.; Touati, K.; Sebaibi, N.; Boutouil, M.; Khadraoui, F. Recycled duvets for building thermal insulation. J. Build. Eng. 2020, 31, 101378. [Google Scholar] [CrossRef]
  5. Ozel, M. Cost analysis for optimum thicknesses and environmental impacts of different insulation materials. Energy Build. 2012, 49, 552–559. [Google Scholar] [CrossRef]
  6. D’Agostino, D.; de’ Rossi, F.; Marigliano, M.; Marino, C.; Minichiello, F. Evaluation of the optimal thermal insulation thickness for an office building in different climates by means of the basic and modified “cost-optimal” methodology. J. Build. Eng. 2019, 24, 100743. [Google Scholar] [CrossRef]
  7. Mahlia, T.M.I.; Iqbal, A. Cost benefits analysis and emission reductions of optimum thickness and air gaps for selected insulation materials for building walls in Maldives. Energy 2010, 35, 2242–2250. [Google Scholar] [CrossRef]
  8. Dombaycı, Ö.A. The environmental impact of optimum insulation thickness for external walls of buildings. Build. Environ. 2007, 42, 3855–3859. [Google Scholar] [CrossRef]
  9. Dylewski, R. Optimal Thermal Insulation Thicknesses of External Walls Based on Economic and Ecological Heating Cost. Energies 2019, 12, 3415. [Google Scholar] [CrossRef] [Green Version]
  10. Daouas, N. A study on optimum insulation thickness in walls and energy savings in Tunisian buildings based on analytical calculation of cooling and heating transmission loads. Appl. Energy 2011, 88, 156–164. [Google Scholar] [CrossRef]
  11. Yu, J.; Yang, C.; Tian, L.; Liao, D. A study on optimum insulation thicknesses of external walls in hot summer and cold winter zone of China. Appl. Energy 2009, 86, 2520–2529. [Google Scholar] [CrossRef]
  12. Annibaldi, V.; Cucchiella, F.; De Berardinis, P.; Rotilio, M.; Stornelli, V. Environmental and economic benefits of optimal insulation thickness: A life-cycle cost analysis. Renew. Sustain. Energy Rev. 2019, 116, 109441. [Google Scholar] [CrossRef]
  13. Torres-Rivas, A.; Palumbo, M.; Haddad, A.; Cabeza, L.F.; Jiménez, L.; Boer, D. Multi-objective optimisation of bio-based thermal insulation materials in building envelopes considering condensation risk. Appl. Energy 2018, 224, 602–614. [Google Scholar] [CrossRef]
  14. Kylili, A.; Fokaides, P.A. Policy trends for the sustainability assessment of construction materials: A review. Sustain. Cities Soc. 2017, 35, 280–288. [Google Scholar] [CrossRef]
  15. Freivalde, L.; Kukle, S.; Andžs, M.; Bukšāns, E.; Grāvītis, J. Flammability of raw insulation materials made of hemp. Compos. Part B Eng. 2014, 67, 510–514. [Google Scholar] [CrossRef]
  16. UNI/TR 11552:2014. Opaque Envelope Components of Buildings–Thermo-Physical Parameters; Italy, 2014; Available online: http://store.uni.com/catalogo/uni-tr-11552-2014?josso_back_to=http://store.uni.com/josso-security-check.php&josso_cmd=login_optional&josso_partnerapp_host=store.uni.com (accessed on 1 June 2020).
  17. Perrone, D.; O’Reilly, G.J.; Monteiro, R.; Filiatrault, A. Assessing seismic risk in typical Italian school buildings: From in-situ survey to loss estimation. Int. J. Disaster Risk Reduct. 2020, 44, 101448. [Google Scholar] [CrossRef]
  18. Zinzi, M.; Agnoli, S.; Battistini, G.; Bernabini, G. Deep energy retrofit of the T. M. Plauto School in Italy—A five years experience. Energy Build. 2016, 126, 239–251. [Google Scholar] [CrossRef]
  19. Ascione, F.; Bianco, N.; De Masi, R.F.; Mastellone, M.; Vanoli, G.P. Phase Change Materials for Reducing Cooling Energy Demand and Improving Indoor Comfort: A Step-by-Step Retrofit of a Mediterranean Educational Building. Energies 2019, 12, 3661. [Google Scholar] [CrossRef] [Green Version]
  20. Florea, I.; Manea, D.L. Analysis of Thermal Insulation Building Materials Based on Natural Fibers. Procedia Manuf. 2019, 32, 230–235. [Google Scholar] [CrossRef]
  21. Cucchiella, F.; D’Adamo, I.; Gastaldi, M. Municipal waste management and energy recovery in an Italian region. Waste Manag. Res. 2012, 30, 1290–1298. [Google Scholar] [CrossRef]
  22. Nguyen, S.T.; Tran-Le, A.D.; Vu, M.N.; To, Q.D.; Douzane, O.; Langlet, T. Modeling thermal conductivity of hemp insulation material: A multi-scale homogenization approach. Build. Environ. 2016, 107, 127–134. [Google Scholar] [CrossRef]
  23. Somé, S.C.; Ben Fraj, A.; Pavoine, A.; Hajj Chehade, M. Modeling and experimental characterization of effective transverse thermal properties of hemp insulation concrete. Constr. Build. Mater. 2018, 189, 384–396. [Google Scholar] [CrossRef]
  24. Cucchiella, F.; D’Adamo, I.; Gastaldi, M. A multi-objective optimization strategy for energy plants in Italy. Sci. Total Environ. 2013, 443, 955–964. [Google Scholar] [CrossRef] [PubMed]
  25. Lekavicius, V.; Shipkovs, P.; Ivanovs, S.; Rucins, A. Thermo-Insulation Properties of Hemp-Based Products. Latv. J. Phys. Tech. Sci. 2015, 52, 38–51. [Google Scholar] [CrossRef] [Green Version]
  26. Iucolano, F.; Boccarusso, L.; Langella, A. Hemp as eco-friendly substitute of glass fibres for gypsum reinforcement: Impact and flexural behaviour. Compos. Part B Eng. 2019, 175, 107073. [Google Scholar] [CrossRef]
  27. Latif, E.; Tucker, S.; Ciupala, M.A.; Wijeyesekera, D.C.; Newport, D. Hygric properties of hemp bio-insulations with differing compositions. Constr. Build. Mater. 2014, 66, 702–711. [Google Scholar] [CrossRef] [Green Version]
  28. Energy Statistics. Available online: https://ec.europa.eu/eurostat/web/energy/data/database (accessed on 29 May 2020).
  29. Wennström, J.; Karlsson, R. Possibilities to reduce pavement rehabilitation cost of a collision-free road investment using an LCCA design procedure. Int. J. Pavement Eng. 2014, 17, 331–342. [Google Scholar] [CrossRef]
  30. ISO 15686-5:2017. Buildings and constructed assets—Service life planning—Part 5. In Life-Cycle Costing; ISO: Geneva, Switzerland, 2017. [Google Scholar]
  31. Shin, M.; Do, S.L. Prediction of cooling energy use in buildings using an enthalpy-based cooling degree days method in a hot and humid climate. Energy Build. 2016, 110, 57–70. [Google Scholar] [CrossRef]
  32. D’Amico, A.; Ciulla, G.; Panno, D.; Ferrari, S. Building energy demand assessment through heating degree days: The importance of a climatic dataset. Appl. Energy 2019, 242, 1285–1306. [Google Scholar] [CrossRef]
  33. UNI 10351:2015. Building Materials and Products, Hygrothermal Properties, Procedure for Determining the Design Values; Italia, 2015; Available online: http://store.uni.com/catalogo/uni-10351-2015 (accessed on 1 June 2020).
  34. Dian, M.N.; Idris, M.; Nugroho, A.P. Weriono. Room air conditioning performance using liquid-suction heat exchanger retrofitted with R290. Case Stud. Therm. Eng. 2019, 13, 100350. [Google Scholar]
  35. Arera, Prezzi e Tariffe. Available online: https://www.arera.it/it/prezzi.htm (accessed on 29 May 2020).
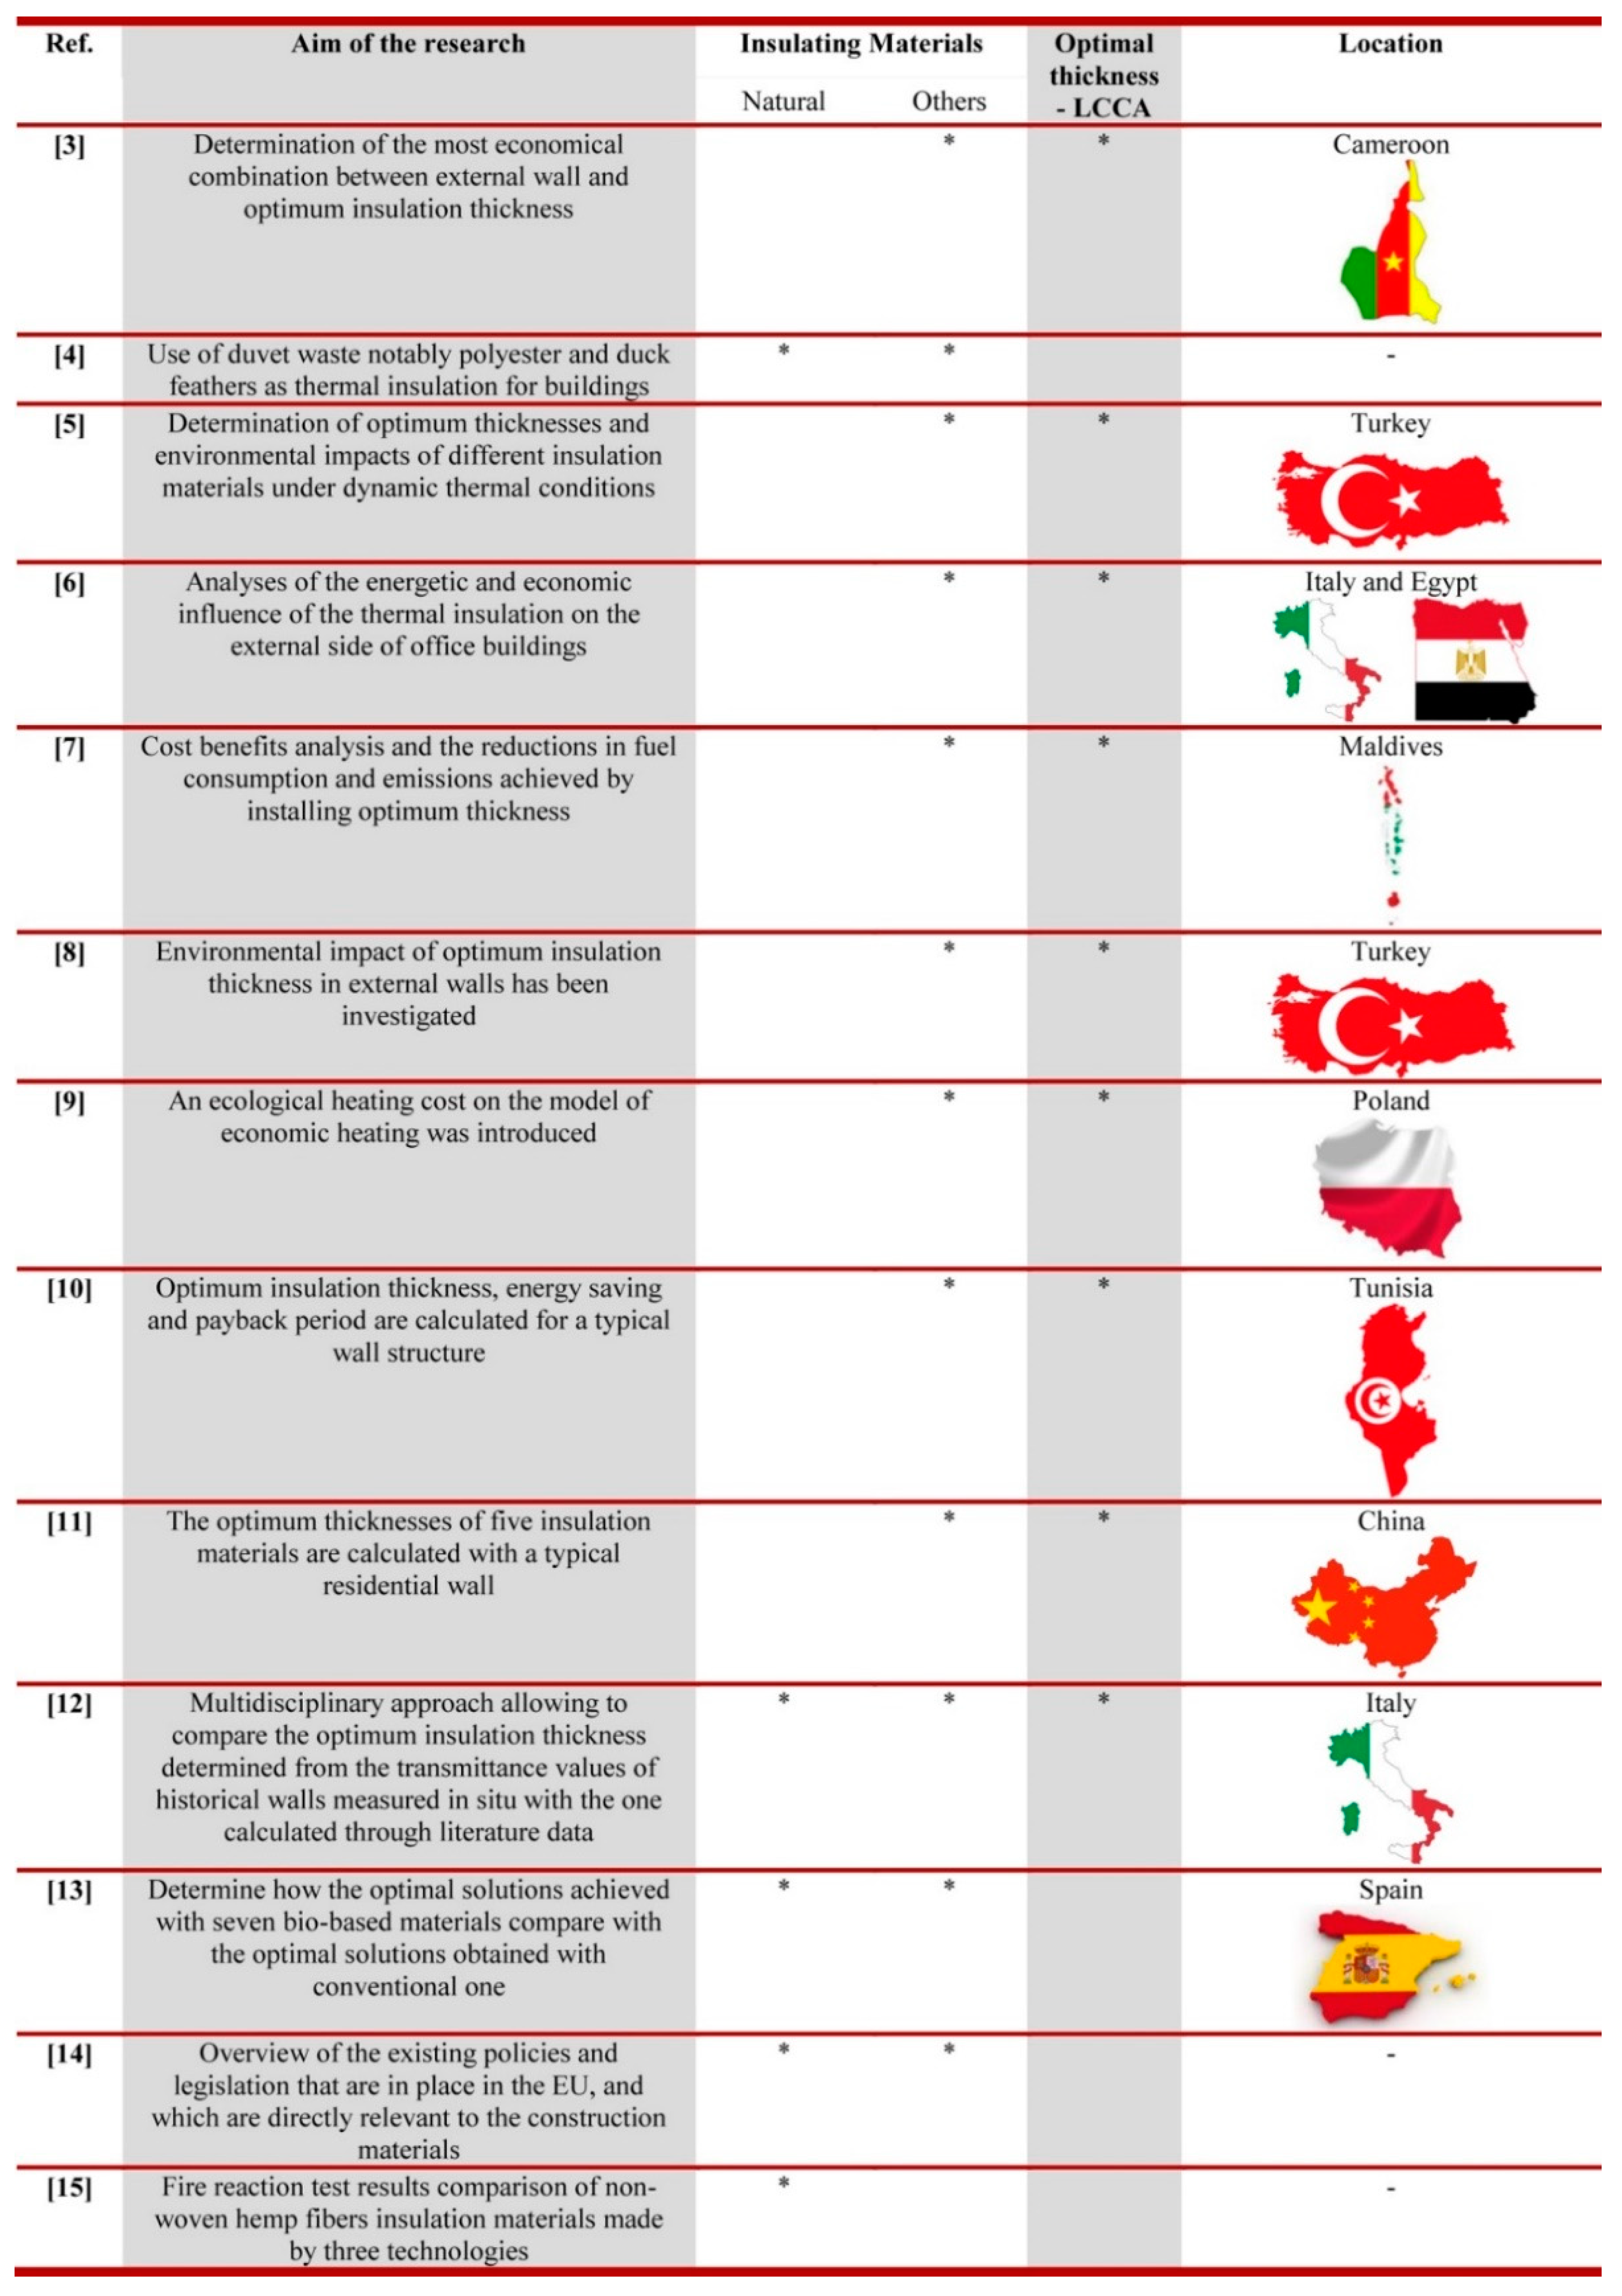
Figure 1. Summary of main references.
Energies 13 02817 g001
Figure 2. Italian construction buildings time (source data: ISTAT, National Institute of Statistics census year 2011).
Energies 13 02817 g002
Figure 3. Properties and characteristics of the type of wall object of this study.
Energies 13 02817 g003
Figure 4. Geographical distribution of the type of wall object of this study.
Energies 13 02817 g004
Figure 5. Hemp straw in European Union (percentage value) [25].
Energies 13 02817 g005
Figure 6. Heating Degree Days (HDDs) of the 20 Italian regions.
Energies 13 02817 g006
Figure 7. Cooling Degree Days (CDDs) of the 20 Italian regions.
Energies 13 02817 g007
Figure 8. Graphical representation of the optimum thickness.
Energies 13 02817 g008
Figure 9. Summary of data used in the study.
Energies 13 02817 g009
Figure 10. Graphical representation of the results obtained in the three different Italian regions. (a) the one relating to Piedmont; (b) the graph of the optimal thickness in Campania; (c) the graph of the optimal thickness in Abruzzo; (d) location of the three Italian regions with the respective optimal thickness values.
Energies 13 02817 g010
Figure 11. Comparison between the transmittance calculated by the optimal thickness and the limit value.
Energies 13 02817 g011
Table 1. Thermal transmittance limit values for the external vertical walls (M.D. of 26.05.2015).
Climatic ZoneThermal Transmittance Ulaw (W/m2K) a
A e B0.45
C0.40
D0.36
E0.30
F0.28
a From 01.07.2015 to 01.01.2021.