Article

Lifetime Degradation Cost Analysis for Li-Ion Batteries in Capacity Markets using Accurate Physics-Based Models

School of Computing, Engineering and Digital Technologies, Teesside University, Middlesbrough TS1 3BX, UK
*
Author to whom correspondence should be addressed.
Energies 2020, 13(11), 2816; https://doi.org/10.3390/en13112816
Submission received: 13 May 2020 / Revised: 26 May 2020 / Accepted: 29 May 2020 / Published: 2 June 2020
(This article belongs to the Section D: Energy Storage and Application)

Abstract

:
Capacity markets (CM) are energy markets created to ensure energy supply security. Energy storage devices provide services in the CMs. Li-ion batteries are a popular type of energy storage device used in CMs. The battery lifetime is a key factor in determining the economic viability of Li-ion batteries, and current approaches for estimating this are limited. This paper explores the potential of a lithium-ion battery to provide CM services with four de-rating factors (0.5 h, 1 h, 2 h, and 4 h). During the CM contract, the battery experiences both calendar and cycle degradation, which reduces the overall profit. Physics-based battery and degradation models are used to quantify the degradation costs for batteries in the CM to enhance the previous research results. The degradation model quantifies capacity losses related to the solid–electrolyte interphase (SEI) layer, active material loss, and SEI crack growth. The results show that the physics-based degradation model can accurately predict degradation costs under different operating conditions, and thus can substantiate the business case for the batteries in the CM. The simulated CM profits can be increased by 60% and 75% at 5 °C and 25 °C, respectively, compared to empirical and semiempirical degradation models. A sensitivity analysis for a range of parameters is performed to show the effects on the batteries’ overall profit margins.

Graphical Abstract

1. Introduction

The threat of climate change due to global warming has encouraged many countries to adopt policies to increase reliance on renewable energy sources (RES) in their electricity networks. The EU policies require European countries to increase the energy produced by RES by 20% by 2020 and 27% by 2030 [1]. The total world renewable energy generation capacity increased by 14.5% in 2019 [2]. The intermittent nature of RES [3], along with fast energy demand growth [4], raises considerable energy security concerns [5,6]. Driven by such concerns, several multidimensional approaches have been used to ensure adequate and cost-efficient power systems. These include enabling innovative technologies such as energy storage [7,8,9], improving market design [10,11], and enhancing system operation [12].
The introduction of the capacity markets (CMs) to improve the electricity market design is seen as an effective solution to enabling the integration of RES in electricity networks. As such, CMs have been implemented in many countries, including the US [13], Latin America [14], and Europe [15]. The aim of this is to adequately remunerate new electrical generators, reduce investment risks, and avoid electricity blackouts. Many of the new generators providing CM services use lithium-ion batteries (LIBs) due to their high energy density and long life cycle [16]. Earlier work has illustrated that batteries can enhance new generators by providing capacity services ranging from 40% to 100% of their nameplate capacity, thus reducing the number of shortage events (SEs) in the CM [17,18]. Another study have found that the revenue from energy storage devices can be tripled if LIBs are utilized to provide energy reserve services in the electricity markets [19]. Further work has found that batteries participating in the CM can secure substantial upfront revenue, while only marginally reducing profits from other markets [20].
LIB degradation is the main factor in determining the operational cost [21]. As such, there is a need to assess the economic viability of LIBs in the CM. Once a battery wins a CM contract, it must remain ready to discharge during electricity SEs, which may leave the battery at 100% charge status for a long period, thus increasing its degradation cost [22]. Failure to deliver the contracted CM capacity when needed may result in penalties [23]. However, many previous studies aiming to evaluate the viability of LIBs in different grid applications either did not account for the degradation cost or no clear or accurate degradation model was used. Earlier research in [24,25,26] show how different batteries can provide ancillary services to the grid, such as short time operating reserves or capacity reserves, but this work did not consider battery degradation. Other research in [20,27,28,29] evaluated the applicability of LIBs to provide different services, such as the spinning reserve, frequency response, and peaking capacity; however, once again these works did not include a clear battery degradation model. Many other studies have accounted for degradation costs by including an empirical LIB degradation model [30,31,32,33,34]. These models are based on mathematical functions that provide good fitting for the experimental data used. While empirical and semiempirical models are computationally efficient, they are usually based on limited battery operating conditions, thus making extrapolation inaccurate beyond the used dataset [35,36]. This inaccuracy can be mitigated to some extent if a wide range of operating conditions are tested.
Other empirical degradation models used often ignore important degradation details. For instance, earlier research in [37] presents a nonlinear degradation model to account for the degradation cost in the day-ahead market, while ignoring calendar degradation. However, in an actual island grid-connected battery operating for three years, it was found that the battery was in an idling position for 20% of the total operating time [38]; thus, ignoring calendar degradation may lead to erroneous results. Several other works either did not consider temperature effects on battery degradation [39,40], overlooked state of charge (SoC) effects during calendar degradation [41], or accounted for the impact of depth of discharge (DoD) only [42].
Other works consider the effects of degradation costs using advanced physics-based LIB models. The authors in [43] present a modelling framework for grid-connected batteries using a physics-based single-particle model (SPM), considering capacity fade due to solid–electrolyte interphase (SEI) layer mechanisms. Similarly, the work in [44] presents a physics-based SEI layer degradation assessment for LIBs in a grid-connected PV system using SPM. Recent research [45] used different LIB models, including SPM, to optimize batteries in order to provide energy arbitrage services to the grid, and concluded that the expected revenue could be substantially improved using more accurate battery degradation models. However, all the aforementioned works either did not consider the CM, considered it without de-rating factors, or quantified it with only one degradation mechanism (SEI layer only) in the economic analysis, while overlooking the impacts of other possible degradation effects, such as active material loss and crack growth [46].
This paper improves on the previous economic studies by quantifying the degradation costs for three degradation mechanisms for LIB cells in the CM using a physics-based degradation model coupled with a pseudo two-dimensional LIB cell model. These three degradation mechanisms are SEI layer growth, active material (AM) loss, and SEI layer fracture. Furthermore, this work considers several CM de-rating factors, which is seen as essential in improving the business case for energy storage in the CM [47]. Ultimately, this work mitigates the limitations mentioned in a recent study [48], which concluded that empirical and semi-empirical degradation models are unable to capture battery degradation effects at lower temperatures, such as 5 °C.

2. Capacity Market Fundamentals

The reliability of liberalized electricity markets has been questioned due to increasing energy demands, the decommissioning of conventional power plants (i.e., coal), and the steady growth of RES. In particular, many policymakers argue that the current energy-only markets may not ensure resource adequacy [49]. One issue is that the energy-only market neglects the energy adequacy problem, because it assumes that the energy demand and supply are always balanced (quantity supplied = quantity needed). Thus, when the supply side becomes scarce, there must be a load reduction from the demand side to ensure market clearance. However, due to the inelastic nature of the demand side and rational customer responses, electricity markets do not guarantee a demand response or market clearance [50].
Another reason for the energy-only market failure is its inefficiency during electricity blackouts [51]. If there is a blackout similar to the one that happened in the UK in 2019, which affected over 1 million customers [52], then there is at least one supplier that does not have power to sell at any price, as illustrated in Figure 1a. Despite the scarce capacity and the peak demand, generators do not earn money in the blackout events [48].
Nevertheless, even if there are no generation adequacy issues, a “missing money” problem will exist in both normal operating conditions and scarcity periods. In normal operating conditions, where the demand quantity is below the peak available capacity (shown in Figure 1b) and the market is competitive, some generators, such as the peakers (plants operating only at high demand), cannot earn sufficient revenue beyond covering their operating costs [49]. Therefore, they may not cover their capital investment cost. In scarcity periods, as shown in Figure 1c, all generators may charge high scarcity prices (red dot), which in real cases can be 367 times higher than the average price [53]. However, market power can be exercised in scarcity periods, even by small generators (see [54]), therefore triggering regulatory intervention. Regulators usually set the scarcity prices low to mitigate market power abuse, thus creating the missing money problem depicted in Figure 1c. Since the investment in new capacity to increase the reliability of the supply side depends on the scarcity prices, energy-only markets, therefore, do not provide the incentives needed to increase capacity.
A well-designed CM can mitigate the issues of market power and missing money by determining the adequate level of supply capacity needed. This can be done by designing a capacity auction for generators to determine the scarcity price required to secure an adequate level of capacity, as set by the regulator, in order to reduce the number of shortage hours. The market is open to new and existing generators, considering the investment level needed in the new generators. The result is that the market discovers the true value of the scarcity price corresponding to the optimal level of capacity, while the regulatory intervention is limited to only control the level of the capacity needed.
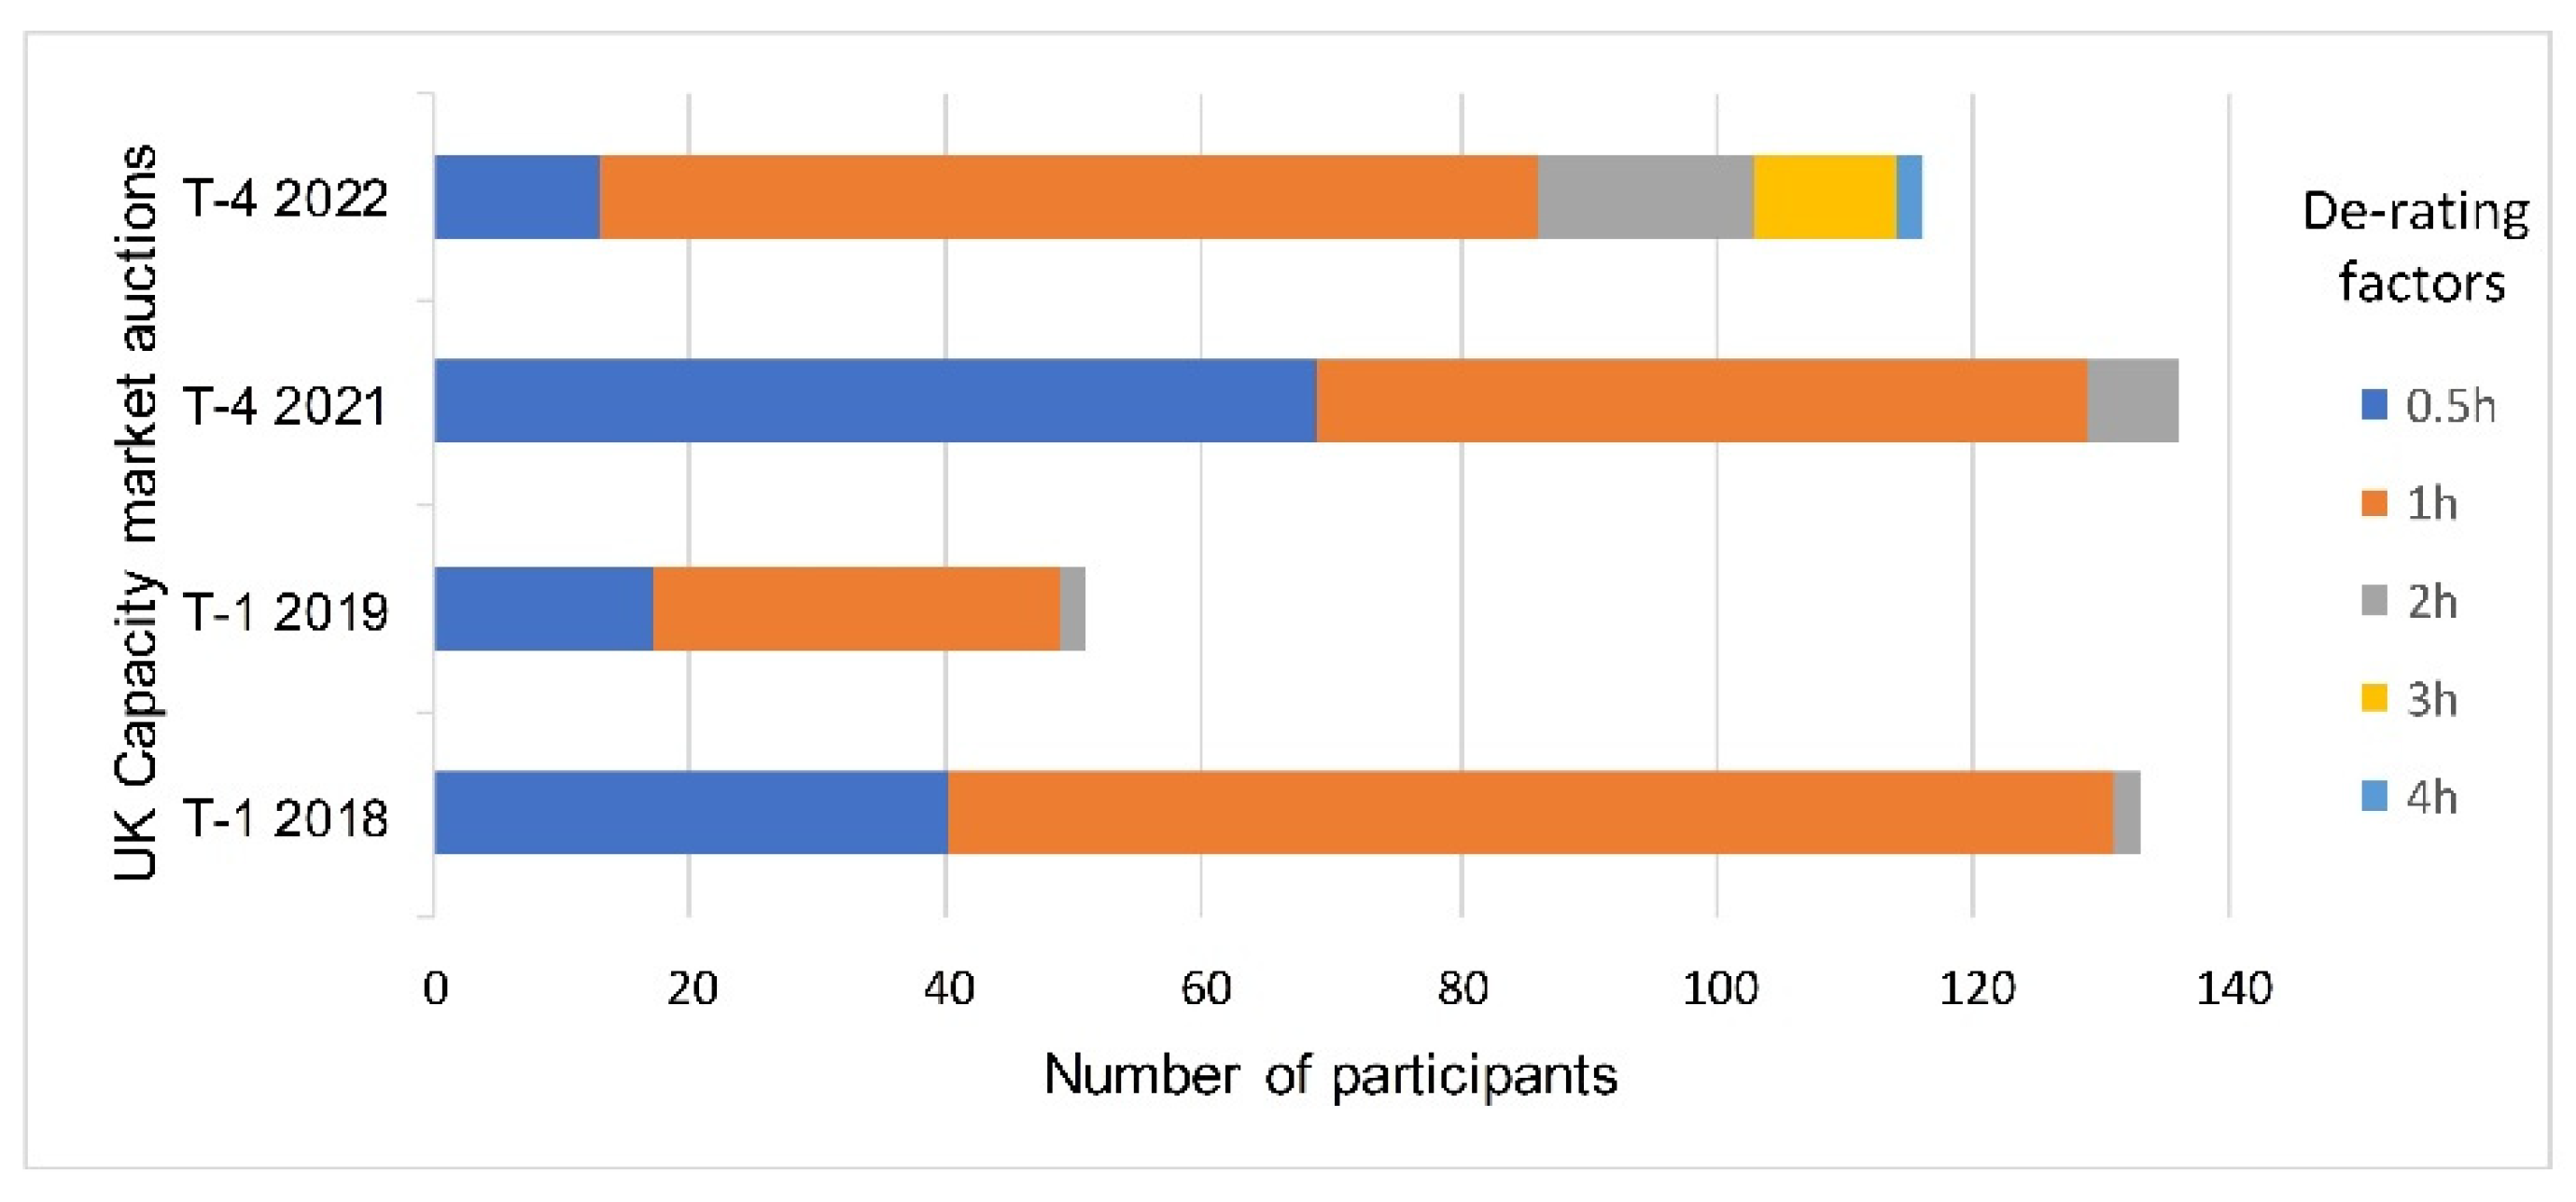
For several reasons, energy storage devices may have limited discharge capacity (for example, degradation). Therefore, CMs (in the UK, Germany, France, Italy, Ireland, and Denmark) have introduced de-rating methodologies to account for the percentage of firm capacity they can supply during shortage periods [55]. Fraunholz et al. [56] found that the choice of a suitable de-rating factor is challenging and may affect batteries’ market competitiveness. Figure 2 depicts the number of batteries providing CM services in the current UK CM with different de-rating factors. The de-rating factors are CM design parameters that are used to measure the net contribution of energy-limited devices such as energy storage and energy security. It can be seen that there is an increased interest in obtaining higher de-rating factors, such as 3 h or 4 h durations. This study considers a real-life scenario, in which LIBs are utilized to obtain 0.5 h, 1 h, 2 h, and 4 h de-rating factors.

3. Methods

3.1. Problem Setup

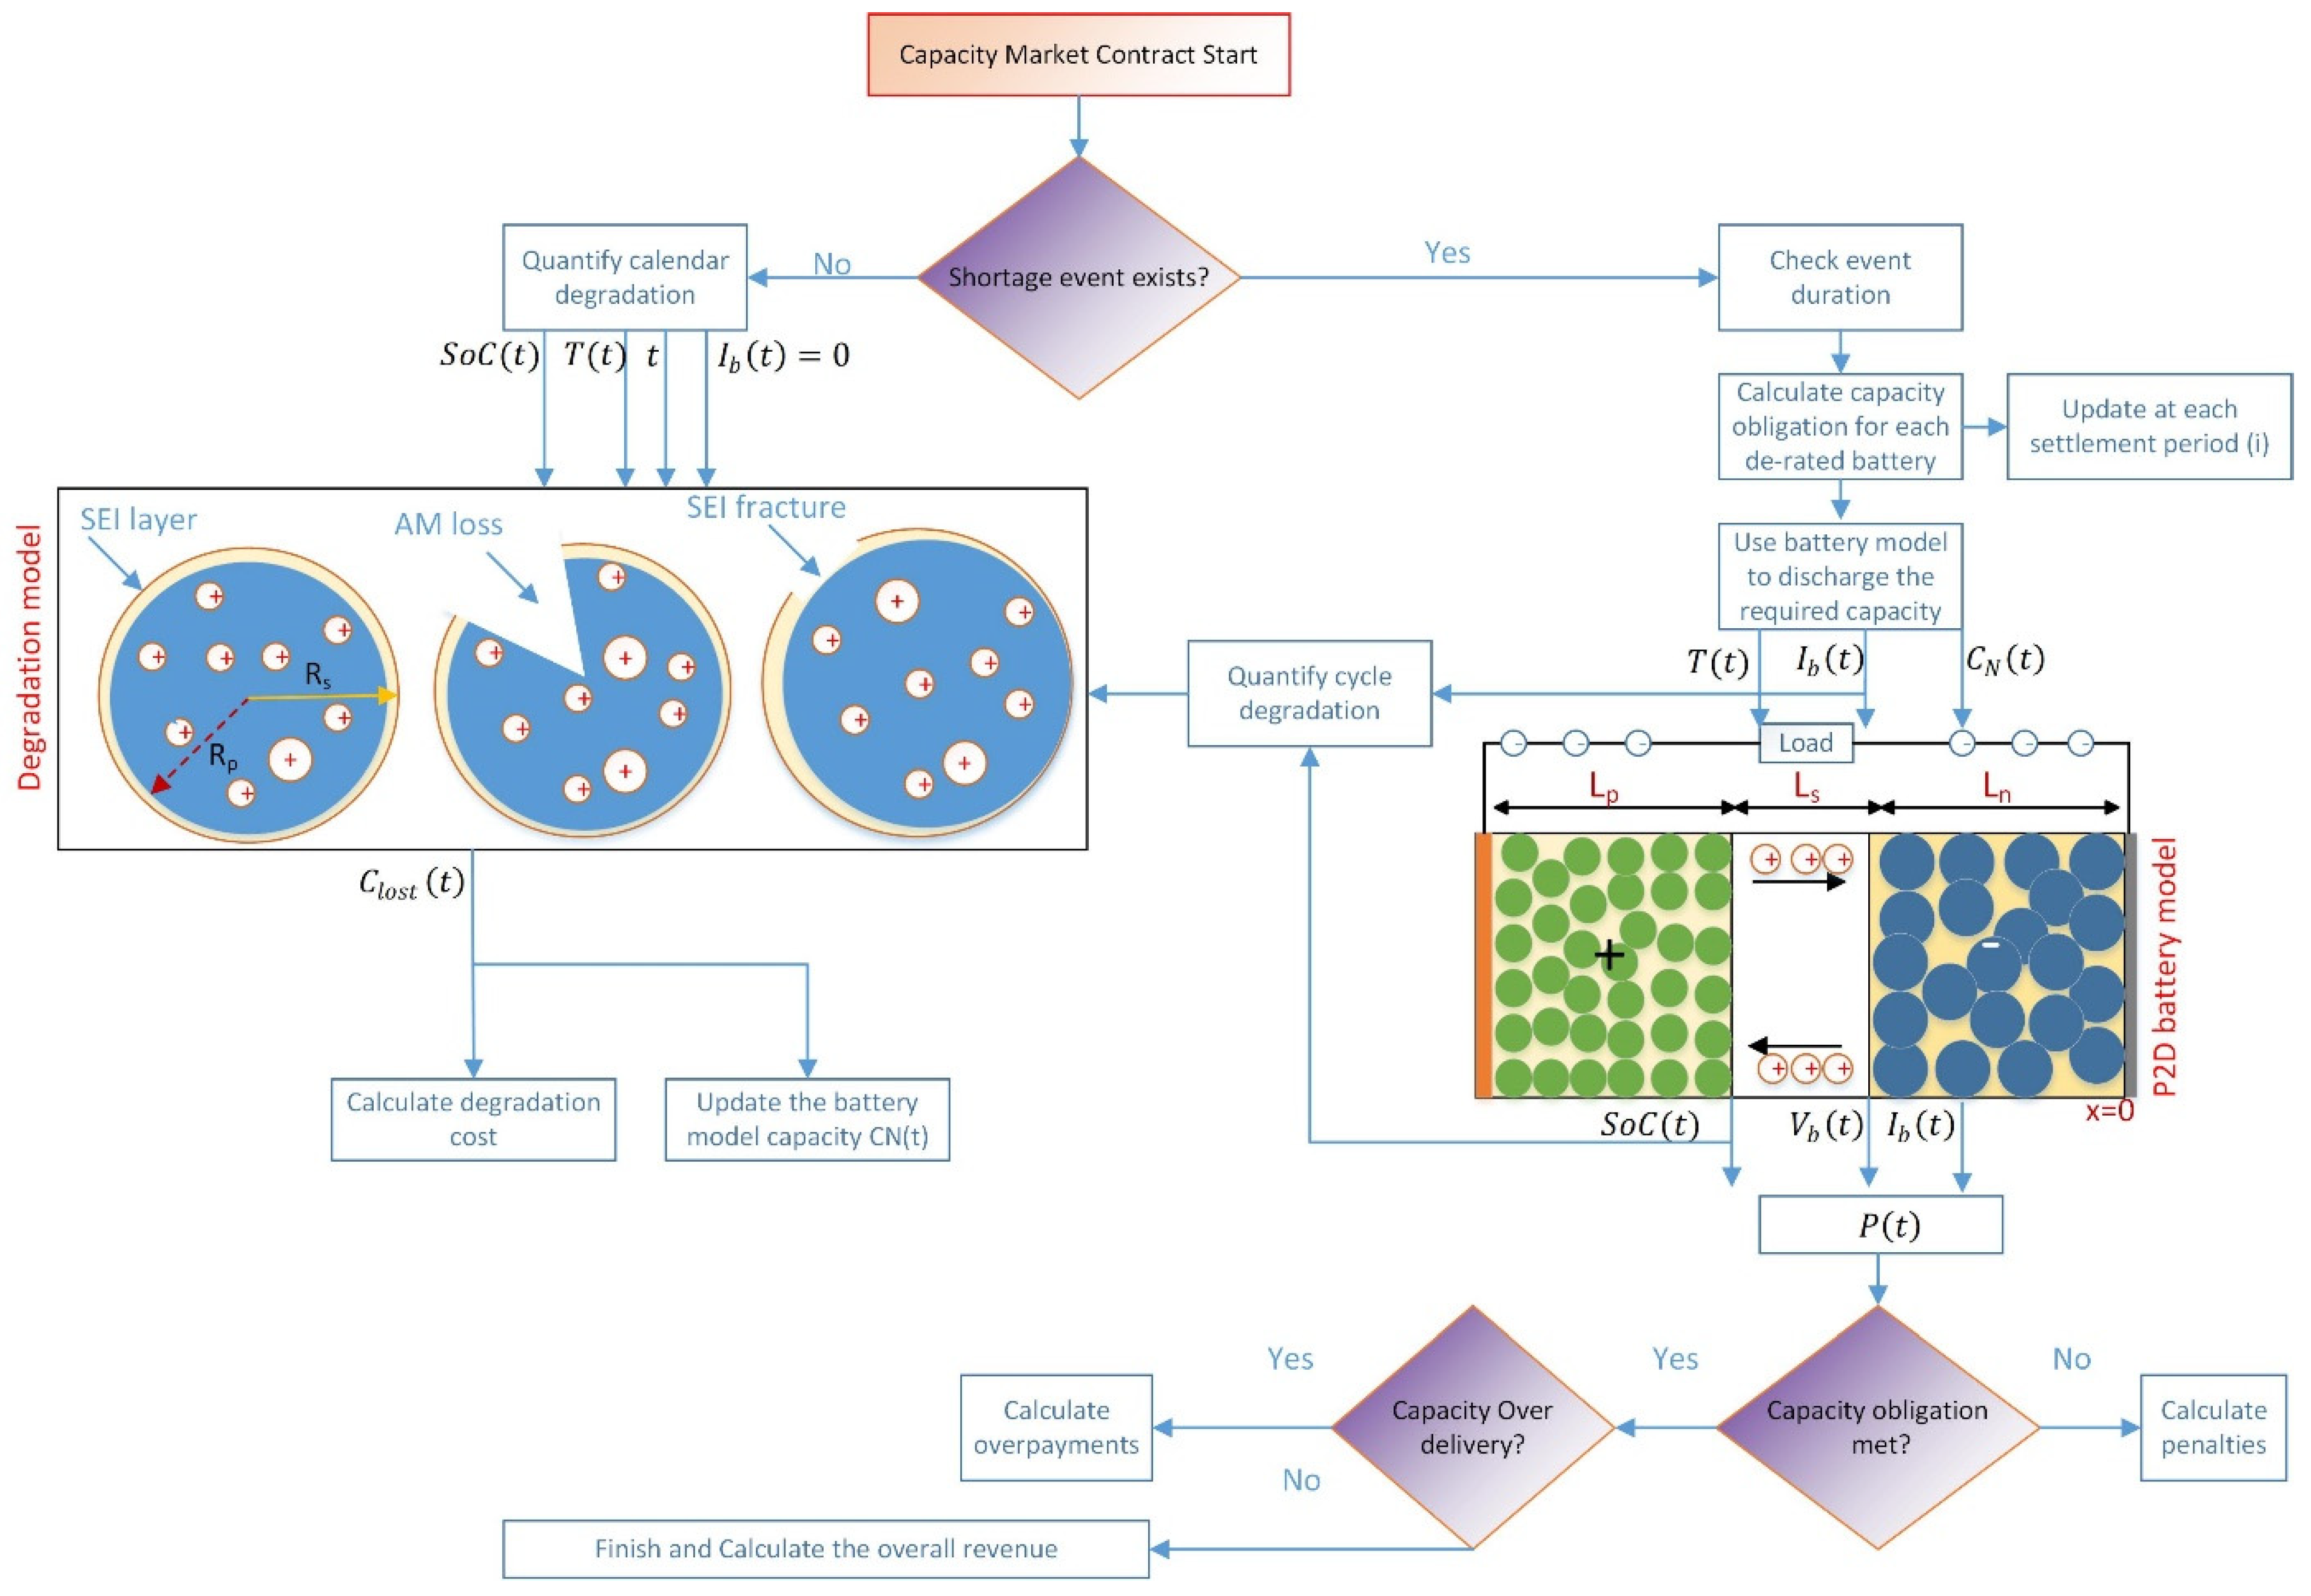
This study models battery degradation for LIBs used to provide a CM service to the UK grid operator over a one-year contract using a physics-based model. During the contract period, many simultaneous degradation mechanisms can affect the battery performance, resulting in a degradation cost. As illustrated in Figure 3, when the CM’s contract begins, the battery should provide reserve services to the grid and be ready to respond to electricity SEs. Therefore, in the absence of SEs, the calendar battery degradation can be quantified. During SEs, and depending on their duration, the obligation capacity will be calculated for each de-rated battery. The duration of the event and the obligation capacity amount is updated at each settlement period (30 min). Then, a physics-based battery model is used to discharge the required capacity. The operating conditions of the battery, such as the temperature, are then fed to the degradation model to quantify the cycle degradation and update the initial capacity in the model. Afterwards, depending on the amount of generated power, the penalties and overpayment can be quantified to obtain the overall revenue. The battery capacity and the de-rating factors used in this study are shown in Table 1, which are in line with the current batteries participating in the CM [57]. The CM parameters used in this study are given in an earlier study [48].
The total revenue of battery R represents the revenue from the CM contract in addition to overpayments R o v minus potential penalties p , as given in Equation (1), where C d e is the de-rated capacity, k d e is the de-rating factor, λ c l is the CM auction clearing price, and f is a factor used to reward slightly more payment in peak demand months:
R = C d e × λ c l × f + R o v p
The de-rated capacity C d e depends on the battery’s output power, as in Equation (2), where I b ( t ) is the battery current, V b ( t ) is the battery voltage, and N is the total number of battery cells.
C d e = I b ( t ) × V b ( t ) × N × k d e
The capacity obligation C o is calculated at each settlement period (i), as in Equations (3) and (4), where D p is the peak electricity demand during the SE D p s e divided by the total CM contracted capacity through the CM auction C a u c , and C b is the capacity offered by the battery to other grid services.
C o ( i ) = i = 1 n ( C d e × D p ( i ) ) C b ( i )
D p ( i ) = D p ( i ) s e C a u c
The penalties and the overpayments are obtained by calculating the amount of undelivered or overdelivered capacity over the CM contract at each settlement period, as in Equations (5) and (6):
p = i = 1 t C u n ( i ) × λ c l
R o v = i = 1 t C o v ( i ) × λ c l
By multiplying the lost battery capacity C l o s t ( t ) , which is obtained from the battery degradation model by a degradation price λ d e g r , the total energy degradation cost E l o s t can be roughly estimated, as in Equation (7):
E l o s t = C l o s t ( t ) × λ d e g r × N

3.2. Battery Cycling Profile

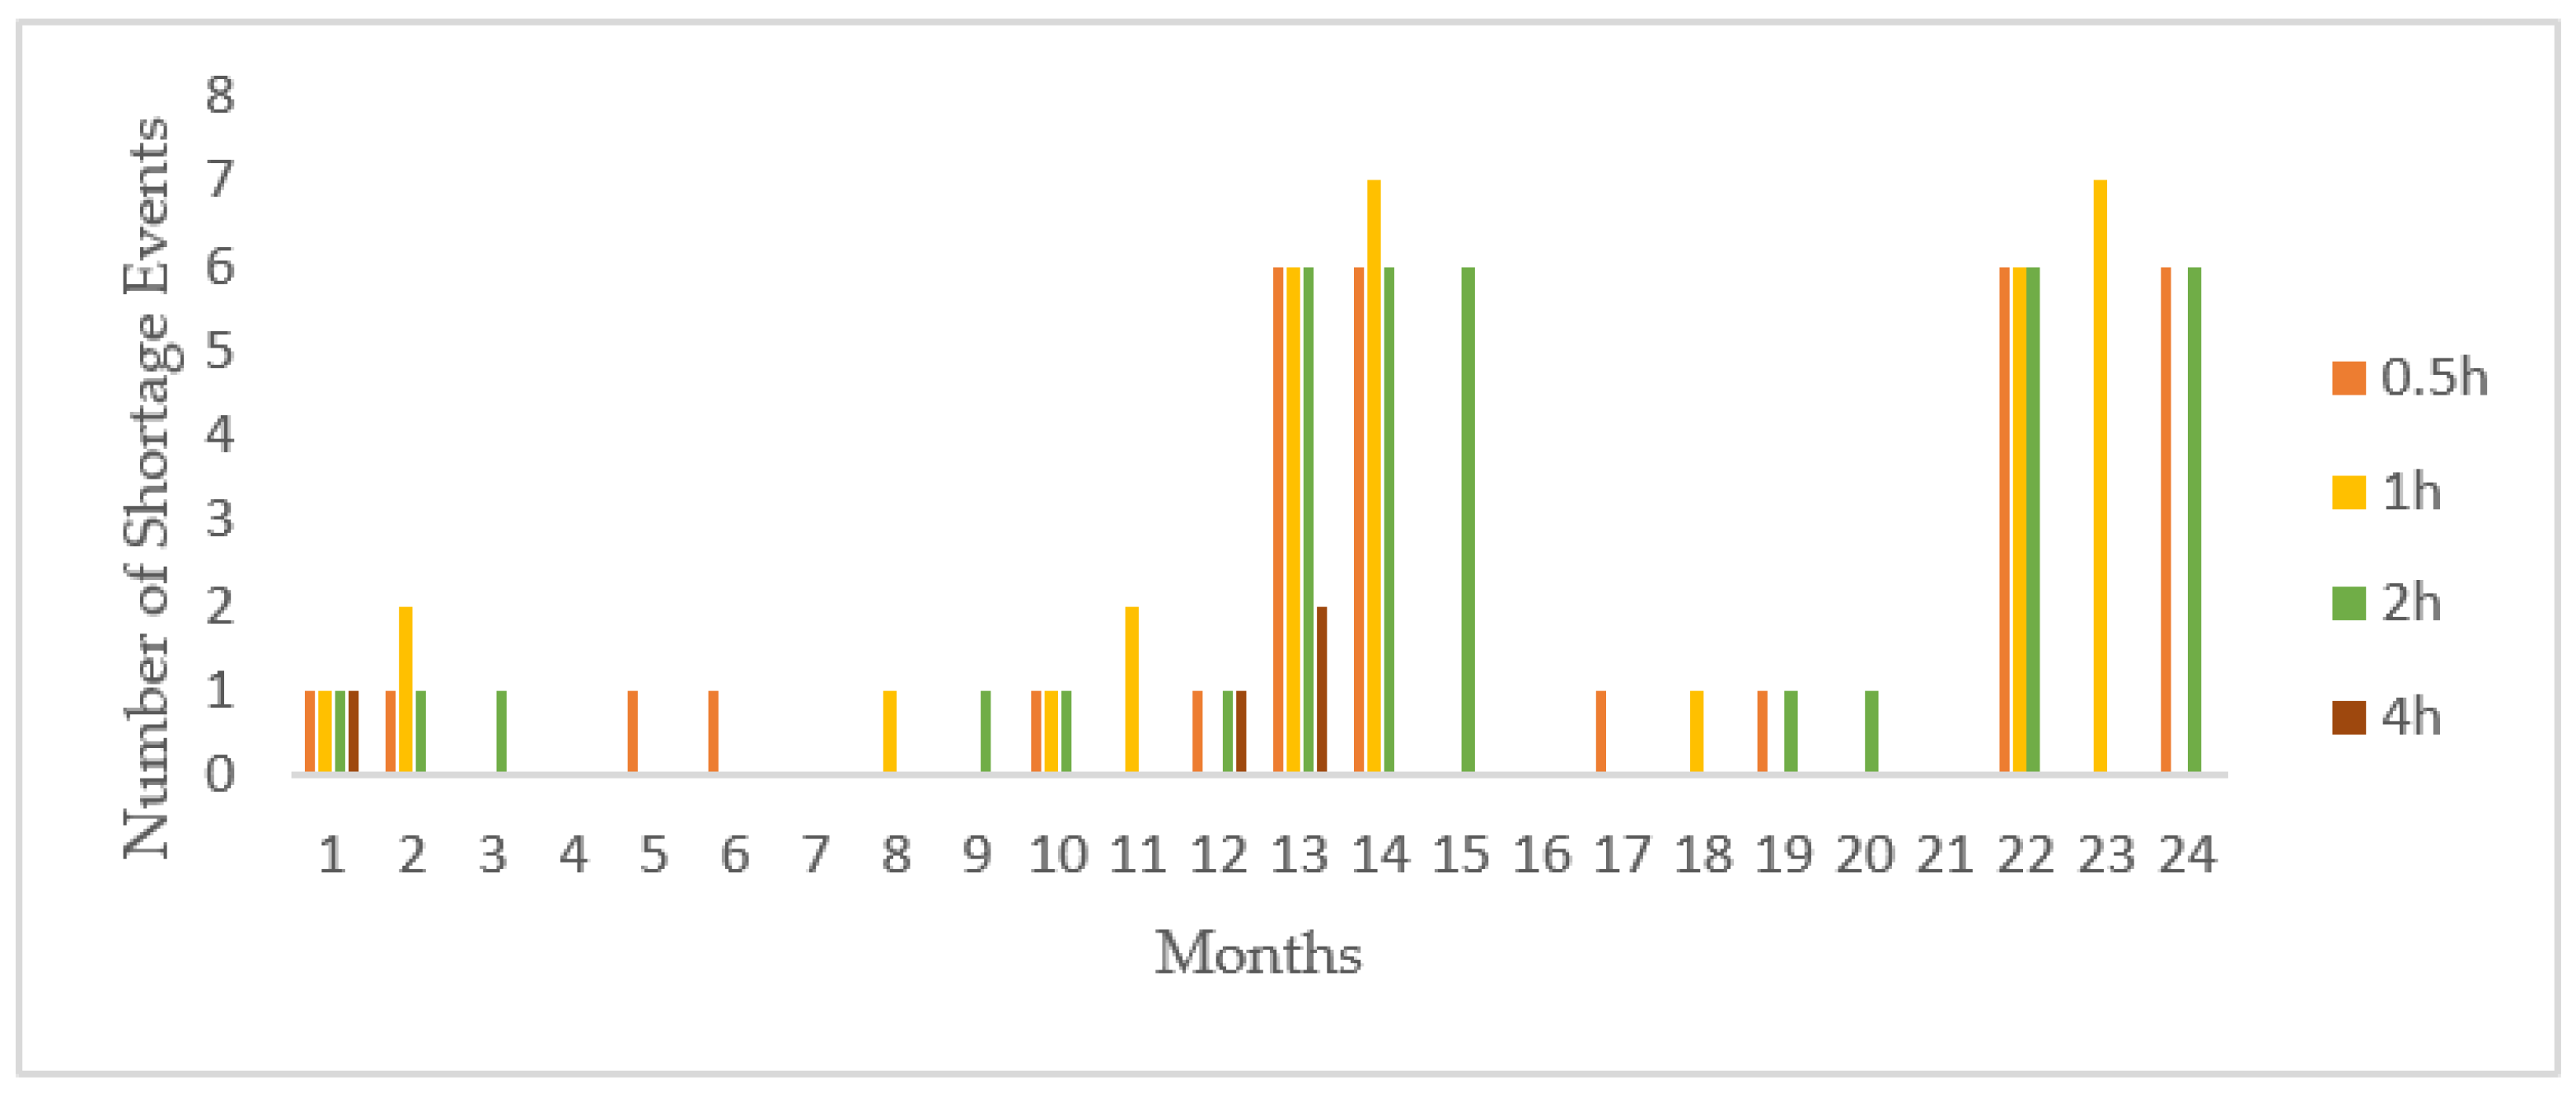
The battery cycles in the CM are calculated according to the SE period. The expected number of these SEs is based on the loss of the lead expectation (LOLE) reliability metric [58]. Since accurately predicting the LOLE is difficult, as it is a function of complex processes such as generator availability, blackouts, and environmental factors, many studies deem LOLE to be unreliable [59,60]. In the presence of a high share of RESs, it is found that the LOLE can reach 62 h per year [61]. Another study found that LOLE can reach 83 h per year, considering the current CM scarcity prices [62]. Therefore, by considering the difficulty in estimating realistic LOLE values and the previous studies, this work assumes that the total number of SEs of different durations is 20 in the first year of the CM’s contract, while increasing to 90 in the following year (from months 13 to 24), as shown in Figure 4. This distribution of SEs considers the electricity peak demand periods in most parts of Europe [63]. Furthermore, the distribution reflects the probability of the duration of SEs; for instance, events lasting 1 h and 2 h are more probable than events lasting 4 h [64].

3.3. Battery and Degradation Models

3.3.1. Battery Model

The electrochemical battery cell model is shown in Figure 1 and based on the seminal work by Newman et al. [65]. The input to the model is the load current, material properties, geometry design parameters, and the operating temperature. The output is the cell voltage and the SoC. The model parameters values used in this study are given in Appendix A. The five model states are the lithium concentration in the solid ( c s ) and electrolyte ( c e ) phases, the electric potential in the solid ( ϕ s ) and electrolyte ( ϕ e ) phases, along with the rate of lithium movement between the phases ( j L i ) [66]. These variables can be found by solving five coupled differential equations, along with their boundary conditions, as described below.
The mass conservation of lithium (assuming the concentration of lithium within the particles is spherically symmetric) in the solid phase can be described using Fick’s second law in Equation (8), where ( D s ) is the solid phase diffusion constant and ( r ) is the radial (pseudo) dimension. The first boundary condition of Equation (8) is given by Equation (9), indicating that there is no diffusion in the center of the particle. The second boundary condition is given by Equation (10), indicating that the transfer of charges occur at the outer boundary of the particle, where ( a s ) is the specific interfacial area between the solid and the electrolyte, ( R p ) is the particle radius, and ( F ) is Faraday’s constant:
c s t = D s r 2   r ( r 2 c s r )
c s r | r = 0 = 0
D s c s r | r = R p = j L i a s   F
The lithium concentration in the electrolyte phase is the result of diffusion (first term) and due to charge transfer between the solid and the electrolyte (second term), as in Equation (11), where ( ε e ) is the porosity and ( t 0 + ) is the transference number of the cation with respect to the solvent. Since there must be no electrolyte flux at the cell boundaries, the boundary conditions of Equation (11) are given in Equation (12):
( ε e c e ) t = x ( D e e f f x c e ) + 1 t 0 + F   j L i
c e x | x = L n = c e x | x = L p = 0
The solid-phase charge conservation follows Ohm’s law, since ( ϕ s ) depends on the current passing through the solid, as in Equation (13), where ( σ e f f ) is the effective conductivity. The current only flows at the collector–solid interface, as in the boundary conditions in Equation (14), where ( A ) is the electrode area:
x ( σ e f f x ϕ s ) = j L i
σ e f f ϕ s x | x = 0 = σ e f f ϕ s x | x = L T = I A σ e f f ϕ s x | x = L n = σ e f f ϕ s x | x = L p = 0
The electrolyte-phase charge conservation follows Ohm’s law in a liquid electrolyte (first term) and the local concentration of lithium (second term), as in Equation (15), where ( κ e f f ) is the effective conductivity of the electrolyte. At the boundary of the electrode–current collector interphase, the ionic current must be zero, as in Equation (16), where:
x ( κ e f f x ϕ e ) + x ( κ D e f f x ln c e ) = j L i
ϕ e x | x = 0 = ϕ e x | x = L T = 0
Equations (8)–(16) are coupled through the Butler–Volmer equation in Equation (17), where ( i o ) is the exchange current density; ( R ) is the universal gas constant; ( T ) is the temperature; ( α a , α c ) are anode and cathode symmetry factors, respectively; and ( η ) is the reaction overpotential.
j L i = a s i o { exp ( α a   F R T η ) exp ( α c   F R T η ) }
After solving the above equations, the cell voltage and SoC are given in Equations (18) and (19):
V b ( t ) = ϕ s ( L T , t ) ϕ s ( 0 , t )
x = SoC = c s , a v g p o s c s , m a x p o s ,   y = c s , a v g n e g c s , m a x n e g

3.3.2. Degradation Model

Several degradation mechanisms for LIBs are presented in the literature and various models are reported to describe these mechanisms, with more than one model often used to describe a single mechanism [36]. Here, three dominant aging mechanisms are included and are shown in Figure 1: SEI layer growth, active material (AM) loss, and SEI layer fracture. For a complete derivation of these models, please refer to [67,68,69]. The degradation model used in this work is dependent on the P2D battery model described in [70].
The total degradation equation that represents all the three mechanisms is given in Equation (20). The SEI layer growth ( Q S E I ) is directly proportional to the side reaction current density i s . The governing equations related to this are given in Equations (21)–(24). During the charge–discharge process, the mechanical stress generated inside the active material could result in particle fracture, which in turns may isolate the active material. As such, the amount of lithium is reduced, leading to capacity loss ( Q A M ), as given in Equation (25). SEI fracture is observed in [71], where the SEI layer experiences tensile stress as the active material expands. This results in the SEI layer stretching and cracking ( Q S E I , c r a c k ), which exacerbates the battery cell’s harmful side reaction. The governing equations of ( Q S E I , c r a c k ) are given in Equations (26) and(27). All the parameters used in this degradation model are given in Appendix B.
C l o s t   ( t ) = Q S E I + Q A M + Q S E I , c r a c k
Q S E I = 0 t i s ( t )   d t = 0 t k S E I   exp ( E S E I R T ) 2 ( 1 + λ θ ) t
θ = exp [ F R T ( η k + U n O C P U s O C P ) ]
η k = 2 R T F ln ( ξ + ξ 2 + 1 )
ξ = R p   I b ( t ) 6 ε A M , 0   i 0 V
Q A M = 0 t SoC   d ε A M = 0 t k A M exp ( E A M R T ) SoC   | I b ( t ) |   d t
Q S E I , c r a c k = k = 1 N c Q S E I , c r a c k = k S E I , c r a c k   n k ( σ k )   ( σ k σ Y i e l d ) 1 / m
σ k = σ m a x , k σ m i n , k 2

4. Results

4.1. Accuracy of Battery and Degradation Models

The output voltage against the battery capacity is shown in Figure 5a,b for different current rates and temperatures during discharge. The model results are in good agreement with the experimental data presented in [72] for the same 53 Ah nickel (N) manganese (M) cobalt (C) LIB cell. In Figure 5a, as expected, the higher the current rating, the lower the battery capacity, which is a common feature for many other LIB types [73]. One reason for the lower capacity retention at higher current rates is due to the induced overpotential, which reduces the cell capacity and the cell voltage, especially at higher DoD [74].The battery capacity at the 4C rate, for instance, is 49.7 Ah in the first cycles, meaning its effective capacity is 93.7% or lower compared to 56Ah at the 0.25C rate.
Figure 5b shows the battery capacity and voltage for different temperatures at the 1C rate plotted against their experimental data. It can be seen that at lower temperatures, such as 5 °C, the battery capacity predicted by the model is 48 Ah compared to the 47.5 Ah value obtained experimentally. This suggests that without any degradation, this LIB cell capacity is 89.6% at 5 °C because of the increased battery resistance at lower temperatures [75]. The model’s average root mean square error is 1.1%. It should be noted that the cycle life performance of the NMC battery chemistry is highly dependent on different temperatures and electrochemical conditions, which may affect the total capacity presented in this study. For further information on the different NMC compositions and their capacity retention levels under different operation conditions, please see [76].
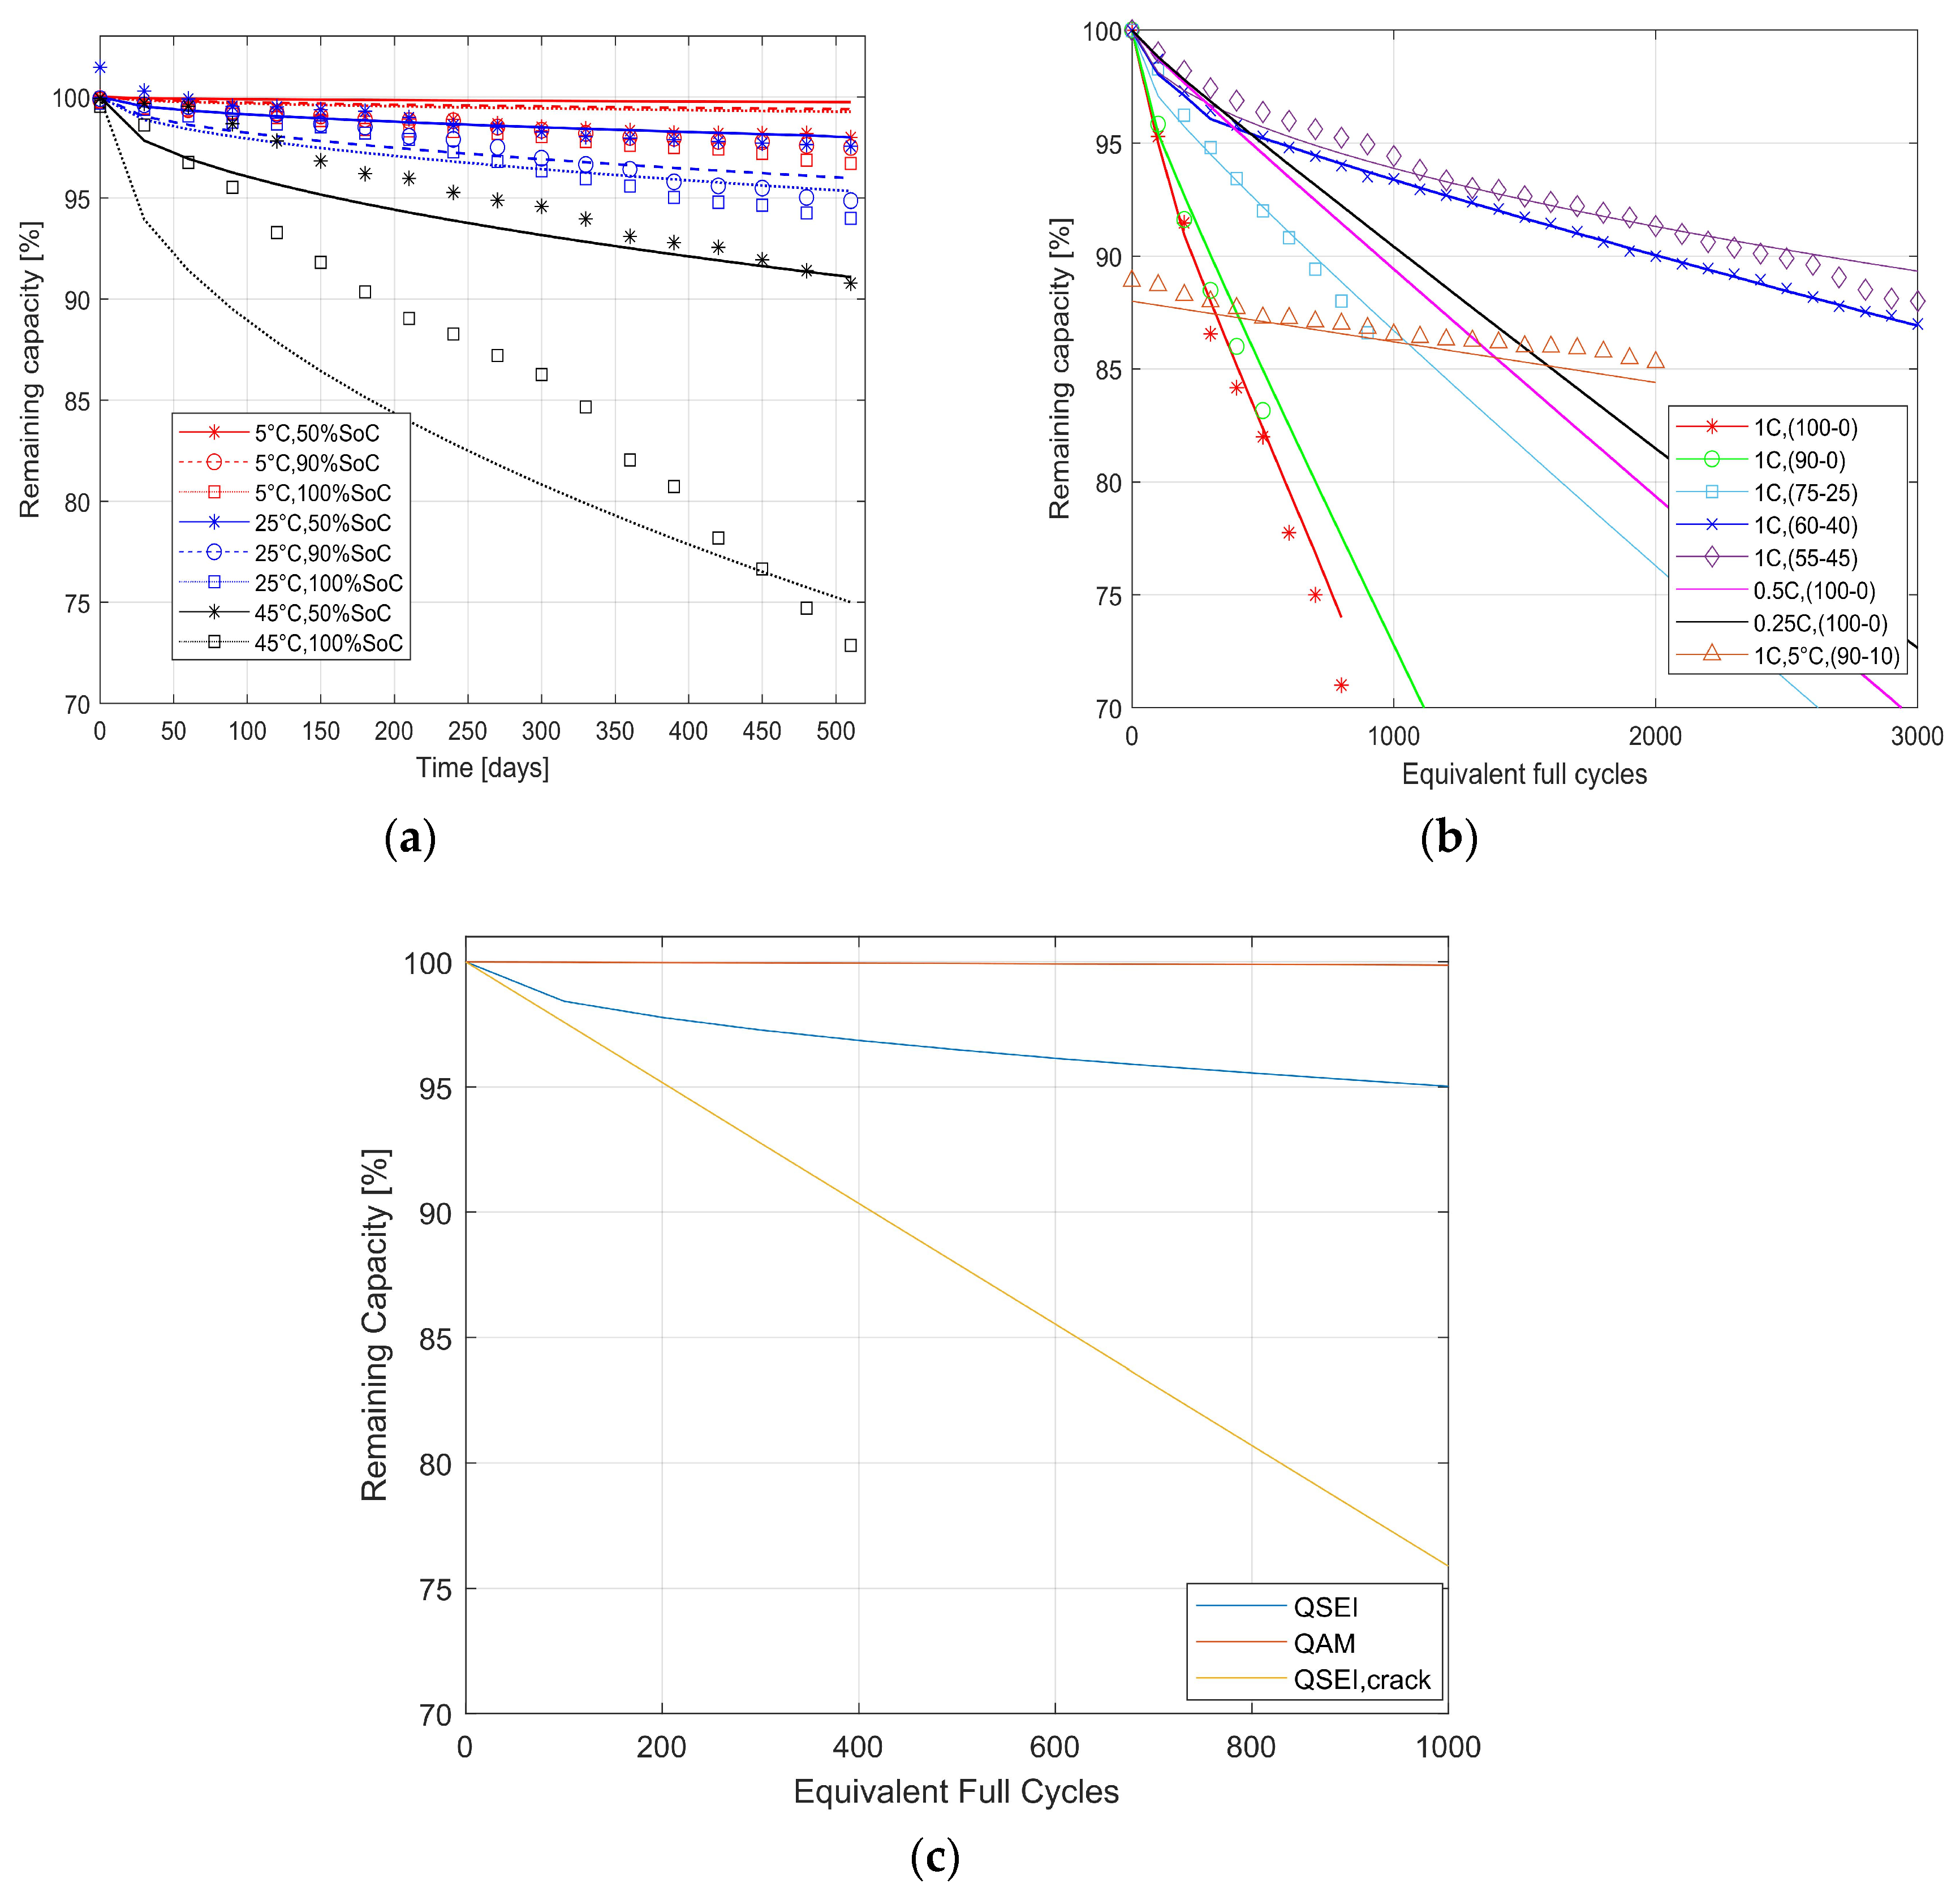
The LIB cell degradation as predicted by Equation (20) and the corresponding experimental data are presented in Figure 6a for calendar degradation and Figure 6b for cycle degradation. The calendar experimental data were taken from [77] and the cycle experimental data were taken from [78]. The model results show good agreement with experiment data, except for the results at 45 °C at 100% SoC. In Figure 6a, high capacity loss is evident at higher temperatures and SoCs, and vice versa. For instance, at 5 °C, the LIB’s state of health is over 96% after 500 days, indicating that there is minimal capacity loss.
Figure 6b shows the cycling results for different C-rates at the same temperature of 35 °C, except for one result at 5 °C. The results indicated that the higher the DoD, the higher the expected capacity loss at the same C-rate. Moreover, it can be seen that the cycling result at 5 °C is as expected based on the battery model results obtained in Figure 5b, in which the battery’s state of health is 89% without any cycling, reaching 85% after 2000 cycles. This mitigates the limitations of other models, which are unable to show that calendar degradation is minimal at lower temperatures, while it is maximal when cycling at the same lower temperatures [48]. This is important in applications where calendar and cycle degradation quantification are needed, such as in the CM. In Figure 6c, a magnified version of the 1C rate (100% DoD) is depicted to relate it to the three degradation mechanisms predicted using Equations (21), (25), and (26). It can be seen that at higher DoD levels, the Q S E I , c r a c k is in high agreement with [70].

4.2. Revenue and Degradation Costs in the Capacity Market

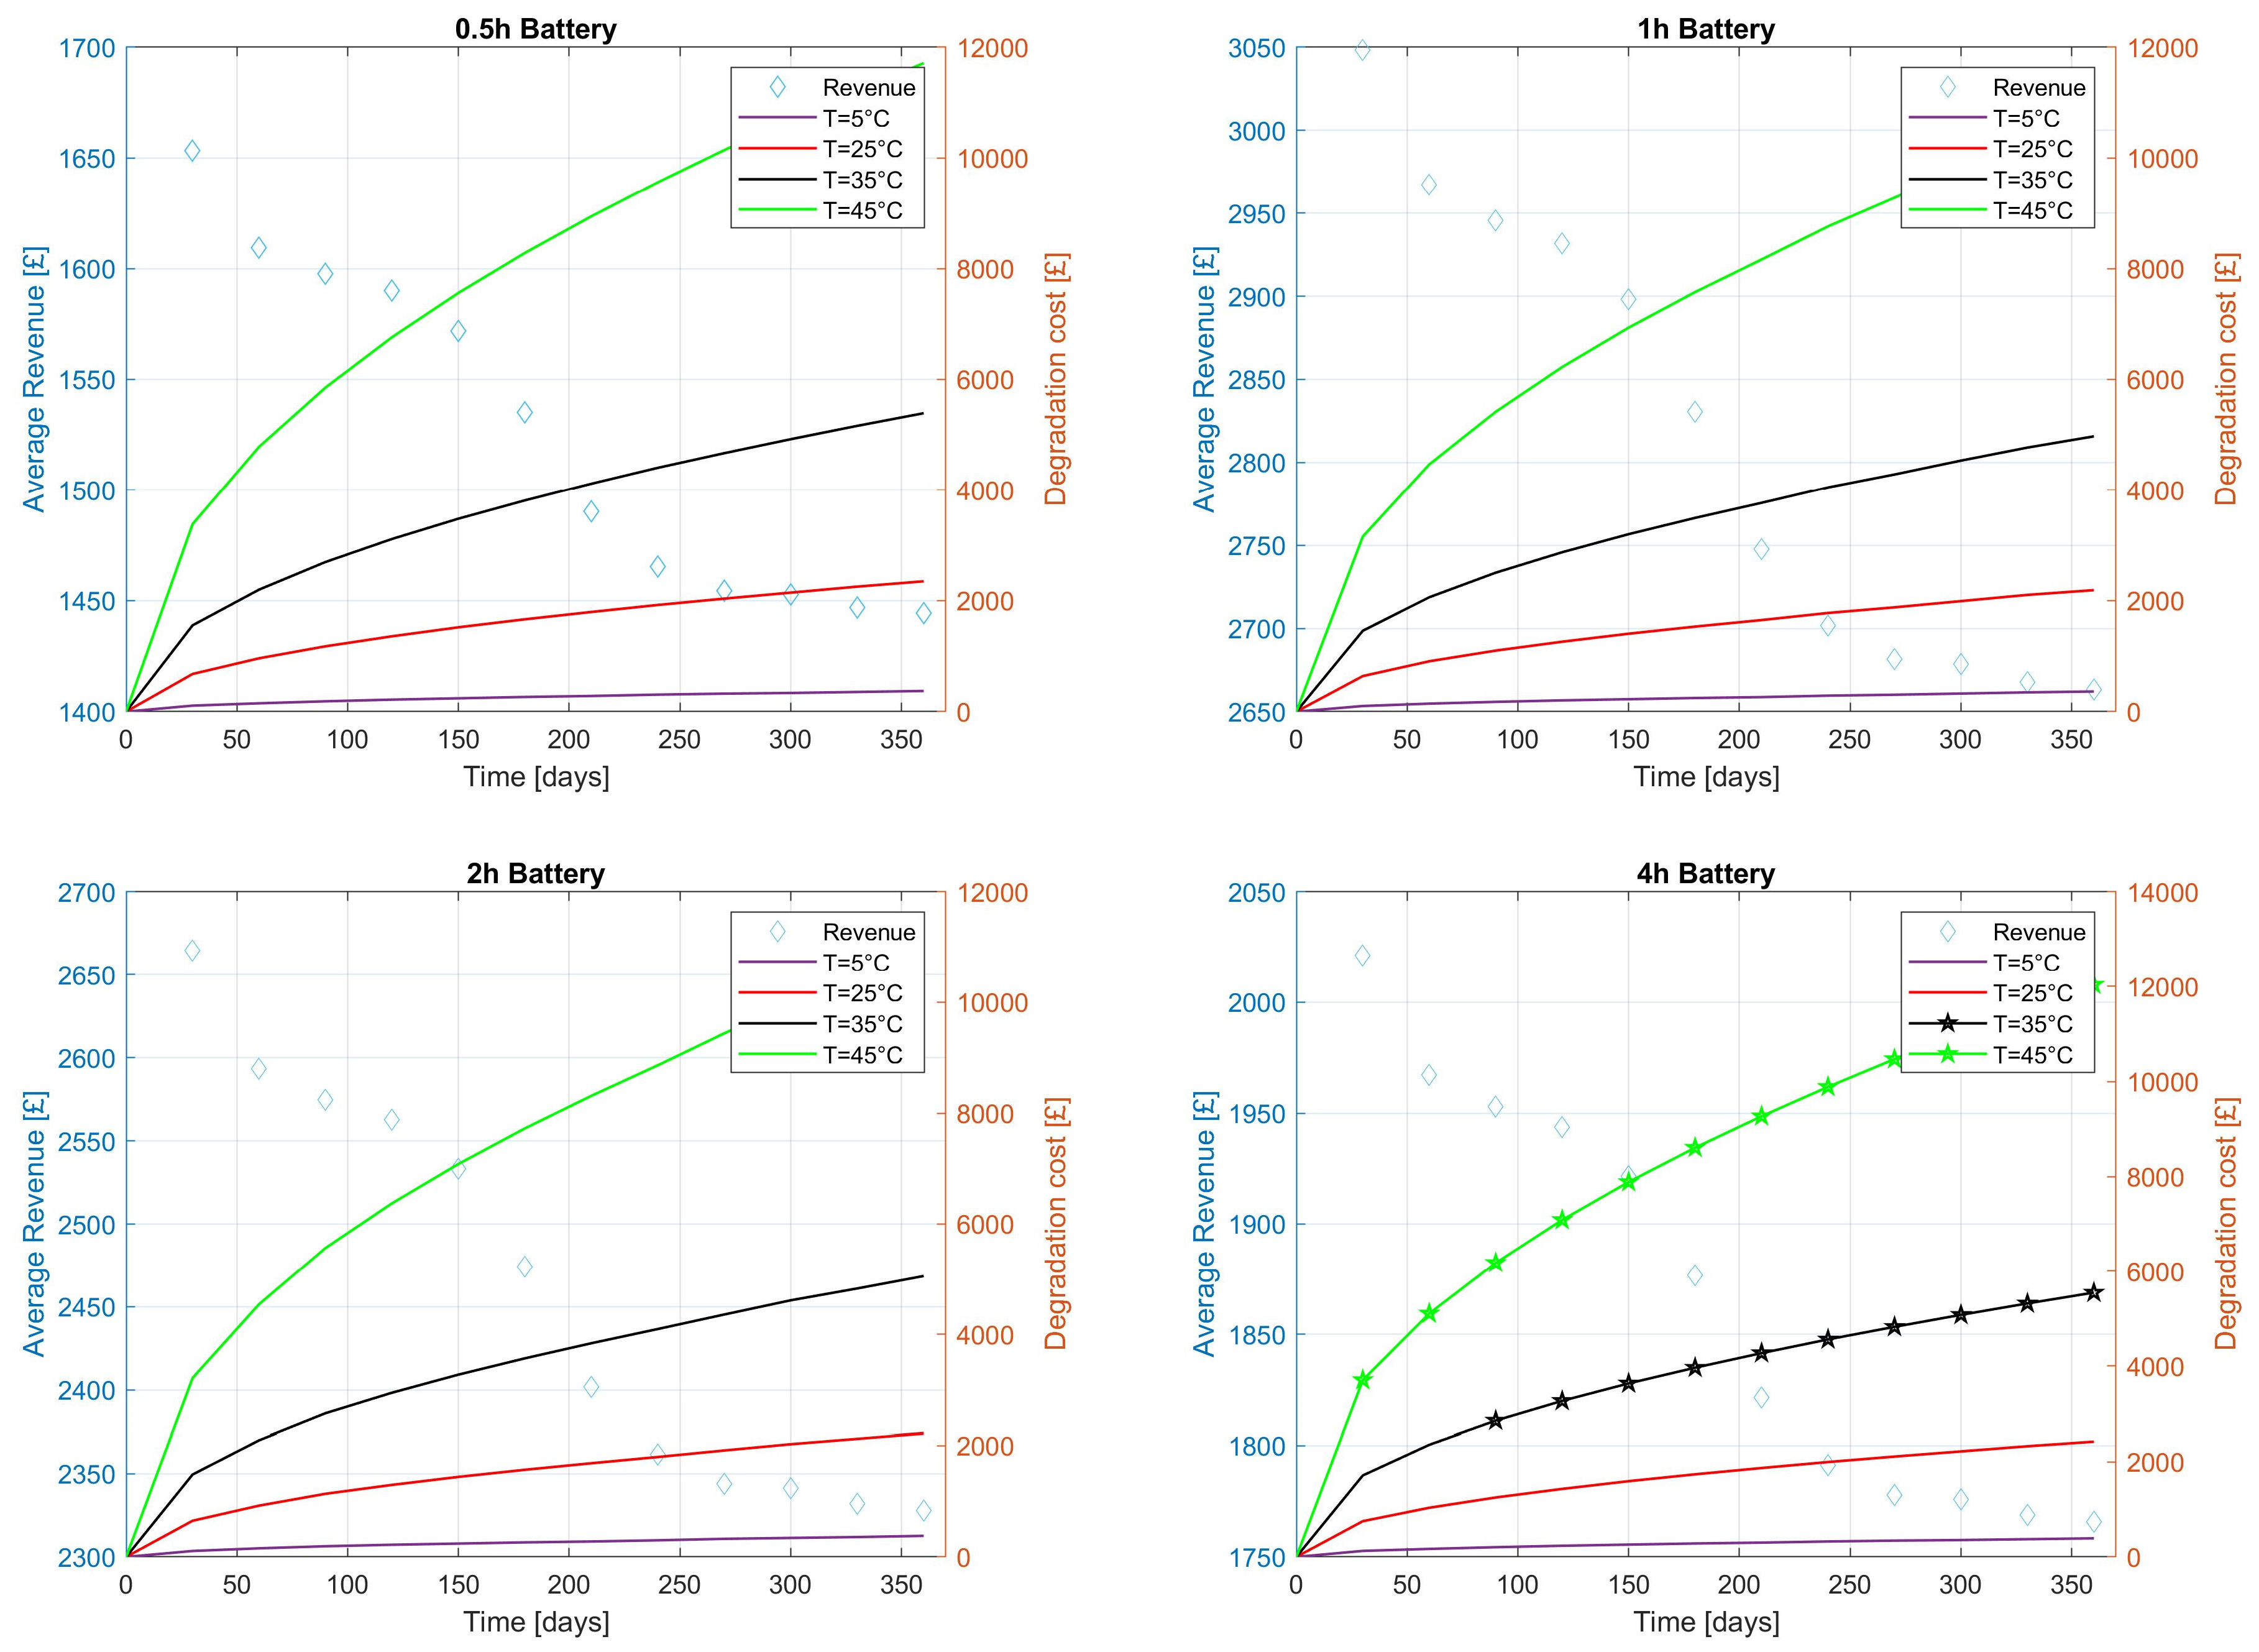
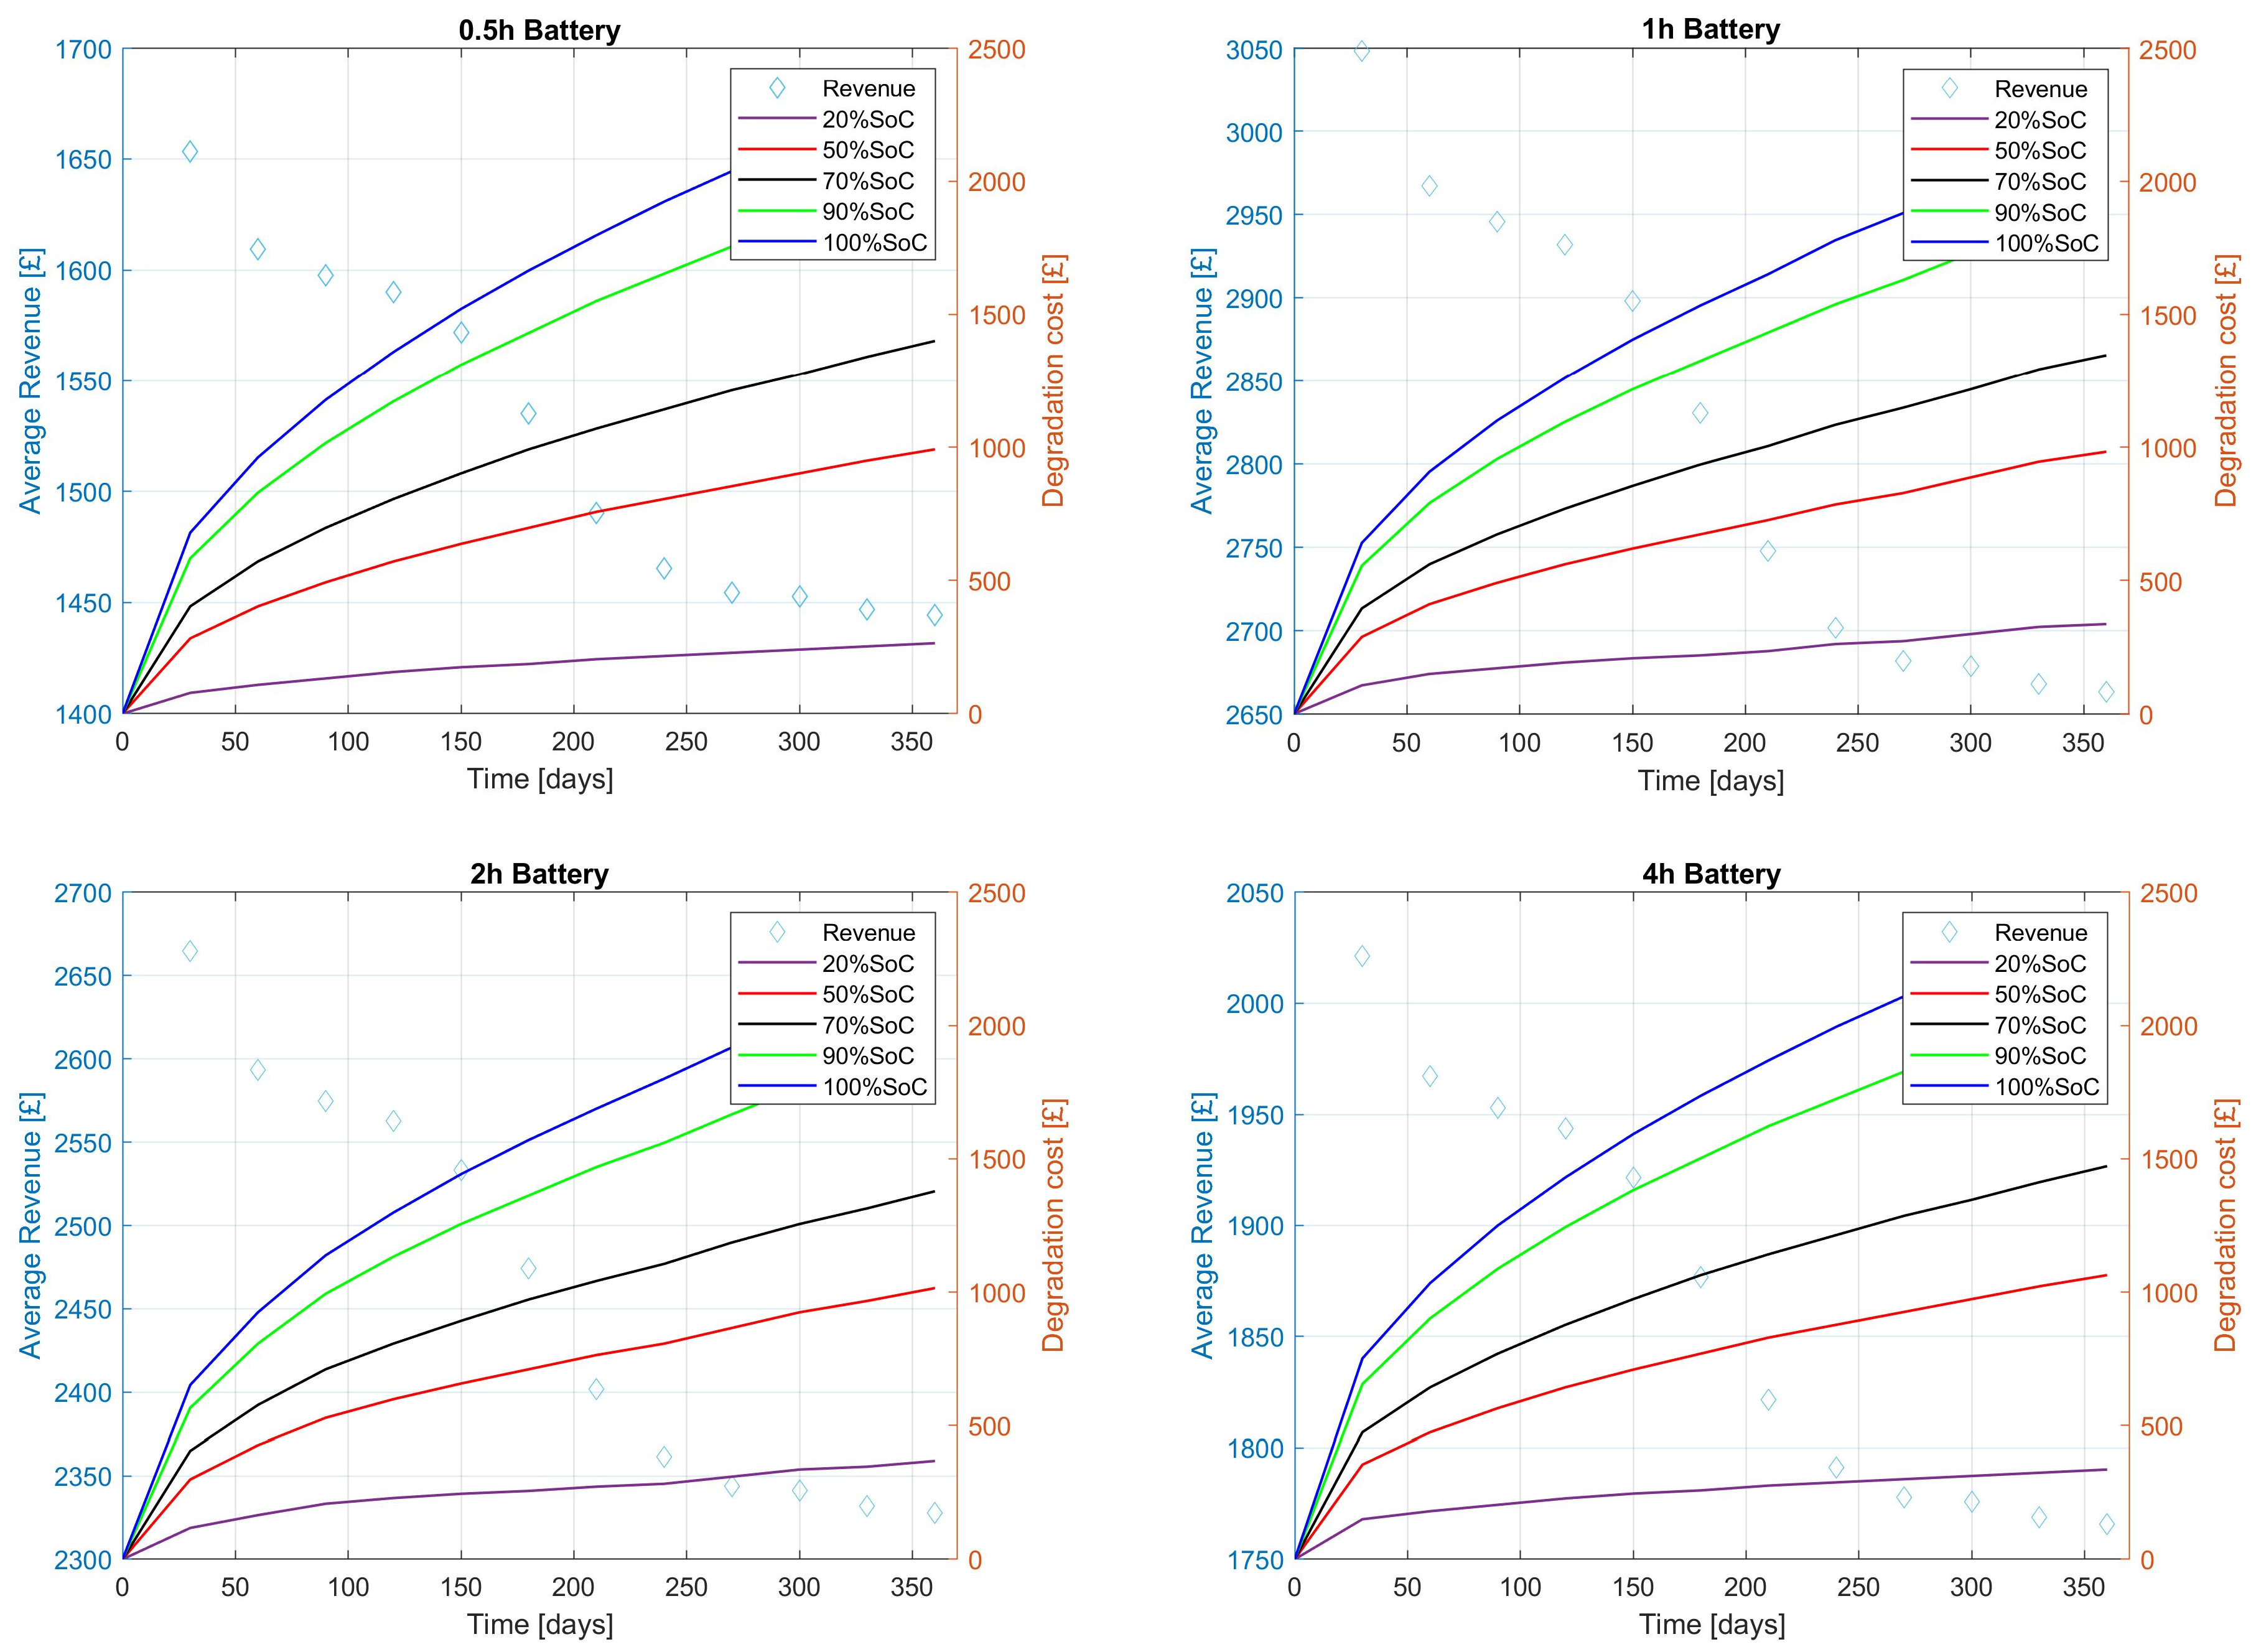
The collected revenues over a 12 months CM contract and any incurred degradation costs are depicted in Figure 7 and Figure 8 for the four de-rated batteries in different conditions.
In Figure 7, the batteries were kept at room temperature (25 °C) and the SoC was varied. This was to account for a real case scenario, whereby the battery could be at a different SoC level in a thermally controlled environment until it is ready to respond to SEs. First, it can be seen that the 1 h de-rated battery has the highest revenue compared to the others due to the relatively high k d e compared to its C o . The modeling results are confirmed, with many battery asset owners opting for 1 h de-rating factors in the latest CM auction [79]. Second, the degradation cost is lower at low SoC levels, as the calendar degradation is generally low. Third, compared with the same cases presented in [48], the physics-based degradation model predicts lower capacity losses under the same conditions. Therefore, it offers the opportunity for more overpayment, represented by Equation (6), as well as lowers the exposure to penalties (Equation (5)) for the 4 h de-rated battery. As such, the total collected revenue per CM contract is higher compared to the results presented in [48].
In Figure 8, the impact of the temperature change on the revenue is huge, necessitating a battery thermal management system to control the temperature at lower temperatures. However, when discharge occurs during SEs, it is necessary to increase the battery’s temperature to respond effectively and avoid penalties. Since the cycling here is low during the first 12 months of the CM contract, as shown in Figure 4, the average revenue stays the same compared to Figure 7.
Table 2 summarizes the accuracy of different degradation models, which have been used in the same CM application to predict the degradation cost. These are the empirical and semiempirical models reported in earlier study [48] and the physics-based degradation model used in this study. The physics-based degradation model is more accurate than the other two in predicting calendar and cycle degradation under different operating conditions. This is due to the feedback mechanism, which uses an accurate pseudo 2-dimensional (P2D) battery cell model, in which most of the parameters used account for the temperature–C rate change, as given in Appendix A. Additionally, although empirical and semiempirical modes that are tied to equivalent circuit models can be useful and computationally fast, the process of determining the parameter values in these models uses empirical system identification. Therefore, changing the operating conditions necessitates the use of a different fitting, which is a time-consuming and unreliable process.
In Table 3, the profit (revenue minus degradation cost) for the 1 h de-rated battery is calculated using the three different degradation model approaches (empirical, semiempirical, and physics). By using a physics-based degradation model when accounting for the degradation cost, the profit can be increased by 59.6% and 75.5% for 5 °C and 25 °C, respectively, when compared to both empirical and semiempirical models. This is due to the lower predicted degradation cost, which allows more overpayment to be collected. At higher temperatures such as 45 °C, the physics model predicts higher losses compared to the other two temperatures.

4.3. Sensitivity Analysis

This section investigates the effects of changing important parameters on the profitability of the batteries participating in the CM. This include changes to the CM clearance price, battery degradation cost, de-rating factors, and increased SEs as a result of a predicted increase in energy demand. It should be noted that all the sensitivity analysis results are conducted at a standard temperature of 25 °C, except for in Section 4.3.4, where the temperature was set to 5 °C to study the effects of CM penalties.

4.3.1. Capacity Market Price Change Effects

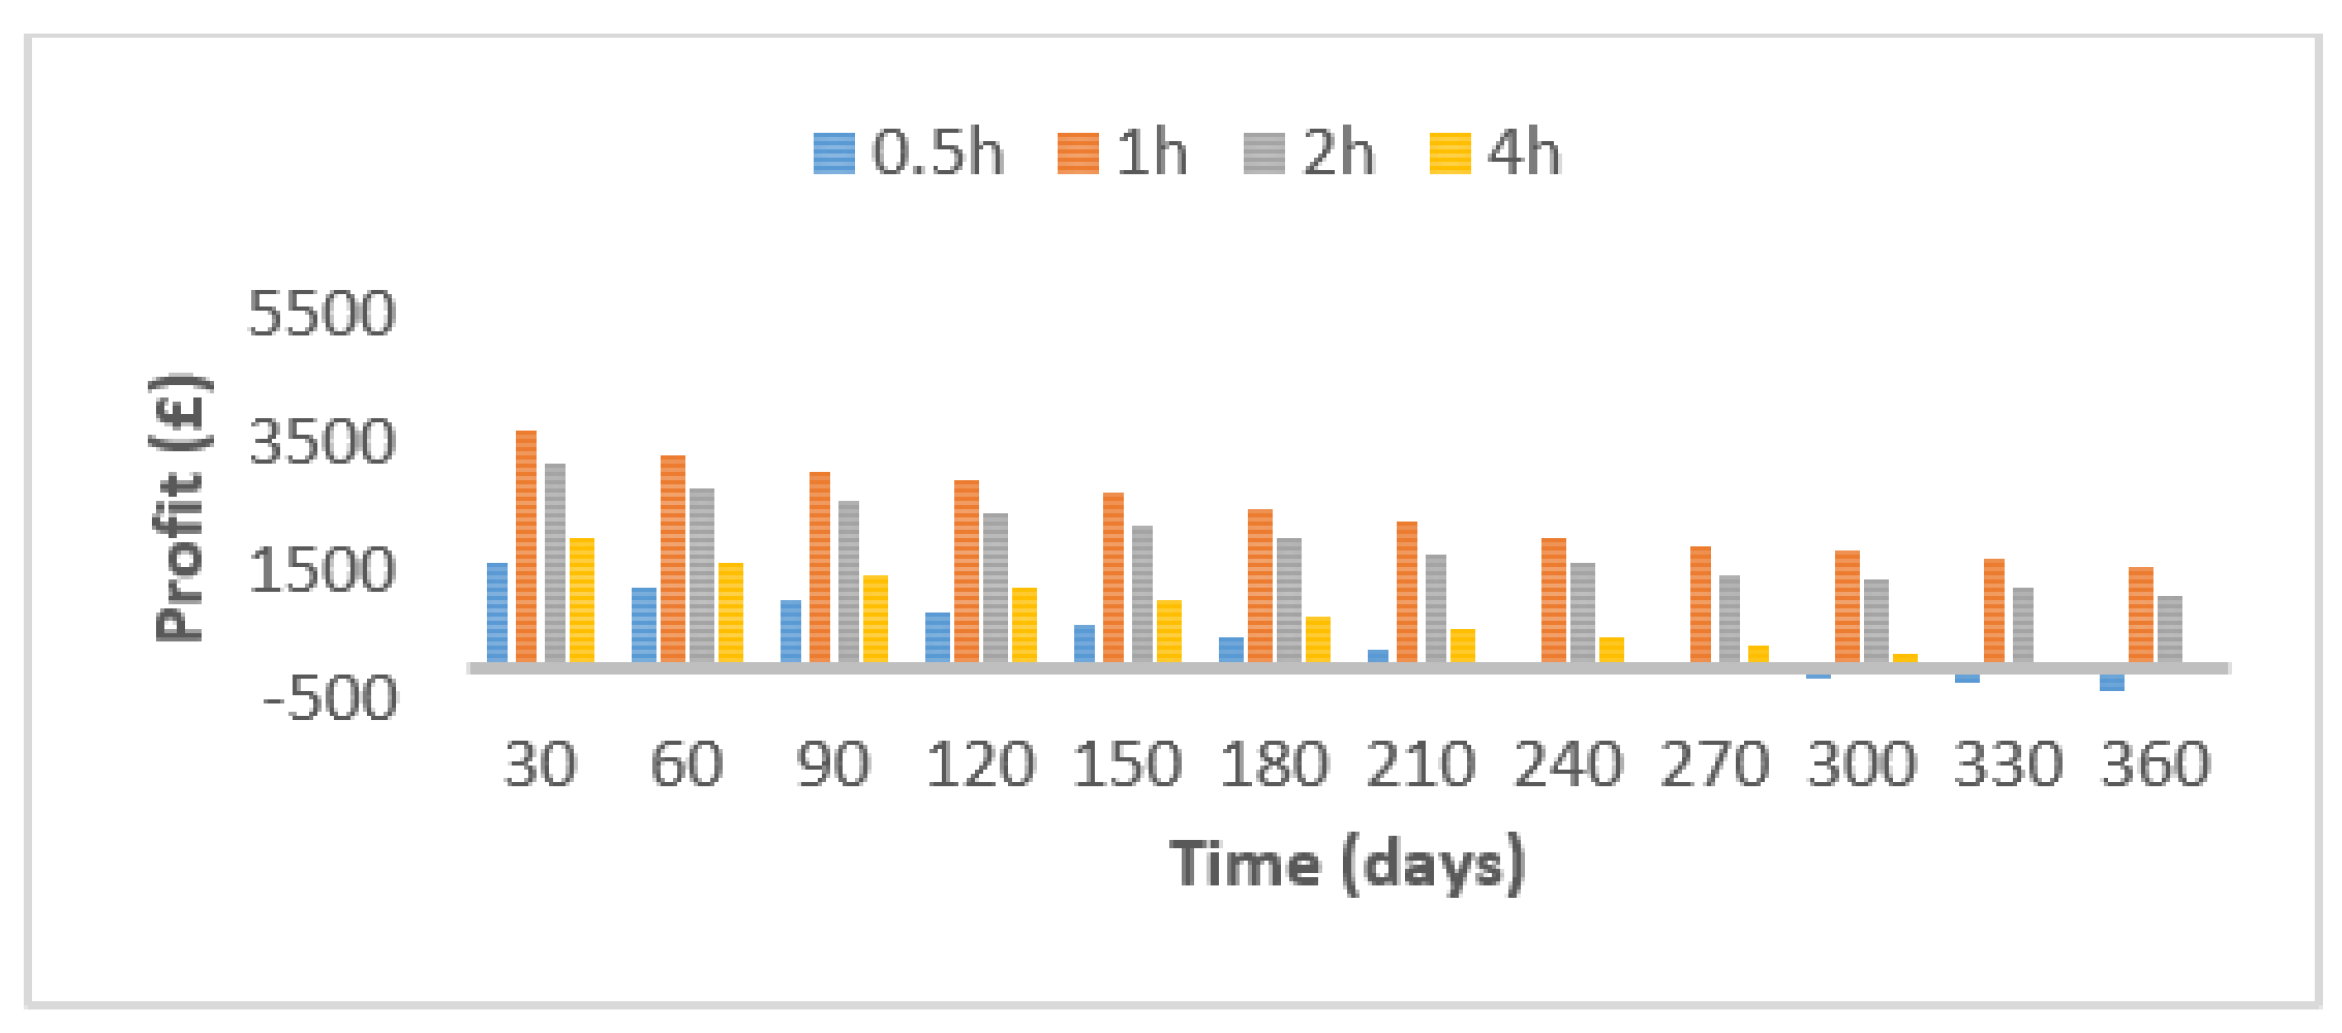
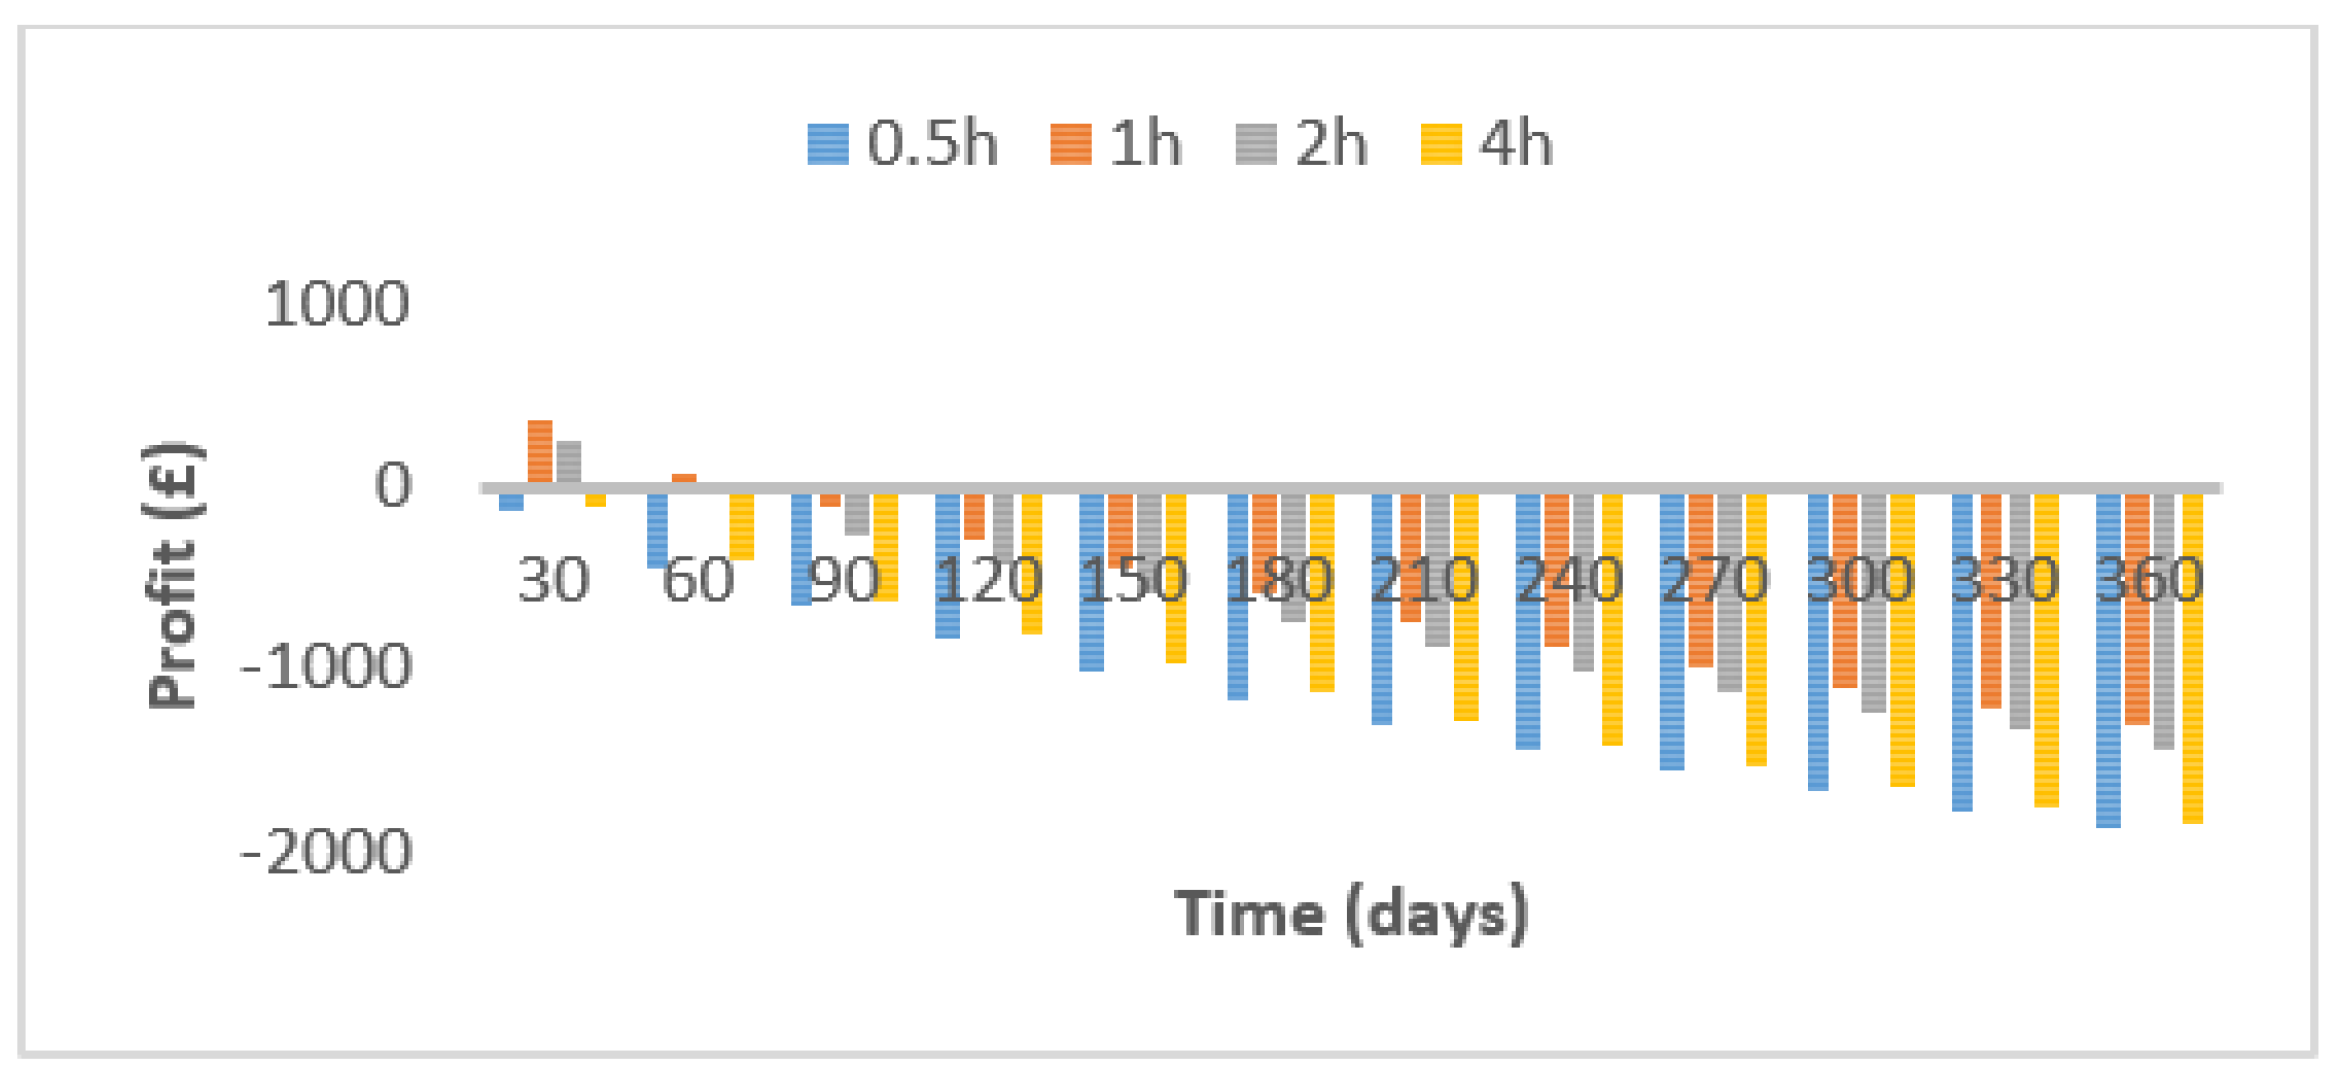
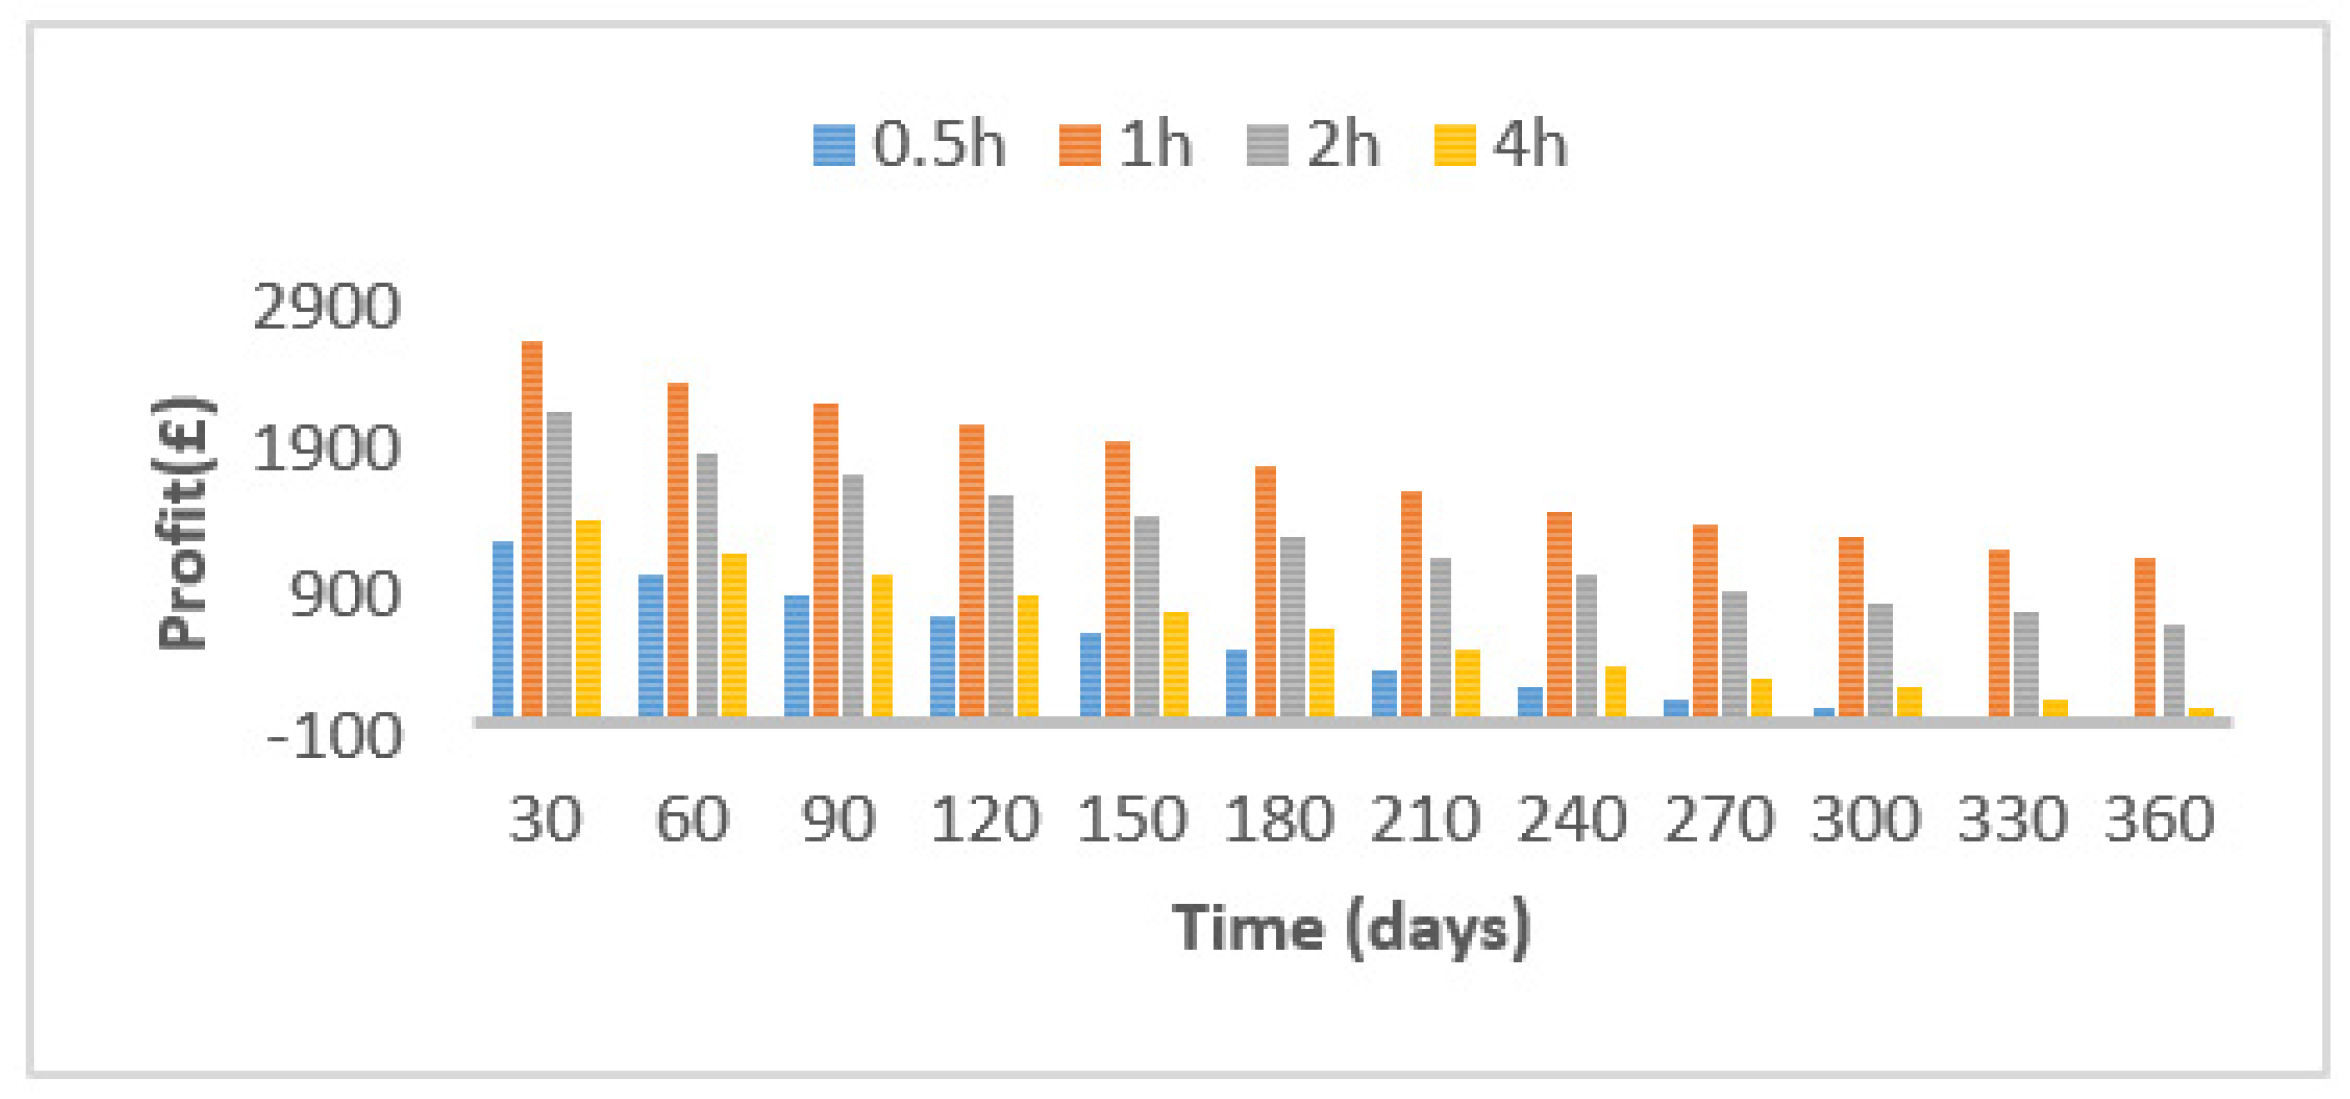
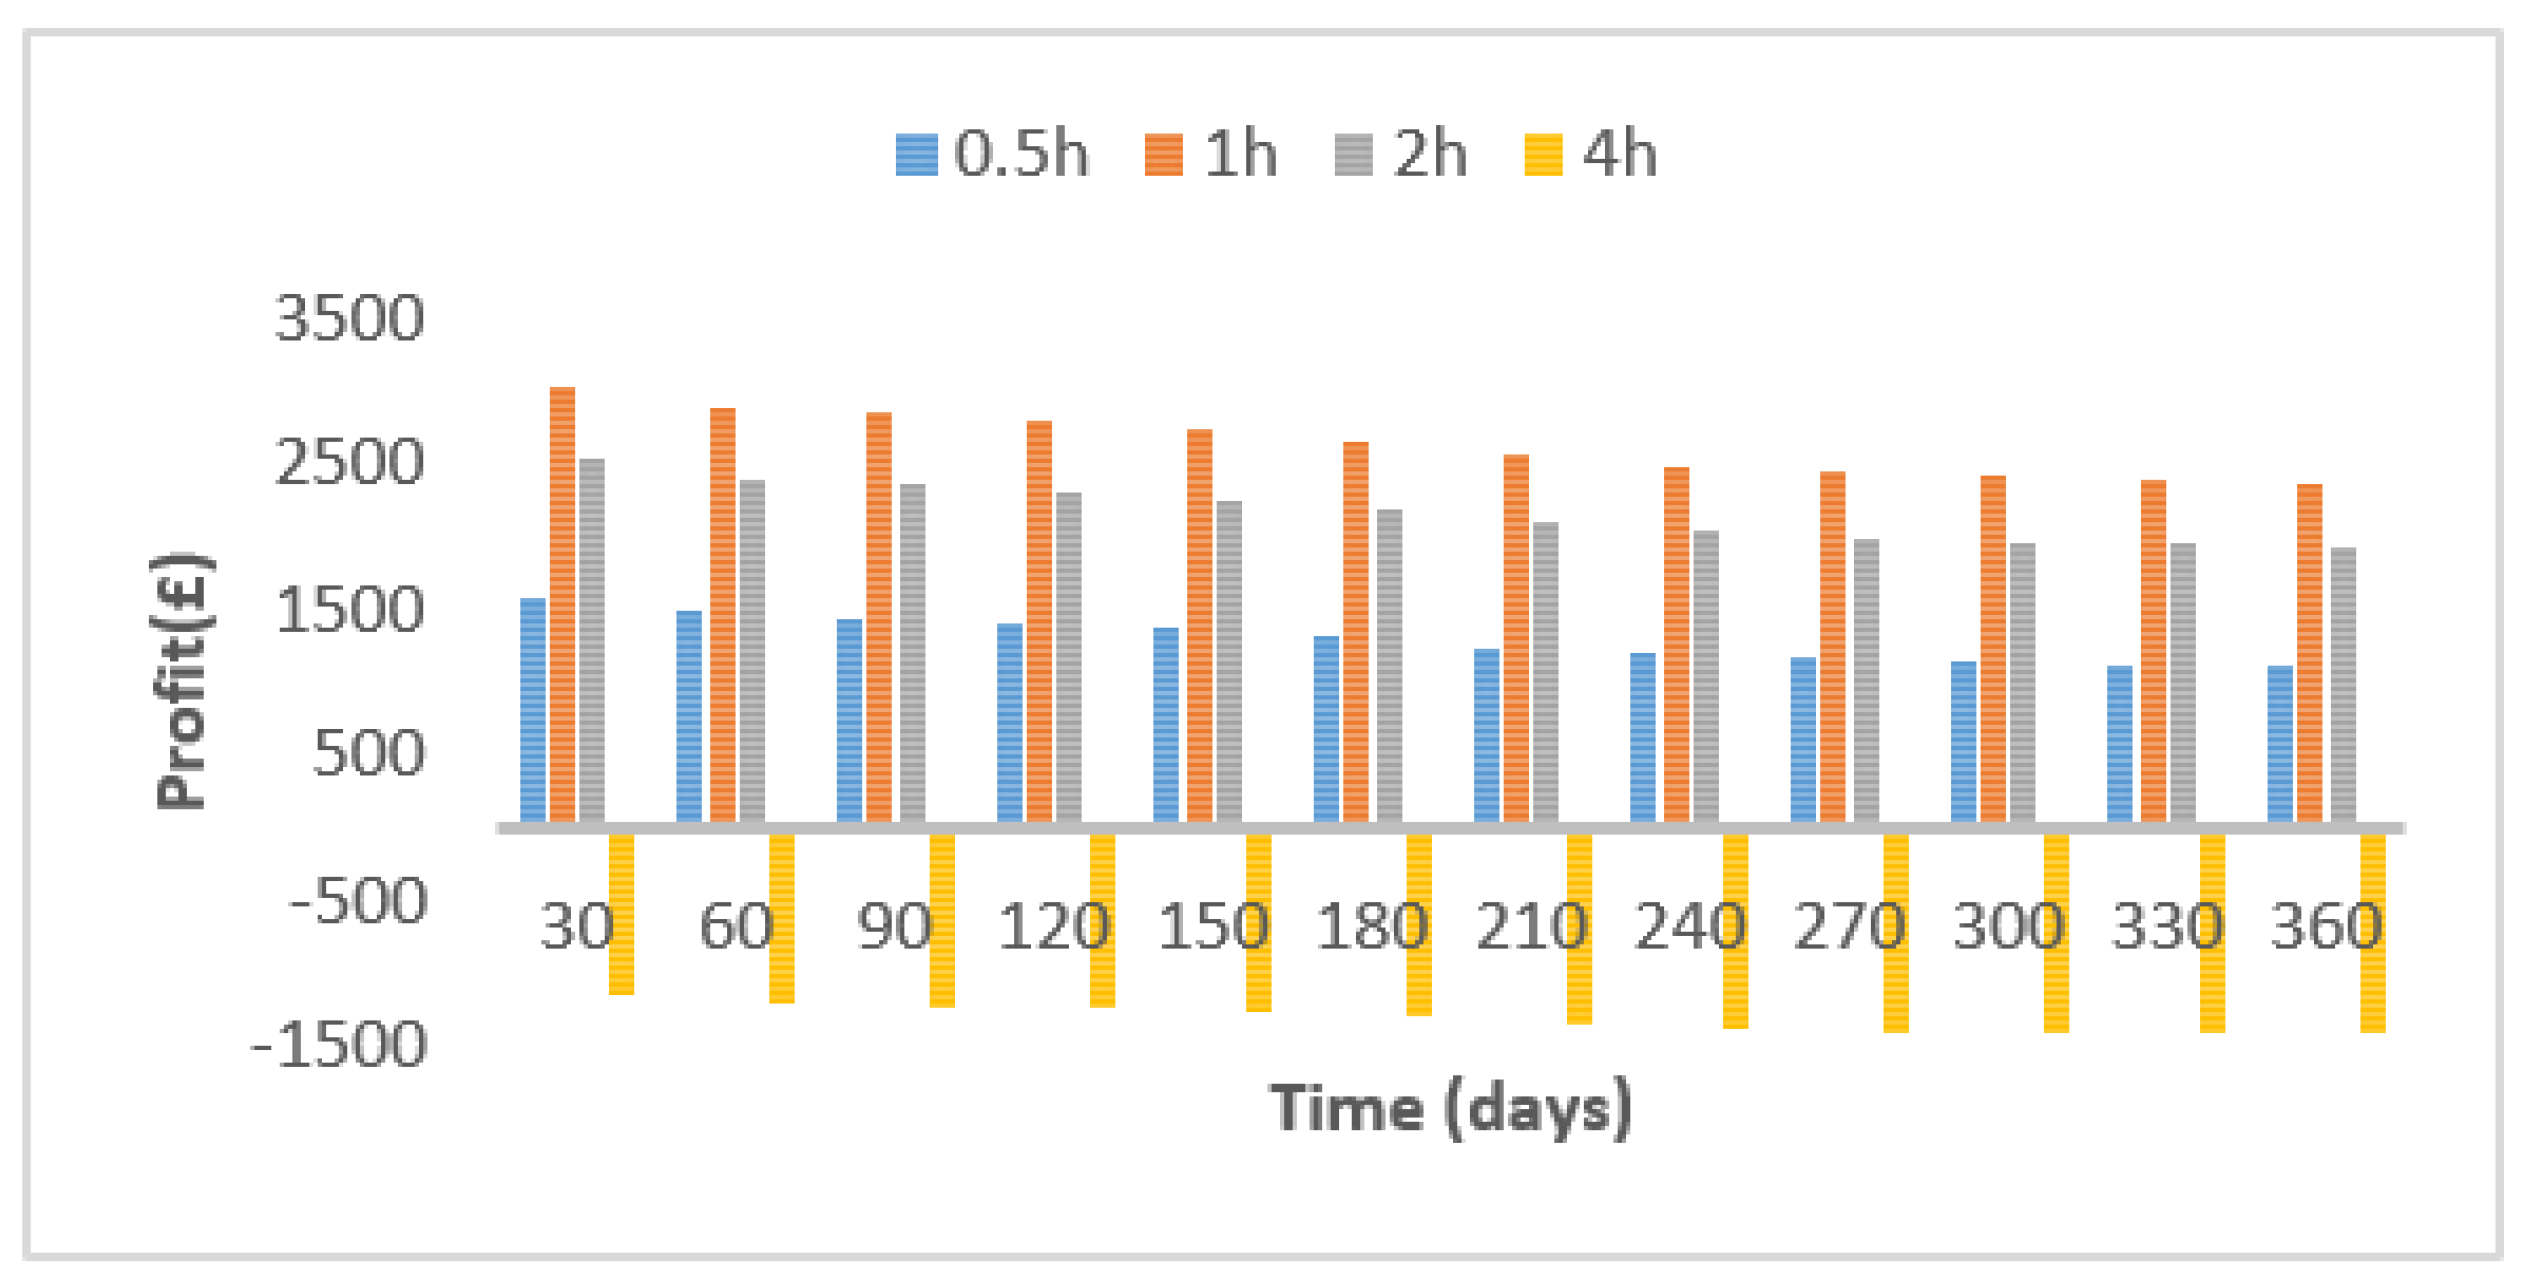
The CM clearing price λ c l is an important parameter that can be changed with different CM auction results. As such, λ c l has been changed twice to reflect the maximum and minimum auction prices obtained in the UK’s CM auctions from the start of the CM until now. The original λ c l = £ 19.4 / kW / year values were changed to λ c l = £ 27.5 / kW / year and λ c l = £ 6 / kW / year [80,81]. The profit (revenue—degradation cost) for a one-year CM contract is depicted in Figure 9 and Figure 10, respectively, for the four de-rated batteries. In Figure 9 and Figure 10, it can be seen that λ c l can hugely affect the batteries’ profitability. In Figure 9, nearly all the four batteries are profitable at the end of the CM contract, as shown by an average increase of 167% compared to the normal case. In Figure 10, all the four batteries incurred huge losses due to low clearing prices and high degradation costs, as shown by a decrease of 170% compared to the normal case.

4.3.2. Degradation Cost Effects

The degradation cost is changed from 176 $/kWh or 0.5 £/Ah to an optimistic 100 $/kWh (0.29 £/Ah), which is regarded as the ultimate goal for battery pack cost reduction in the future [82]. It can be seen in Figure 11 that all the batteries are profitable, with an average increase of nearly 50% over the standard case.

4.3.3. De-rating Factor Effects

The presumed de-rating factors for all four batteries (0.5 h to 4 h) are projected to decrease in the future to allow for new-generation entries in the CM, as stated in [64]. Therefore, the de-rating factors have been changed accordingly to 17.80% for the 0.5 h battery, 36.44% for the 1 h battery, 64.79% for the 2 h battery, and 96.11% for the 4 h battery. As shown in Figure 12, the overall profitability decreased for the 0.5 h and 4 h batteries, meaning they are no longer profitable.

4.3.4. Increased Shortage Events in the CM

In case of an expected increase in energy demand, the batteries in the CM are required to cycle more times per year, as shown in Figure 4, from month 13 to 24. In Figure 13, it can be seen that the 4 h battery is totally unprofitable due to the incurred penalties when cycling because of the high amount of capacity needed, which the battery cannot meet.

5. Conclusions and Future Work

This paper presented physics-based battery and degradation models that are used to inform a degradation cost analysis for lithium-ion batteries in the CM. The degradation model considers the SEI layer growth, active material loss, and SEI crack growth. The battery is utilized to obtain 0.5 h, 1 h, 2 h, and 4 h CM de-rating factors. During a one-year CM contract, the battery experienced cycle and calendar degradation, resulting in a degradation cost. At the same time, depending on a battery’s capacity obligation, a de-rated battery can generate revenue, overpayments, and penalties.
The results illustrate that the 1 h de-rated battery had the highest profit margin in the current CM design in all simulated scenarios. The results also show that batteries providing CM services should be stored at low temperatures, such as 5 °C. However, during shortage periods when the battery is delivering power, the temperature should be increased to 25 °C to avoid penalties. Moreover, the physics-based degradation model accurately predicted calendar and cycle degradation for a wider range of temperature conditions compared to empirical and semiempirical models. Due to the lower predicted battery capacity loss, the batteries received more capacity overpayment, thus increasing the overall revenue. As such, the profit for the 1 h de-rated battery was increased by 59.6% and 75.5% for 5 °C and 25 °C, respectively, when compared to empirical and semiempirical models.
A sensitivity analysis for a range of parameters used in this study revealed that the CM profit can be affected in several ways. First, the profit for batteries is highly sensitive to the CM auction price. For instance, increasing the CM auction price by 30% can increase the profit by nearly 170% for the 1 h de-rated battery. Second, decreasing the degradation cost to the optimal battery pack price of $100/kWh can increase the profit by 50% for the 1 h de-rated battery. Third, decreasing the de-rating reduced the profitability for the 0.5 h and 4 h de-rated batteries. Fourth, increased cycling in the case of frequent SEs hugely decreased the profitability of the 4 h de-rated battery. Future work will include investigating how degradation of lithium plating can affect the overall CM design, considering different regions and energy storage technologies.

Author Contributions

Conceptualization, A.G. and M.A.-G.; methodology, A.G. and M.A.-G.; formal analysis, A.G., M.A.-G., M.S., N.D., and T.C.; investigation, A.G., M.A.-G., M.S., N.D., and T.C.; writing—original draft preparation, A.G.; writing—review and editing, A.G., T.C., M.A.-G., and N.D.; supervision, T.C., N.D., M.A.-G., and M.S. All authors have read and agreed to the published version of the manuscript.

Funding

This research received no external funding.

Acknowledgments

Teesside University is gratefully acknowledged for fully supporting Ahmed′s study. The authors would like also to thank the three anonymous reviewers for their contributions to improve the paper.

Conflicts of Interest

The authors declare no conflict of interest.

Appendix A

Table A1. Pseude2-dimensional Battery Model Parameters.
Parameters Domain Reference
Positive ElectrodeSeparatorNegative Electrode
Bruggeman coefficient 1.5
Faraday constant, F96,485
Gas constant, R8.314
Thickness, L41.161774.83[72]
Active material volume fraction, ε s 0.43 0.55[83]
Electrolyte volume fraction, ε e 0.330.540.332[83]
Particle size, r (µm)11.3 27.2a
Maximum lithium concentration in the solid, C s , m a x 88,102 29934a
Electrolyte initial lithium concentration 1200 [83]
Transference number, t + 0 0.3630.3630.363[66]
Activity dependence, f ± 111[72]
Charge transfer coefficient, α a , α b 0.5 0.5
Stoichiometry at 100% SoC, x 1 , y 1 0.35 0.77a
Stoichiometry at 0% SoC, x 0 , y 0 0.92 0.02a
Reference temperature, T r e f 298.15
Electrical conductivity, σ 100 100
Active material area, A(m)0.0383 0.0391[72]
Open circuit potential for positive electrode, 10.72 x 4 + 23.88 x 3 16.77 x 2 + 2.595 x + 4.563 [84]
Open circuit potential for negative electrode 2.126 y 4 5.511 y 3 + 5.084 y 2 2.036 y + 0.4968
Electrolyte ionic conductivity, κ 15.8 C e × exp ( 13472 C e 1.4 ) × exp ( 20000 R ( 1 T 1 T r e f ) ) 2 [72]
Lithium diffusion in the electrolyte, D e 3.8037 × 10 10 × exp ( 0.792 C e ) × exp ( 10000 R ( 1 T 1 T r e f ) ) [72]
Lithium diffusion in the positive electrode D s , p o s 3 × 10 14 × exp ( 35000 R ( 1 T 1 T r e f ) ) 2 [72]
Lithium diffusion in the negative electrode D s , n e g 3 × 10 14 × exp ( 35000 R ( 1 T 1 T r e f ) ) 2 [72]
Reaction rate in the positive electrode, k p o s k 0 , p o s d i s × exp ( 5 x ) × exp ( 20000 R ( 1 T 1 T r e f ) ) 2
k 0 , p o s c h × exp ( 20000 R ( 1 T 1 T r e f ) ) 2 [72]
Reaction rate in the negative electrode, k n e g k 0 , n e g d i s × exp ( 20000 R ( 1 T 1 T r e f ) ) 2 [72]
k 0 , n e g c h × exp ( 5 y ) × exp ( 20000 R ( 1 T 1 T r e f ) ) 2
a: parameters estimation.

Appendix B

Table A2. Degradation Model Parameters.
Parameter Value
k S E I 5.223 × 10 5
k A M 7.88 × 10 3
k S E I , c r a c k 2.22 × 10 7
E S E I 61,276
E A M 39,600
λ 0.0148
V 1.2 × 10 5
R p 9 × 10 6 [68]
R s 9.2 × 10 6 [68]
ε A M , 0 0.54
i 0 0.05
σ Y i e l d 8 [70]
m0.5
E Y , s 0.42
E Y , p 14.3
v s 0.2 [70]
v p 0.3 [70]
σ k σ m a x , k σ m i n , k 2
σ m a x , k E Y , s ( 1 2 v s ) b 1 + E Y , s R p 3 ( 1 + v s ) b 2
σ m i n , k E Y , s ( 1 2 v s ) b 1 + E Y , s R s 3 ( 1 + v s ) b 2
b 1 2 E Y , p ( 2 v s 1 ) 0 R p Ω p ( c L I ( r , t ) c L I ( r , 0 ) ) r 2   d r E Y , p ( 2 R p 3 + R s 3 4 R p 3 v s + R s 3 v s ) + E Y , s ( 2 R s 3 2 R p 3 + 4 R p 3 v p 4 R s 3 v s ) [70]
b 2 E Y , p R s 3 ( v s + 1 ) 0 R p Ω p ( c L I ( r , t ) c L I ( r , 0 ) ) r 2   d r E Y , p ( 2 R p 3 + R s 3 4 R p 3 v s + R s 3 v s ) + E Y , s ( 2 R s 3 2 R p 3 + 4 R p 3 v p 4 R s 3 v s ) [70]

References

  1. Cucchiella, F.; D’Adamo, I.; Gastaldi, M. Future Trajectories of Renewable Energy Consumption in the European Union. Resources 2018, 7, 10. [Google Scholar] [CrossRef] [Green Version]
  2. British Petroleum. BP Statistical Review of World Energy; British Petroleum: London, UK, 2019; Available online: https://www.bp.com/content/dam/bp/business-sites/en/global/corporate/pdfs/energy-economics/statistical-review/bp-stats-review-2019-renewable-energy.pdf (accessed on 16 January 2020).
  3. Kumar, J.; Parthasarathy, C.; Västi, M.; Laaksonen, H.; Shafie-Khah, M.; Kauhaniemi, K. Sizing and Allocation of Battery Energy Storage Systems in Åland Islands for Large-Scale Integration of Renewables and Electric Ferry Charging Stations. Energies 2020, 13, 317. [Google Scholar] [CrossRef] [Green Version]
  4. Khalili, S.; Rantanen, E.; Bogdanov, D.; Breyer, C. Global Transportation Demand Development with Impacts on the Energy Demand and Greenhouse Gas Emissions in a Climate-Constrained World. Energies 2019, 12, 3870. [Google Scholar] [CrossRef] [Green Version]
  5. Lisin, E.; Strielkowski, W.; Chernova, V.; Fomina, A. Assessment of the Territorial Energy Security in the Context of Energy Systems Integration. Energies 2018, 11, 3284. [Google Scholar] [CrossRef] [Green Version]
  6. Heylen, E.; Deconinck, G.; Van Hertem, D. Review and classification of reliability indicators for power systems with a high share of renewable energy sources. Renew. Sustain. Energy Rev. 2018, 97, 554–568. [Google Scholar] [CrossRef]
  7. Short, M.; Crosbie, T.; Dawood, M.; Dawood, N. Load forecasting and dispatch optimisation for decentralised co-generation plant with dual energy storage. Appl. Energy 2017, 186, 304–320. [Google Scholar] [CrossRef] [Green Version]
  8. Park, S.H.; Hussain, A.; Kim, H.M. Impact Analysis of Survivability-Oriented Demand Response on Islanded Operation of Networked Microgrids with High Penetration of Renewables. Energies 2019, 12, 452. [Google Scholar] [CrossRef] [Green Version]
  9. Kong, Q.; Fowler, M.; Entchev, E.; Ribberink, H.; McCallum, R. The Role of Charging Infrastructure in Electric Vehicle Implementation within Smart Grids. Energies 2018, 11, 3362. [Google Scholar] [CrossRef] [Green Version]
  10. Strielkowski, W.; Streimikiene, D.; Fomina, A.; Semenova, E. Internet of Energy (IoE) and High-Renewables Electricity System Market Design. Energies 2019, 12, 4790. [Google Scholar] [CrossRef] [Green Version]
  11. Tucki, K.; Orynycz, O.; Wasiak, A.; Świć, A.; Dybaś, W. Capacity Market Implementation in Poland: Analysis of a Survey on Consequences for the Electricity Market and for Energy Management. Energies 2019, 12, 839. [Google Scholar] [CrossRef] [Green Version]
  12. Gerard, H.; Rivero Puente, E.I.; Six, D. Coordination between transmission and distribution system operators in the electricity sector: A conceptual framework. Util. Policy 2018, 50, 40–48. [Google Scholar] [CrossRef]
  13. Albertus, P.; Manser, J.S.; Litzelman, S. Long-Duration Electricity Storage Applications, Economics, and Technologies. Joule 2020, 4, 21–32. [Google Scholar] [CrossRef]
  14. Mastropietro, P.; Rodilla, P.; Batlle, C. De-rating of wind and solar resources in capacity mechanisms: A review of international experiences. Renew. Sustain. Energy Rev. 2019, 112, 253–262. [Google Scholar] [CrossRef]
  15. Bublitz, A.; Keles, D.; Zimmermann, F.; Fraunholz, C.; Fichtner, W. A survey on electricity market design: Insights from theory and real-world implementations of capacity remuneration mechanisms. Energy Econ. 2019, 80, 1059–1078. [Google Scholar] [CrossRef]
  16. Lee, A.; Vörös, M.; Dose, W.M.; Niklas, J.; Poluektov, O.; Schaller, R.D.; Iddir, H.; Maroni, V.A.; Lee, E.; Ingram, B.; et al. Photo-accelerated fast charging of lithium-ion batteries. Nat. Commun. 2019, 10, 4946. [Google Scholar] [CrossRef] [PubMed]
  17. Sioshansi, R.; Madaeni, S.H.; Denholm, P. A Dynamic Programming Approach to Estimate the Capacity Value of Energy Storage. IEEE Trans. Power Syst. 2014, 29, 395–403. [Google Scholar] [CrossRef]
  18. Khan, A.S.M.; Verzijlbergh, R.A.; Sakinci, O.C.; De Vries, L.J. How do demand response and electrical energy storage affect (the need for) a capacity market? Appl. Energy 2018, 214, 39–62. [Google Scholar] [CrossRef]
  19. Staffell, I.; Rustomji, M. Maximising the value of electricity storage. J. Energy Storage 2016, 8, 212–225. [Google Scholar] [CrossRef] [Green Version]
  20. Teng, F.; Strbac, G. Business cases for energy storage with multiple service provision. J. Mod. Power Syst. Clean Energy 2016, 4, 615–625. [Google Scholar] [CrossRef] [Green Version]
  21. Xu, B.; Oudalov, A.; Ulbig, A.; Andersson, G.; Kirschen, D.S. Modeling of Lithium-Ion Battery Degradation for Cell Life Assessment. IEEE Trans. Smart Grid 2018, 9, 1131–1140. [Google Scholar] [CrossRef]
  22. Castagneto Gissey, G.; Dodds, P.E.; Radcliffe, J. Market and regulatory barriers to electrical energy storage innovation. Renew. Sustain. Energy Rev. 2018, 82, 781–790. [Google Scholar] [CrossRef]
  23. Chen, H.; Baker, S.; Benner, S.; Berner, A.; Liu, J. PJM Integrates Energy Storage: Their Technologies and Wholesale Products. IEEE Power Energy Mag. 2017, 15, 59–67. [Google Scholar] [CrossRef]
  24. Kumar, A.; Meena, N.K.; Singh, A.R.; Deng, Y.; He, X.; Bansal, R.C.; Kumar, P. Strategic integration of battery energy storage systems with the provision of distributed ancillary services in active distribution systems. Appl. Energy 2019, 253, 113503. [Google Scholar] [CrossRef]
  25. Askeland, M.; Jaehnert, S.; Korpås, M. Equilibrium assessment of storage technologies in a power market with capacity remuneration. Sustain. Energy Technol. Assess. 2019, 31, 228–235. [Google Scholar] [CrossRef]
  26. Haas, J.; Cebulla, F.; Nowak, W.; Rahmann, C.; Palma-Behnke, R. A multi-service approach for planning the optimal mix of energy storage technologies in a fully-renewable power supply. Energy Convers. Manag. 2018, 178, 355–368. [Google Scholar] [CrossRef]
  27. Lorenzi, G.; da Silva Vieira, R.; Santos Silva, C.A.; Martin, A. Techno-economic analysis of utility-scale energy storage in island settings. J. Energy Storage 2019, 21, 691–705. [Google Scholar] [CrossRef]
  28. Greenwood, D.M.; Lim, K.Y.; Patsios, C.; Lyons, P.F.; Lim, Y.S.; Taylor, P.C. Frequency response services designed for energy storage. Appl. Energy 2017, 203, 115–127. [Google Scholar] [CrossRef]
  29. Denholm, P.; Nunemaker, J.; Gagnon, P.; Cole, W. The potential for battery energy storage to provide peaking capacity in the United States. Renew. Energy 2019, 151, 1269–1277. [Google Scholar] [CrossRef]
  30. Andrenacci, N.; Chiodo, E.; Lauria, D.; Mottola, F. Life Cycle Estimation of Battery Energy Storage Systems for Primary Frequency Regulation. Energies 2018, 11, 3320. [Google Scholar] [CrossRef] [Green Version]
  31. Martins, R.; Hesse, C.H.; Jungbauer, J.; Vorbuchner, T.; Musilek, P. Optimal Component Sizing for Peak Shaving in Battery Energy Storage System for Industrial Applications. Energies 2018, 11, 2048. [Google Scholar] [CrossRef] [Green Version]
  32. Xu, B.; Zhao, J.; Zheng, T.; Litvinov, E.; Kirschen, D.S. Factoring the Cycle Aging Cost of Batteries Participating in Electricity Markets. IEEE Trans. Power Syst. 2018, 33, 2248–2259. [Google Scholar] [CrossRef] [Green Version]
  33. Kies, A. Joint optimisation of arbitrage profits and battery life degradation for grid storage application of battery electric vehicles. J. Phys. Conf. Ser. 2018, 977, 012005. [Google Scholar] [CrossRef] [Green Version]
  34. Petit, M.; Prada, E.; Sauvant-Moynot, V. Development of an empirical aging model for Li-ion batteries and application to assess the impact of Vehicle-to-Grid strategies on battery lifetime. Appl. Energy 2016, 172, 398–407. [Google Scholar] [CrossRef]
  35. Thompson, A.W. Economic implications of lithium ion battery degradation for Vehicle-to-Grid (V2X) services. J. Power Sources 2018, 396, 691–709. [Google Scholar] [CrossRef]
  36. Reniers, J.M.; Mulder, G.; Howey, D.A. Review and Performance Comparison of Mechanical-Chemical Degradation Models for Lithium-Ion Batteries. J. Electrochem. Soc. 2019, 166, A3189–A3200. [Google Scholar] [CrossRef] [Green Version]
  37. Maheshwari, A.; Paterakis, N.G.; Santarelli, M.; Gibescu, M. Optimizing the operation of energy storage using a non-linear lithium-ion battery degradation model. Appl. Energy 2020, 261, 114360. [Google Scholar] [CrossRef]
  38. Dubarry, M.; Devie, A.; Stein, K.; Tun, M.; Matsuura, M.; Rocheleau, R. Battery Energy Storage System battery durability and reliability under electric utility grid operations: Analysis of 3 years of real usage. J. Power Sources 2017, 338, 65–73. [Google Scholar] [CrossRef]
  39. Wankmüller, F.; Thimmapuram, P.R.; Gallagher, K.G.; Botterud, A. Impact of battery degradation on energy arbitrage revenue of grid-level energy storage. J. Energy Storage 2017, 10, 56–66. [Google Scholar] [CrossRef] [Green Version]
  40. Purvins, A.; Sumner, M. Optimal management of stationary lithium-ion battery system in electricity distribution grids. J. Power Sources 2013, 242, 742–755. [Google Scholar] [CrossRef]
  41. Pimm, A.J.; Palczewski, J.; Morris, R.; Cockerill, T.T.; Taylor, P.G. Community energy storage: A case study in the UK using a linear programming method. Energy Convers. Manag. 2020, 205, 112388. [Google Scholar] [CrossRef]
  42. Dufo-López, R.; Bernal-Agustín, J.L. Techno-economic analysis of grid-connected battery storage. Energy Convers. Manag. 2015, 91, 394–404. [Google Scholar] [CrossRef]
  43. Patsios, C.; Wu, B.; Chatzinikolaou, E.; Rogers, D.J.; Wade, N.; Brandon, N.P.; Taylor, P. An integrated approach for the analysis and control of grid connected energy storage systems. J. Energy Storage 2016, 5, 48–61. [Google Scholar] [CrossRef] [Green Version]
  44. Weißhar, B.; Bessler, W.G. Model-based degradation assessment of lithium-ion batteries in a smart microgrid. In Proceedings of the 2015 International Conference on Smart Grid and Clean Energy Technologies (ICSGCE), Offenburg, Germany, 20–23 October 2015; pp. 134–138. [Google Scholar]
  45. Reniers, J.M.; Mulder, G.; Ober-Blöbaum, S.; Howey, D.A. Improving optimal control of grid-connected lithium-ion batteries through more accurate battery and degradation modelling. J. Power Sources 2018, 379, 91–102. [Google Scholar] [CrossRef] [Green Version]
  46. Birkl, C.R.; Roberts, M.R.; McTurk, E.; Bruce, P.G.; Howey, D.A. Degradation diagnostics for lithium ion cells. J. Power Sources 2017, 341, 373–386. [Google Scholar] [CrossRef]
  47. Usera, I.; Rodilla, P.; Burger, S.; Herrero, I.; Batlle, C. The Regulatory Debate About Energy Storage Systems: State of the Art and Open Issues. IEEE Power Energy Mag. 2017, 15, 42–50. [Google Scholar] [CrossRef]
  48. Gailani, A.; Al-Greer, M.; Short, M.; Crosbie, T. Degradation Cost Analysis of Li-Ion Batteries in the Capacity Market with Different Degradation Models. Electronics 2020, 9, 90. [Google Scholar] [CrossRef] [Green Version]
  49. Cramton, P.; Ockenfels, A. Economics and design of capacity markets for the power sector. In Interdisziplinäre Aspekte der Energiewirtschaft; Springer: Berlin/Heidelberg, Germany, 2016; pp. 191–212. [Google Scholar]
  50. Cramton, P.; Ockenfels, A.; Stoft, S. Capacity Market Fundamentals. Econ. Energy Environ. Policy 2013, 2. [Google Scholar] [CrossRef] [Green Version]
  51. Ashokkumar Parmar, A.; Pranav B Darji, B. Capacity market functioning with renewable capacity integration and global practices. Electr. J. 2020, 33, 106708. [Google Scholar] [CrossRef]
  52. Energy Emergencies Executive Committee (E3C). GB Power System Disruption on 9 August 2019; UK Government: London, UK, 2020. Available online: https://assets.publishing.service.gov.uk/government/uploads/system/uploads/attachment_data/file/855767/e3c-gb-power-disruption-9-august-2019-final-report.pdf (accessed on 3 February 2020).
  53. Cramton, P. Electricity market design. Oxf. Rev. Econ. Policy 2017, 33, 589–612. [Google Scholar] [CrossRef] [Green Version]
  54. Sioshansi, F.P. Competitive Electricity Markets: Design, Implementation, Performance; Elsevier: Amsterdam, The Netherlands, 2011. [Google Scholar]
  55. Gailani, A.; Crosbie, T.; Al-Greer, M.; Short, M.; Dawood, N. On the Role of Regulatory Policy on the Business Case for Energy Storage in Both EU and UK Energy Systems: Barriers and Enablers. Energies 2020, 13, 1080. [Google Scholar] [CrossRef] [Green Version]
  56. Fraunholz, C.; Keles, D.; Fichtner, W. On the Role of Electricity Storage in Capacity Remuneration Mechanisms; Karlsruhe Institute of Technology (KIT): Karlsruhe, Germany, 2019. [Google Scholar]
  57. National Grid. Capacity Market Registers; National Grid: London, UK, 2019; Available online: https://www.emrdeliverybody.com/CM/Registers.aspx (accessed on 25 April 2019).
  58. Slipac, G.; Zeljko, M.; Šljivac, D. Importance of Reliability Criterion in Power System Expansion Planning. Energies 2019, 12, 1714. [Google Scholar] [CrossRef] [Green Version]
  59. Söder, L.; Tómasson, E.; Estanqueiro, A.; Flynn, D.; Hodge, B.M.; Kiviluoma, J.; Korpås, M.; Neau, E.; Couto, A.; Pudjianto, D.; et al. Review of wind generation within adequacy calculations and capacity markets for different power systems. Renew. Sustain. Energy Rev. 2020, 119, 109540. [Google Scholar] [CrossRef]
  60. THEMA Consulting Group. Capacity Adequacy in the Nordic Electricity Market; Nordic Energy: Oslo, Norway, 2015; Available online: https://www.nordicenergy.org/wp-content/uploads/2015/08/capacity_adequacy_THEMA_2015-1.pdf (accessed on 16 March 2020).
  61. Bhagwat, P.C.; Iychettira, K.K.; Richstein, J.C.; Chappin, E.J.L.; De Vries, L.J. The effectiveness of capacity markets in the presence of a high portfolio share of renewable energy sources. Util. Policy 2017, 48, 76–91. [Google Scholar] [CrossRef]
  62. Bhagwat, P.C.; Marcheselli, A.; Richstein, J.C.; Chappin, E.J.L.; De Vries, L.J. An analysis of a forward capacity market with long-term contracts. Energy Policy 2017, 111, 255–267. [Google Scholar] [CrossRef]
  63. Gallo Cassarino, T.; Sharp, E.; Barrett, M. The impact of social and weather drivers on the historical electricity demand in Europe. Appl. Energy 2018, 229, 176–185. [Google Scholar] [CrossRef]
  64. National Grid. Duration-Limited Storage De-Rating Factor Assessment—Final Report; National Grid: London, UK, 2017; Available online: https://www.emrdeliverybody.com/Lists/Latest%20News/Attachments/150/Duration%20Limited%20Storage%20De-Rating%20Factor%20Assessment%20-%20Final.pdf (accessed on 18 April 2019).
  65. Doyle, M. Modeling of Galvanostatic Charge and Discharge of the Lithium/Polymer/Insertion Cell. J. Electrochem. Soc. 1993, 140, 1526. [Google Scholar] [CrossRef]
  66. Plett, G.L. Battery Management Systems, Volume I: Battery Modeling; Artech House: Norwood, MA, USA, 2015. [Google Scholar]
  67. Jin, X.; Vora, A.; Hoshing, V.; Saha, T.; Shaver, G.; García, R.E.; Wasynczuk, O.; Varigonda, S. Physically-based reduced-order capacity loss model for graphite anodes in Li-ion battery cells. J. Power Sources 2017, 342, 750–761. [Google Scholar] [CrossRef] [Green Version]
  68. Laresgoiti, I.; Käbitz, S.; Ecker, M.; Sauer, D.U. Modeling mechanical degradation in lithium ion batteries during cycling: Solid electrolyte interphase fracture. J. Power Sources 2015, 300, 112–122. [Google Scholar] [CrossRef]
  69. Prada, E.; Di Domenico, D.; Creff, Y.; Bernard, J.; Sauvant-Moynot, V.; Huet, F. A Simplified Electrochemical and Thermal Aging Model of LiFePO4-Graphite Li-ion Batteries: Power and Capacity Fade Simulations. J. Electrochem. Soc. 2013, 160, A616–A628. [Google Scholar] [CrossRef] [Green Version]
  70. Jin, X.; Liu, C. Physics-based control-oriented reduced-order degradation model for LiNiMnCoO2—Graphite cell. Electrochim. Acta 2019, 312, 188–201. [Google Scholar] [CrossRef]
  71. Zhang, H.L.; Li, F.; Liu, C.; Tan, J.; Cheng, H.M. New Insight into the Solid Electrolyte Interphase with Use of a Focused Ion Beam. J. Phys. Chem. B 2005, 109, 22205–22211. [Google Scholar] [CrossRef] [PubMed]
  72. Hosseinzadeh, E.; Genieser, R.; Worwood, D.; Barai, A.; Marco, J.; Jennings, P. A systematic approach for electrochemical-thermal modelling of a large format lithium-ion battery for electric vehicle application. J. Power Sources 2018, 382, 77–94. [Google Scholar] [CrossRef] [Green Version]
  73. Li, J.; Wang, D.; Pecht, M. An electrochemical model for high C-rate conditions in lithium-ion batteries. J. Power Sources 2019, 436, 226885. [Google Scholar] [CrossRef]
  74. Kasnatscheew, J.; Rodehorst, U.; Streipert, B.; Wiemers-Meyer, S.; Jakelski, R.; Wagner, R.; Laskovic, I.C.; Winter, M. Learning from overpotentials in lithium ion batteries: A case study on the LiNi1/3Co1/3Mn1/3O2 (NCM) cathode. J. Electrochem. Soc. 2016, 163, A2943–A2950. [Google Scholar] [CrossRef]
  75. Ouyang, D.; He, Y.; Weng, J.; Liu, J.; Chen, M.; Wang, J. Influence of low temperature conditions on lithium-ion batteries and the application of an insulation material. RSC Adv. 2019, 9, 9053–9066. [Google Scholar] [CrossRef] [Green Version]
  76. Kasnatscheew, J.; Evertz, M.; Streipert, B.; Wagner, R.; Nowak, S.; Cekic Laskovic, I.; Winter, M. Improving cycle life of layered lithium transition metal oxide (LiMO2) based positive electrodes for Li ion batteries by smart selection of the electrochemical charge conditions. J. Power Sources 2017, 359, 458–467. [Google Scholar] [CrossRef]
  77. Sotta, D. MAT4BAT Advanced Materials for Batteries Project; EU Commision: Brussles, Belgium, 2017; Available online: https://cordis.europa.eu/project/rcn/109052/reporting/en (accessed on 20 July 2019).
  78. Schmalstieg, J.; Käbitz, S.; Ecker, M.; Sauer, D.U. A holistic aging model for Li(NiMnCo)O2 based 18650 lithium-ion batteries. J. Power Sources 2014, 257, 325–334. [Google Scholar] [CrossRef]
  79. National Grid ESO. 2019 Four Year Ahead Capacity Auction (T-4) Delivery Year 2023/24; National Grid: London, UK, 2020; Available online: https://www.emrdeliverybody.com/CM/Auction-Results-1.aspx (accessed on 6 May 2020).
  80. National Grid. Transitional Capacity Market Auction for 2016/17; National Grid: London, UK, 2016; Available online: https://www.emrdeliverybody.com/CM/Auction-Results-1.aspx (accessed on 30 April 2020).
  81. National Grid. T-1 Capacity Market Auction for 2018/19; National Grid: London, UK, 2018; Available online: https://www.emrdeliverybody.com/CM/Auction-Results-1.aspx (accessed on 30 April 2020).
  82. Philippot, M.; Alvarez, G.; Ayerbe, E.; Van Mierlo, J.; Messagie, M. Eco-Efficiency of a Lithium-Ion Battery for Electric Vehicles: Influence of Manufacturing Country and Commodity Prices on GHG Emissions and Costs. Batteries 2019, 5, 23. [Google Scholar] [CrossRef] [Green Version]
  83. Li, J.; Cheng, Y.; Ai, L.; Jia, M.; Du, S.; Yin, B.; Woo, S.; Zhang, H. 3D simulation on the internal distributed properties of lithium-ion battery with planar tabbed configuration. J. Power Sources 2015, 293, 993–1005. [Google Scholar] [CrossRef]
  84. Tanim, T.R.; Rahn, C.D.; Wang, C.Y. A Temperature Dependent, Single Particle, Lithium Ion Cell Model Including Electrolyte Diffusion. J. Dyn. Syst. Meas. Control 2014, 137. [Google Scholar] [CrossRef]
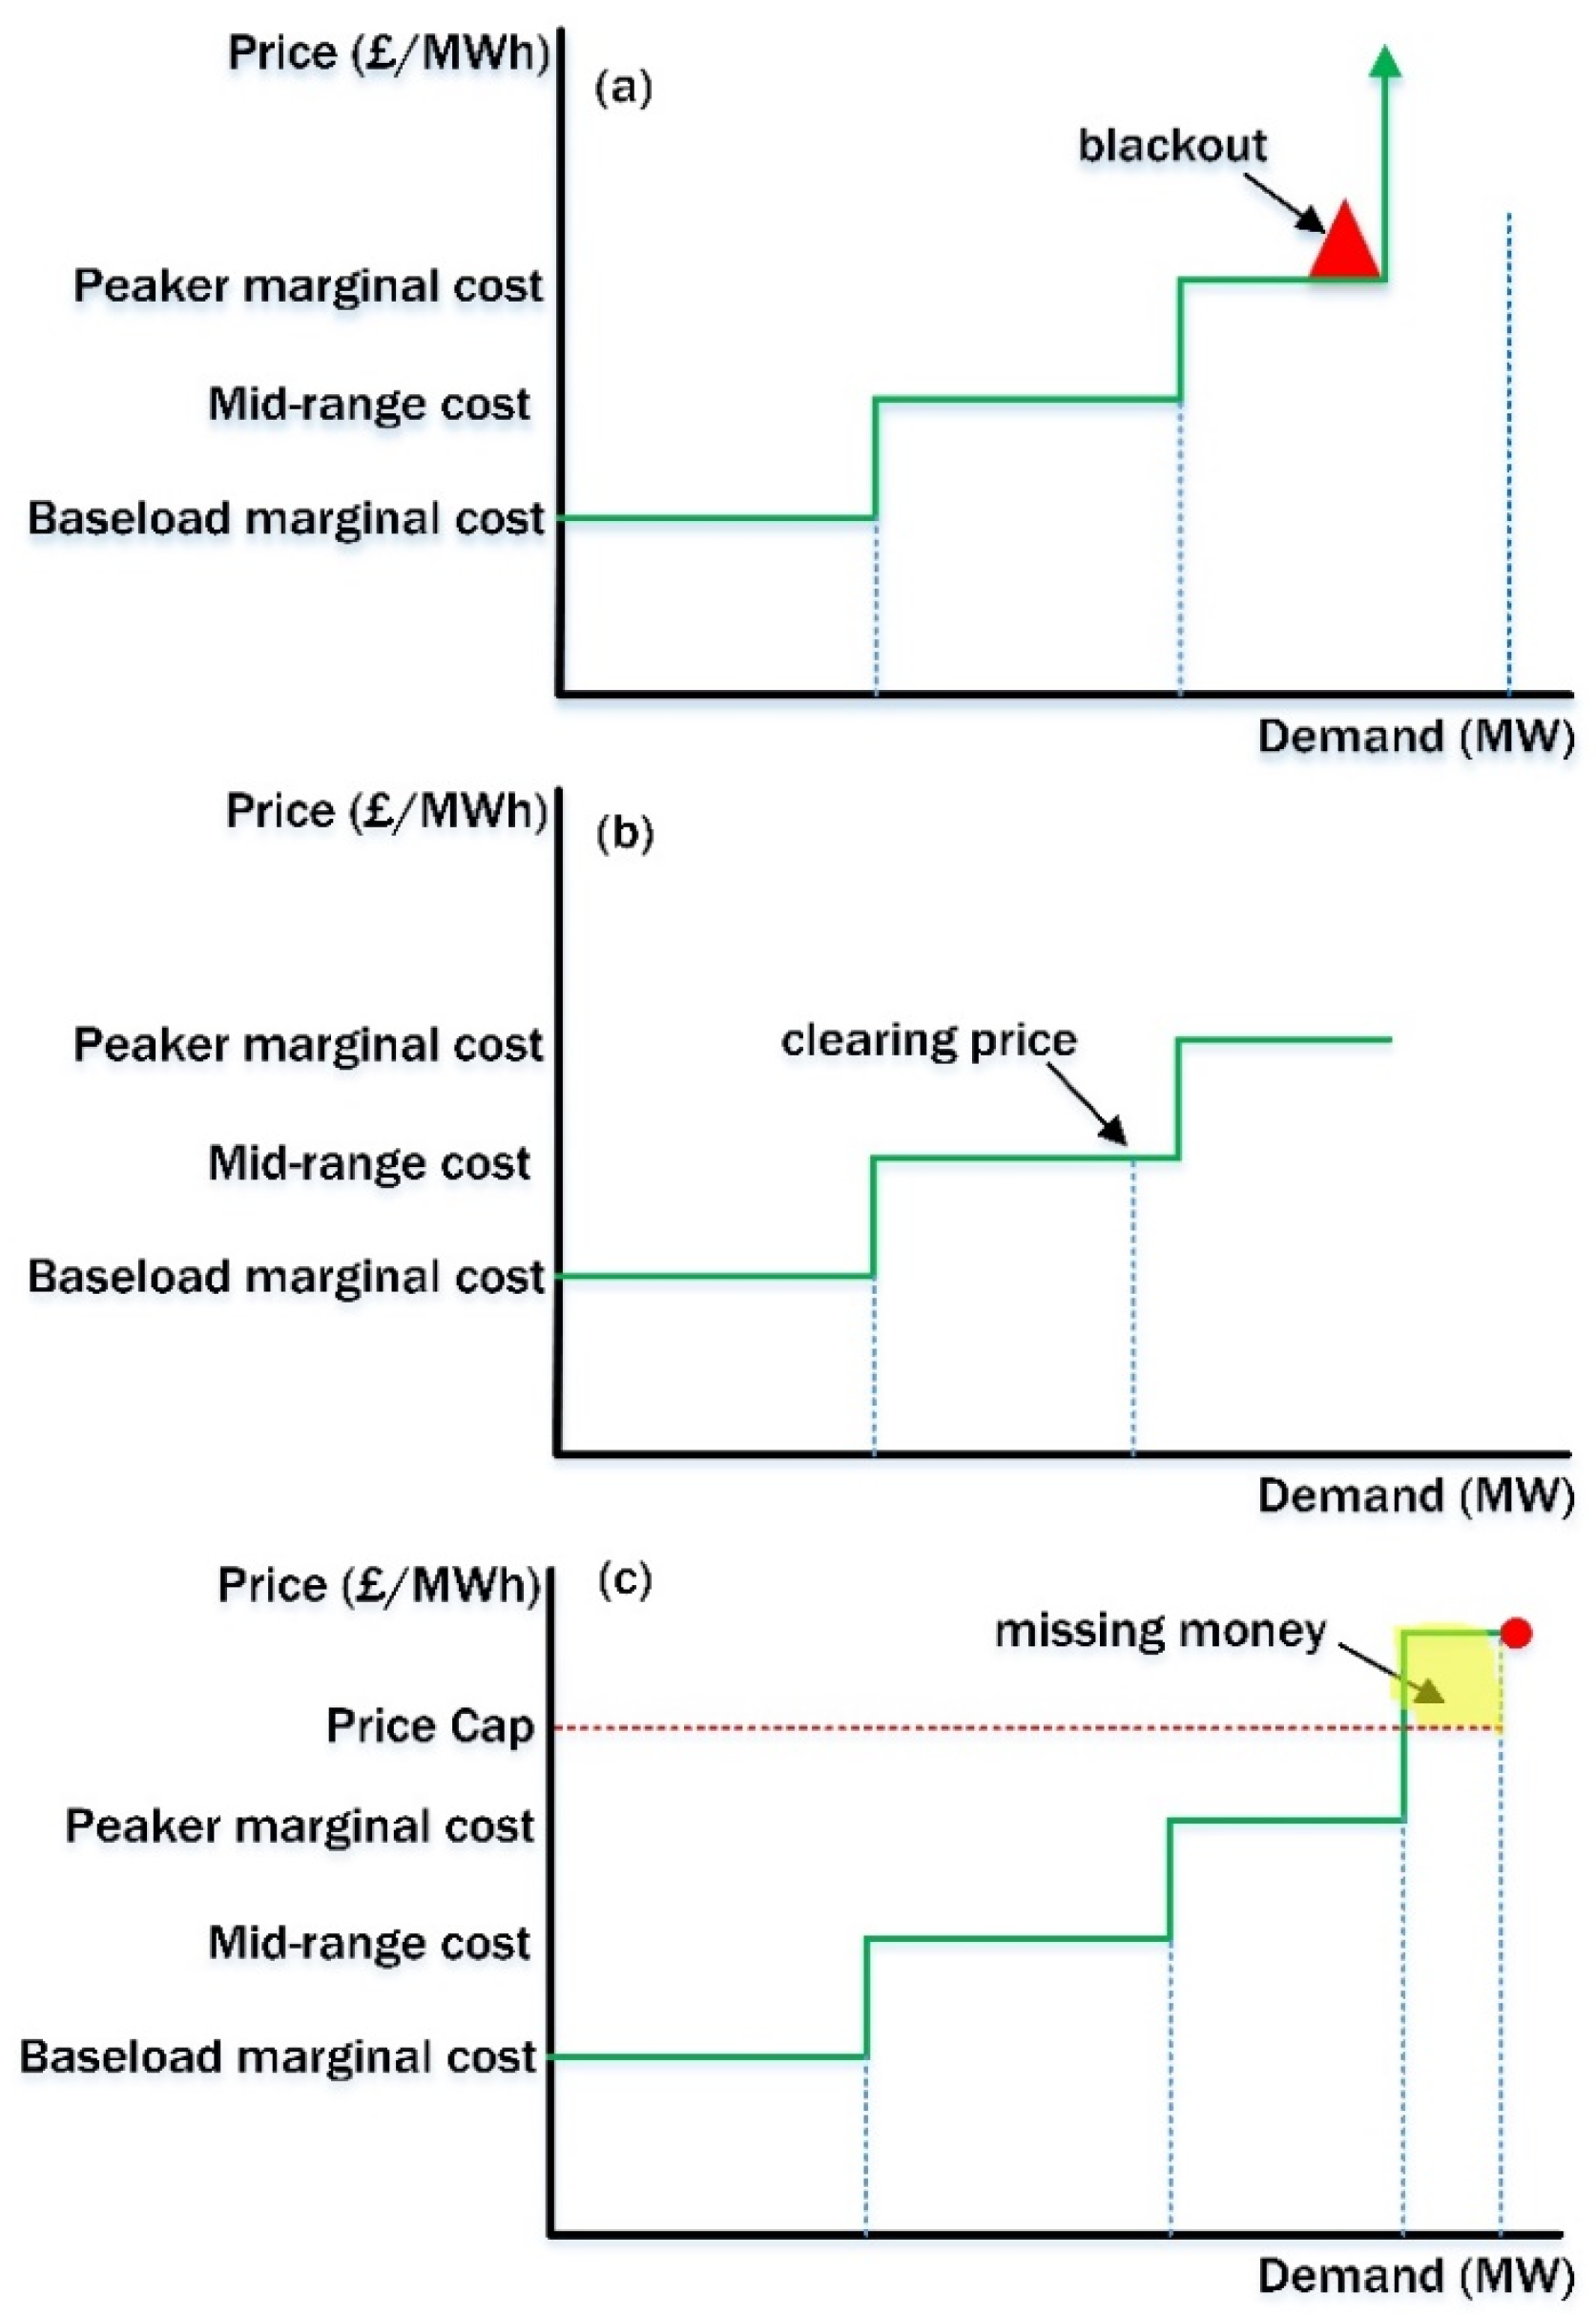
Figure 1. Energy price and demand for different generators during: (a) blackout; (b) normal operation; (c) period of scarcity.
Energies 13 02816 g001
Figure 2. De-rated batteries in the UK capacity market for the period ranging from 2018 to 2022 [55].
Energies 13 02816 g002
Figure 3. Revenue and degradation cost flow chart process in the capacity market.
Energies 13 02816 g003
Figure 4. Battery cycling profile according to the number of expected shortage events in the capacity market.
Energies 13 02816 g004
Figure 5. Battery model results (lines) with experimental data (markers) during discharge based on [72] (a): for different discharge-rates and T = 15 °C; (b) for different temperatures at 1 discharge rate.
Energies 13 02816 g005
Figure 6. Battery degradation model results (lines) with their experimental data (markers) (a): calendar aging results with different temperatures and states of charge with experimental data taken from [77]; (b) cycle aging results with different depth of discharge ranges and C-rates at T = 35 °C with experimental data taken from [78], except for the 1C result at 5 °C (90–10) taken from [77]; (c) detailed version of 1C (100–0) degradation based on the physics-based degradation model mechanisms.
Energies 13 02816 g006
Figure 7. Revenue and degradation costs for four de-rated batteries (0.5 h–4 h) for a one-year capacity market contract with different charge states and T = 25 °C.
Energies 13 02816 g007
Figure 8. Revenue and degradation costs for four de-rated batteries (0.5 h–4 h) for a one-year capacity market contract at different temperatures and at 100% state of charge.
Energies 13 02816 g008
Figure 9. Profitability of the four de-rated batteries over 1 year when λ c l = £ 27.5 / kW / year .
Energies 13 02816 g009
Figure 10. Profitability of the four de-rated batteries over 1 year when λ c l = £ 6 / kW / year .
Energies 13 02816 g010
Figure 11. Profitability of the four de-rated batteries over 1 year when λ d e g r = $ 100 / kWh .
Energies 13 02816 g011
Figure 12. Profitability of the four de-rated batteries over 1 year with changes to the de-rating factors.
Energies 13 02816 g012
Figure 13. Profitability of the four de-rated batteries over 1 year with an increase in shortage events.
Energies 13 02816 g013
Table 1. The battery capacity and the de-rating factors used in this study.
Battery Energy Capacity (MWh)Generated Power
(MW)
De-Rating
(h)
220.5
221
212
20.54
Table 2. Calendar and cycle degradation model accuracy comparisons for different temperatures.
TemperaturesDegradation Model Type
EmpiricalSemiempiricalPhysics
CalendarCycleCalendarCycleCalendarCycle
Low temperatures
(5 °C onwards)
AUOAAA
Medium temperatures
(25 °C onwards)
AAAAAA
High temperatures
(45 °C onwards)
AEAAAA
A: accurate; U: underestimate degradation; O: overestimate degradation; E: extrapolation by Arrhenius equation.
Table 3. Profit at the end of a 1-year capacity market contract fora battery with a de-rating factor of 1 h when using several degradation models.
TemperaturesProfit in (£) When Degradation Cost is Calculated Using the Below Models
EmpiricalSemiempiricalPhysics
5 °C18,862−16,96231,608
25 °C471612,40916,417
45 °C−52,580−22,054−56,284