Article

Energy and Environmental Analysis of Single-Family Houses Located in Poland

1
Faculty of Civil Engineering, Silesian University of Technology, Akademicka 5, 44-100 Gliwice, Poland
2
Faculty of Energy and Environmental Engineering, Silesian University of Technology, Konarskiego 20, 44-100 Gliwice, Poland
3
Faculty of Architecture, Silesian University of Technology, Akademicka 7, 44-100 Gliwice, Poland
4
Swiss Federal Laboratories for Materials Science and Technology Empa, Laboratory for Biomimetic Membranes and Textiles, Lerchenfeldstrasse 5, 9014 St. Gallen, Switzerland
*
Author to whom correspondence should be addressed.
Energies 2020, 13(11), 2740; https://doi.org/10.3390/en13112740
Submission received: 28 April 2020 / Revised: 25 May 2020 / Accepted: 26 May 2020 / Published: 29 May 2020

Abstract

:
This paper presents a comparative analysis of the carbon footprint, energy demand and life cycle costs of a model of a building located in the Central Europe climate zone. One specific example—the quantitative differences in global warming potential, life cycle costs and thermal comfort—has been shown, depending on the different construction (wood, brick) and heat sources used; traditional and energy-saving solutions have been considered. The research was carried out using the EnergyPlus simulation program for a multi-zone model of a naturally ventilated single-family house. Calculations were made for a 25-year life cycle using the standard climate data for Warsaw (Poland). The real occupancy schedule of the individual rooms was adopted and the instantaneous ventilation airflow was modeled, and its intensification due to the additional opening of windows was optimized. An estimated budget of the entire structure of the building and the heat sources was used for the cost analysis. The research has succeeded in developing some general conclusions and guidelines and recommendations for both the investors and designers of energy-saving and environmentally friendly houses. Considering the most economical an ecological solution, wooden houses are better than brick houses. In the wooden building, however, there are a larger number of thermal discomfort hours.

Graphical Abstract

1. Introduction

One of the key objectives in current global climate and energy policy is reducing the emission of greenhouse gases. Households consume energy and this is a major factor in CO2 emissions. Reducing energy consumption has a beneficial effect on both the operating costs of a building as well as the environment. The building materials used in the construction of a house are also an important factor. The materials with the smallest impact on the environment in all phases of the life cycle should be used. Some investors choose to improve the insulation of external partitions beyond the minimum requirements; this results in a reduction in heat consumption over the life cycle, i.e., reducing the building’s operating costs. However, any energy saving actions must not affect the quality of the indoor environment. Well-insulated buildings are less able to exchange heat with the outside environment, which in summer can significantly reduce the thermal comfort of the inhabitants. The building becomes a kind of “thermos” and without additional cooling system it is not possible to remove the additional internal heat. This issue is especially important in an age of warming climates; therefore, the aim of this research is to assess which of the popular types of building construction in Central Europe has the smallest impact on the natural environment in terms of carbon dioxide emissions, generates the lowest life cycle costs of the building, and allows the minimum requirements for thermal comfort in buildings with natural ventilation to be met. The goal is to also calculate the detailed costs of such a construction and correlate the costs incurred by the investor with the environmental costs.

2. Background on Building Energy Modeling and Life Cycle Assessment

2.1. Life Cycle Assesment

EU countries are set to implement the provisions of the Paris Agreement (signed in 2015), which set individual targets for each country to reduce CO2 emissions in sectors of the economy such as transport or construction. This is why it is so important for newly designed buildings to be analyzed in terms of their environmental impact—the Life Cycle Assessment (LCA). The main principles, requirements and framework for life cycle assessment are described in two standards: ISO14040:2006 [1] and ISO14044:2006 [2]. From the point of view of the LCA, buildings are products; therefore environmental analysis is carried out for entire facilities. As a result, all of the individual products and processes are analyzed, which in turn allows the environmental impact of the building to be obtained; such research is carried out all over the world. Gustavsson et al. [3] analyzed an 8-storey building, made using wood-based technology. They primarily studied the primary energy consumption and carbon dioxide emissions at all stages of the life cycle of the building, including heating variants. Another example is the research of Blengini et al. [4], the purpose of which was to determine the carbon footprint and energy life cycle for traditional single-family, low-energy houses in Italy. Studies have shown that, in a traditional building, the greatest environmental impacts occur during the building’s operation (i.e., primarily heating), and in a low-energy building the impacts have been reduced fourfold by equalizing the environmental impact at all stages of the building’s life cycle. Research into LCA has also been carried out in Poland; Borkowski [5] studied the LCA for three single-family houses. This study confirmed that the building’s operation phase has the greatest environmental impact. Lewandowska et al. [6] focused on a very detailed LCA, in which two model houses for a four person family were studied with a usable area of 98 m2; one was constructed using brick technology, the other in wood. The houses were also designed in two variants—conventional and passive. Analysis of the results that were obtained from the LCA showed that the passive brick house was the worst option. The thermal comfort and life cycle costs were not taken into account in this analysis.

2.2. Life Cycle Costs

In the construction industry, most financing decisions are based on the initial investment costs. When considering different alternative versions of a building design, not only should the initial cost of a given version be considered, but so should the subsequent operating costs. A life cycle cost (LCC) analysis can be used to assess the long-term cost effectiveness of an investment. An analysis of a building’s life cycle costs allows the total cost incurred by the investor during the entire life of the building to be determined—its construction, operation and demolition. This analysis also allows the financial benefits resulting from the use of alternative energy sources to be estimated [7]. The total economic cost of the project can be assessed by analyzing the initial costs and discounting any future expenses [8].
The LCC is a very popular parameter that can be used as an objective function in optimizing buildings and their systems [9,10,11,12,13,14,15,16,17,18,19]; many studies have analyzed the optimal building envelope. Different variants of the thickness of the insulation of the external walls, roofs, floors and various windows have been adopted as decision variables. Pala et al. [17] carried out an optimization on an example of a tenement house in Finland with three construction alternatives (i.e., reinforced concrete, wood and steel). Braulio-Gonzalo et al. [12] selected eleven alternative insulation materials, both conventional and those produced using natural products, to optimize a single-family home in Spain. An article in the literature [14] has described the life cycle cost for typical Australian homes. It describes how various roofing materials and floor designs affect the environment at different stages during the life of buildings (i.e., construction, operation, maintenance and final disposal). In turn, the Udawatth and Halwatura study [19] focused on the LCC calculation of wall materials (brick, cement blocks and concrete blocks) that were used to build inexpensive homes in Sri Lanka. Jaber and Ajib [15] presented an assessment of the building angle, window size and insulation thickness from an economical, energy and environmental point of view for a typical residential building located in a Mediterranean climate.
More comprehensive LCC analyses have also included optimization of heating, ventilation and air conditioning systems, as well as heat sources in the building. Bichiou and Krarti [20] developed and presented a comprehensive energy simulation environment to determine the optimal envelope for a single-family house and its heating and air conditioning systems, as well as how they work in five climatic conditions. Based on the analysis of life cycle costs, Kaynakli [16] determined the optimal insulation thickness for various types of fuel used in the heat source.
Many studies investigated energy-efficient, passive or nearly zero-energy buildings (nZEB) and buildings using renewable energy sources [21,22,23,24,25,26,27]. Audenard et al. [21] conducted an economic analysis of a passive house and compared it with a standard house. The researchers estimated that the cost of a passive house is equal to the cost of a standard house after 29 years if energy costs remain constant and after 18 years if the cost of electricity increases by 5%. Marszal and Heiselberg [26] analyzed the 30-year LCC of a multi-storey zero-energy residential building in Denmark and concluded that investing in a heat pump is more profitable than using a district heating system.

2.3. Thermal Comfort

According to ASHRAE standards [28] thermal comfort it is “condition of mind that expresses satisfaction with the thermal environment and is assessed by subjective evaluation”. Thermal comfort is sensed differently by every person in a room. It is important to model thermal comfort at the design stage of the building in order to predict the indoor climate conditions that will occur during the period of operation of the building [8]. Several thermal comfort models have been described in the literature, but Fanger’s model and the adaptive model are among the best known. Fanger’s model predicts the average thermal sensation and the dissatisfaction of a large group of people when exposed to thermal conditions [29]. This model has been adopted by the ISO7730: 2005 [30], ASHRAE 55 [28] and EN15251:2007 [31] standards, which are commonly used by engineers to determine and design the thermal environment in buildings [32]. Many studies have demonstrated the role of Fanger’s model, but it has also been proven that it does not work well in naturally ventilated buildings [33,34]. Therefore, an adaptive model was developed to expand this method for use in buildings with natural ventilation. The adaptive thermal model incorporates the assumption that people are able to adapt to changing conditions in the indoor environment through the use of various adaptation opportunities [35]; the model can be found in the EN15251:2007 [31] and ASHRAE 55 [28] standards. The adaptive method differs from Fanger’s model, as it is not based on the prediction of people’s sensations but on the range of the operative indoor temperature that is indicated. The model defines three comfort categories: I (90% acceptability), II (80% acceptability), III (65% acceptability); category II is assumed to be the acceptability limit of indoor conditions.
Over the past few years, many important studies have investigated the energy efficiency of a building, in particular paying attention to indoor thermal comfort [24,36,37,38,39,40,41,42,43,44,45,46,47,48,49,50]. Many researchers have conducted simulations that were coupled with optimization methods. For example, the design and operation of a “cheap” apartment were numerically optimized using a simulation-based approach in the literature [47]. In the case of naturally ventilated and air-conditioned buildings, three objective functions were used: the construction cost, thermal comfort and the 50-year operation cost. Thermal conditions were controlled and evaluated using two comfort models: Fanger’s model and the adaptive model, depending on the proposed HVAC system. In the paper by Harkouss et al. [24] a comprehensive study has been presented on the optimal passive design of residential buildings; the adaptive thermal comfort of occupants was improved by using appropriate passive cooling strategies, such as blinds and natural ventilation. The aim of the study by Oliveira et al. [48] was to present a methodology for optimizing building construction solutions and ventilation and air conditioning systems in lightweight buildings in order to ensure thermal comfort and reduce energy consumption. Sarkar et al. [49] showed that the high thermal mass of multilayer walls and roofs produce good results in terms of indoor thermal comfort (the adaptive model), both in summer and winter for buildings located in a composite climate.

2.4. Research Gap and the Aim of this Research

The presented review of the relevant literature has demonstrated the immense interest of researchers in the subject taken in this study; the vast majority of the articles in the bibliography are however papers where the LCA only concerned building fragments. Most often these are external partitions, which have an indisputable impact on the environmental result (they affect the energy consumed for heating). A very large group of studies concerned the Mediterranean climate. The vast majority of the authors analyzed air-conditioned buildings; these are rare in the Central European climate. Such buildings are easier to model because constant ventilation airflow can be assumed; this parameter is difficult to model in buildings with natural ventilation. In many of the studies, the authors assumed a constant minimum required airflow defined by an appropriate standard, which definitely affects the results of the calculated heat demand in naturally ventilated buildings [51,52]; there have been few studies on this subject in Poland. The already published research of the authors of this article attempted to fill this gap in the knowledge, including single-criteria optimization of windows [53] and multi-criteria optimization of thermal insulation and the type of windows, taking into account thermal comfort and the LCC [52]. Interesting results were obtained in the above research and the emergence of interesting new scientific threads has provided inspiration to continue researching this field.
In non-air-conditioned buildings with natural ventilation, the building envelope affects both the outdoor environment and the investment and operating costs, as well as the indoor environment; this is why all three of these issues were analyzed in this study. The main aim of the article was a comparative analysis of the greenhouse gas (GHG) emissions, the investment and operating costs and the thermal comfort of a single-family house model constructed using various construction technologies. The specific example that has been used has shown the quantitative differences in global warming potential (GWP), life cycle costs (LCC analysis) and the number of thermal discomfort hours, depending on the building technology used (wood, brick) as well as the heat sources. Traditional and energy-saving solutions have also been considered. The tests were carried out using a multi-zone building model; a real occupancy schedule of the individual rooms was adopted. The instantaneous ventilation airflow has also been modeled, and its intensification due to the additional opening of windows has been optimized. For the LCC analysis, a detailed estimated budget of the entire building’s structure and its heat sources has been prepared.
There is a lack of extensive and detailed research such as this in Poland; direct translation of results from neighboring countries can lead to erroneous conclusions, especially in the field of environmental impact. Poland is a developing country where both the electricity and energy for heating mainly come from coal. Therefore, certain commonly known ecological solutions based on the use of electricity may not be applicable in Poland. The analyses and results that have been presented here can be useful for most Central and Eastern European countries.

3. Methods

3.1. Research Object

The analyses in this article were carried out for a single-family house with a heating area of 150 m2. In studies on both the GWP and LCC in the Polish climate, buildings with gable roofs are most often described [6,54]; this is why a flat-roofed building was adopted in the study. The model was of a simple and compact two-storey house, without a cellar. Currently, there is a mounting decline in the construction of single-family houses with double- or multi-pitched roofs, which were eagerly designed at the end of the last century. In addition to aesthetic reasons, this is also associated with the building’s shape factor, which largely determines the heat loss through the external walls.
The house was designed for a 2 + 2 family model with seven rooms on the ground floor and nine rooms the first floor (Figure 1); the building’s shape factor was 0.98 m−1.
The building was designed for two construction variants; the first variant was a brick structure. The reinforced concrete ceiling was mounted on load-bearing walls made of Porotherm hollow blocks which were insulated using polystyrene. The second design variant was a wooden structure (“Canadian house”), in which the ceiling structure consisted of wooden beams and the walls were made of wooden studs; the walls and ceilings were insulated with mineral wool. Brick and wooden structures are the most common technologies used for single-family buildings in Poland.
The building, using both technologies, was designed in such a way as to meet the current requirements for thermal insulation of external partitions in Polish Standards [55]. In addition, all of the analyses were carried out for the insulation requirements of external partitions for a passive building. Table 1 summarizes the heat transfer coefficients for the external partitions of the analyzed buildings.
The following terms have been adopted throughout this article:
  • BSTD—Brick building that meets standard requirements,
  • BPASS—Brick building that meets the requirements of heat transfer coefficients for passive buildings,
  • WSTD—Wood building that meets standard requirements,
  • WPASS—Wood building that meets the requirements of heat transfer coefficients for passive buildings.

3.2. Thermal Model of the Building

The building model was prepared in the OpenStudio program [56], the calculation engine of which is the EnergyPlus (EP) program. OpenStudio is a set of tools that can be used to support energy modeling of a building. The application includes SketchUp for 3D modeling that allows quick creation of a building’s geometry for use in EnergyPlus. EP is a validated building energy simulation; EP is a well validated building energy simulation tool. It is a package of many modules that allows integrated calculations of the mass and energy transfer inside the building to be carried out, taking into account the heating, cooling and ventilation systems and the control strategy. This is done by simulating the building and the related energy systems in various environmental and operational conditions [57].
The building model consisted of nine thermal zones (some rooms of similar temperature and usage were joined to form one zone). The calculations were made using the standard climate data for Warsaw (typical meteorological data for energy calculations of buildings [58]). The temperatures that characterize this climate have been summarized in Table 2. The energy calculations were carried out using a 15-min time step for a full calendar year. In each zone, assumptions were made regarding occupancy hours, the switch on time of the devices and operation of the lighting. The total heat gains from one person were assumed to be 126 W [28]. The time schedules for the occupants were based on the habits of Polish society and EN16798-1:2019 [59], divided into weekdays and weekends. The lighting was switched on when the lighting intensity in the room dropped below 200–300 lx, depending on the type of room (the lighting power depended on the intensity of the natural light). The heat gains from the devices were adopted according to the ASHRAE standard [60].
Climbing plants (that shed leaves in the winter) were planned for the building’s facade, above the windows in the living room and across the width of the entire building facing south. In the EP model, it was assumed that from April to October the shading factor that resulted from the greenery was 0.4; during the rest of the year it was 0.8. In order to prevent the rooms from overheating, internal window blinds were used. The window shading depended on the intensity of the solar radiation. The blinds were used if the lighting in the room exceeded 200 lx and the indoor temperature was more than 22 °C.
During the heating period, an appropriate temperature was set in each zone depending on its intended use. In most cases it was set at 21 °C, except for the bathroom and the laundry room, which were set at 24 °C; at night the temperature was set at 18 °C. Throughout the entire day the temperature in the utility room was set at 16 °C and the garage was set at 8 °C. An ideal heating model was assumed—the thermal power followed the changes in room temperature (the operating model of the control valves and the system’s response delay were not taken into account). From June to August the heating system was turned off and, because there was no cooling system in the building, the internal temperature resulted from the heat balance of the rooms.

3.3. Thermal Comfort

An important part of this study was determining the thermal comfort in the building. In this study, an adaptive model of thermal comfort was adopted. For each calculation, the number of discomfort hours (Hdis) was determined as the sum of the discomfort hours from all the rooms that were intended for people to permanently reside in (e.g., living room, study room, children’s rooms and bedroom). Thermal comfort was only calculated for the occupied hours in each zone. During the heating season (from September to May), the night hours from midnight to 6 am were excluded from the calculations, during which the temperature was intentionally reduced to 18 °C. The adaptive model of thermal comfort determines the degree of comfort in buildings with natural ventilation, as long as the weighted average outdoor temperature exceeds 10 °C. Therefore, in winter periods, when lower temperatures occur in Poland, this model is not able to determine the thermal comfort in the rooms. During this period, it was assumed that the heating system ensures proper thermal comfort. Hence, for the external climate adopted in the study, the thermal discomfort was mostly indicated in the summer for overheating situations. There were sporadic times in the summer where it was too cold in the rooms.

3.4. Ventilation

The building was naturally ventilated; the infiltration airflow was calculated using the “Infiltration by Effective Leakage Area” method [61]. This method is one of the predefined models in the EP program. The airtightness coefficients for the windows, doors and window inlets were based on the airtightness tests regarding residential buildings in Poland [62,63]. The effective leakage areas of the chimney and roof were established according to ASHRAE [60]. It is common practice for residents in buildings without cooling or mechanical ventilation to open windows in order to improve the indoor environment. In order to model the additional ventilation (opening the windows), a built-in EP model was used, described as “Wind and Stack Open Area”; the main parameter in this model is the window opening area. For the window opening area that was assumed, the airflow changed with the external climate conditions. In real situations, how far the window is opened is decided by the residents. The occupants will open the windows to a greater or lesser degree, depending on the thermal conditions in the room and the external temperature. In the EP program, a model based on the “IF THEN” rule was built to model the process of opening the windows; this was implemented in the EMS part of the EP program.
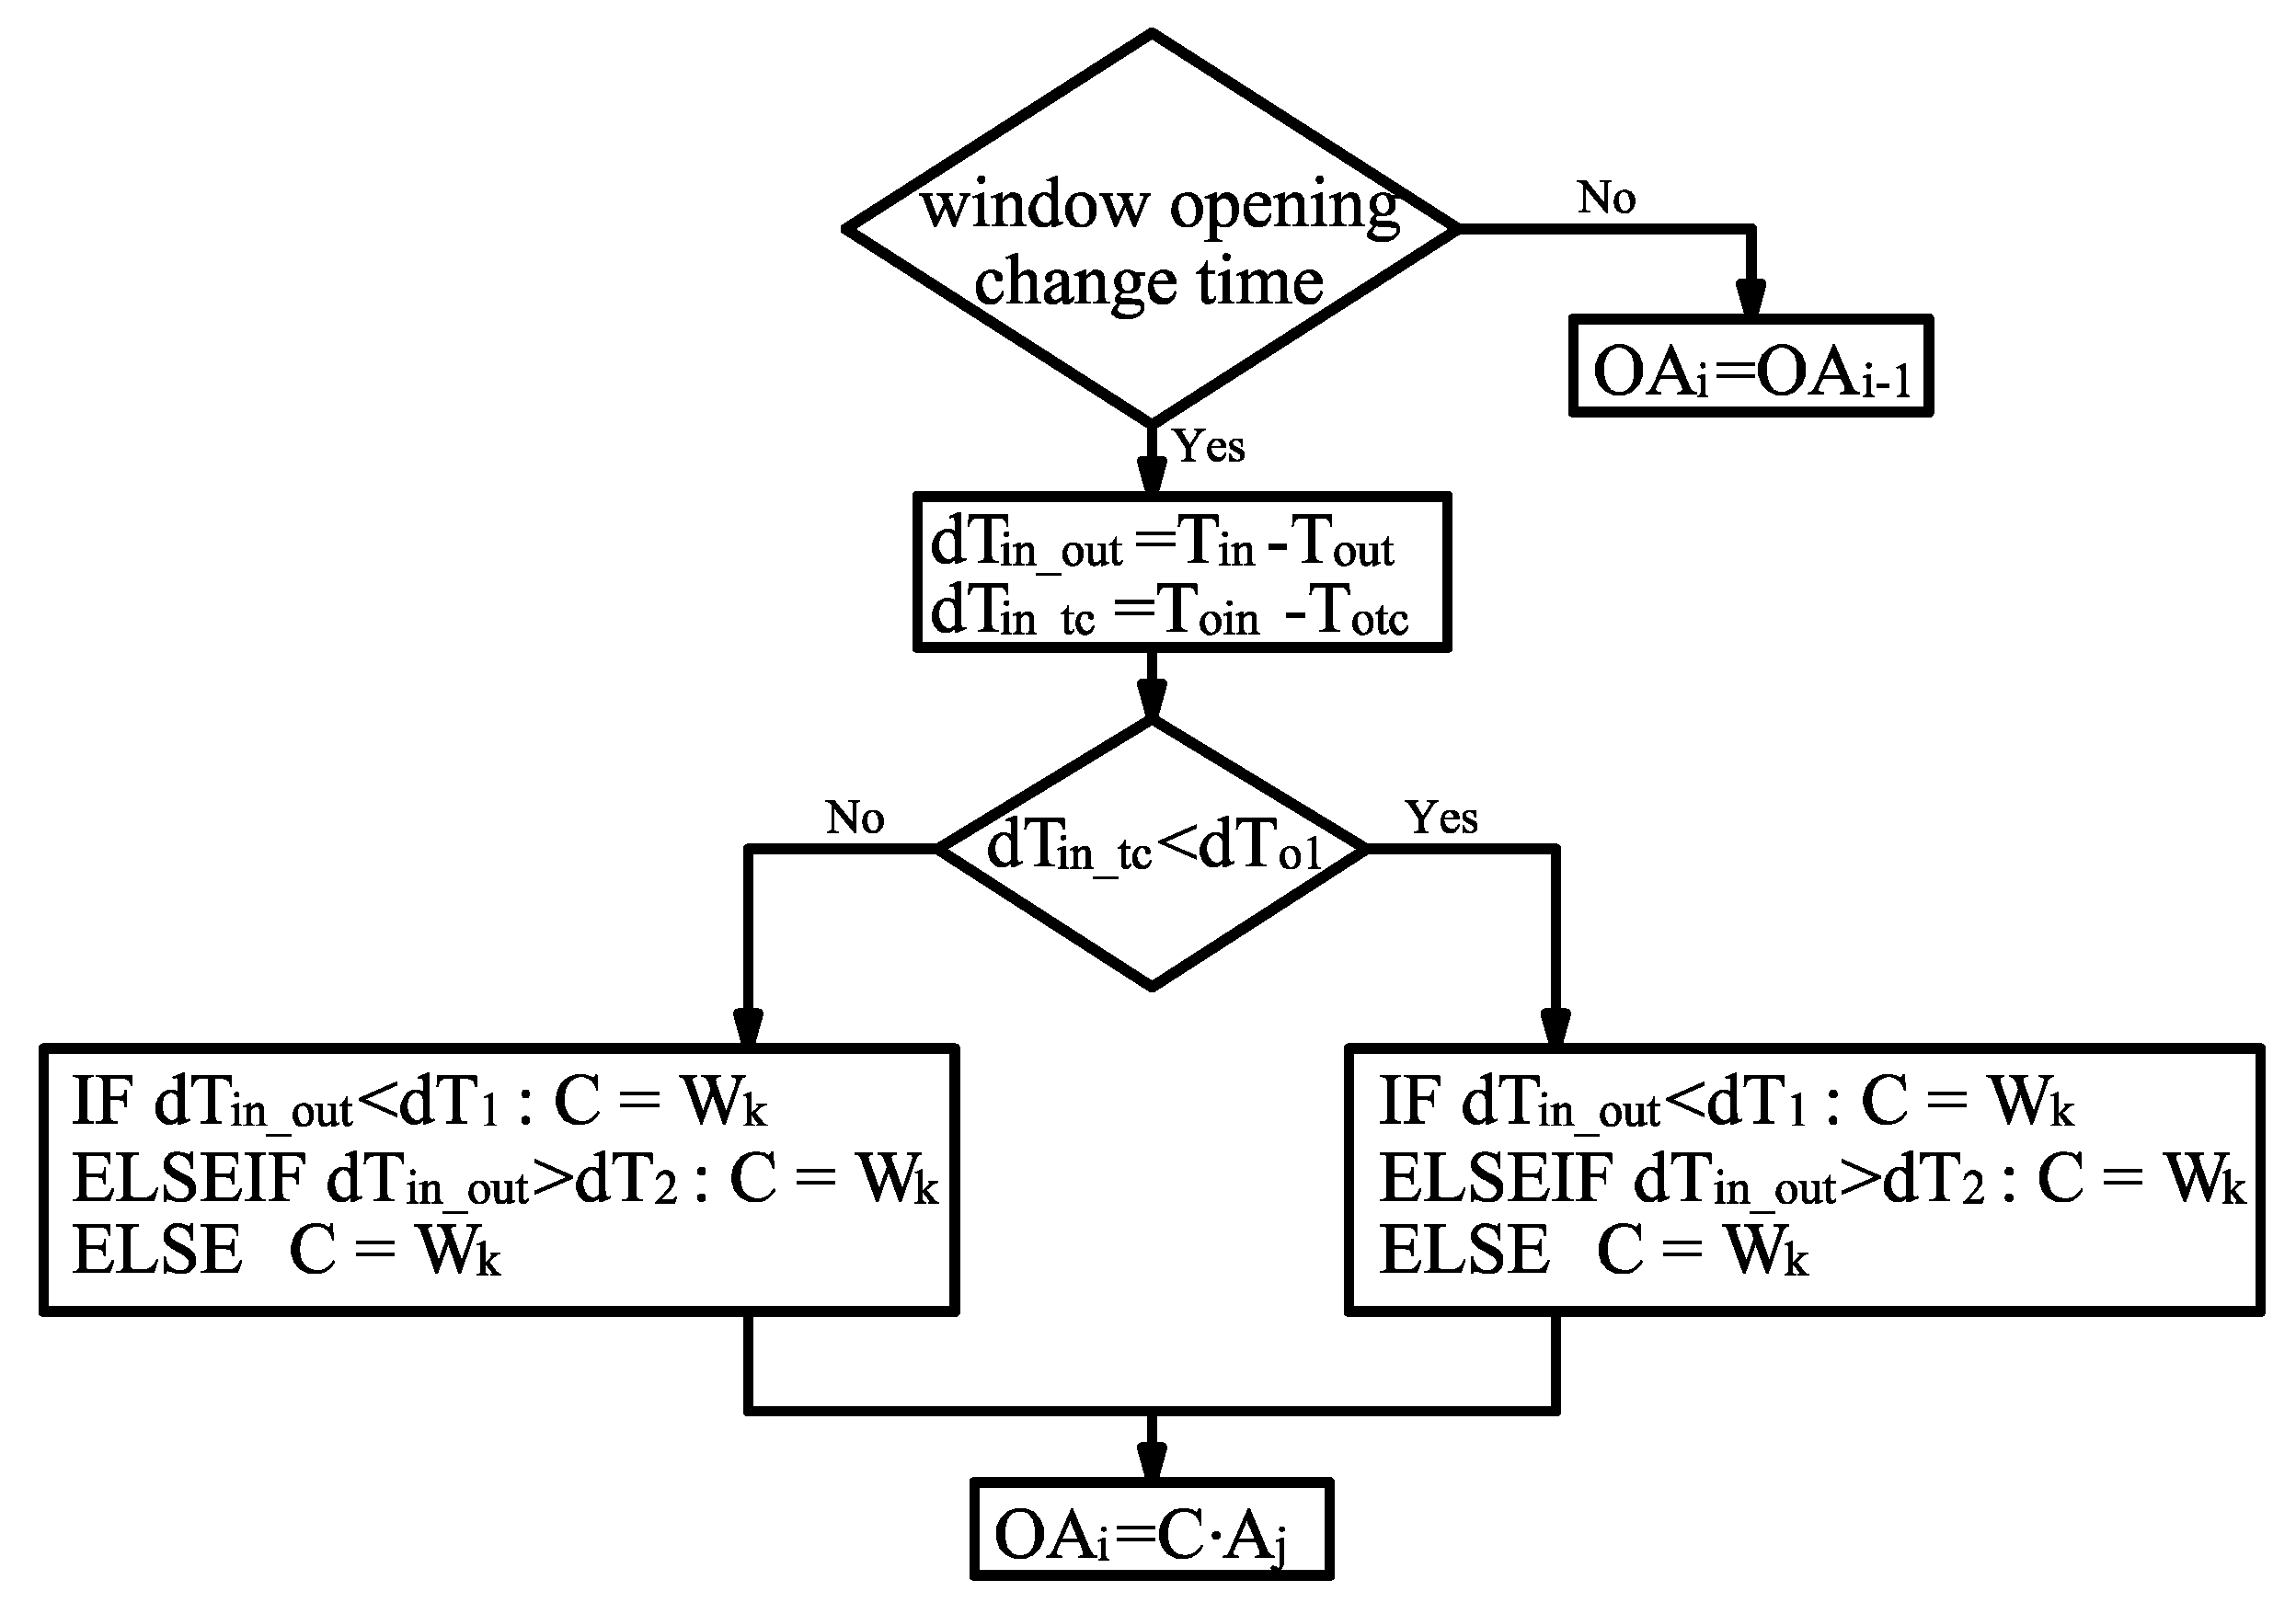
Assumptions for the windows controller (Figure 2):
  • the windows are only opened to lower the temperature of the room, i.e., the outside temperature Tout must be lower than the temperature of the room Tin (dTin_out = Tin−Tout> 0). The degree of window opening will depend on the value of dTin_out. The window will be opened further for small values and less for large ones,
  • the window will be opened if the room has poor thermal comfort (the temperature is too high). The adaptive comfort model based on the EN15251:2007 standard [31] was adopted in this paper. Therefore, the comfort parameter will be the operative comfort temperature (Totc). The difference between the operating room temperature (Toin) and Totc (dTin_tc = Toin−Totc> 0) will indicate if the room temperature is too high in relation to the optimal (comfortable) temperature. For larger dTin_tc values, the window will be opened further than for small values,
  • each window has three areas that can be opened. This will be calculated as the product of a certain coefficient (C, which can take three values (Wk, k = 1,2,3)—which is identical for all of the windows) and the total area of the window Aj (j = 1, …, the number of windows),
  • the window opening area will change at certain times (on weekdays: 6, 8, 15, 18, 22, on weekends: 8, 11, 14, 17, 18, 22). In between the abovementioned hours, the windows will be fixed,
  • the windows will be assumed to be closed if there are no residents in the building,
  • the maximum allowable air change rate ACHmax = 10 h−1.
The operation of the controller was dependent on the parameters; these were: the temperatures (dTo1, dT1, dT2) and the C coefficients (each time they were selected from three possible values Wk).
In fact, as already mentioned above, it is the experience of the residents that affects the degree of window opening for a given weather situation.
For this paper, it was decided to optimize these parameters. Opening the windows should increase the thermal comfort of residents, but this should not be at the expense of increased energy consumption which can occur when the building is overcooled. Therefore, two-criteria optimization was used to optimize the parameters; the following two objective functions were minimized:
  • the total number of thermal discomfort hours (Hdis, h). It was assumed that this will be the number of hours where the thermal comfort is outside the 2nd category of climate in the adaptive model [31],
  • the building’s heat demand (Qheat, kWh).
In order to optimize 12 values (three temperature values, three Wk values and six Wk positions in the controller) a multi-criteria version of the genetic algorithm method was used. The most popular NSGA-II method that is used in engineering applications was selected for the calculations [64]. The MATLAB (R2017a, The MathWorks Inc., Natick, MA, USA) program was used in the calculations, which was combined with the EP program. The objective functions were calculated in EP and the optimization process and the entire exchange of information between both programs were carried out in MATLAB. Due to the fact that the controller was built into the EMS part of the EP “idf” batch file, parallel simulations could be performed for different opening variants of the windows; this significantly accelerated the optimization process. The connection diagram of the optimization and simulation program is shown in Figure 3.
As a result of the multi-criteria optimization, a set of non-dominated solutions (Pareto front) was obtained. From these, the most advantageous configuration was chosen (Multi-Criteria Decision Making—MCDM); this can be done in many ways. In this study, the utopia point criterion was analyzed: the best configuration of this lies closest to the ideal solution (utopia point—solutions for which both functions are minimized); such a result is very often taken into account in technical analyses. The results given later in the article (Hdis, Qheat) have been correlated with this optimal solution.

3.5. The Life Cycle Costs

The calculated annual heat demand has been converted into energy consumption using the annual efficiency of the heating system. Five heat sources were selected for the analysis: a classic solution, which is the most common in Poland—a condensing gas boiler and in addition: either an electric boiler, a coal boiler, a heat pump (air-water) or a biomass (pellet) boiler. Only a change in the heat source without a change in the other elements of heating system was assumed. In the case of a heat pump, it was assumed that the electricity needed to drive the pump was entirely generated by solar photovoltaic panels (PV). Table 3 summarizes the efficiency of the heating systems, the heat source costs and the carbon dioxide emissions in the production of 1 kWh of energy.
The calculation of the cost of the building’s structure was made using the BIMestiMate software (4.1.0, Datacomp, Krakow, Poland) [65]. The minimum labor rate for 2019 was adopted in the cost estimation. The calculation included the closed building’s shell (building with complete load-bearing structure, ceilings, roof, windows and doors, as well as the insulation, partition walls and the internal and external plaster).
The building’s life cycle costs were calculated using Equation (1), according to the methodology described in the literature [51]. The net present value method was used where total economic cost of the building was evaluated by analyzing initial costs and discounting future expenditures such as operational costs for heating over the service life; the calculations were carried out for a period of 25 years. Due to the duration of the analysis, the costs of any renovations were omitted. The research assumed a nominal interest rate of f = 3.9%, according to the mortgage rates in Poland, an inflation rate of i = 2.5%, based on the Polish National Bank’s inflation target for 2020 and an increase in energy prices of e = 2%. The market prices of fuel were used to assess the heating costs as follows: 0.54 PLN/kWh for electricity, 0.16 PLN/kWh for biomass, 0.19 PLN/kWh for gas and 0.12 PLN/kWh for coal (1 PLN = 0.2191 €):
LCC= IC + a(re,N)·EC
where IC—investment costs (building construction costs + heat source costs), a—discount factor which takes into account the effect of inflation (calculated according to the literature [51]), re—the real interest rate, including the effect of the escalating energy price (calculated according to the literature [51]), N—lifespan of the building and EC—the annual energy cost for heating.

3.6. The Global Warming Potential (Greenhause Gases)

The environmental impact calculations were carried out using the One Click LCA (2015) program [66]. This software is fully compliant with the EN 15978:2011 standard [67]. The EN 15978:2011 standard is in line with the ISO 14040/44:2006 standards [1,2]. One Click LCA supports calculations of all life cycle stages from cradle to grave as defined in the EN 15978:2011. The One Click LCA supports all the 24 impact categories listed in the EN 15804:2012 standard [68] based on CML methodology.
This article analyzed only global warming potential, due to the fact that restrictions on this parameter were introduced in the Paris Agreement; it is a relative measure of how much heat a GHG traps in the atmosphere. The GWP is calculated in carbon dioxide equivalents (CO2e) meaning that the greenhouse potential of an emission is given in relation to CO2. The GWP is estimated over a specific time horizon, the selection of which affects the obtained values of carbon dioxide equivalents. In this study (due to the One Click LCA limitations) the GWP was calculated over a 100-year time horizon (GWP100, with AR4 metric in used software). In recent years, the problem of time interval selection for GWP calculations has been widely studied [69], however the GWP100 is the primary and most commonly metric used (e.g., in trading regimes such as under the Kyoto Protocol) to compare the climate impacts of emissions of different greenhouse gases. It is the middle value of the three time horizons (20, 100, and 500 years) providing a balanced representation of the various time horizons for climate response.
In this research, a functional unit was adopted as: erecting a two-storey residential building shell made of two alternative materials, with an area of 154 m2, and energy consumption for heating over a 25-year period for various heating systems. The analyzes have been limited to construction product stage (modules A1–A3 according to the EN 15978:2011 standard) and operational energy use (B6—only the part related to energy consumption for heating). The list of calculated materials is presented in Appendix A (Table A1 for brick building and Table A2 for wood building). The energy demand has been calculated in the EnergyPlus program (see Section 3.2). The specific GWP for 1 kWh of heating energy, depending on the heat source, is presented in Table 3.

4. Results

This research focused on analyzing the differences between the LCC, GWP and Hdis, depending on the building construction and type of heat source used. It was assumed that the building’s finishing elements and the elements of all of the building’s installations (except for the heat source), as well as the electricity for lighting and the domestic hot water consumption were unchanged in all of the analyzed variants, therefore they were omitted in the environmental and cost analyses. The results that have been presented include the building’s structure, heat source and the energy for heating.

4.1. The Global Warming Potential Analysis

4.1.1. Greenhouse Gas Emissions from the Building Structure

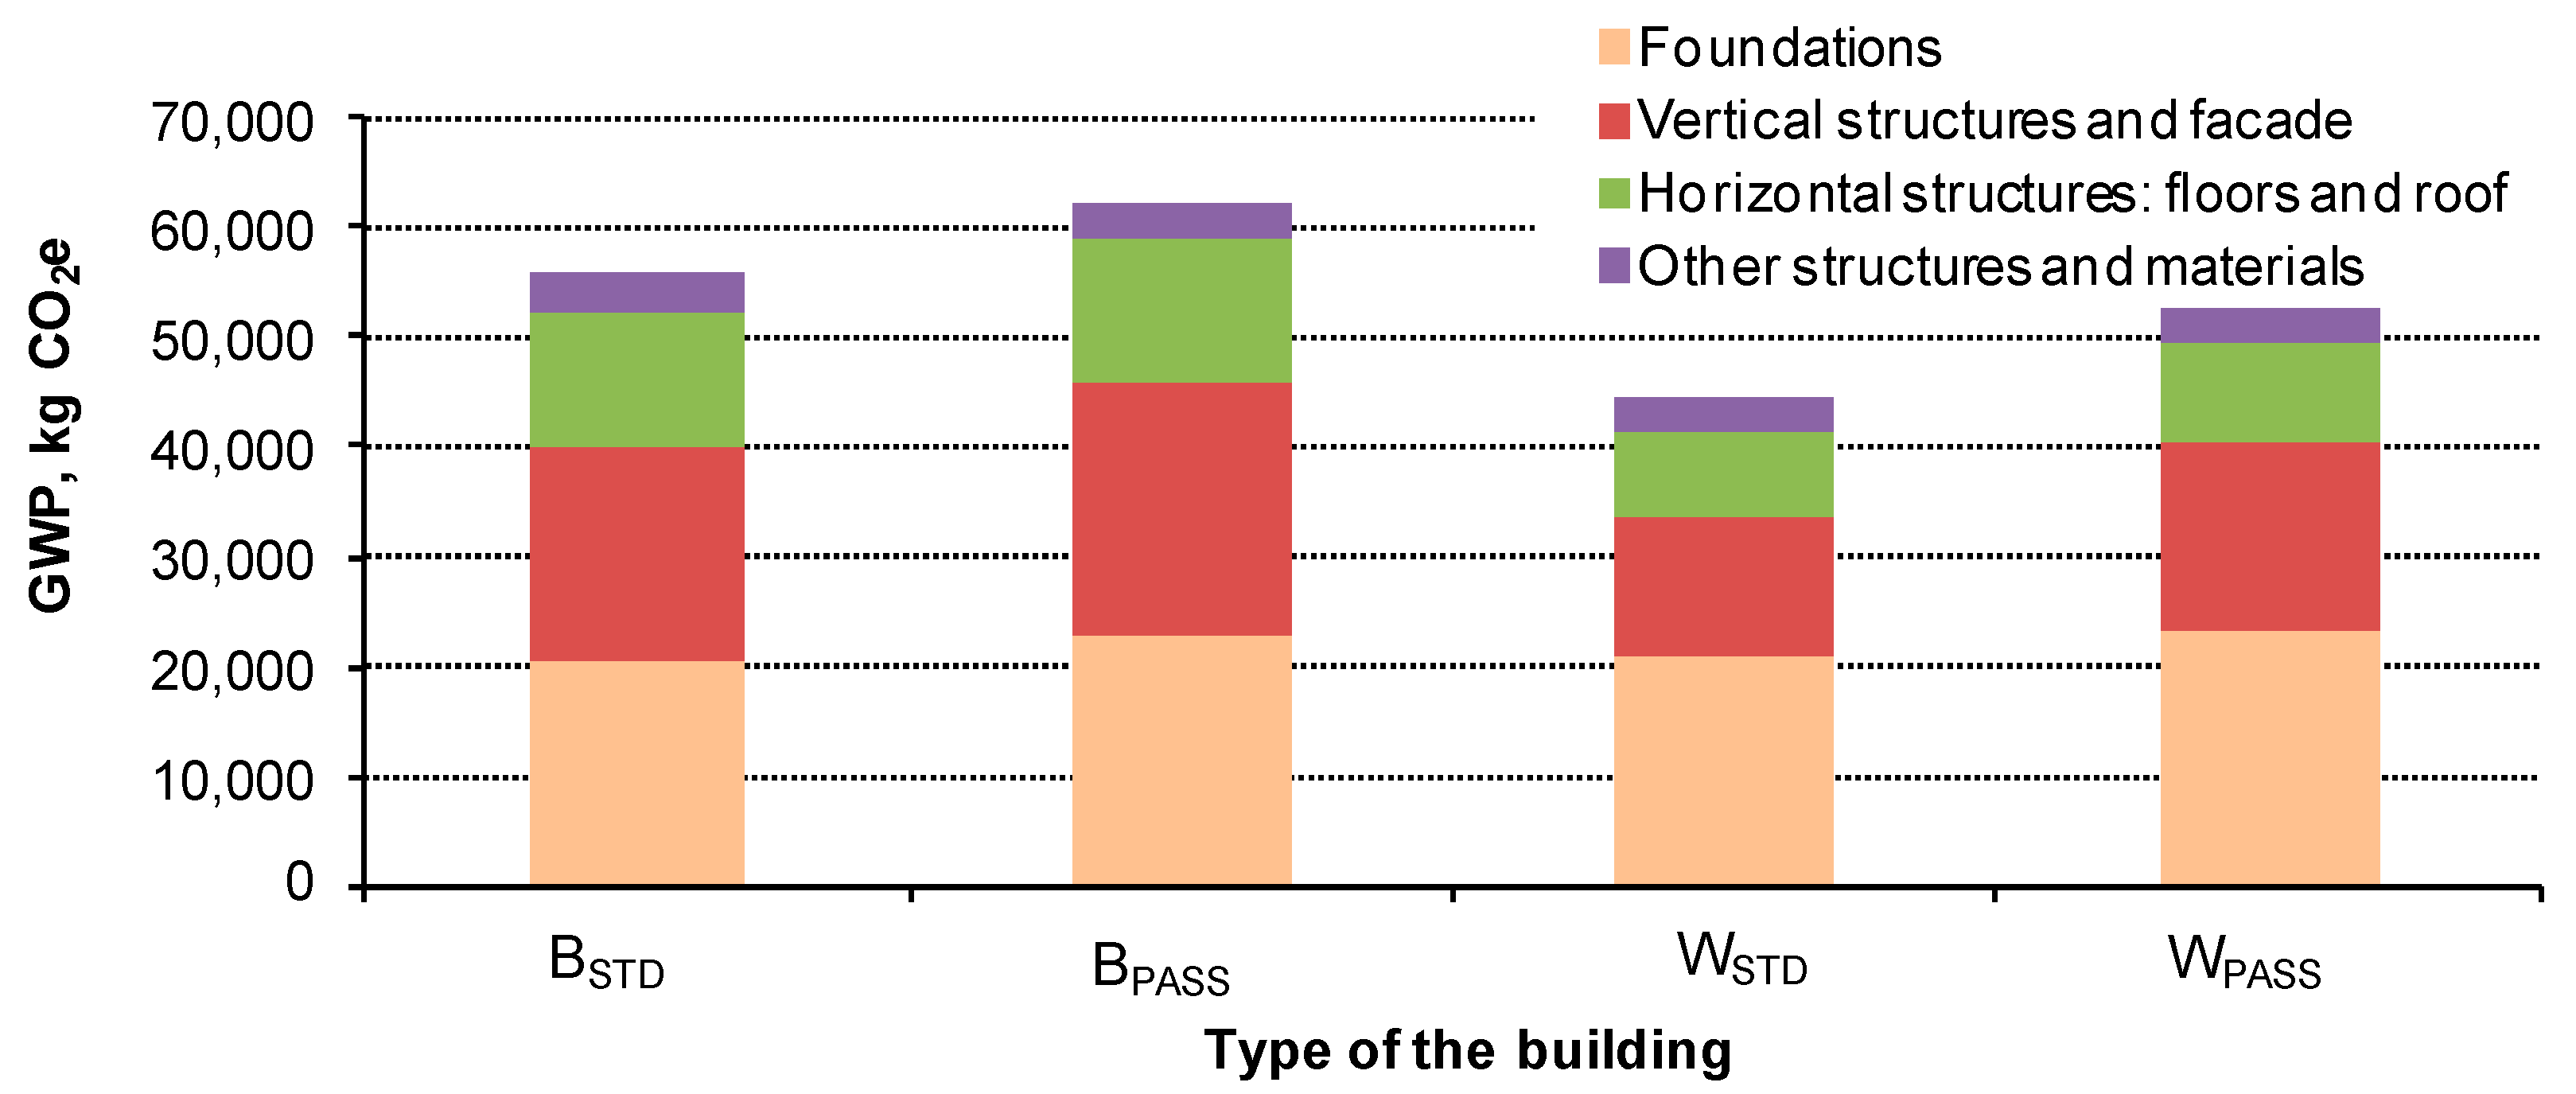
Lower GHG emissions occurred in the case of a wooden house (Figure 4), compared to a brick house. For BSTD and WSTD buildings, this was about 11,400 kgCO2e, which was 20% of the total emissions; for BPASS and WPASS this value was 9600 kgCO2e (16%). This was the result of the use of natural materials in the wooden building, the production of which is associated with lower GHG emissions. The difference only between the external walls of a brick and wooden building is about 2000 kgCO2e.
The analyses have also shown that producing and using thicker insulation material is associated with greater GHG emissions. For a brick house this is 6500 kgCO2e, for a wooden house it is 8100 kgCO2e, which is a 12% and 18% increase, respectively.

4.1.2. Greenhouse Gas Emissions from Heating

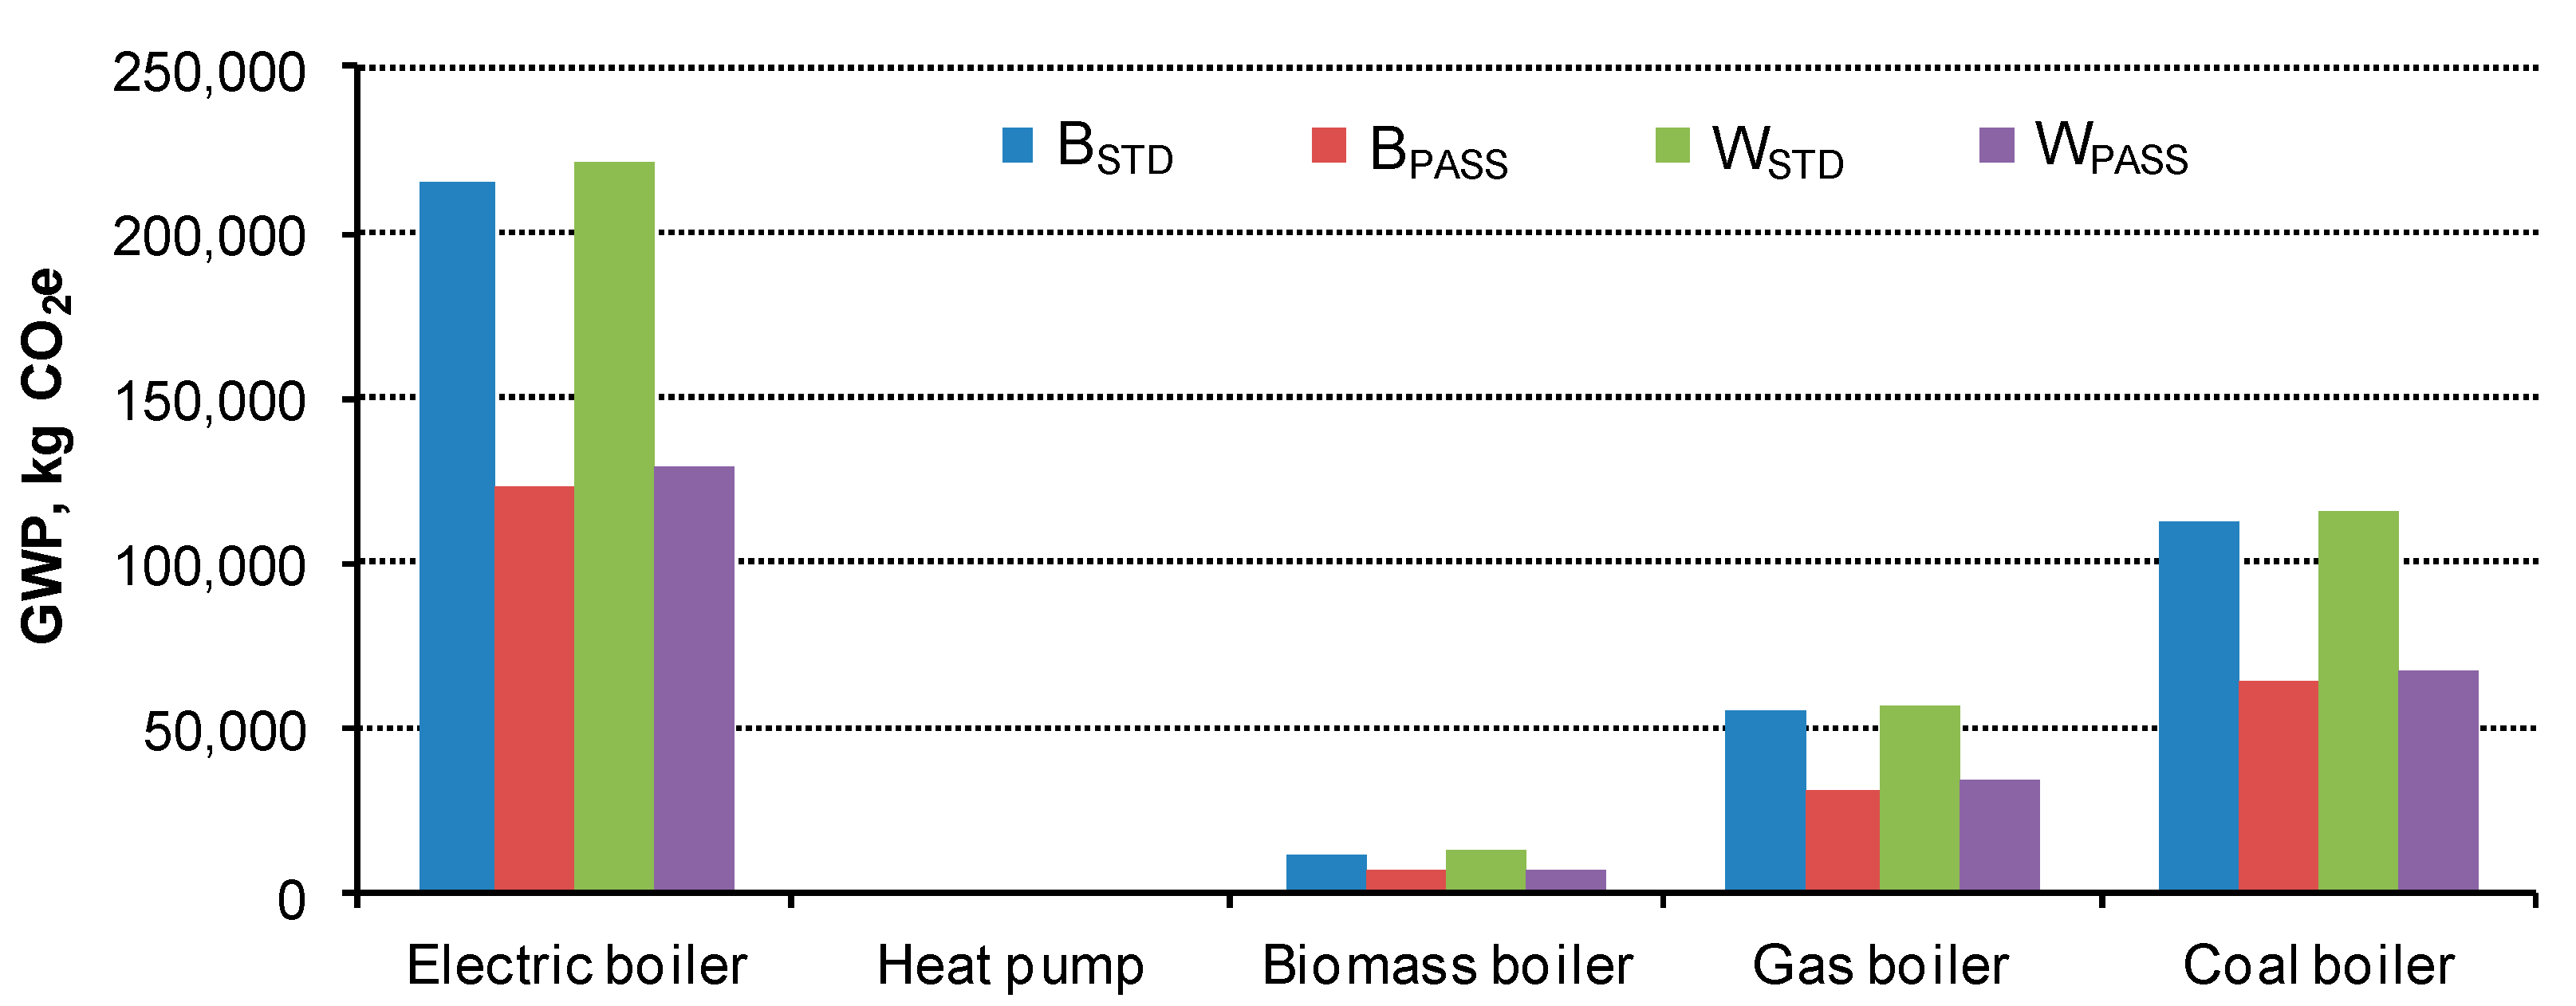
However, the use of additional insulation has some advantages; GHG emissions associated with heating decreased as the requirements for the insulation of external building partitions increased (Figure 5). For all of the heat sources, the emissions in a passive building were over 40% lower than in a standard building.
Analyzing the results obtained, it could be noted that, regardless of the case for each building, the largest GHG emissions occurred when an electric boiler was used. This is due to the fact that most of the electricity produced in Poland is generated as a result of burning coal in power plants; this generates vast amounts of carbon dioxide. When only considering GHG emissions from heating in Poland, paradoxically there is a lower environmental impact from using a coal boiler than an electric boiler. In Poland, the production of 1 kWh of electricity produces about 0.95 kgCO2e; for example in Austria and the Czech Republic these values are 0.28 kgCO2e and 0.59 kgCO2e, respectively [66].
It was assumed in the study that all of the electricity demand required to power the heat pump was produced by the photovoltaic panels. Therefore, during operation, the heat pump emits zero CO2e, which makes it the most environmentally friendly choice in terms of emissions. Even the GHG emissions associated with the production of the PV panels, which in the analyzed cases was 3800 kgCO2e for the B/WSTD buildings and 2700 kgCO2e for the B/WPASS buildings, was almost three times lower than the emissions associated with 25 years of operation of the biomass boiler, which is characterized by relatively low GHG emissions.
As can be seen in Figure 5, the use of a gas boiler in a building is associated with lower GHG emissions, compared to a coal boiler (about twice as much), while compared to a biomass boiler it is almost four times higher.
It should be noted that the emissions created during 25 years of operation of the electric boiler significantly exceeded the GHG emissions associated with the building’s construction. In the case of a standard wooden house, this was up to four times as much (for the WPASS case it was two times as much); in the case of a building with a biomass boiler, the situation was the opposite. The environmental costs of 25 years of operation of this boiler accounted for only 20% and 10% of the construction costs for standard and passive buildings respectively.

4.2. The Life Cycle Costs Analysis

The research has shown that the costs of constructing a house are similar for both of the analyzed technologies. By comparing the buildings designed according to the current standard, it was found that the cost of a wooden house was 23,300 PLN (10%) lower than a brick house; for passive buildings, the difference was 20,600 PLN, which means that a wooden building can be erected for only 8% less. As can be seen, the effect of increasing the thickness of the insulation, which results in a decrease in the heat transfer coefficient of the external partitions, did not have a significant impact on the cost of the entire investment for both technologies; these costs increased by 7.6% and 9.6% respectively for buildings B and W.
Table 4 presents the costs of materials and labor for the considered building cases. It can be seen in the table that the labor costs are approximately 6000 PLN higher for a wooden building. On the other hand, the prices of materials for a wooden building are lower by 28,000 PLN for the standard building and 26,000 PLN for a passive building.
In the case of a brick building, the material costs accounted for about 3/4 of the total cost. The cost of the equipment for each case of this building was about 1% of the total costs. In the case of a wooden building, the material costs accounted for around 70% of the total costs; the equipment costs made up about 1% of the total costs.
The most advantageous solution in terms of the overall (construction + heat source) valuation was a standard wooden house WSTD with a coal boiler. Brick houses generate higher costs compared to wooden houses (Figure 6), with a similar tendency in each variant; this was independent of the heat source. For example, when considering the BSTD and WSTD buildings with an electric boiler, the LCC value was about 5% higher for the BSTD; this was mainly due to the higher construction costs in this case. The largest share of the construction costs in the total LCC was calculated for the BPASS and WPASS buildings. The costs incurred in erecting a BPASS building with a coal or gas boiler accounted for 88% of the total LCC (87% for the WPASS). The higher the requirements for thermal insulation that are imposed on the buildings, the higher the share of the cost of the building’s construction in the LCC. This is due to the higher costs of the materials, but also the reduced operating costs for heating (lower heat demand due to the improvement of the insulation parameters).
Comparing the LCC for buildings with an electric boiler to those with other heat sources, it can be stated that the solution with an electric boiler was the most expensive for a 25-year operating period. For both technologies, the total LCC for buildings using an electric boiler were greater than 310,000 PLN. This is related to the price of electricity for 1 kWh, which remained at a high level in relation to the price for 1 kWh of energy from other sources.
The heat pump is the most expensive investment solution, however, overall (i.e., taking into account the construction and operating costs) it does not cause a significant cost overrun and the LCC value is comparable with cases of buildings with biomass, gas and coal boilers (the differences did not exceed 7%).
The use of a conventional raw material, in this case hard coal, is the most economically viable solution. The cash outlay for the construction and operating range was between 265,000 PLN and 291,000 PLN, depending on the building variant. Comparing the BSTD building with a coal boiler with the same building with other heat sources, the difference in the LCC ranged from 1% for a heat pump, to 2% for a gas boiler, 7% for a biomass boiler, and up to 31% for an electric boiler; large differences such as these are mainly associated with the energy medium. Undeniably, hard coal is the cheapest raw material that is available today in Poland. Coal boilers are also not as expensive as e.g., biomass boilers or heat pumps; there is a very similar relationship for the WSTD building.

4.3. Thermal Comfort Analysis

Table 5 presents the total thermal discomfort hours summarized for all the rooms and from the entire annual period that was considered. The annual heat demand for the building has also been compiled; the methodology for calculating Hdis and Qheat is described in Section 3.4. These values correspond to one of the optimal solutions that could be achieved (utopia point). Figure 7 shows the Pareto Front for a wooden building.
The analysis of the solution where the windows were not opened (the point marked with the blue square in Figure 7) shows that the energy savings in better insulated buildings are paid for by an increase in the number of thermal discomfort hours. By comparing the BSTD and BPASS buildings, it can be seen that a 44% reduction in heat demand was achieved at the expense of a 150% increase in the discomfort hours (43% and 194% in a wooden building for BSTD and BPASS, respectively). This is obviously a theoretical case (hardly anyone has permanently closed windows in a building that uses natural ventilation), however, it shows how significant an impact that taking into account the calculation the additional ventilation has on the results; this is an indispensable element of using buildings with natural ventilation. In further considerations, the solution of the utopia point was then considered (the point marked with a red circle in Figure 7).
For a brick building, it can be seen that a much smaller number of discomfort hours occurred in a building that was constructed according to the standard requirements. In the case of a passive brick building, the number of discomfort hours increased—by as much as 140% compared to the BSTD, while there was a reduction in the heat demand of 43%. In a wooden building, a slightly higher heat demand could be observed compared to a brick building (on average about 200 W). However, compared to a brick building, the number of discomfort hours increased significantly for each variant of the house (Hdis increased by 310 h for WSTD and 359 h for WPASS). The wooden building experienced less heat accumulation and reacted faster to changes in the air temperature that is associated with opening windows. Hence, most likely, in order to obtain better thermal comfort in this building, a much more frequent change of the position of the open window in relation to the brick building would be required. However, this would require the use of mechanical ventilation with a properly programmed controller. Since it was assumed that only buildings with natural ventilation were investigated in this article, such a case was not analyzed.
As the Hdis values only weakly illustrate the scale of the problem, the percentage share of the thermal discomfort hours was calculated in relation to the total occupied hours in the rooms throughout the year and in the June-August period (Table 6). For both the annual and summer periods, the best thermal conditions occurred in the BSTD building. The periods of discomfort mostly occurred in the summer when the building was mainly cooled by ventilation from the windows. While reducing the heat transfer coefficient of the external partitions, and thus providing greater insulation for the building, an increase in the maximum and average temperature in the rooms was observed. This was due to a reduction in the building’s ability to exchange heat with the external environment. The building cools down much more slowly during the night, when the outside air temperature is lower. Therefore, such a building has a much-reduced ability to use ambient cooling. A significant increase in the number of discomfort hours for a passive building was observed in both the annual and summer periods. When a building is very well insulated, it must be noted that it will be difficult to maintain a comfortable temperature in the summer without the use of air conditioning. In this study, on average, for 27% of the time that the BPASS building was used and even 33% of the time for the WPASS building, the rooms in the buildings were too warm in the summer. It should also be noted that the thermal conditions in individual rooms were different and, e.g., in the study-room in a well-insulated wooden building, discomfort was felt for almost 60% of the time that the room was occupied. Firstly, the room was only used during the day, i.e., when the daily temperature was the highest, secondly it is a small room with relatively large internal heat gains (in addition to people and additional office equipment, e.g., a computer).
Table 6 also summarizes the maximum ventilation values in rooms where the values were obtained by opening windows. The aforementioned low Hdis in the BSTD building was obtained with an air change rate that was more than two times less than those in the other buildings. This study did not include the analysis of local discomfort, but it should be borne in mind that possible drafts with a large airflow may also affect the thermal sensation of the residents.
Comparing the results for two different building technologies, it can be noted that in a wooden house, the indoor temperature had significantly higher maximum values, by even 4 °C (the children’s rooms in a passive house). This is because the wooden structure is lighter (it has a lower heat capacity), compared to the brick structure, and thus the building responds faster to changes in the outside temperature.

5. Discussion

Considering the analyses carried out earlier, it can be concluded that wooden technology generates the lowest GHG emissions, which is associated with the use of more natural construction materials. The most preferred variant in terms of the GWP is a standard insulated wooden house; the heat source used in this option was a heat pump with photovoltaic panels; the total GHG emissions from the heat source and the emissions from the materials that formed the building’s structure was the lowest for this case in comparison with the other considered cases. It should be noted that an increase in the requirements for thermal insulation of the external partitions does not produce a reduction in the total GHG emissions. From the point of view of reducing GHG emissions, both the heat sources and the building materials are important.
Considering the most economical solution, wooden houses are better than brick houses. The most economically advantageous variant of the heat source is a traditional coal boiler; this is due to the lowest investment and operating costs.
In the wooden building, however, there were a larger number of thermal discomfort hours; this was due to the lighter structure of the building. Any increase in the outdoor temperature results in a faster change in the indoor temperature, compared to a brick building. At the same time, more frequent overheating of rooms is felt by the residents. Unfortunately, as a result of improving the insulation parameters of the house, the number of discomfort hours increased. In this aspect, the standard insulated brick house is the best option.
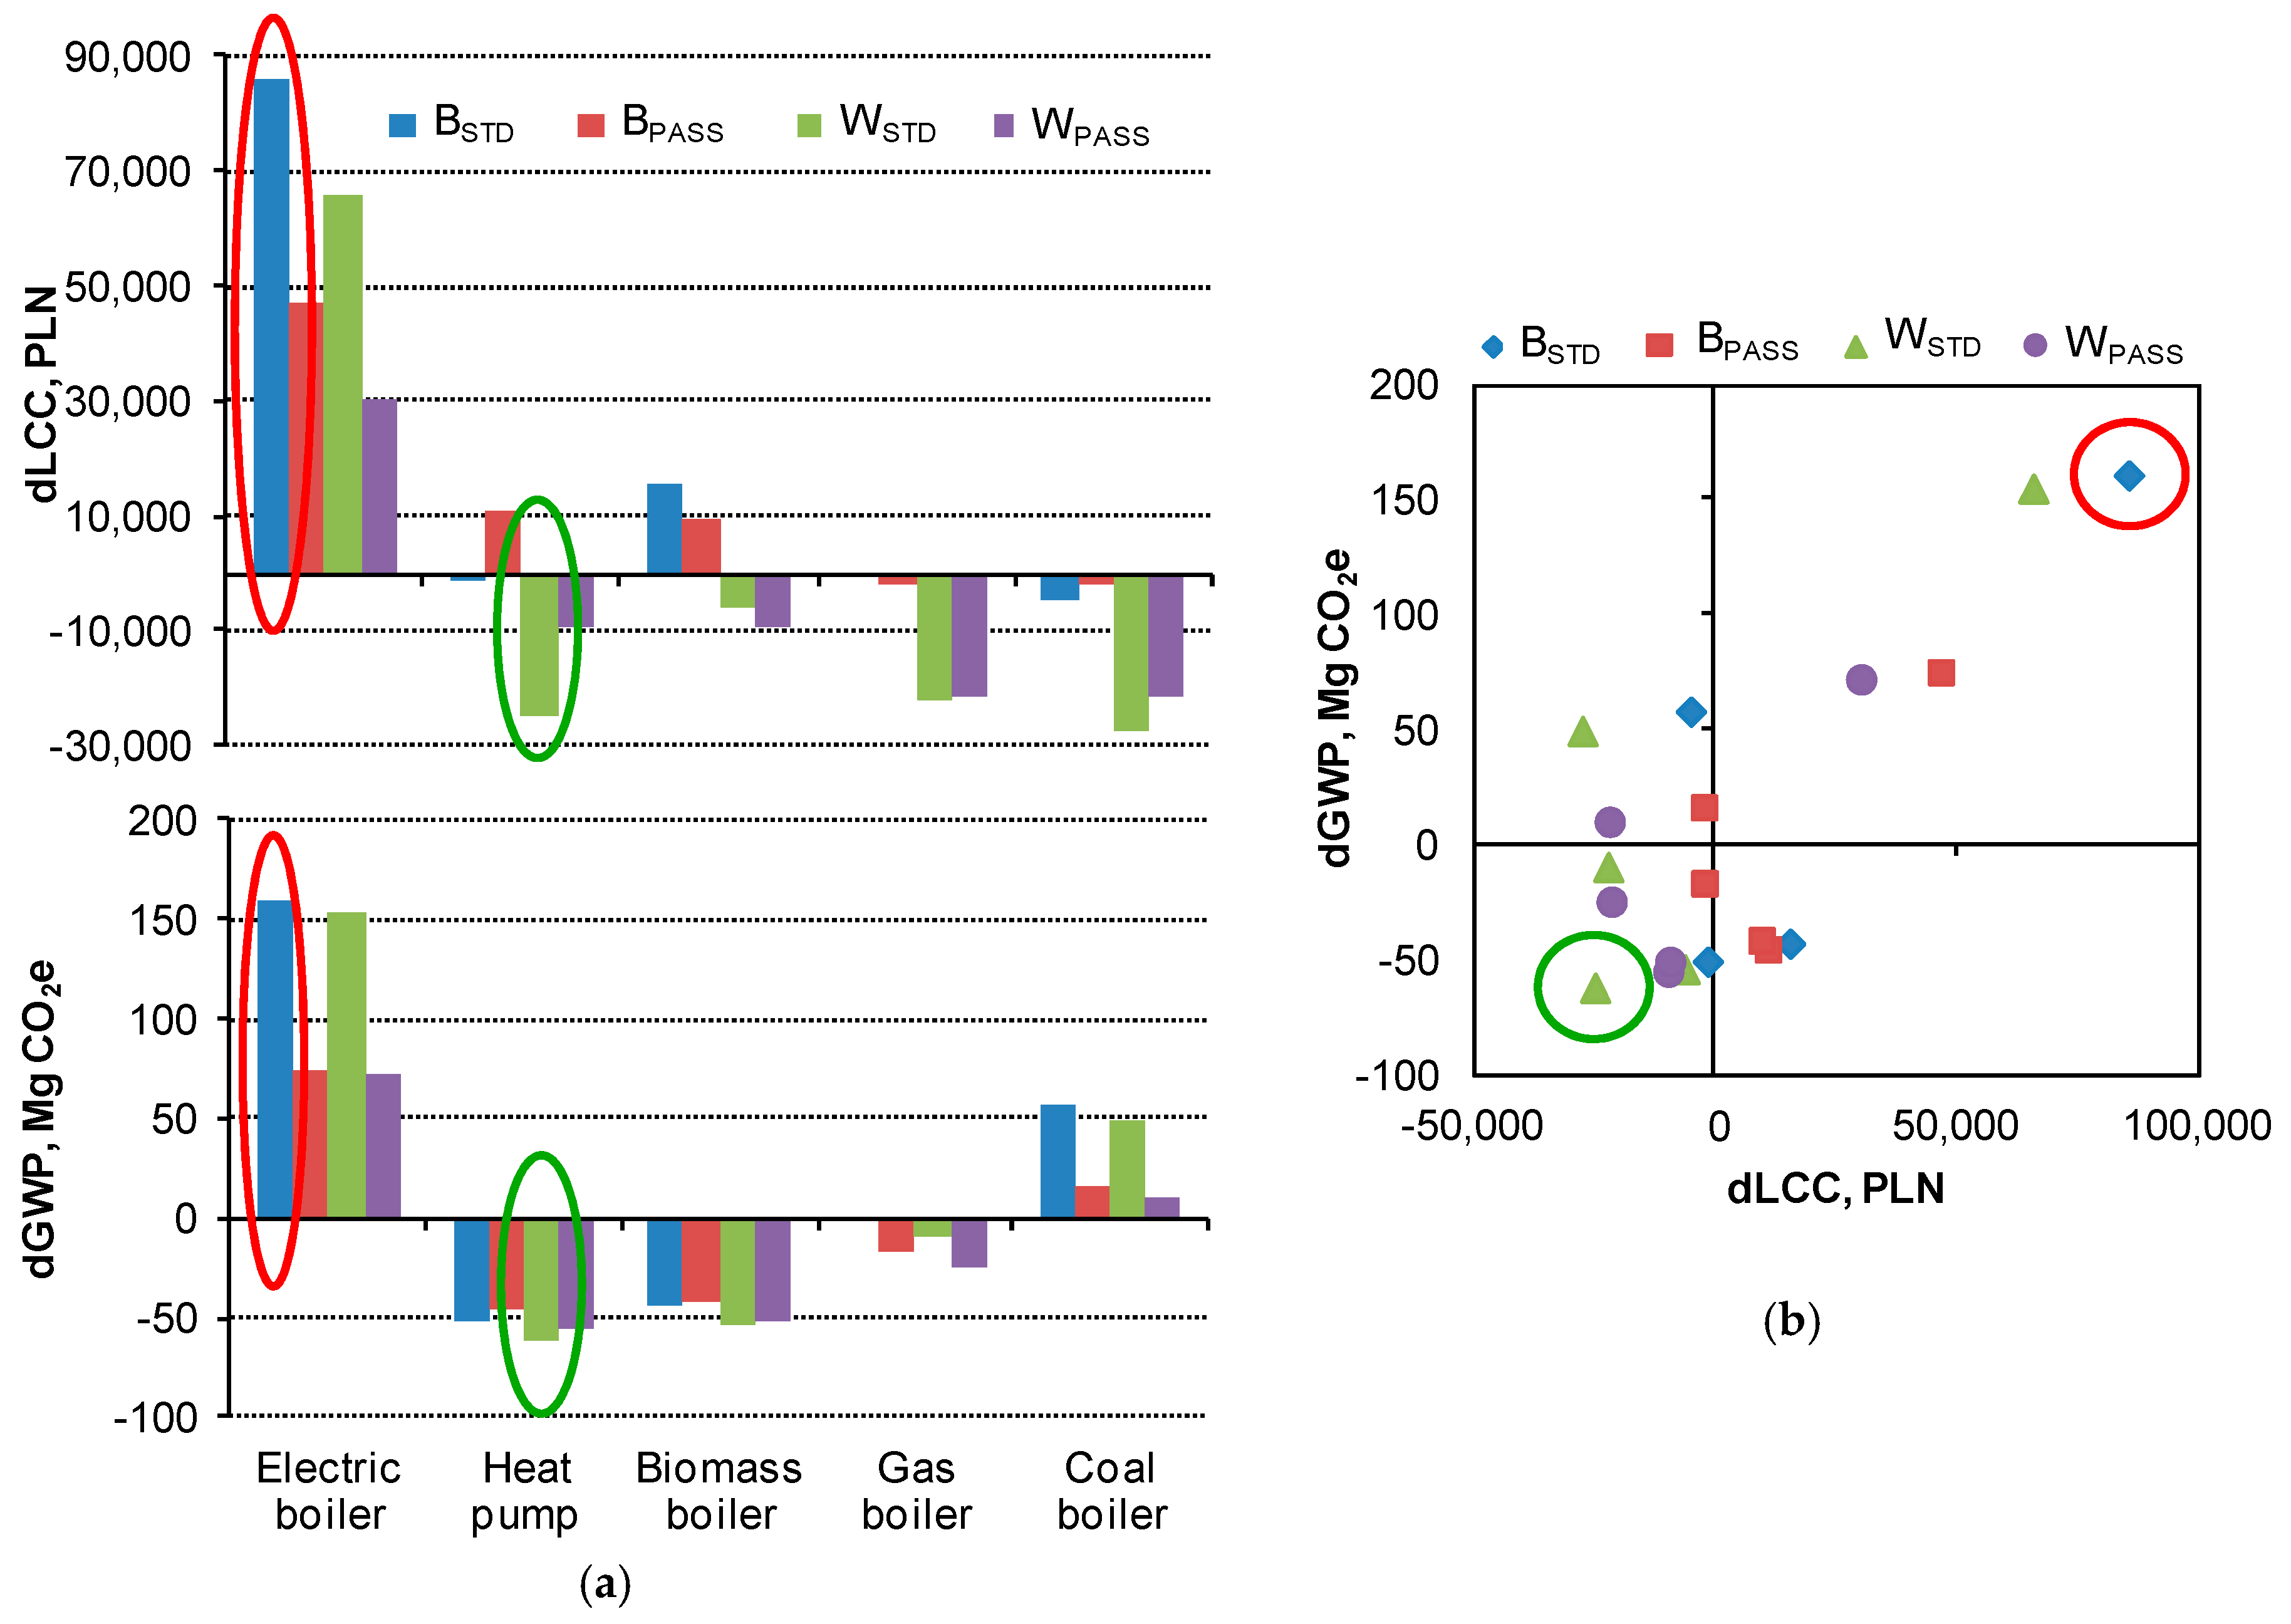
If thermal comfort is omitted, then the optimal solution among those analyzed will be the variant that has the lowest environmental impact and the lowest life cycle costs. Figure 8 shows the differences in the buildings’ life cycle costs and GHG emissions compared to the most popular solution among Polish investors—a standard brick building with a gas boiler. The worst variant among those analyzed turned out to be the same brick building but with an electric boiler (highlighted in red in Figure 8). The most preferred variant, in terms of life cycle costs and GHG emissions in the presented analyses, is the standard wooden house with a heat pump and PV (variant marked in green in Figure 8); this type of building also fits well in terms of thermal comfort, in this aspect it is only worse than the BSTD building.
However, it should be emphasized that the ventilation of the building will be of great importance for the results that have been obtained, and thus also for choosing the best solution. In this article, a special controller has been proposed to model this process. The purpose of the controller is to imitate the behavior of the occupants in the process of opening the windows. However, this is extremely difficult because people have different individual preferences; this is why it was decided to optimize the controller in this paper. As a result of this optimization, the Pareto front received non-dominated solutions. The Pareto front represents the optimal solutions that can be obtained for a given type of building, depending on how the rooms are ventilated. This analysis has shown that a very wide range of thermal discomfort hours and the corresponding heat demand can be obtained for each type of building.

6. Conclusions

The research has succeeded in developing general conclusions and guidelines as well as recommendations for the investors and designers of energy-saving and environmentally friendly houses as follows:
  • Considering the costs of erecting a house in both brick and wooden technology, it should be stated that the lower cost investment is the one that uses wooden construction materials; this is due to the lower costs of these materials. However, it should be remembered that some of these savings will be offset by additional expenses, such as the need to employ specialized construction workers who have experience in erecting such buildings, among others. However, even the wooden building meets the insulation requirements; as for passive houses (which have higher insulation costs) they may be more cost-effective than a brick building that only meets the minimum insulation requirements (lower insulation costs);
  • Due to the lower LCC and lower GHG emissions, houses made using wooden technology can be seen as more attractive. Unfortunately, wooden buildings are worse than brick buildings in terms of thermal comfort as there are a greater number of thermal discomfort hours (up to twice the number of hours);
  • Increasing the insulation thickness of the external partitions beyond the standard value will reduce the instantaneous heat loss in winter, however, due to the higher investment costs, the life cycle costs are only lower in the case of buildings with expensive to operate heat sources (e.g., an electric boiler); in addition, this can adversely affect the thermal comfort of buildings without an air-conditioning system in the summer; if it is decided to insulate the external walls, such as in passive buildings, air-conditioning should be considered in order to meet the thermal comfort requirements;
  • The most environmentally friendly heat source, from the point of view of GWP, combines a heat pump and a biomass boiler. The GHG emissions in a building with these sources are on average about 3–4 times lower (depending on the degree of insulation of the external partitions) compared to a building with an electric boiler. Buildings with a gas boiler emit about 1.5 times more GWP on average, compared to buildings with a heat pump. However, in terms of the LCC, buildings with a coal boiler are the best;
  • In order to reduce GHG emissions, a house using wooden technology and a heat pump as the heat source should be chosen; in this case, however, larger expenses should be planned for at the investment stage, but in the longer term, the total costs will be no more than 5% higher than the costs of the same building with the cheapest to operate heat source—a coal boiler;
  • Houses that use electricity from the grid for heating generate the largest amount of GWP, regardless of the technology used to build them. Renewable energy sources, such as a heat pump with photovoltaic panels and a biomass boiler, reduce the investment and operation expenditure by 11–25%, depending on the type of building in relation to the total LCC in the same buildings with an electric boiler.
The abovementioned conclusions were determined on the basis of analyses that were carried out in this study and relate to a single-family house intended for occupancy by a four-person family over a 25-year period of operation.

Limitations and Future Research

Many assumptions have been made in the article, which are difficult to determine in the long- term operation of a building due to, e.g., changes in the energy prices, changes in the climate, the occupants’ time in the building and their behavior. Additionally, the research was conducted for a standard climate; this was obtained as a result of 30 years of observations, and the calculation method means that any extreme temperatures were flattened. Future research will be conducted for the actual and future predicted climate data that may occur in 20 years time, taking global warming into account. The results that were obtained are of interest; in particular in terms of thermal comfort and the heat demand of the building.

Author Contributions

Study design and supervision, K.G, J.F.-G. and A.G.; literature review, J.F.-G., Ł.B., K.P. and P.G.; methodology, K.G., J.F.-G., Ł.B., K.C.; formal analysis, K.G., Ł.B., K.P., P.G., M.B. and K.M.; writing—original draft, K.G., J.F.-G., Ł.B., K.P., P.G., K.C., M.B. and K.M; writing—review and editing, A.G. and A.P.; All authors have read and agreed to the published version of the manuscript.

Funding

This research received no external funding.

Acknowledgments

The work was supported by the European Union from the European Social Fund in the framework of the project “Silesian University of Technology as a Center of Modern Education based on research and innovation” and Polish Ministry of Science and Higher Education within research subsidy.

Conflicts of Interest

The authors declare no conflict of interest.

Appendix A

Table A1. The full data source for GWP calculation used in One Click LCA program—brick building.
Resource NameQuantity (STD/PASS)Environment Data SourceEnvironmental Product Declaration (EPD) ProgramEnvironmental Product Declaration (EPD) NumberDate
Acrylic emulsion paint, for exterior application627.9 kgEPD Jotashield Antifade Colours, P.T. Jotun Indonesia Jotun A/SEPD NorgeNEPD-1736-712-EN2019
Ceramic tiles159.3 m2EPD Italian Ceramic TilesInstitut Bauen und Umwelt e.V.EPD-COI-20160202-ICG1-EN2016
EPS foam insulation8.0/24.0 m3EPD Expanded Polystyrene (EPS) Foam Insulation (density 15 kg/m³) EUMEPSInstitut Bauen und Umwelt e.V.EPD-EUM-20160269-IBG1-EN2017
Floor screed mortar, cement screed12.3 m3Oekobau.dat 2017-I, EPD Mineralische Werkmörtel: Estrichmörtel Zementestrich quickmix Gruppe GmbH & Co. KGInstitut Bauen und Umwelt e.V.EPD-QMX-20160208-IBC1-DE2014
Glass wool insulation, unfaced6.7 m3EPD Frame-S37International EPD SystemS-P-006612016
Gypsum plaster for internal walls and ceilings5.1 m3Gypsum plasters ALFA, BETA, GAMMA, ZETA, SPRINT, TEMPO, Dolina Nidy 2014Instytut Techniki BudowlanejITB EPD No 17/20142014
Gypsum plasterboard4.7 m3Gypsum plasterboard, Rigips PRO and Rigips 4PRO, SaintGobain 2014Instytut Techniki BudowlanejITB EPD No 25a2014
Hollow core concrete slabs, generic34.0 m3One Click LCAOne Click LCA-2018
Insulation, EPS facade panel27.0/73.6 m3EPD ALLIGATOR FARBWERKE GmbH Dalmatiner Fassadendämmplatte 032Institut Bauen und Umwelt e.V.EPD-DAW-20152319-CBD1-DE2016
Insulation, XPS2.6 m3XENERGYTM XPSDämmplatte Dow Deutschland GmbH & Co. OHGInstitut Bauen und Umwelt e.V.EPD-DOW-2013111-D2013
Inward-facing window, with wooden frame30.4 m2EPD Gilje innadslående eXtra vindu Gilje Tre ASEPD NorgeNEPD-1835-789-EN2019
Lightweight bituminous underlays for roof waterproofing265.5 m2EPD Lightweight underlays For Roof Waterproofing—sector EPDInternational EPD SystemS-P-013292018
Membranes, FPO/PVC-P waterproofing reinforced with polyester net159.3 m2EPD for Mapeplan TM—Mapeplan TB, Mapeplan Taf—Mapeplan TIInternational EPD SystemS-P-009062016
OSB panels1.8 m3Oekobau.dat 2017-I, EPD SWISS KRONO OSB Panels SWISS KRONO Tec AGInstitut Bauen und Umwelt e.V.EPD-KRO-20150067-IBD2-EN2015
Ready-mix concrete, normal-strength, generic22.3 m3One Click LCAOne Click LCA-2018
Rock wool insulation, for ventilated facades and cavity walls16.0/26.5 m3EPD FPL-035/FPL-035-GS/KD-035/KD-035-GS Rock Mineral Wool for ventilated facades and cavity walls Knauf InsulationInstitut Bauen und Umwelt e.V.EPD-KNI-20150327-CBB1-EN2016
Sandstone cladding, natural17.7 m3Dichiarazione ambientale di prodotto: rivestimento in pietra serena di firenzuola con superficie naturale e sabbiata con bordi rifilatiEPD ItalyEPDITALY00652019
Wall bricks70.5 m3Oekobau.dat 2017-I, EPD Mauerziegel Arbeitsgemeinschaft MauerziegelInstitut Bauen und Umwelt e.V.EPD-AMZ-20140244-ICG1-DE2015
Wooden entrance door1.8 m2EPD Climate door / interior door Nordic Dørfabrikk ASEPD NorgeNEPD-1535-525-EN2018
Table A2. The full data source for GWP calculation used in One Click LCA program—wood building.
Resource NameQuantity (STD/PASS)Environment Data SourceEnvironmental Product Declaration (EPD) ProgramEnvironmental Product Declaration (EPD) NumberDate
Acrylic emulsion paint, for exterior application602.5 kgEPD Jotashield Antifade Colours, P.T. Jotun Indonesia Jotun A/SEPD NorgeNEPD-1736-712-EN2019
Ceramic tiles158.5 m2EPD Italian Ceramic TilesInstitut Bauen und Umwelt e.V.EPD-COI-20160202-ICG1-EN2016
EPS foam insulation4.2/20.3 m3EPD Expanded Polystyrene (EPS) Foam Insulation (density 15 kg/m³) EUMEPSInstitut Bauen und Umwelt e.V.EPD-EUM-20160269-IBG1-EN2017
Floor screed mortar, cement screed8.4 m3Oekobau.dat 2017-I, EPD Mineralische Werkmörtel: Estrichmörtel Zementestrich quickmix Gruppe GmbH & Co. KGInstitut Bauen und Umwelt e.V.EPD-QMX-20160208-IBC1-DE2014
Glass wool insulation, unfaced12.6 m3EPD Frame-S37International EPD SystemS-P-006612016
Glass wool/mineral wool insulation, panel4.8 m3Rock mineral wool (Factory Gliwice), Saint Gobain Isover 2013Instytut Techniki BudowlanejEPD Rock mineral wool (Factory Gliwice)2013
Gypsum plasterboard8.7 m3Gypsum plasterboard, Rigips PRO and Rigips 4PRO, SaintGobain 2014Instytut Techniki BudowlanejITB EPD No 25a2014
Hardwood studs13.5 m3The Australian Life Cycle Inventory Database Initiative (AusLCI)AusLCI-2018
Hollow core concrete slabs, generic8.8 m3One Click LCAOne Click LCA-2018
Insulation, EPS facade panel12.1/43.6 m3EPD ALLIGATOR FARBWERKE GmbH Dalmatiner Fassadendämmplatte 032Institut Bauen und Umwelt e.V.EPD-DAW-20152319-CBD1-DE2016
Insulation, XPS2.6 m3XENERGYTM XPSDämmplatte Dow Deutschland GmbH&Co. OHGInstitut Bauen und Umwelt e.V.EPD-DOW-2013111-D2013
Inward-facing window, with wooden frame30.4 m2EPD Gilje innadslående eXtra vindu Gilje Tre ASEPD NorgeNEPD-1835-789-EN2019
Lightweight bituminous underlays for roof waterproofing265.5 m2EPD Lightweight underlays For Roof Waterproofing—sector EPDInternational EPD SystemS-P-013292018
Membranes, FPO/PVC-P waterproofing reinforced with polyester net84.5 m2EPD for Mapeplan TM—Mapeplan TB, Mapeplan Taf—Mapeplan TIInternational EPD SystemS-P-009062016
Mineral wool insulation with recycled briquette content12.7 m3EPD_Isover UNI-AKUČeská Informační Agentura Životního Prostředí3013EPD-15-03922015
OSB panels8.5 m3Oekobau.dat 2017-I, EPD SWISS KRONO OSB Panels SWISS KRONO Tec AGInstitut Bauen und Umwelt e.V.EPD-KRO-20150067-IBD2-EN2015
Ready-mix concrete, normal-strength, generic22.3 m3One Click LCAOne Click LCA-2018
Rock wool insulation panels, unfaced, generic15.3/27.2 m3One Click LCAOne Click LCA-2018
Sandstone cladding, natural17.7 m3Dichiarazione ambientale di prodotto: rivestimento in pietra serena di firenzuola con superficie naturale e sabbiata con bordi rifilatiEPD ItalyEPDITALY00652019
Unbonded, non-combustible blown glass wool/mineral wool insulation3.6/15.9 m3EPD Supafil and Jet Stream (0.037–0.042 W/mK) blown glass mineral wool insulation, Knauf Insulation 2014Building Research Establishment (BRE)BREG EN EPD0000512014
Wooden entrance door1.8 m2EPD Climate door / interior door Nordic Dørfabrikk ASEPD NorgeNEPD-1535-525-EN2018

References

  1. ISO Standard ISO14040:2006. Environmental Management—Life Cycle Assessment—Principles and Framework; International Organization for Standardization: Geneva, Switzerland, 2006. [Google Scholar]
  2. ISO Standard ISO14044:2006. Environmental Management—Life Cycle Assessment—Requirements and Guidelines; International Organization for Standardization: Geneva, Switzerland, 2006. [Google Scholar]
  3. Gustavsson, L.; Joelsson, A.; Sathre, R. Life cycle primary energy use and carbon emission of an eight-storey wood-framed apartment building. Energy Build. 2010, 42, 230–242. [Google Scholar]
  4. Blengini, G.A.; Di Carlo, T. The changing role of life cycle phases, subsystems and materials in the LCA of low energy buildings. Energy Build. 2010, 42, 869–880. [Google Scholar]
  5. Borkowski, M. Assesment of the life cycle of objects on the example of single-family housing. Przegląd Bud. 2015, 3, 15–21. (In Polish) [Google Scholar]
  6. Lewandowska, A.; Noskowiak, A.; Paichrowski, G.; Strykowski, W.; Witczak, A. Environmental Life Cycle Assessment of Model Wooden and Brick Buildings as an Example of the Application of the LCA Technique; Wood Technology Institute: Poznań, Poland, 2012. (In Polish) [Google Scholar]
  7. Kale, N.N.; Joshi, D.; Menon, R. Life cycle cost analysis of commercial buildings with energy efficient approach. Perspect. Sci. 2016, 8, 452–454. [Google Scholar]
  8. Ammar, M.; Zayed, T.; Moselhi, O. Fuzzy-based life-cycle cost model for decision making under subjectivity. J. Constr. Eng. Manag. 2013, 139, 556–563. [Google Scholar] [CrossRef]
  9. Alsayed, M.F.; Tayeh, R.A. Life cycle cost analysis for determining optimal insulation thickness in Palestinian buildings. J. Build. Eng. 2019, 22, 101–112. [Google Scholar]
  10. Ascione, F.; Bianco, N.; De Masi, R.F.; Mauro, G.M.; Vanoli, G.P. Design of the building envelope: A novel multi-objective approach for the optimization of energy performance and thermal comfort. Sustainability 2015, 7, 10809–10836. [Google Scholar] [CrossRef] [Green Version]
  11. Atmaca, A.; Atmaca, N. Comparative life cycle energy and cost analysis of post-disaster temporary housings. Appl. Energy 2016, 171, 429–443. [Google Scholar]
  12. Braulio-Gonzalo, M.; Bovea, M.D. Environmental and cost performance of building’s envelope insulation materials to reduce energy demand: Thickness optimization. Energy Build. 2017, 150, 527–545. [Google Scholar] [CrossRef] [Green Version]
  13. Invidiata, A.; Ghisi, E. Life-cycle energy and cost analyses of window shading used to improve the thermal performance of houses. J. Clean. Prod. 2016, 133, 1371–1383. [Google Scholar] [CrossRef]
  14. Islam, H.; Jollands, M.; Setunge, S.; Haque, N.; Bhuiyan, M.A. Life cycle assessment and life cycle cost implications for roofing and floor designs in residential buildings. Energy Build. 2015, 104, 250–263. [Google Scholar] [CrossRef]
  15. Jaber, S.; Ajib, S. Optimum, technical and energy efficiency design of residential building in Mediterranean region. Energy Build. 2011, 43, 1829–1834. [Google Scholar] [CrossRef]
  16. Kaynakli, O. Parametric investigation of optimum thermal insulation thickness for external walls. Energies 2011, 4, 913–927. [Google Scholar] [CrossRef]
  17. Pal, S.K.; Takano, A.; Alanne, K.; Palonen, M.; Siren, K. A multi-objective life cycle approach for optimal building design: A case study in Finnish context. J. Clean. Prod. 2017, 143, 1021–1035. [Google Scholar]
  18. Tong, S.; Li, H. Life-cycle cost analysis of roofing technologies in tropical areas. Energy Build. 2017, 151, 283–292. [Google Scholar] [CrossRef]
  19. Udawattha, C.; Halwatura, R. Life cycle cost of different walling material used for affordable housing in tropics. Case Stud. Constr. Mater. 2017, 7, 15–29. [Google Scholar] [CrossRef]
  20. Bichiou, Y.; Krarti, M. Optimization of envelope and HVAC systems selection for residential buildings. Energy Build. 2011, 43, 3373–3382. [Google Scholar] [CrossRef]
  21. Audenaert, A.; De Cleyn, S.H.; Vankerckhove, B. Economic analysis of passive houses and low-energy houses compared with standard houses. Energy Policy 2008, 36, 47–55. [Google Scholar] [CrossRef]
  22. Chastas, P.; Theodosiou, T.; Kontoleon, K.J.; Bikas, D. The effect of embodied impact on the cost-optimal levels of nearly zero energy buildings: A case study of a residential building in Thessaloniki, Greece. Energies 2017, 10, 740. [Google Scholar] [CrossRef] [Green Version]
  23. Harkouss, F.; Fardoun, F.; Biwole, P.H. Multi-objective optimization methodology for net zero energy buildings. J. Build. Eng. 2018, 16, 57–71. [Google Scholar] [CrossRef]
  24. Harkouss, F.; Fardoun, F.; Biwole, P.H. Passive design optimization of low energy buildings in different climates. Energy 2018, 165, 591–613. [Google Scholar] [CrossRef]
  25. Kang, H.J. Development of an nearly zero emission building (nZEB) life cycle cost assessment tool for fast decision making in the early design phase. Energies 2017, 10, 59. [Google Scholar] [CrossRef]
  26. Marszal, A.J.; Heiselberg, P. Life cycle cost analysis of a multi-storey residential Net Zero Energy Building in Denmark. Energy 2011, 36, 5600–5609. [Google Scholar] [CrossRef]
  27. Moran, P.; Goggins, J.; Hajdukiewicz, M. Super-insulate or use renewable technology? Life cycle cost, energy and global warming potential analysis of nearly zero energy buildings (nZEB) in a temperate oceanic climate. Energy Build. 2017, 139, 590–607. [Google Scholar] [CrossRef] [Green Version]
  28. ANSI/ASHRAE Standard 55. Thermal Environmental Conditions for Human Occupancy; American Society of Heating, Refrigerating and Air-Conditioning Engineers (ASHRAE): Atlanta, GA, USA, 2017. [Google Scholar]
  29. Fanger, P.O. Thermal Comfort; Danish Technical Press: Copenhagen, Denmark, 1970. [Google Scholar]
  30. ISO Standard ISO7730:2005. Ergonomics of the Thermal Environment—Analytical Determination and Interpretation of Thermal Comfort Using Calculation of the PMV and PPD Indices and Local Thermal Comfort Criteria; International Organization for Standardization: Geneva, Switzerland, 2005. [Google Scholar]
  31. EU Standard EN15251:2007. Indoor Environmental Input Parameters for Design and Assessment of Energy Performance of Buildings Addressing Indoor Air Quality, Thermal Environment, Lighting and Acoustics; European Committee for Standardization: Brussels, Belgium, 2007. [Google Scholar]
  32. Hoof, J. Forty years of Fanger’s model of thermal comfort: Comfort for all? Indoor Air 2008, 18, 182–201. [Google Scholar] [CrossRef] [PubMed]
  33. Gilani, S.I.U.H.; Khan, M.H.; Pao, W. Thermal Comfort Analysis of PMV Model Prediction in Air Conditioned and Naturally Ventilated Buildings. Energy Procedia 2015, 75, 1373–1379. [Google Scholar] [CrossRef] [Green Version]
  34. Shaari, N.A.; Zaki, S.A.; Mat Ali, M.S.; Abd Razak, A. Investigation of the PMV and TSV Models of Thermal Comfort in Air-Conditioned University Classrooms in Malaysia. Appl. Mech. Mater. 2016, 819, 207–211. [Google Scholar] [CrossRef]
  35. Barbadilla-Martin, E.; Martin, J.G.; Lissen, J.M.S.; Ramos, J.S.; Dominguez, S.A. Assessment of thermal comfort and energy savings in a field study on adaptive comfort with application for mixed mode offices. Energy Build. 2018, 167, 281–289. [Google Scholar] [CrossRef]
  36. Alfano, F.R.; Olesen, B.W.; Palella, B.I.; Riccio, G. Thermal comfort: Design and assessment for energy saving. Energy Build. 2014, 81, 326–336. [Google Scholar] [CrossRef]
  37. Kwong, Q.J.; Adam, N.M.; Sahari, B.B. Thermal comfort assessment and potential for energy efficiency enhancement in modern tropical buildings: A review. Energy Build. 2014, 68, 547–557. [Google Scholar] [CrossRef]
  38. Martinez-Molina, A.; Tort-Ausina, I.; Cho, S.; Vivancos, J. Energy efficiency and thermal comfort in historic buildings: A review. Renew. Sustain. Energy Rev. 2016, 61, 70–85. [Google Scholar] [CrossRef]
  39. Yang, L.; Yan, H.; Lam, J.C. Thermal comfort and building energy consumption implications—A review. Appl. Energy 2014, 115, 164–173. [Google Scholar]
  40. Alibaba, H. Determination of optimum window to external wall ratio for offices in a hot and humid climate. Sustainability 2016, 8, 187. [Google Scholar] [CrossRef] [Green Version]
  41. Ascione, F.; De Masi, R.F.; de Rossi, F.; Ruggiero, S.; Vanoli, G.P. Optimization of building envelope design for nZEBs in Mediterranean climate: Performance analysis of residential case study. Appl. Energy 2016, 183, 938–957. [Google Scholar]
  42. Baglivo, C.; Congedo, P.M.; Di Cataldo, M.; Coluccia, L.D.; D’Agostino, D. Envelope design optimization by thermal modelling of a building in a warm climate. Energies 2017, 10, 1808. [Google Scholar] [CrossRef] [Green Version]
  43. Kalua, A. Envelope thermal design optimization for urban residential buildings in Malawi. Buildings 2016, 6, 13. [Google Scholar]
  44. Lu, S.; Wang, R.; Zheng, S. Passive optimization design based on Particle Swarm Optimization in rural buildings of the hot summer and warm winter zone of China. Sustainability 2017, 9, 2288. [Google Scholar] [CrossRef] [Green Version]
  45. Stazi, F.; Tomassoni, E.; Di Perna, C. Super-insulated wooden envelopes in Mediterranean climate: Summer overheating, thermal comfort optimization, environmental impact on an Italian case study. Energy Build. 2017, 138, 716–732. [Google Scholar] [CrossRef]
  46. Tubelo, R.; Rodrigues, L.; Gillott, M.; Gonçalves Soares, J.C. Cost-effective envelope optimisation for social housing in Brazil’s moderate climates zones. Build. Environ. 2018, 133, 213–227. [Google Scholar] [CrossRef]
  47. Nguyen, A.-T.; Reiter, S. Passive designs and strategies for low-cost housing using simulation-based optimization and different thermal comfort criteria. J. Build. Perform. Simul. 2014, 7, 68–81. [Google Scholar] [CrossRef] [Green Version]
  48. Oliveira, R.; Figueiredo, A.; Vicente, R.; Almeida, R.M.S.F. Multi-Objective optimisation of the energy performance of lightweight constructions combining evolutionary algorithms and life cycle cost. Energies 2018, 11, 1863. [Google Scholar]
  49. Sarkar, A.; Bose, S. Exploring impact of opaque building envelope components on thermal and energy performance of houses in lower western Himalayans for optimal selection. J. Build. Eng. 2016, 7, 170–182. [Google Scholar] [CrossRef]
  50. Stazi, F.; Naspi, F.; Ulpiani, G.; Di Perna, C. Indoor air quality and thermal comfort optimization in classrooms developing an automatic system for windows opening and closing. Energy Build. 2017, 139, 732–746. [Google Scholar] [CrossRef]
  51. Ferdyn-Grygierek, J.; Grygierek, K. Multi-variable optimization of building thermal design using genetic algorithms. Energies 2017, 10, 1570. [Google Scholar] [CrossRef] [Green Version]
  52. Grygierek, K.; Ferdyn-Grygierek, J. Multi-objective optimization of the envelope of building with natural ventilation. Energies 2018, 11, 1383. [Google Scholar] [CrossRef] [Green Version]
  53. Ferdyn-Grygierek, J.; Grygierek, K. Optimization of window size design for detached house using TRNSYS simulations and genetic algorithm. Archit. Civ. Eng. Environ. 2017, 10, 133–140. [Google Scholar] [CrossRef] [Green Version]
  54. Grygierek, K. Optimal Design of the Building Envelope with Computational Intelligence Methods; Silesian University of Technology: Gliwice, Poland, 2019. (In Polish) [Google Scholar]
  55. Polish Ministry of Infrastructure. Regulation of the Minister of Infrastructure of 12 April 2002 on the Technical Conditions That Should Be Met by Buildings and Their Location; Journal of Laws of the Republic of Poland No 75, Item. 690, (with Recast); Polish Ministry of Infrastructure: Warsaw, Poland, 2002. (In Polish) [Google Scholar]
  56. OpenStudio. Available online: https://www.openstudio.net/. (accessed on 15 April 2020).
  57. Engineering Reference, EnergyPlus™ Version 8.7 Documentation; US Department of Energy: Washington, DC, USA, 2016; Available online: https://energyplus.net/sites/all/modules/custom/nrel_custom/pdfs/pdfs_v8.7.0/EngineeringReference.pdf (accessed on 15 April 2020).
  58. EnergyPlus Weather File. Available online: https://energyplus.net/weather-location/europe_wmo_region_6/POL/POL_Warsaw.123750_IWEC (accessed on 15 April 2020).
  59. EU Standard EN16798-1:2019. Energy Performance of Buildings—Ventilation for Buildings—Part 1: Indoor Environmental Input Parameters for Design and Assessment of Energy Performance of Buildings Addressing Indoor Air Quality, Thermal Environment, Lighting and Acoustics—Module M1-6; European Committee for Standardization: Brussels, Belgium, 2019. [Google Scholar]
  60. American Society of Heating, Refrigerating and Air Conditioning Engineers. ASHRAE Handbook Fundamentals, SI ed.; American Society of Heating, Refrigerating and Air Conditioning Engineers: Atlanta, GA, USA, 1997; ISBN 978-1883413453. [Google Scholar]
  61. Dickinson, J.B.; Feustel, H.E. Seasonal Variation in Effective Leakage Area; Lawrence Berkeley Laboratory, University of California: Berkeley, CA, USA, 1986. [Google Scholar]
  62. Blaszczok, M.; Baranowski, A. Thermal improvement in residential buildings in view of the indoor air quality—Case study for Polish dwelling. Archit. Civ. Eng. Environ. 2018, 11, 121–130. [Google Scholar]
  63. Ferdyn-Grygierek, J.; Baranowski, A.; Blaszczok, M.; Kaczmarczyk, J. Thermal diagnostics of natural ventilation in buildings: An integrated approach. Energies 2019, 12, 4556. [Google Scholar] [CrossRef] [Green Version]
  64. Deb, K.; Pratap, A.; Agarwal, S.; Meyarivan, T. A fast and elitist multiobjective genetic algorithm: NSGA-II. IEEE Trans. Evol. Comput. 2002, 6, 182–197. [Google Scholar] [CrossRef] [Green Version]
  65. BimEstiMate. Available online: https://bimestimate.eu/ (accessed on 15 April 2020).
  66. One Click LCA (2015); Bionova Ltd.: Helsinki, Finland; Available online: https://www.oneclicklca.com/ (accessed on 15 April 2020).
  67. EU Standard EN 15978:2011. Sustainability of Construction Works—Assessment of Environmental Performance of Buildings—Calculation Method; European Committee for Standardization: Brussels, Belgium, 2011. [Google Scholar]
  68. EU Standard EN 15804:2012+A1:2013. Sustainability of Construction Works—Environmental Product Declarations—Core Rules for the Product Category of Construction Products; European Committee for Standardization: Brussels, Belgium, 2012. [Google Scholar]
  69. Sarofim, M.C.; Giordano, M.R. A quantitative approach to evaluating the GWP timescale through implicit discount rates. Earth Syst. Dyn. 2018, 9, 1013–1024. [Google Scholar] [CrossRef] [Green Version]
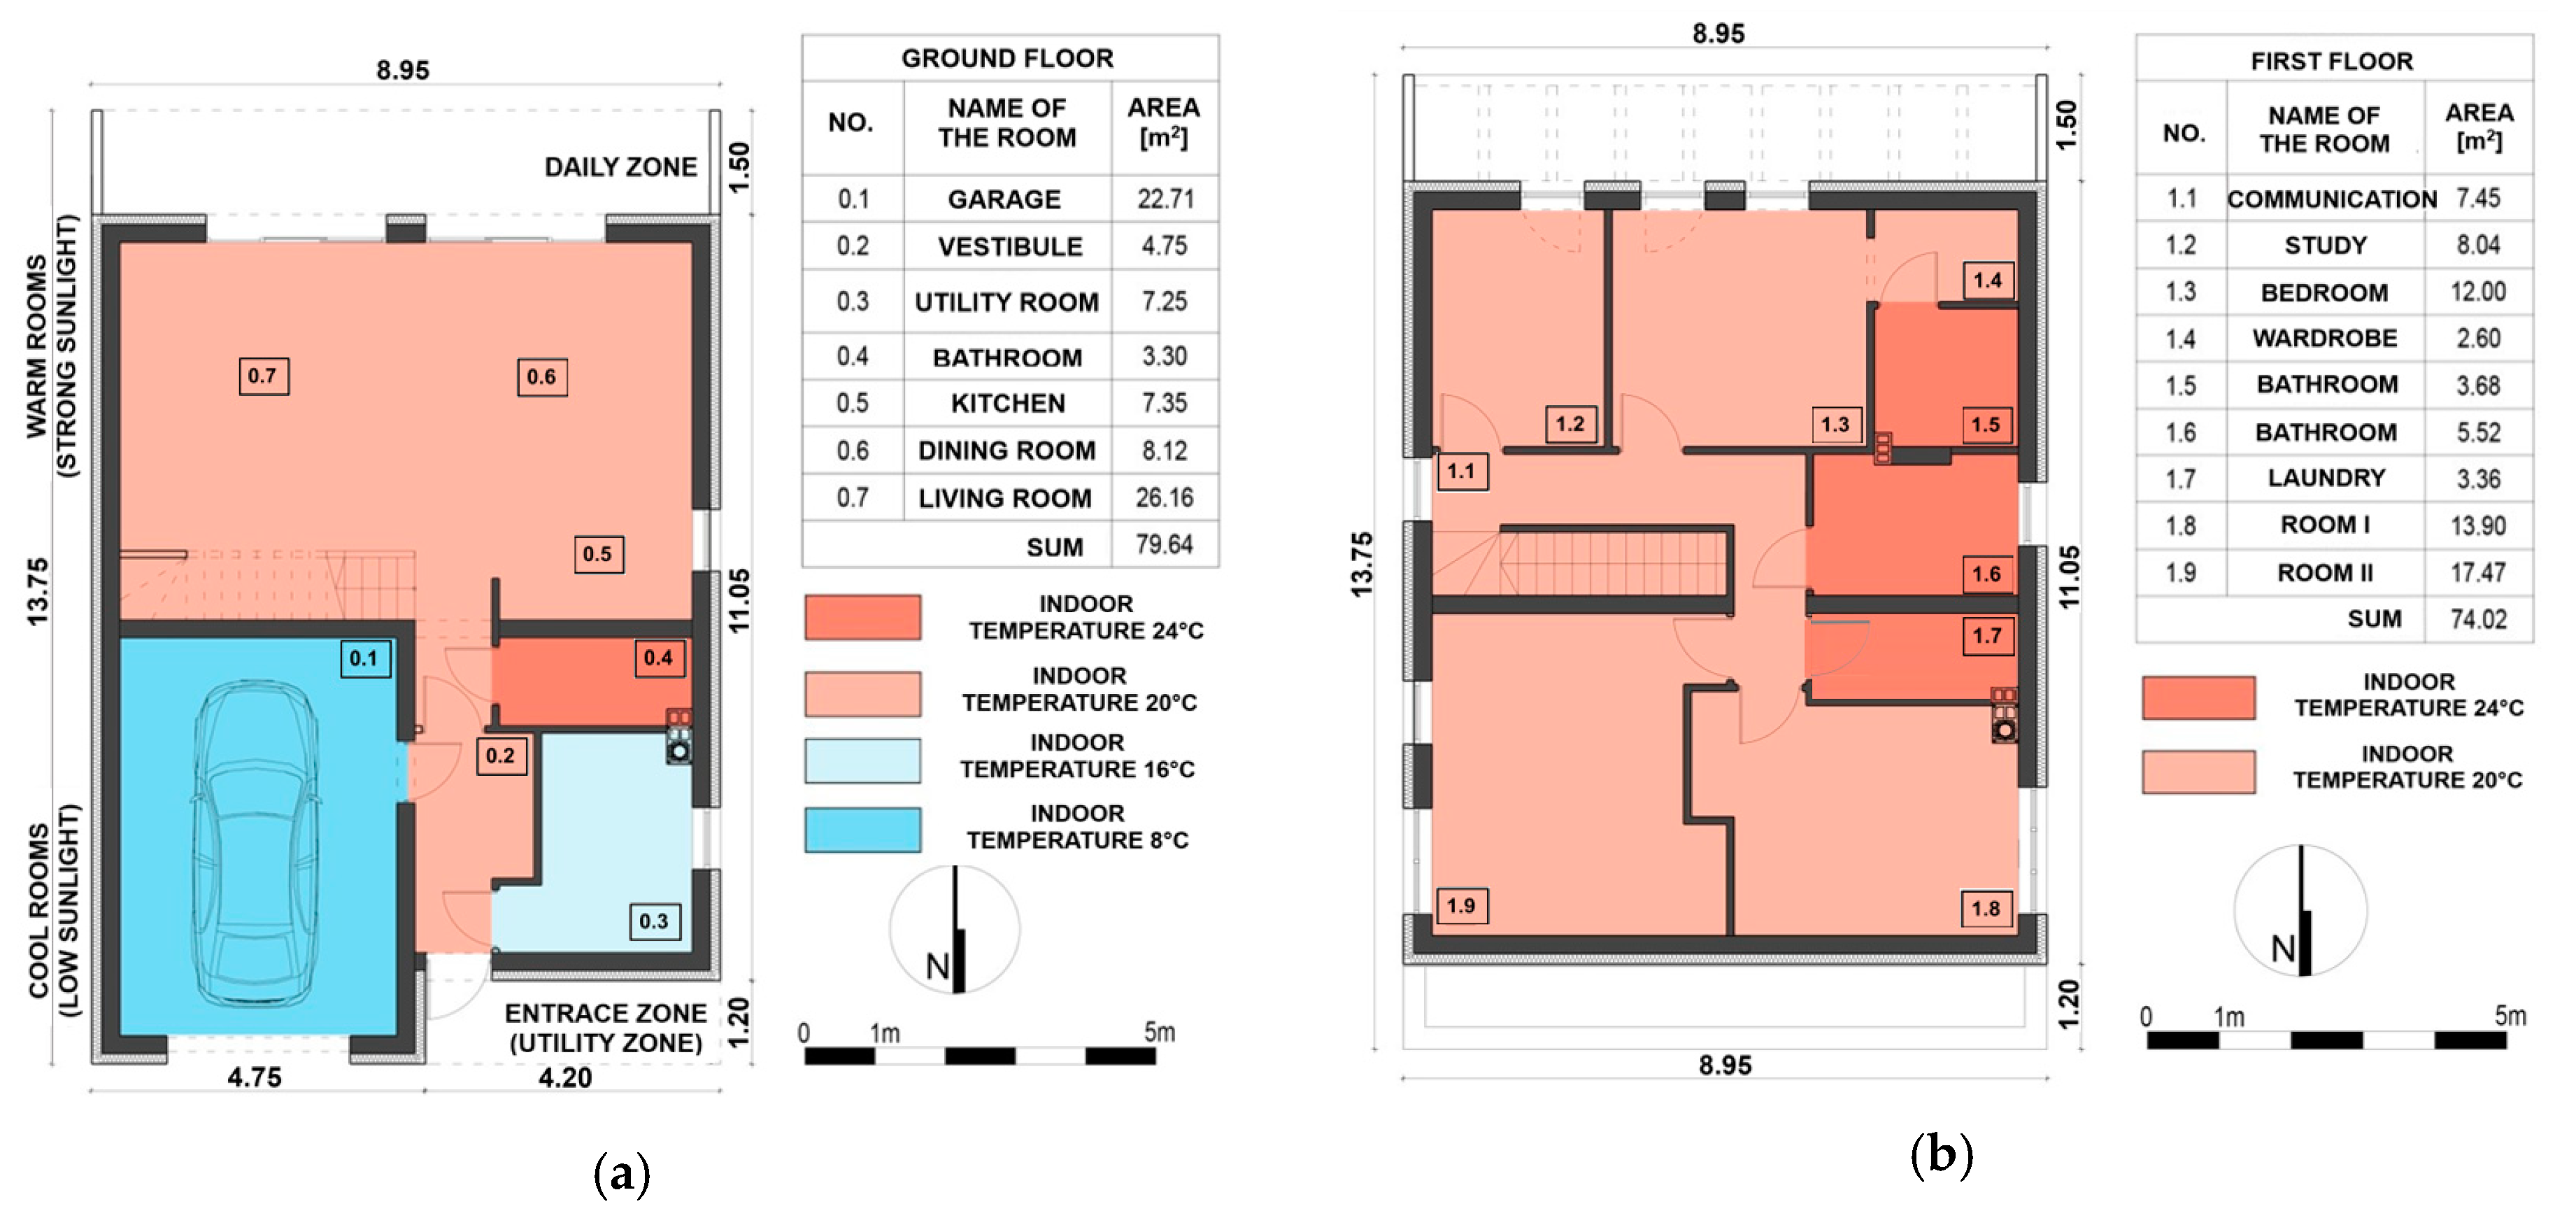
Figure 1. Plan of the ground floor (a) and the first floor (b) of the building.
Energies 13 02740 g001
Figure 2. Controller operating diagram.
Energies 13 02740 g002
Figure 3. Connection diagram for MATLAB–EnergyPlus.
Energies 13 02740 g003
Figure 4. GHG emissions associated with the building construction.
Energies 13 02740 g004
Figure 5. GHG emissions related to energy consumption for heating, depending on the type of boiler and building (25 years of operation).
Energies 13 02740 g005
Figure 6. The LCC depending on building type and heat source.
Energies 13 02740 g006
Figure 7. Pareto Front for the wooden buildings WSTD (a) and WPASS (b).
Energies 13 02740 g007
Figure 8. The difference between the buildings’ life cycle costs (dLCC) and GHG emissions (dGWP) compared to a standard brick building (BSTD) with (a) a gas boiler and (b) their correlation.
Energies 13 02740 g008
Table 1. Heat transfer coefficients for the external partitions.
PartitionHeat Transfer Coefficient, Uc, W/m2K
BSTD and WSTDBPASS and WPASS
External wall0.230.10
Ground floor0.290.11
Roof0.180.11
Roof above the garage0.170.11
Window0.85 10.90 2
1 Solar heat gains coefficient of 0.61 2 Solar heat gains coefficient of 0.51.
Table 2. Maximum, minimum and average values of temperature that characterize used outdoor climate.
Average annual temperature 8.2 °C
Minimum annual temperature−12.2 °C
Maximum annual temperature33.1 °C
Average temperature in the heating period 5.1 °C
Average temperature the in summer 17.6 °C
Table 3. Data for the heat sources.
Electric BoilerGas BoilerCoal BoilerHeat PumpBiomass Boiler
Total efficiency of the heating system10.810.800.672.220.57
Investments costs of the heat source, PLN (€)8300 (1820)8200 (1800)14,700 (3220)36,700/33,0002 (8040/7230)15,000 (3290)
GWP, kgCO2e /kWh0.950.240.410.0030.036
1 Seasonal efficiency of the heating system, taking into account heat generation efficiency (or coefficient of performance for heat pump), heat control efficiency and heat transfer efficiency; 2 building standard/passive; additional PV investment costs were: 17,200/ 15,300 PLN (3768/ 3352 €) 3 the required electricity was generated by PV (additional GHG emissions from the production of the PV was 3840 kgCO2e—standard building, 2720 kgCO2e—passive building).
Table 4. The total cost of erecting a house depending on the type of building.
BuildingMaterials, PLN (€)Labor, PLN (€)Use of Equipment on the Construction Site, PLN (€)
BSTD180,200 (39,480)53,800 (11,790)4300 (940)
BPASS196,700 (43,090)55,300 (12,120)4300 (940)
WSTD151,900 (33,280)60,000 (13,150)3100 (680)
WPASS171,100 (37,490)61,500 (13,470)3100 (680)
Table 5. Heating demand and thermal discomfort in the whole building.
BuildingQheat, kWhHdis, h
BSTD7344371
BPASS4205894
WSTD7536681
WPASS44291253
Table 6. Percentage of discomfort hours (Hdis) in relation to the occupied hours in the rooms (maximum obtained value and average value for all the rooms), the maximum air change rate (ACHmax) obtained by opening windows and the maximum calculated temperature (Tmax) in the building.
BuildingHdis, %ACHmax, h−1Tmax, °C
All YearSummer
MaxAvgMaxAvg
BSTD11.62.945.99.31.531.61
BPASS13.67.151.126.83.833.12
WSTD12.25.445.117.33.035.31
WPASS18.99.958.132.83.836.42
1 Obtained in the study-room. 2 obtained in the living-room.