2.1. The Proposed PSP’s Optimal Design and Operation
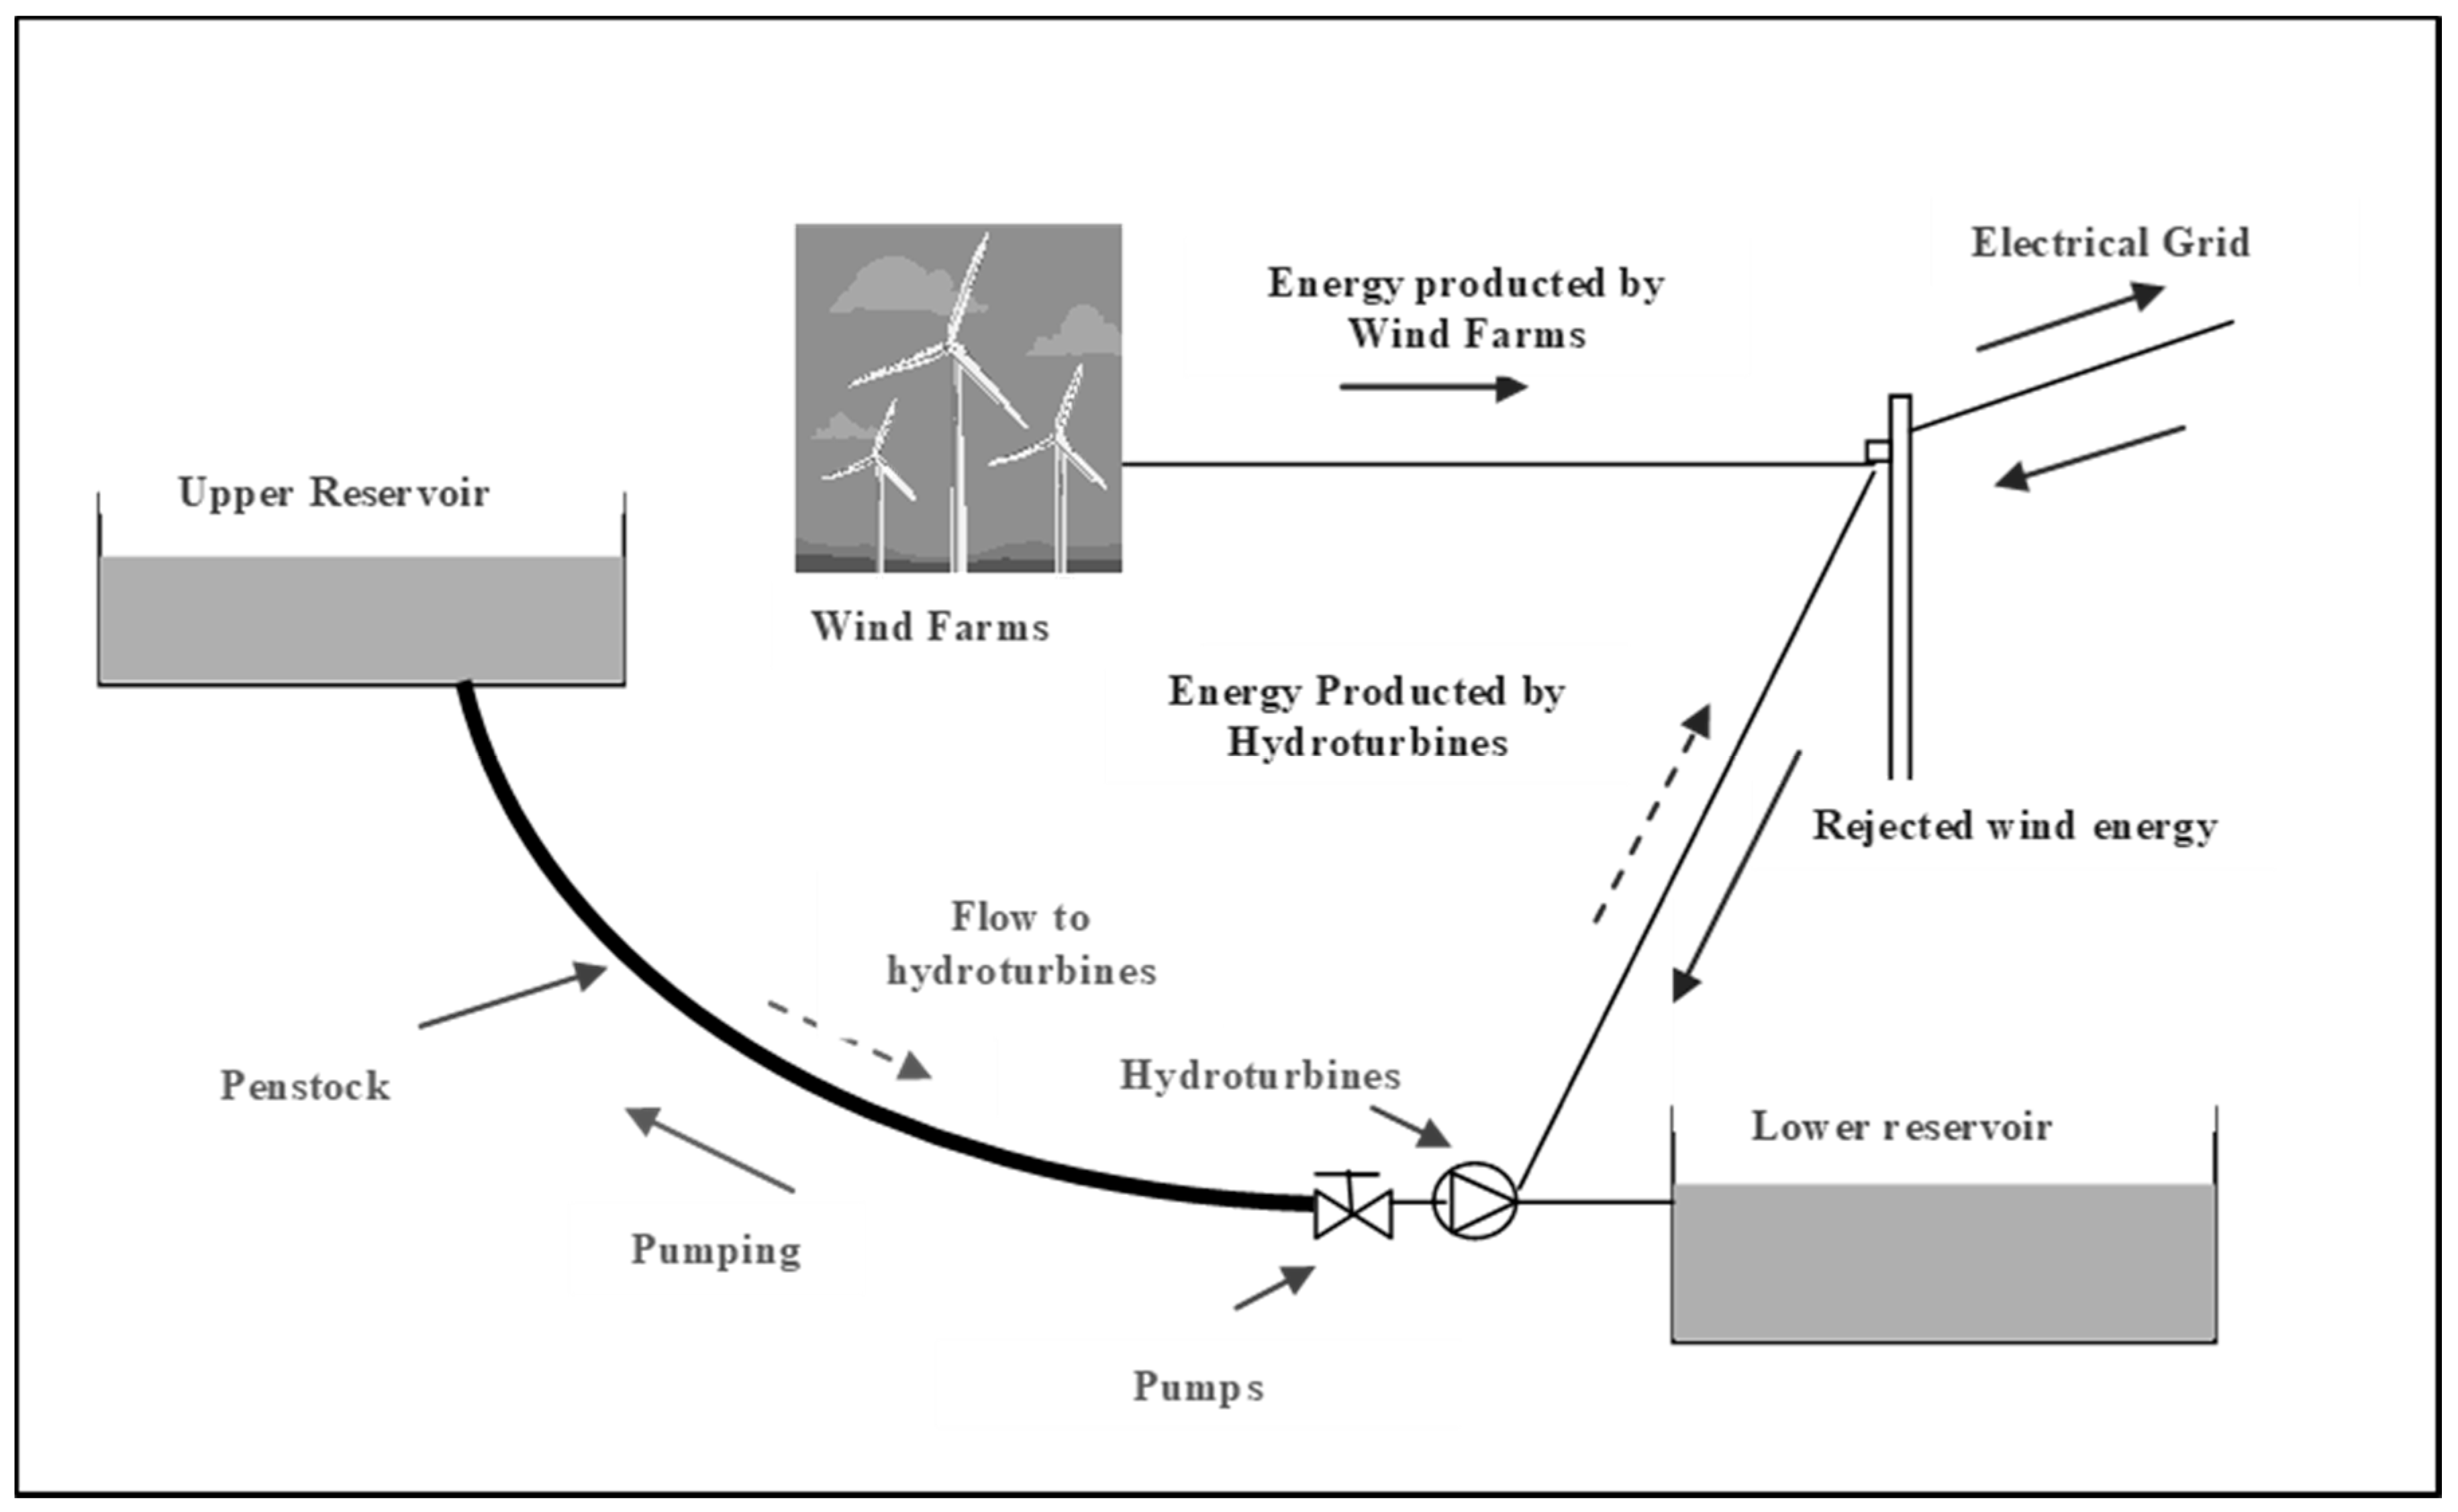
A typical configuration of a hybrid wind-hydro PSP is given in
Figure 1. The plant consists of two reservoirs at different elevation, a set of hydro turbines, pumps with common penstock, and one or more primary wind production units installed at the same or adjacent locations. Energy exchange with the electricity system and between subsystems of the plant is carried out through separate connections of all subunits with the grid, while there is no internal interconnection between the hydro and the wind sub-plants. The electric energy storage capacity of such a plant depends on the useful volume of the smallest of the two reservoirs and of the hydraulic head between their levels. The storage capacity is determined by the rated power of the pump and turbine units [
13].
In the present study, the wind electricity produced by the wind farms on the island of Crete is injected directly into the grid and only the non-penetrable amount, i.e., the non-absorbed by consumption, will be saved and stored in the upper reservoir through the pumps of the proposed PSP. In this way, an important fraction of the wind energy production, which otherwise would have been rejected, can be saved and exploited further. The hydro turbine produces and delivers electricity to the network according to a pre-agreed contract signed with the local TSO (Transmission System Operator) of the Crete island, for a constant time period every day, i.e., for eight hours during the peak demand hours of each day. This electric energy will be sold to the main grid. According to the Decision No. 1333/2010 of the Greek Regulatory Authority of Energy, the pricing of 236 €/MWh for the guaranteed wind-hydropower PSP production in Crete can be considered quite satisfactory. Crete is the largest Greek island with approximately 600,000 permanent inhabitants. The energy consumption in 2017 was 3,019,581 MWh with a peak demand of 637.9 MW. The electricity is produced by three conventional power stations (Linoperamata-Heraklion, Atherinolakos-Lasithi, and Xilokamara-Chania conventional power plants) of total installed power of 824.6 ΜW, by wind farms of total installed power of 200.3 MW and by photovoltaic installations of installed power of 95.5 MW [
17,
18]. Although the national project of the electric interconnection of Crete with the mainland has been initiated by the Independent Power Transmission Operator of Greece (ADMIE:
www.admie.gr), the power system of Crete is still expected to remain autonomous until at least the end of the year 2025.
2.4. Step 2: Generation of the Rejected Wind Power Time Series
A rather difficult issue in the present research is the estimation of the time series (8760 values) of the rejected wind power in the power system of Crete for the year 2025. The creation of that time series used in the present research is based on the combination of the data of the Energy Planning Study of the Region of Crete with the data of the HEDNO S.A.’s (Hellenic Electricity Distribution Network Operator) Annual System Operation Report-2017, as well as the methodology developed in [
14], properly modified. In
Figure 2, the annual rejected wind power production for the reference year 2015 is depicted, as it was given by the Laboratory of Hydraulic Turbomachines-LHT/National Technical University of Athens [
14] and it is registered as 184,888 MWh. In the year 2015 the installed wind power in Crete was 169 MW and the total gross electricity consumption was 2,904,000 MWh.
The method to forecast the rejected wind power time series of the year 2025 based on that recorded for the reference year 2015, is described below.
In the first step, the average hourly load
of the power system of Crete for the year 2015 is calculated by the division of the registered total gross electricity consumption of the power system of Crete (by HEDNO) with 8760 h/y, i.e.,:
With the same formula the forecasted average load for the year 2025 for each energy planning scenario (see
Section 2.3 above) is estimated:
Business as Usual: the forecasted total gross electricity consumption for 2025 is 3,137,000 MWh thus = 358.1 ΜW
OIL-GREEN: the forecasted total gross electricity consumption for 2025 is 3,247,000 MWh, thus 370.7 ΜW
GREEN-Advance: the forecasted total gross electricity consumption for 2025 is 3,374,000 MWh, thus 385.2 ΜW
In the following, the dimensionless parameter R is introduced as the ratio of the total installed wind power in the island of Crete
to the average hourly load
for each year (i.e., scenario) under consideration:
The parameter R signifies the relative (percentage) participation of the installed wind power to the average hourly load covering. In other words the ratio R could be considered as a simplified estimation of the average hourly penetration of the wind energy in the isolated power system for each year under consideration.
In the last step, the parameter F
ct is introduced below that can be used to create the forecasted wind production time series from the registered one of a past (reference) year, until the future year under consideration. In that way, the additional wind power installed due to any new wind farm installation during the corresponding time period is considered and defined as follows [
13]:
In this way, by multiplying all the values of the reference wind power rejection time series with the defined above parameter F
ct, a realistic forecasting of the rejected wind power time series can be created for each energy planning scenario under examination of the Crete power grid for the year 2025. In the case of the present study the parameter F
ct is used to create the rejected wind power time series, one for each scenario examined, for the year 2025, by taking as reference the known rejected wind power time series of the reference year 2015. The parameter F
ct could then be expressed as:
where R is defined in Equation (2).
The above parameters calculated for each examined scenario are presented in
Table 2.
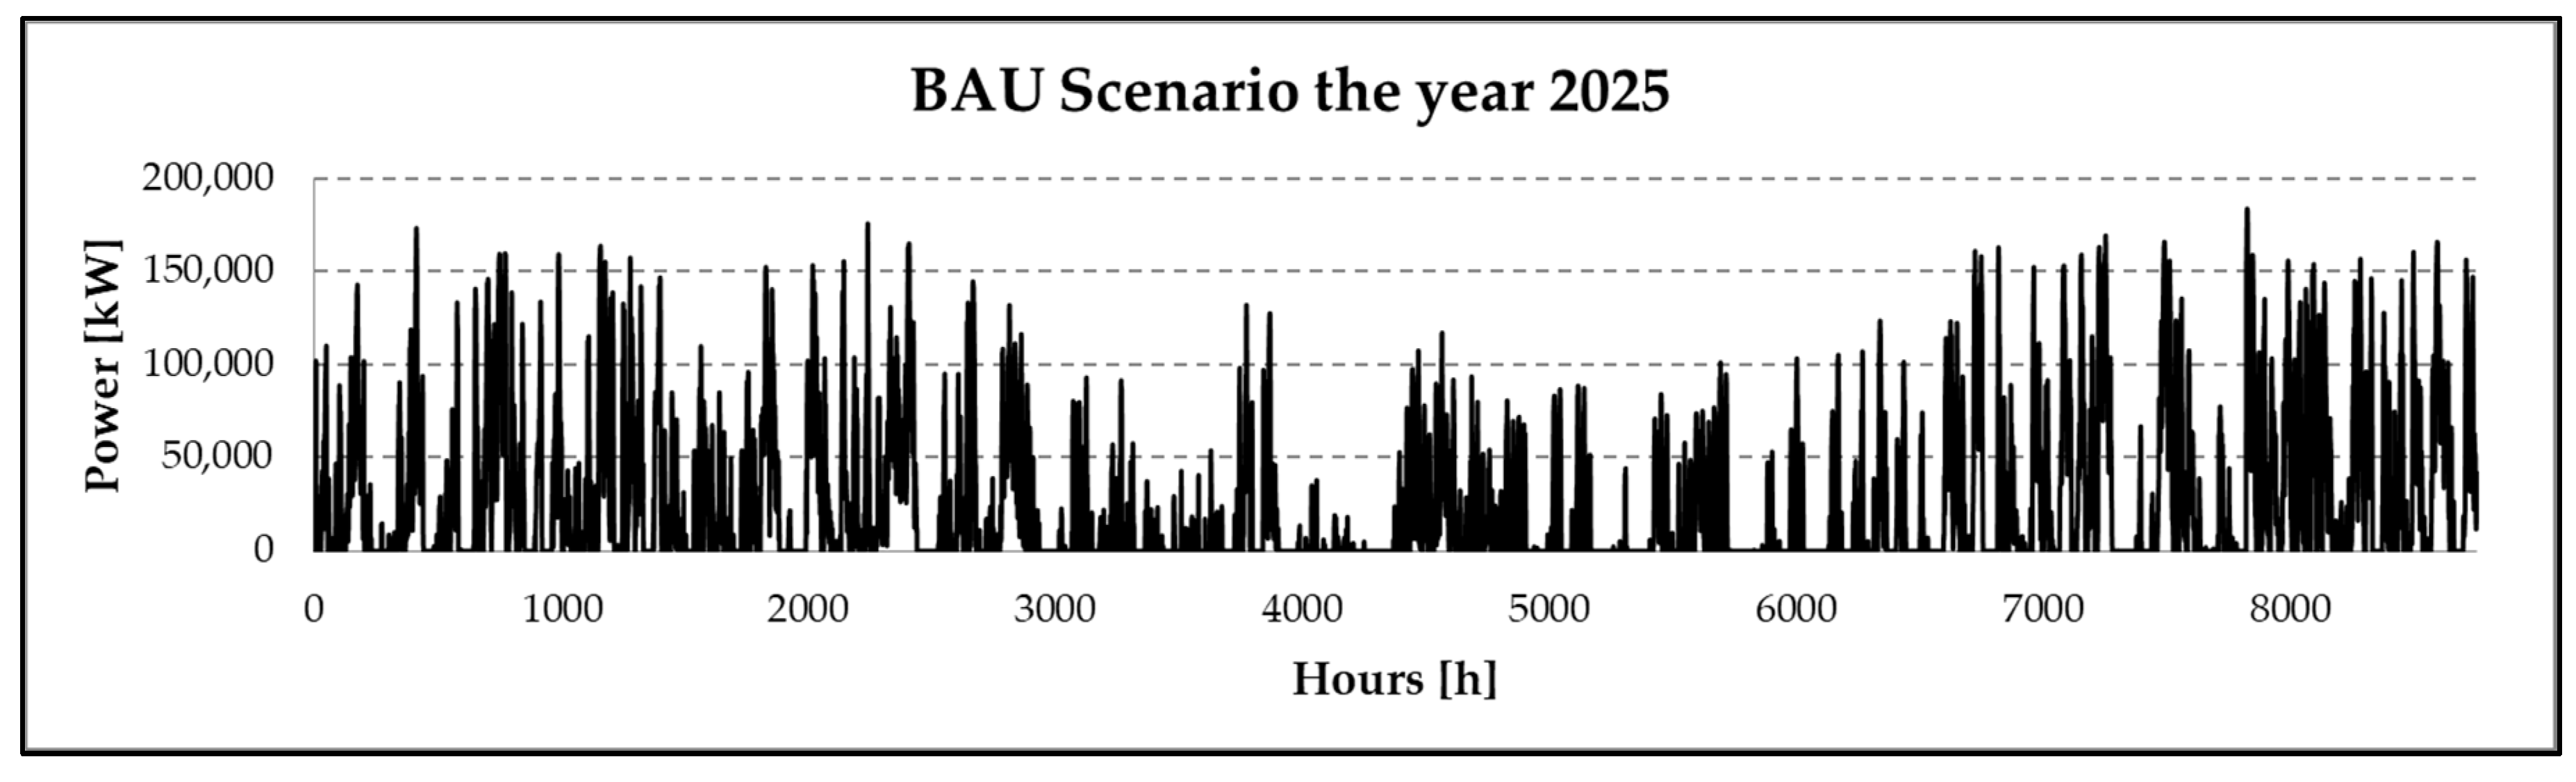
By applying the above algorithm to the known reference wind power rejection time series of the year 2015, the forecasting of the wind power rejection time series for the year 2025 can be produced. At the year 2025, the forecasted wind power rejection time series of the still autonomous power grid of Crete for the above under examination scenarios have been finally estimated as: 218,000 MWh, 205,000 MWh and 198,000 MWh for the Business as Usual, the OIL-GREEN and the GREEN-ADV scenarios respectively. In
Figure 3 the new time series for Business as Usual energy planning scenario is presented indicatively.
2.5. Pump Storage and Hydro Turbine Physical Operation Mathematical Background and Formulation
The main machinery of a PSP are its pumping and its hydro-turbine-generator sub systems. For the reservoir-pump-pipeline system of the proposed here PSP, the stored energy equation from the lower reservoir to the upper reservoir yields the total pump head
calculated by the relation:
where: H
0: is the static head i.e., the height difference between the two reservoirs [m]; Q: water flow rate [m
3/s]; k: the friction factor [dimensionless];
is the friction head i.e., the friction loss in the pipes [m] given by the equation bellow:
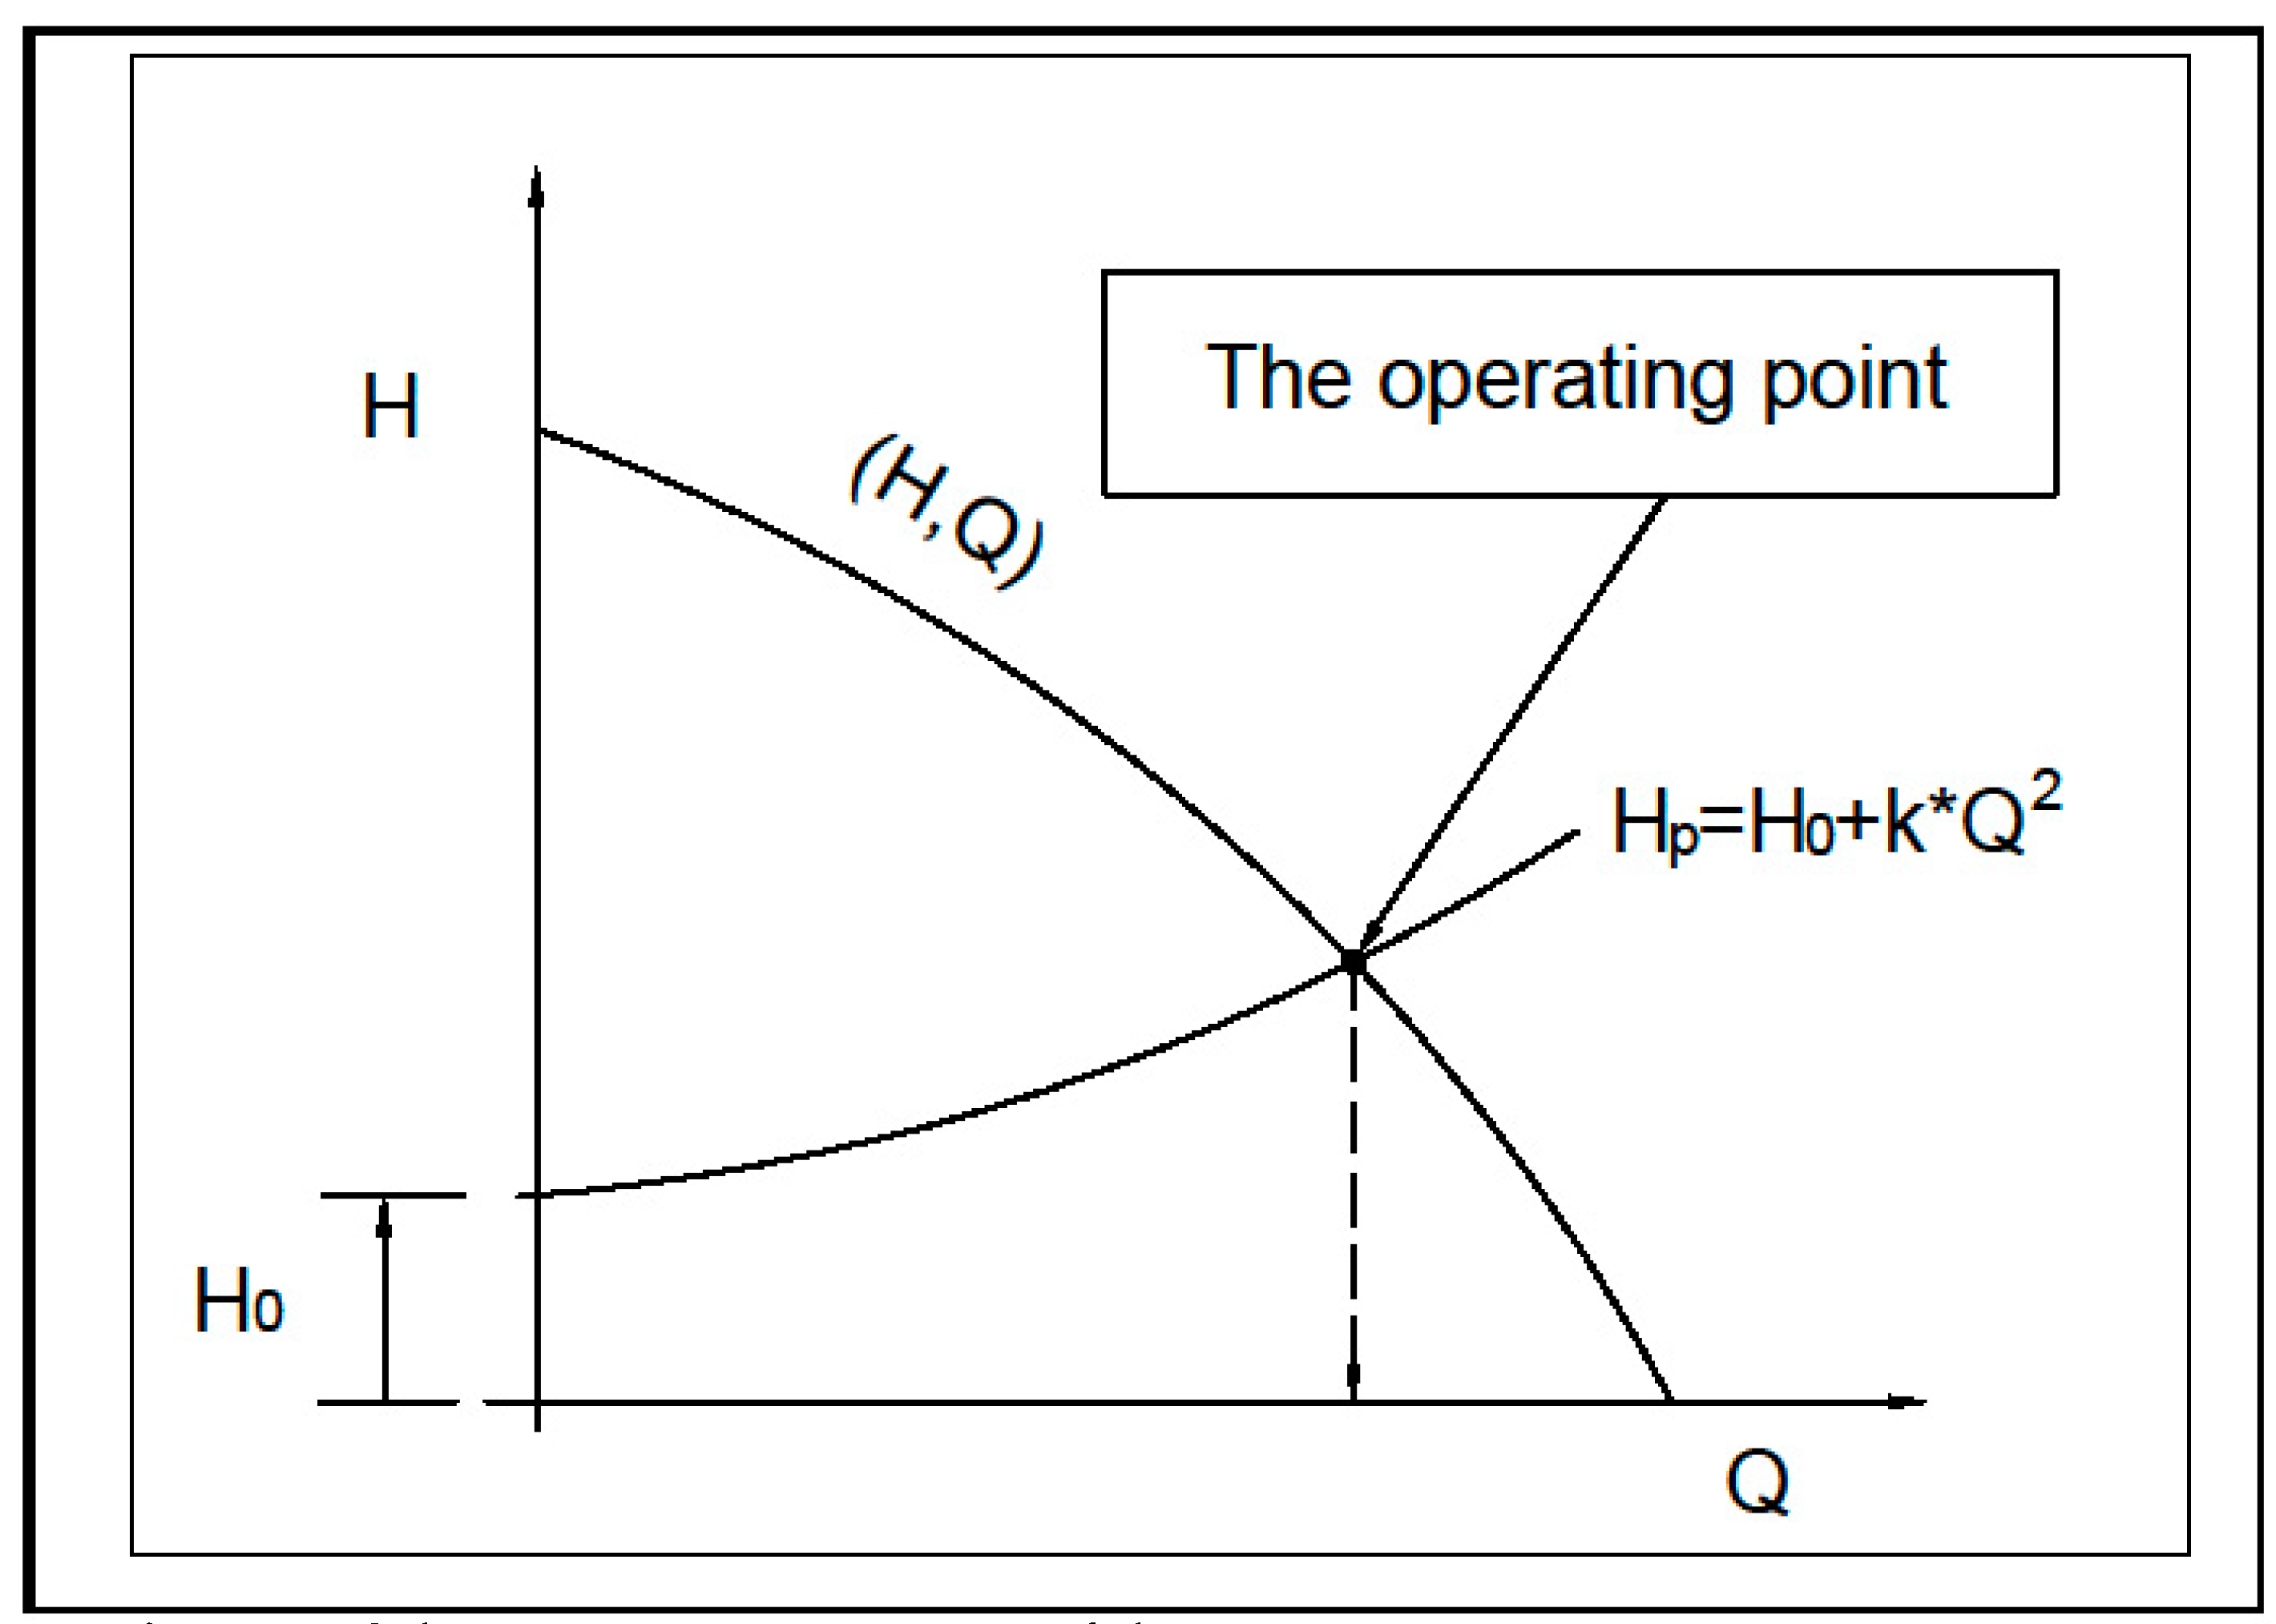
The centrifugal pump has an operational curve where the head falls gradually with the increase of the flow. This is called the pump’s characteristic curve, i.e., the hydraulic head H w.r.t. the flow rate Q. When a pumping system is installed in a PSP the effect can be illustrated graphically by superimposing the pump characteristic curve and the pump head curve. The pumping system operating point will be at the point where those two curves intersect (
Figure 4).
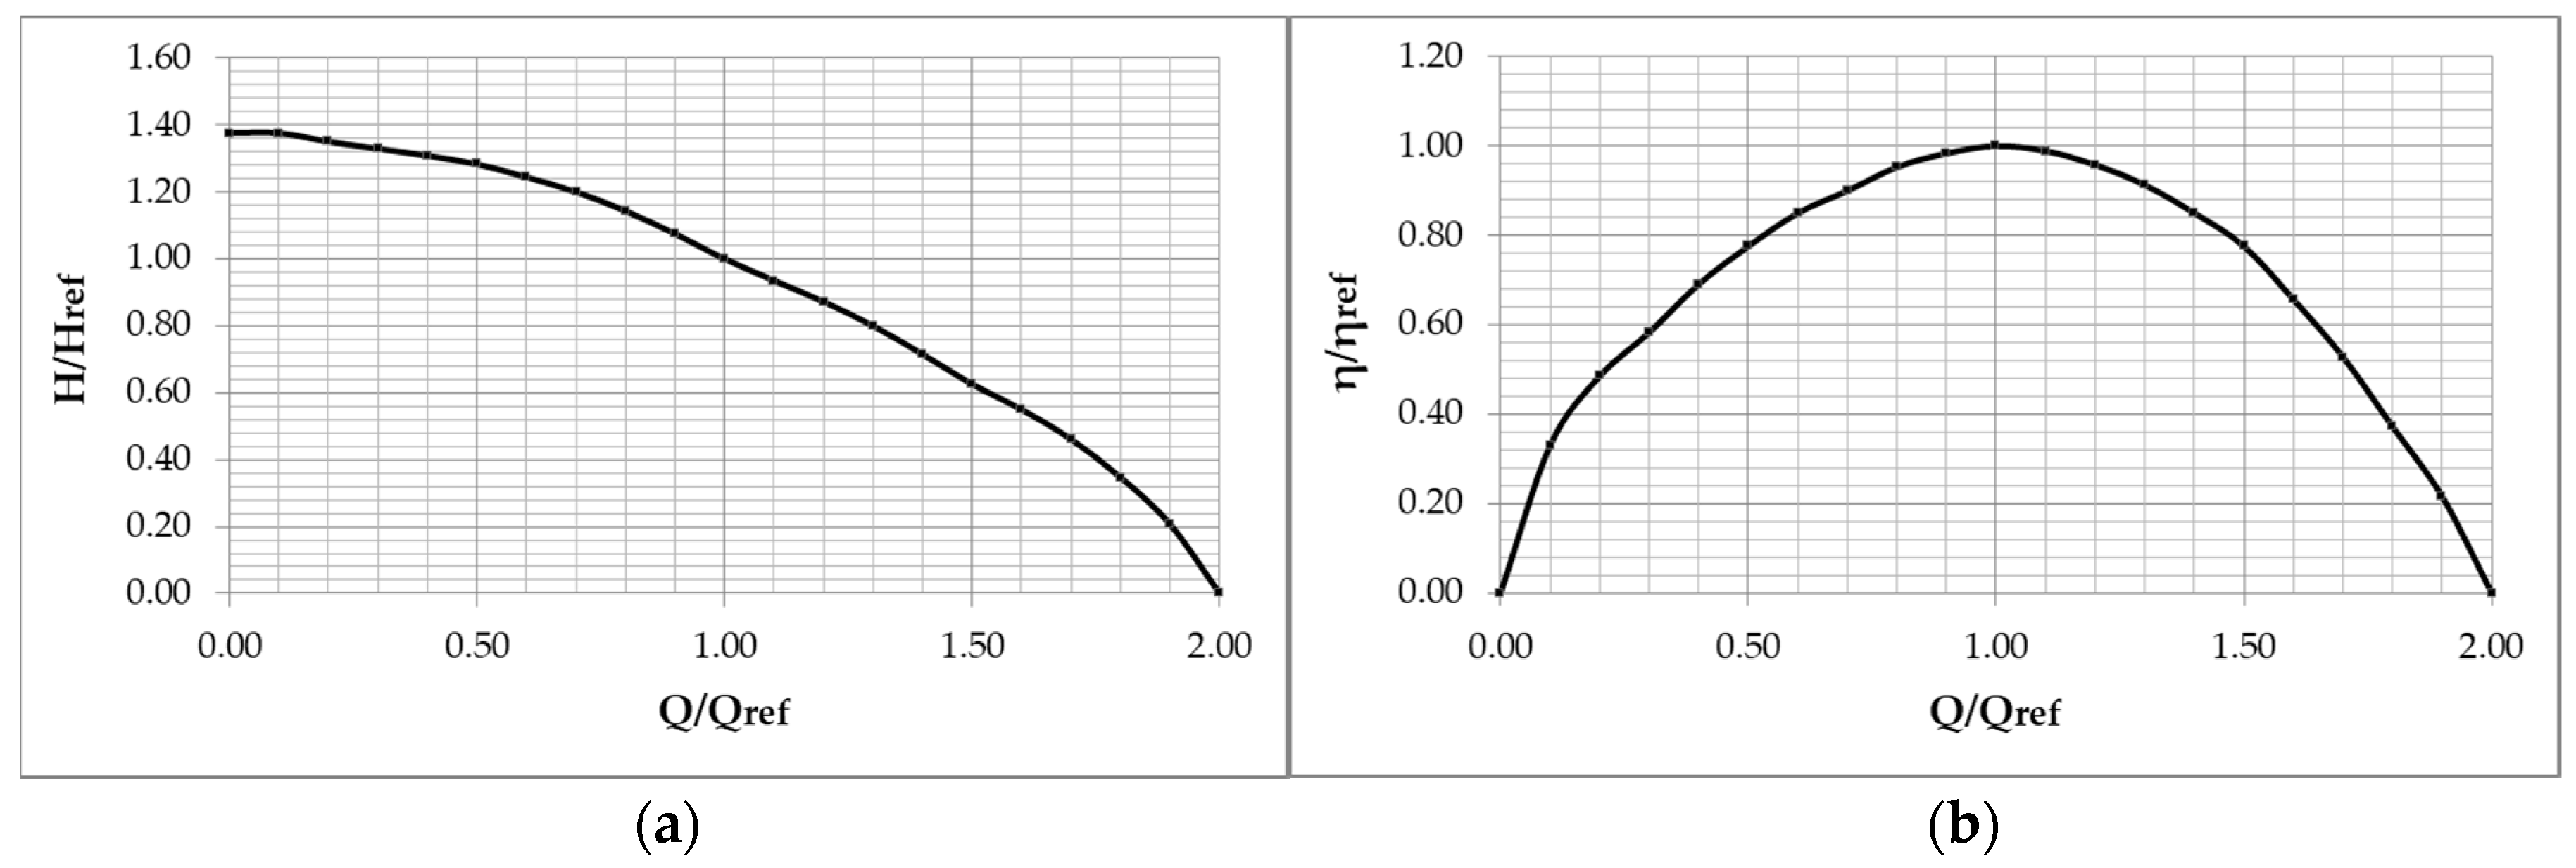
It is considered that the pump system installation usually consists of N pumps connected in parallel. The pumps parallel coupling is preferable because of the existing possibility of a significant variation in the water flow (Q) supply. In the pumping system characteristic curves the variables (H, Q, η) are inserted dimensionless with respect to the corresponding values of the nominal operating point (H
ref, Q
ref, η
ref), see
Figure 5 below. H is the hydraulic head, Q the water flow, and η the pump system efficiency.
The pump storage hydro station operation has been modeled by the equations below [
5,
20]. Each pump and each turbine unit are characterized by the corresponding efficiency curve. Given the electrical power at the terminals of the unit, the required water flow rate is calculated using the following equations, for the pumps and turbines units [
5]:
where:
power consumed by the pump [kW];
: power produced by the turbine [kW]; ρ: water density (×1000) [kg/m
3]; g: gravity acceleration [9.81 m/s
2]; Q: water flow rate [m
3/s]; H
0: is the height difference of the two reservoirs or static head [m]; η
pump: the pump efficiency; η
turb: the hydro turbine efficiency; η
el: the electrical machines efficiency (motor/generator).
The friction loss is also given by the more accurate Darcy–Weisbach formula below, which is the formula used in the present study:
where: f: a numerical friction factor [–]; L: length of pipe [m]; D: diameter of the water carrying pipe [m]; V: velocity of flow in pipe [m/s].
The numerical factor f is calculated by the Colebrook–White equation:
where: Re: is the Reynolds Number [–] and K
s is the Roughness Coefficient of the pipe [m] considered to be 1.5 × 10
−3 m in the present study case, as a typical value for steel pipes [
23].
Equation (9) may be rewritten in terms of the water flow rate as following:
Equations (9)–(11) have been incorporated in (7) and (8) for the hydropower calculation in the present study.
Regarding the operation of the here proposed PSP, the following alternatives of its operation are considered depending on the rejected wind power and the hydro turbine operation conditions and limitations:
If the rejected wind power PR is less than the minimum pumping power PPmin, the pumping station cannot operate and therefore the absorbed power is equal to zero. In that case, the PSP’s operator may choose to use a variable speed pump for small supply rates.
If the rejected wind power is greater than the maximum power that the pump can absorb, noted PPmax, then the pump operates at its full power of PPmax, so the difference (PR–PPmax) cannot be absorbed, thus this amount of rejected wind energy is not possible to be converted into hydraulic energy and it will be definitively lost. It should be noted that the maximum absorbed power of a steady speed pumping station is approximately equal to the one of variable speed and the slight difference between them is due to the increased losses of the Variable Speed Inverter.
At each time step δt [h] the rejected wind energy E
R [kWh] during each step is calculated as follows:
where: P
R is the rejected wind power [kW].
When this rejected wind energy is converted to hydraulic energy it will be equal to:
where Q
P [m
3/s] is the pumped water flow supplying the upper reservoir, representing also the ability (i.e., the pumping station capacity) to convert the rejected wind energy. Thus, the amount of water pumped δV [m
3] during each time step δt is equal to:
So, the following energy balance equation applies between the rejected wind energy and the part of it possible to be converted to hydraulic energy:
Specifically, the term “losses”, i.e., the amount of the rejected wind energy non-convertible in hydraulic energy (i.e., unable to be absorbed), taken into account in the hourly simulation for a whole year operation of the proposed PSP, is estimated as following:
Rejected wind energy amount that cannot be absorbed because the corresponding rejected wind power PR is less than the minimum PPmin of the pump station operational capacity.
Rejected wind energy amount that cannot be absorbed because the rejected wind power is greater than the maximum of the pump station operational capacity, so the difference (PR – PPmax) is not possible to be exploited (i.e., to be converted to hydraulic energy).
Rejected wind energy amount that cannot be absorbed in the case of a steady speed pump station due to the gradual shape of the absorbed power-pumped flow curve.
Rejected wind energy amount lost due to the hydraulic losses in the pipeline.
Rejected wind energy amount lost due to the power losses of the motor pump and of the inverter for the variable speed pump station.
The average values of the power losses of the transmission network are about 2%–4% [IEC document “Efficient Electrical Energy Transmission and Distribution” (2007)]. These losses compared to the gross energy consumption are considered negligible, thus they have not been taken into account in this study.
2.6. Mathematical Backgrund of the Economic Analysis and of the Viability Analysis of the Proposed PSP Investment
In order to apply the method of economics and the viability analysis of the proposed PSP, the following technical and economic data must be known [
20]:
Installed hydro turbines nominal power [MW].
Annual energy production estimation [MWh].
Total amount of investment (total project budget-CAPEX) [€].
Electric energy delivered to the power grid selling price [€/MWh].
Banking interest on loans and deposits [%].
Inflation [%].
Time period (total life) of the financial management [y].
Duration of the construction of the project [y].
Annual operating expenses (maintenance, insurance, salaries, depreciation etc. OPEX) [€/y].
The economic evaluation of each possible scenario for the proposed PSP realization in the present study is based on the two well-known and worldwide established financial indices of any investment’s financial and viability evaluation: The Net Present Value (NPV) and the Internal Return Rate (IRR).
The NPV is the difference between the present value of cash inflows and the present value of cash outflows over the whole life period of time of the investment. NPV is used in capital budgeting and investment planning to analyze the profitability of a projected investment or project.
The following formula is used to calculate the NPV [in €]:
where: Rt: the net cash inflow-outflows during a single period [€], which is calculated by Equation (17)
where: E
HT: is the annual energy produced by the hydro turbine-generators [MWh]; T: is the tariff (selling price) of the electricity produced by the hydro turbine-generators [€/MWh]; C
O&M: is the annual operating and management costs of the PSP [€], calculated by Equation (39); r: the discount rate or return that could be earned in the under evaluation alternative investments [%]; i: the number of time periods [y]; N: the lifetime of the investment [y]; C: the initial cost (i.e., the CAPEX) of the investment [€].
The decision rule of the NPV criterion for the evaluation of the investment is:
The IRR is a metric used in capital budgeting to estimate the profitability of potential investments. The internal rate of return is a discount rate that makes the net present value (NPV) of all cash flows from a particular project equal to zero. IRR calculations rely on a similar formula to NPV [
20].
The decision rule of IRR is:
For reasons of comparison, all the costs of the various scenarios of realization of the proposed PSP are expressed in relation to the dimensions and the size of the project in each trial for the optimal selection of its basic components–subsystems and of the project’s size, using the criteria of NPV and IRR presented above. All the following formulas of partial costs can be found in [
20].
Cost of the pumps:
where P
pump is the nominal power of pump and H
ref the nominal pump head.
Cost of the motor:
where P
m = 1.2 P
pump is the nominal power of the motor and the RPM = 1500 rotations per minute.
Cost of the inverter:
where P
inv = 1.25 P
m the power of inverter
Cost of the penstock:
where: C
M: Cost of the material:
where m is the mass of the material [kg]
C
E: Cost of the excavation:
where L is the length of penstock [m]
C
I: Cost of the installation:
Cost of the welding:
where:
C
SP: Cost of the surface protection:
Cost of the hydro turbine:
where P
T is the hydro-turbine nominal power [kW] and the H
T is the turbine head [m]
Cost of the grid connection:
Cost of the control systems:
Cost of the equipment transportation:
Cost of the road construction:
Cost of the licensing and consulting:
Cost of the substation construction:
Annual operating and management costs:
The above various partial cost formulas are used to calculate the investment CAPEX (see Equation (40)) introduced in the NPV and the IRR formulas in order to perform the annual PSP operation simulation and the investment evaluation simultaneously for each PSP realization scenario tested in this work.


